Dow Jones Sustainability Indices, Do They Make a Difference? The U.S. and the European Union Companies


1
College of Business, Western New England University, Springfield, MA 01119, USA
2
Gabelli School of Business, Roger Williams University, Bristol, RI 02809, USA
3
School of Health Administration, Texas State University, San Marcos, TX 78666, USA
4
Institute of Materials Resource Management, University of Augsburg, 86135 Augsburg, Germany
*
Authors to whom correspondence should be addressed.
†
All authors contributed to different part of this paper.
Sustainability 2020, 12(17), 6785; https://doi.org/10.3390/su12176785
Submission received: 18 July 2020
/
Revised: 13 August 2020
/
Accepted: 17 August 2020
/
Published: 21 August 2020
(This article belongs to the Section Economic and Business Aspects of Sustainability)
Abstract
:Sustainability and corporate social responsibility (CSR) strategies of companies delineate the health and the welfare of the communities across the globe. The two major goals of this study are (1) To explore the relationship between the environmental regulations, market value, and adoption of sustainability and CSR strategies of the publicly traded firms listed on the Dow Jones Sustainability Indices (DJSI) and (2) To examine the impact of being added to or deleted from DJSI per different market sectors for the firms in the U.S. and the European Union (EU). The selected starting window, the year 2015, for studying the impact of addition to or deletion from the DJS indices was the Paris Accord proposal by the EU and strict sustainability regulations of the EU versus the U.S. We used event study methodology and regression analyses to explain the cumulative abnormal returns utilizing firms’ characteristics and specific market sectors. In addition, the other focus of the study was on heavy (polluting) industries and investigating if the addition to or deletion of the firms in these industries from the sustainability indices had an impact on the market value. The findings of this study reveal no impact of the environmental rules and regulations on adopting sustainability and CSR strategies by either the EU or the U.S. firms. The novel findings of this study indicate a significant negative impact on the market value of firms in heavy industries, Energy, Basic Materials, and Utilities when added to the DJS indices. The study discusses the underlying reasons for these differences and proposes strategies to enhance the impact of addition to or deletion from the DISI to increase firms’ commitments to sustainability and CSR strategies and altering the attitudes of the investors.
1. Introduction
The Dow Jones Sustainability Index (DJSI) was launched in 1999 [1] with the merger of the Standard and Poors (S&P) Dow Jones Indices (DJI) and RobecaSAM (Sustainable Asset Management) [2] partially as an outcome of corporations and investors interested in the triple bottom line: economic, environmental, and social dimensions of sustainability [3]. The DJSI tracks hundreds of leading and publicly traded companies on the S&P Global 1200 Index and their subsets in different regions of the world and publishes an annual list of “Additions” while deleting companies from the previously published list.
In order to create these indices, DJSI focuses on three factors: the economic, social, and environmental performance of the selected companies [4]. The selected firms for the DJSI World are the top 10% of the 2500 largest firms in the S&P Global Broad Market Index (BMI) [4]. The DJS North America Composite Index and the Dow Jones Sustainability European Index consist of the top 20% highest-scoring firms along the measured sustainability dimensions in the selected industries [5,6].
In the past decade, the impact on the financial performance of the firms by being added to or deleted from the DJSI has been the focus of several studies (e.g., [7,8,9,10,11,12,13,14,15,16,17,18,19,20,21,22,23,24]). The results of these studies are not analogous. The relationship between the addition of the firm to the DJSI and the market value of the firm ranges from positive impact [18], negative impact [9,17], short-term negative impact [16], to no impact [13]. On the other hand, deletion from the DJSI has been shown to be related to a negative impact on the market value of the firm [16], short-term negative impact [18] and no impact [13]. The underlying reasons for such diverse results are attributed to specific markets (e.g., developed countries versus emerging countries) [7], the visibility of the firms [13], the type of investors [15], duration of staying on the addition list [11], environmental rules and regulations [20], and specific industry sector [21].
Governmental rules and regulations and visibility of the sustainability practices, specifically long-term commitment by the firms to sustainable operations, appear to be some of the factors that can influence the value of the firms positively [11,13,15]. The European Union firms are under one of the most rigorous environmental rules and regulations in place by the EU as evident in the European Union net-zero carbon emission goals by 2050 [25]. This study compares the EU versus the U.S firms that are added to or deleted from the DJSI during the years 2015–2018.
In addition, the research focuses on different sectors of the market and explores addition to or deletion to the DJSI and its impact on the value of the firms per each different market sector. This part of the research can shed light on the findings of some of the research in this area that indicate addition to or deletion from the sustainability indices can have a negative impact on the market value of the firms [10,17]. By investigating the impact of being added to or deleted from the sustainability indices per different market sector, this research attempts to explore the underlying causes of the negative impact on the market value of the firms associated with addition to or deletion from the sustainability indices.
2. Literature Review and Research Goals
2.1. Studies on DJSI
In the past decade, the impact on the financial performance of the firms by being added to or deleted from the DJSI has been the focus of several studies (e.g., Cheung [9]; Durand et al. [11]; Hawn et al. [13]; Robinson et al. [18]). Other studies have used different indices, such as Borsa Istanbul, Turkey (BIST) Sustainability Index [7,23] and the Saõ Paulo Stock Exchange Corporate Sustainability Index [19]. The results of these studies across different countries and utilizing different indices indicate a variety of findings.
Some studies have concentrated on the Asia Pacific markets (e.g., Chang et al. [8]; Cheung and Roca [10]). Chang et al. [8] investigated the factors that could influence CSR strategies and appearance on the DJSI list in the airline industry in western countries versus Asia-Pacific countries. The authors concluded that the airlines in the western countries showed more commitment to CSR strategies than the Asia Pacific studied countries [8].
Cheung and Roca [10] studied the impact of addition to or deletion from the Dow Jones Sustainability World Index for the companies from nine Asia Pacific countries over a period of four years. The authors, using event analysis, concluded that a week after the announcement to the addition list or being deleted from the index, there was a significant negative rate of abnormal return for firms and an increase in the volume of trading while idiosyncratic risk increased. However, there was no impact on the systematic risk for both the added and deleted firms [10].
The research by Lee et al. [15] investigated the impact on the market value of the South Korean companies that were added or deleted from the DJSI. The results of the study indicated a significant positive impact on the stock prices of the companies that were added to the DSJI [15]. In addition, the authors utilized the Korea Exchange and investigated the reaction of different classes of investors [15]. According to the results of the study, only the public sector investors had more awareness of the DJSI [15]. The authors concluded that government campaigns regarding sustainability had a limited impact on the Korean stock market [15].
Ates [7] studied the relationship between the market value and the firms listed on the BIST Sustainability Index by considering the size and profitability of the firms as mediating factors. The results of the study indicated a significant positive relationship between the investors in an emerging market and the appearance on a sustainability index independent of the size of the company [7]. In addition, the study found a negative relationship between low level of sustainability practices by the firm and the financial performance of the firm [7]. The author concluded that legislators needed to increase awareness of the investors and the firms about the sustainability practices and appearance on the sustainability indices [7].
Yilmaz et al. [23] also investigated the impact on the performance of the firms when added to or deleted from the BIST Sustainability Index. Their research found no significant impact on the performance of the firms, stock return or systematic risk when added or deleted from the BIST Sustainability Index [23]. The authors concluded that the lack of impact on stock return for the companies that were added to the sustainability index might be due to the belief by the investors that engagement in sustainability could create costs for the firms [23].
Santis et al. [19] studied the relationship between financial performance in regards to profitability and liquidity ratios of the Brazilian firms on the Saõ Paulo Stock Exchange Corporate Sustainability Index. The financial performance of these companies was compared with the other companies listed only on the Saõ Paulo Stock Exchange [19]. The findings of their research did not indicate any differences between the profitability and liquidity ratios of the studied companies on the two lists [19].
Other studies have concentrated on the European market (e.g., López et al. [16]; Oberndorfer et al. [17]; Gómez-Bezares et al. [12]). López et al. [16] studied the European firms that adopted socially responsible sustainability practices as indicated by their appearance on the DJSI compared to the ones that were on the Dow Jones Global Index but did not appear on the DJSI. The authors measured the value of the firms using accounting factors within a seven-year period (1998–2004) [16]. According to the results of their study, the firms on both indices over time did not indicate any positive impact on their performance measures [16]. However, the firms that appeared on the DJSI indicated a short-term negative impact on their performance measures, which disappeared over time [16].
Oberndorfer et al. [17] studied the appearance of German companies on the DJSI World and DJSI STOXX. The results of their event study indicated that there was a negative impact on the firm’s value appearing on the DJSI World versus DJSI STOXX [17]. The authors concluded that the negative impact on the firm’s value that appeared on the DJSI might be due to the fact that DJSI was a more visible index than the DJSI STOXX [17].
Gómez-Bezares et al. [12] studied the relationship between market returns and sustainability practices of British companies utilizing the Financial Times Stock Exchange Index over a period of six years. The authors conclude that the firms that invested in and practiced sustainability created higher long-term returns and enhanced the wealth of the shareholders [12].
Several studies have concentrated on the U.S. market (e.g., Cheung [9]; Robinson et al. [18]). Cheung [9] investigated the impact of addition to or deletion from the DJSI on the U.S. firms over a period of six years. The author utilized the event study methodology and examined the impact on stock return, risk, and liquidity [9]. The results of the study did not show any significant impact on stock prices, systematic risk, and liquidity except for the day that these companies were added to or removed from the DJSI [9].
The study by Robinson et al. [18], exploring the appearance on or removal from the DJSI for North American companies, concluded that there was a positive relationship between being added to the DJSI and the stock prices of these firms. In addition, their study indicated a short-term decrease (10 days) in the value of stocks of the firms removed from the DJSI [18].
Some studies explored firms across different counties that were listed on the DJSI (e.g., Hawn et al. [13]; Durnad et al. [11]). Hawn et al. [13], utilizing the DJSI World, conducted a longitudinal study over 17 years and investigated the relationship between the sustainability practices of firms and financial performance in 27 countries. The results of their study indicated that being added, deleted or continued on the DJSI list did not affect the investors’ reactions toward the firms [13]. However, the authors noted that the increase in the global valuation of sustainability practices might have an impact on the investors when the companies continued to be listed on the DJSI [13].
Durand et al. [11] expanded upon Hawn et al.’s [13] study and investigated the impact of being added, continuously listed, or deleted from the DJSI on the stock prices of the firms. The authors compared the stock value of these firms versus firms that had the same level of sustainability practices but not listed on the DJSI [11]. The results of the study indicated that being listed by the DJSI had no impact on stock prices, but there might be some long-term benefits due to the visibility of such firms [11].
Waddock and Graves [22], focusing on the S&P 500 firms, indicated that financial performance was linked to better corporate social performance since these companies invested more in socially responsible strategies. Meanwhile, Zhao and Murrell [24] argued that CSR strategies did not necessarily enhance the financial performance of the firms.
Some studies have considered factors other than the financial rate of return in investigating the CSR standing of the firms. Ioannou and Serafeim [14], in their study of the U.S. firms, linked sociological and environmental factors, such as a shift in the perception of the analysts regarding the firms’ investments to CSR, and proposed that such factors beyond the financial indicators could influence the CSR standing of the firm. Sharkey and Bromley [20] studied the U.S. public firms and pollution reduction strategies. The authors proposed that several factors, such as peer group rating, regulatory, and competitive environments needed to be considered for adoption of more socially responsible strategies by the firms [20].
Focusing on a particular industry and appearance on the DJSI, Su and Chen [21] studied the impact of addition to or deletion from the DJSI on the hospitality firms in North America versus non-hospitality firms. According to the results of their study, addition to the DJSI showed a longer positive impact on the stock returns of the hospitality firms when they appeared on the addition list and a longer negative impact on their stock returns when deleted from the DJSI [21]. Furthermore, other financial ratios, return on investment and total asset turnover indicated significant differences before being added or after being deleted from the DJSI [21]. The authors concluded that the financial performance of the hospitality firms was more susceptible to being added to or deleted from the DJSI than non-hospitality firms [21].
As evident by the reviewed literature, the relationship between addition to or deletion from the DSJI or other sustainability indices and the firm’s value indicates a variety of findings. These findings, in general, do not indicate a significant relationship between appearance on the DJSI or other sustainability indices and increase in the value of the firms [8,11,13]. Some studies have found a negative impact on the market value of the firms by appearing on the sustainability indices [10,17]. There are some indications that several factors, such as environmental rules and regulations [20], increase in global valuation of sustainability practices [8], or continued appearance [8,11,13] on the sustainability indices, may influence the market value of the listed firms.
2.2. Research Goals
As indicated by the reviewed studies, the impact on the market value of the firms by appearing on different sustainability and CSR indices, such as the DJSI, show inconsistent and contradictory results. Consequently, rather than examining a general relationship between addition to or deletion from the Dow Jones Sustainability indices and the firms market values, our study investigates this relationship in regards to two potential causal factors: specific market sectors and environmental rules and regulations as measured by the U.S. and EU indicators.
The goals of the research are presented below:
- (1)
- To explore the relationship between the environmental regulations, market value, and sustainability and CSR strategies of the publicly traded EU and U.S. firms listed on the Dow Jones Sustainability Indices (DJSI).
- (2)
- To examine the impact of addition to or deletion from DJSI per different market sectors and the valuation of the firms by the investors.
3. Materials and Methods
3.1. Selected Years, 2015–2018
The foundation for selecting the year 2015 as the starting year for exploring the relationship between appearing on the addition or deleted from the DJSI list was that the Paris Accord, the first global agreement addressing the climate change and the negative effect of greenhouse gases (GHG), was initiated in the year 2015 [26]. The combination of the Paris Accord and the European Union’s goal of achieving a net-zero carbon emission economy by the year 2050 [25] and the European Union Commission’s food waste goals [27], place the EU ahead of the other areas of the world as far as sustainability directives and the greening of different industries. In contrast, in 2016, the U.S. government declared leaving the Paris Accord and since 2016, several emission control standards in the U.S. have been eased. As a result, our study examines the relationship between addition to or deletion from the DJSI North America Composite, DJSI European, and DJSI World for the listed U.S. and the EU firms, starting with the year 2015 through the year 2018 as well as different market sectors.
3.2. Selected Companies
In order to explore these relationships, the selected data for this study included the top 10 (by market capitalization) U.S. and the EU firms on the DJS World, DJS North America Composite, and DJS European indices. The selected firms traded on the U.S. (NASDAQ, NYSE, OTC), and their price history (USD) for the years that they were added to or deleted from these indices were available. The event dates for the study were the announcement date of each addition to or deletion from the selected lists starting with the year 2015 through 2018. Within this period, on the addition list, there were 57 firms, 29 firms from the EU and 28 firms from the U.S. As for the deleted firms within the same period, there were 55 firms, 31 firms from the EU and 24 firms from the U.S. Table 1 presents the summary statistics utilized in this study. Table 2 and Table 3 present the addition and deletion of the EU and the U.S. firms between the years 2015–2018. In addition, Table 4 shows the market sectors of the utilized data for the selected firms.
As indicated in Table 1, the total firms on the added lists of DSJI were 57 while 55 firms were deleted from the lists within the studied years.
Table 2 provides the names of all those firms added to or deleted from the three indices. Most EU additions were from France (8) followed by German companies with addition of five representatives.
Table 3 presents the EU and the U.S. companies that were deleted from the list of the three indices within the selected years.
As shown in Table 3, the UK companies were deleted more than the firms from the other EU countries. For the U.S., Schlumberger Ltd. was deleted from the index in 2015 and 2017, but was readded in 2016 and 2018.
Table 4 shows the DJSI changes by the market sector by year.
As shown in Table 4, the energy and industrial sectors experienced the largest change with a loss of four for energy and also four for industrial companies on the index. Some sectors indicate more additions than deletions: Technology (3), Utilities (3), Consumer Defense (2), Financial Services (2), Healthcare (1), and Communication (1).
3.3. Event Study and Cumulative Abnormal Returns (CAR) Regression Methodology
Financial theories suggest that capital markets fully and quickly incorporate all available information into a firm’s stock price [28]. As such, we can identify the value of new information by examining the impact on the firm’s stock price upon the release of that information. Assuming no early leakage, information deemed beneficial by the market should result in positive abnormal stock returns when released [29]. Likewise, released information deemed harmful by the market should result in negative abnormal stock returns [30]. The event study is the methodology developed to investigate the presence of positive or negative abnormal stock returns around the release of new information regarding firms [11,13,15,31,32]. Following these studies, event study was utilized for analyzing the data in this research.
The event study is particularly useful for short-term horizon analysis [31]; although, some research has refined long-term forecasts as well [33]. The event study methodology uses a window prior to the event and estimates what the normal stock returns should be if the event had not happened. Subsequently, the event study evaluates how the stock responds once exposed to the event, which in this case is the listing on the DJSI. Often, prior windows are sized at 120 days [31].
In the event study methodology, an abnormal return is one that is attributed to the new information (i.e., the event). Abnormal returns are calculated by subtracting estimated returns that would have been earned in the absence of the event from the actual return earned in light of the event. The most frequently used method of estimating stock returns sans-event is the market model [34,35,36]. This model uses a stock’s correlation with a specific reference market to estimate the stock’s normal or expected return on and around the day of the event. Typically, event studies examine a small window around the event for abnormal returns [35,36]. These returns encompass daily abnormal returns (AR), average abnormal returns (AAR), cumulative abnormal returns (CAR), and cumulative average abnormal returns (CAAR).
In this study, the S&P 500 total return index was used as the reference market. The event analysis window was (−5, 5), meaning that cumulative abnormal returns were evaluated 5 days before the DJSI release up until 5 days afterwards. For each firm, stock performance and market model was estimated utilizing S&P 500 Total Return index over a 120-day period. Then, the three coefficients, alpha (risk-adjusted stock performance modeled as the intercept in regression), beta (a measure of risk and the slope of the regression equation), and sigma (a measure of the variation of the regression equation) were estimated to explicate the relationship between the stock and the S&P 500. The regression equation is shown in Equation (1).
In this equation, is the stock return of the ith firm, is the intercept (risk-adjusted performance), is the slope (risk), is the market return, and e is the error term.
While event studies provide information about stock returns relative to the market and possibly other indices and factors, regression using cumulative abnormal returns provides a more robust way to analyze additional variables specific to the stock returns in question [12,19]. In this study, we model cumulative abnormal returns for (−5, 5) as a function of Tobin’s Q (market value divide by asset value), total assets of the company, and leverage (debt to equity). Tobin’s Q is an estimation of the replacement value of the company, while total assets provide a measure of size. Furthermore, leverage provides an additional measure of financial health.
4. Results
4.1. EU versus US Event Study
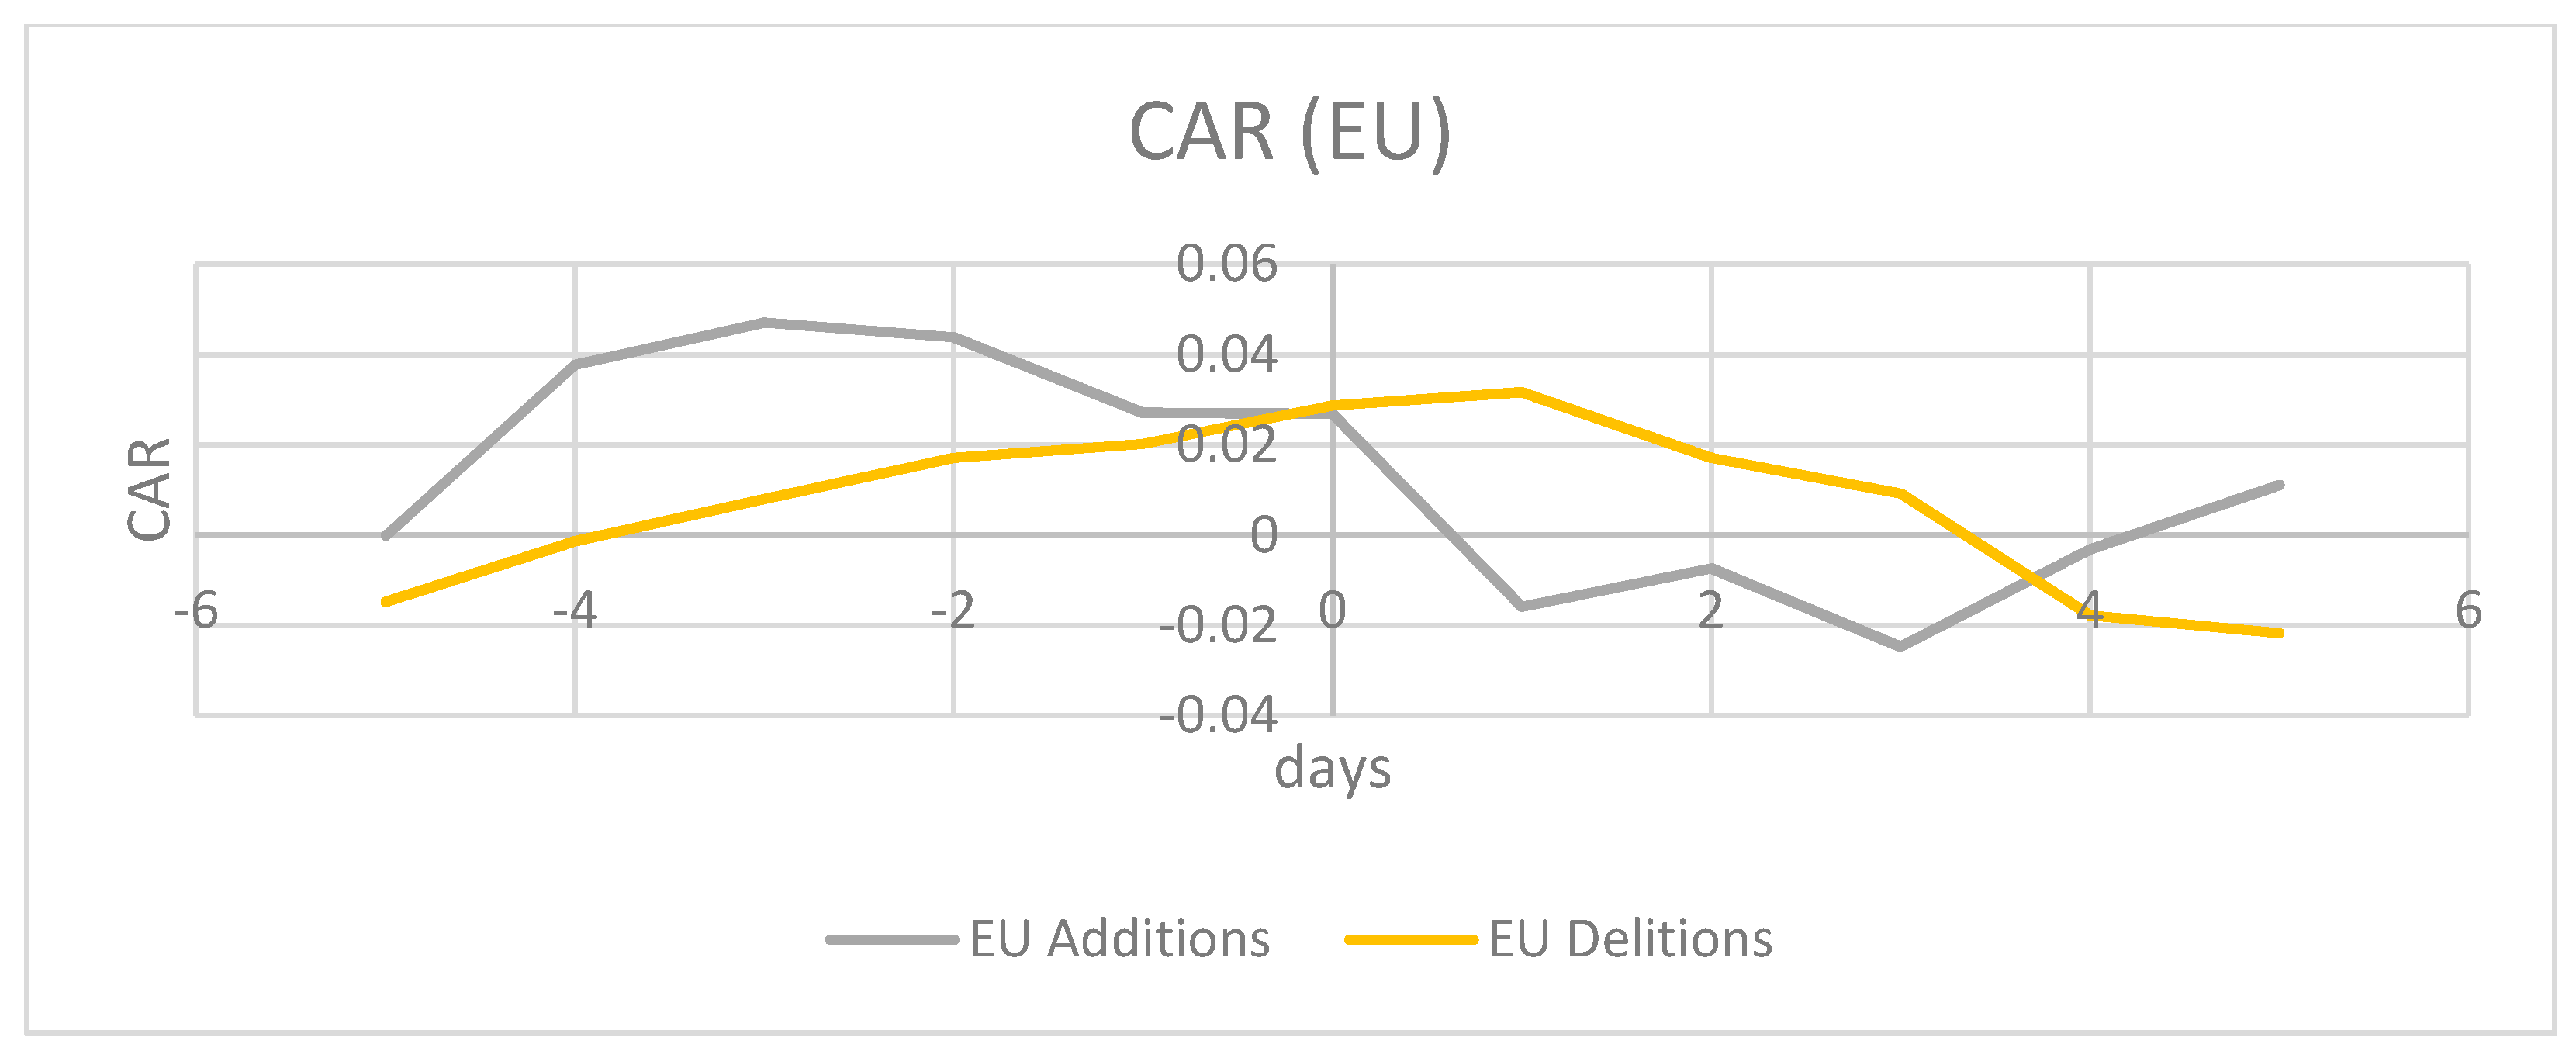
Table 5 and Figure 1 and Figure 2 present the results of daily cumulative abnormal returns for the U.S. and the EU firms for −5 before and 5 days after the announcement.
Figure 1 and Figure 2 present the results of the event study analysis for the U.S. (Figure 1) and EU (Figure 2) firms when added to or deleted from the DJSI for the years 2015–2018. Figure 1 and Figure 2 indicate the cumulative abnormal returns (CAR) for the U.S. and the EU firms using a symmetric five-day event window (−5, 5).
Based on the results presented in Table 5 and Figure 1, there is no statistically significant positive impact on stock returns for the U.S. firms when added to or deleted from the DJSI. These results support the findings of other studies [13,16,19,23] that have found no impact on the financial performance of the firms when added to or deleted from sustainability indices.
Table 5 and Figure 2 indicate evidence of small negative abnormal returns for addition and small positive effects for deletion for the EU firms. However, these effects are not statistically significant. Based on the results of the event study, addition to or deletion from the DJSI with the time-frame CAR (−5, 5) are not statistically significant for either the U.S. or the EU firms.
A major goal of this study was to explore if strict environmental rules and regulations entice investors to value sustainability and CSR practices of the firms. Based on the results of this study, there is no evidence that inclusion or exclusion from the DJSI results in statistically significant cumulative abnormal returns for the U.S. and the EU firms. Despite the stronger commitment to sustainability practices and stricter environmental rules and regulations of the EU, when the EU firms are compared to the U.S. firms, addition to or deletion from the DJS indices does not indicate any impact on the market value for the European firms. Overall, when examining the cumulative abnormal returns (CARs) of both sets of firms, the market does not seem to consider that sustainability and CSR practices impact a firm’s value positively or negatively for either the U.S. or the EU firms. The results of this study support the notion that government rules and regulations do not enhance engagement in sustainability activities [15].
4.2. Regression Analysis
In order to strengthen the results of the event study, regression models on the cumulative abnormal returns to evaluate other factors associated with the firm’s market performance were utilized as per other studies in this area [21,37]. In these models, the indicator variables included the EU (EU = 0) and the U.S. firms (U.S. = 1) and deletion (deletion = 0) and addition (addition = 1). The interaction terms for both indicator variables were examined utilizing CARs (0, 2) and CARs (−5, 5). Due to the panel structure, we added time fixed effects to the regression to account for the selected years, 2015–2018. The results of this part of the study are presented in Table 6.
For both CAR (0, 2) and CAR (−5, 5), only one indictor variable for the U.S. is weakly significant at 0.10 level as shown by (*) in Table 6. Based on these results, addition to or deletion from the DJSI does not appear to have an impact on cumulative abnormal return for either the U.S. or the EU firms. The results indicate that there is no difference between the U.S. and the EU firms (interaction variables) when they are added to or deleted from the DJSI within the studied time-periods. These results support the findings of the event study reported above.
4.3. Market Value and Market Sector Regression Analysis
Regression analysis was utilized to examine goal #2 of the research, the sector differences. Dependent variables included cumulative abnormal returns, CAR (0, 2) as well as the CAR (−5, 5). The dependent variables were regressed on the same set of independent variables used previously (Tobin’s Q, total assets of the company, and leverage). Indicator variables were used for different market sectors.
Selected market sectors are from the largest industries in the U.S. and the EU, Basic Materials, Energy, Utilities, and Industrial. According to the research, these market sectors are the most polluting industries. A study by Rehfeldt et al. [38] on the Basic Materials market sector, iron, steel, non-metallic, basic chemicals, pulp, and paper, indicates that the pollution by these sectors comprised 64% of the total industrial emission in the EU 28. The study by Fuji and Managi [37], based on data from the World Input-Output Database, shows that the heavy-polluting Industrial market sector produces the most carbon dioxide, methane, nitrous oxide, non-methane volatile organic compounds, and ammonia across the globe. Another study by Fuji and Managi [39] indicates that the relationship between gross domestic product (GDP) and sectoral carbon dioxide emissions are largely due to the fossil-fuel type. According to a study by Shen et al. [40], the cement industry is one of the main contributors to greenhouse gases (GHG), contributing 6–8% of carbon emissions, and its subsectors consume about 12–15% of industrial energy. As indicated by research, the selected market sectors for this study are heavy polluting industries.
Table 7 presents the results of this part of the analyses.
According to these results, there was no statistically significant impact of additions to or deletions from the DSJI on the aggregated overall selected sectors for the years 2015–2018. The statistically significant interaction variable indicated abnormal returns when added to or deleted from DJSI for certain market sectors. When added to the DJSI, Energy, Basic Materials, and Utlities indicated significant negative impact on cumulative abnormal return. These results included negative impacts for the Energy sector at 0.10 level for financial leverage and for interaction variable at 0.10 level for CAR (0, 2) as indicated by (*); for the Basic Materials, the interaction variable at 0.05 level for CAR (0, 2) as indicated by (**) and at 0.10 level as indicated by (*) for CAR (−5, 5); and for the Utilities the indicator at 0.10 level for CAR (0, 2) and 0.05 for CAR (−5, 5) as indicated by (**).
The notable finding of this study indicated in Table 7 was that when the companies in these market sectors were added to the DJSI, there was a statistically significant negative cumulative abnormal return for these firms as discussed above. The exception to these findings was the Utility sector since only one company in this sector was deleted from the DJSI, the impact on cumulative abnormal return was negative.
Table 8 presents the results of the heavy polluting sector.
Again, there is no overall effect. However, another notable finding of the study, as indicted by the results, is that there is a significant negative impact on abnormal returns at 0.10 level when a firm in the heavy industry group is added to the DJSI for CAR (0, 2) as indicated by (*). The stock prices are dropped by about 2%. The results support the findings of other studies that addition to the sustainability indices can have a significant negative impact on the market value of the firms [10,17,23].
5. Discussion
One of the major goals of the study was to examine if the market value of the firms was related to the environmental rules and regulations and adoption of sustainability and CSR strategies. The results of this study show that environmental rules and regulations do not appear to increase the value of the firms that adopt sustainability and CSR strategies. The European Union’s strict environmental rules and regulations do not entice investors to value the addition of the firms to the sustainability indices. In addition, the findings of the study indicate that the investors do not penalize the EU or the U.S. firms that are deleted from these indices. Furthermore, the differences in the environmental and sustainability policies and directives between the EU and the U.S. appear to have no influence on altering investors’ attitudes. Based on these findings, environmental rules and regulations do not appear to influence the investors’ valuation of the firms adopting sustainability practices, nor do the investors penalize the firms that do not adopt such strategies.
Another major goal of the study was to examine the impact of addition to or deletion from DJSI per different market sectors and the valuation of the firms by the investors.
A novel finding of this study is the significant relationship between a firm’s value, specific market sector, and the investor’s attitude towards sustainability and CSR practices by the firm. Based on the results of the study, investors penalize firms in certain market sectors (Energy, Basic Materials, and Utilities) that find themselves on the addition list of the DJS indecies.
The firms on the list for these sectors, and Energy (4), Basic Materials (3), and Utilities (3) indicate significant negative abnormal returns during the event window when appearing on the addition list of the DJS indices. Considering that these industries are heavy polluting industries, the findings of this study are alarming. A major factor that may explain the negative impact on a firm’s value in these specific market sectors when they appear on the addition list of the sustainability indices may be due to the perception of investors that commitment to and implementation of sustainability strategies are costly to the firms.
In order to increase the attention of investors to sustainability and CSR strategies of the firms and their importance in enhancing the health and the welfare of the communities and the greening of our planet, education and knowledge regarding such strategies are of the utmost importance. Sustainability practices can enhance the efficient use of resources, reduction of costs, and increase revenues for the firms. The oil spills and other lack of sustainability and CSR actions by the petroleum companies have resulted in disastrous impacts on the environment and costly lawsuits against them. The lawsuits against Total [41], Exxon [42], and British Petroleum [43] affected their market values at the time and resulted in tremendous financial losses to the companies. These are examples of the type of information that is needed to educate the public and investors.
Education of the public about the long-term and ultimate benefits of sustainability is a key factor in increasing the valuation of the companies investing in sustainability and CSR strategies. In addition, a responsibility to the health and welfare of the communities and the stakeholders of a firm can enhance the reputation of the firm and lessen the possibility of lawsuits against the firm.
6. Conclusions
Sustainability rules and regulations at the government and state levels are not as effective as when these regulations are decided at the community levels. To enhance the education and information of investors and other stakeholders to sustainability practices and their financial benefits, strategic alliance (public–private partnerships) among municipal agencies, academia, and firms are imperative. Future studies are needed to map such strategic alliances and partnerships to ensure implementation of sustainability and CSR strategies with the potential of conservation of resources, long-term success of the firms, and creation of healthy communities worldwide. In addition, market sector analyses due to the limited number of firms representing a particular sector in this study is a limitation that needs to be further researched. Furthermore, future research can concentrate on utilizing other DJS indices, such as DJSI Emerging Market, Korea, and Australia to examine the generalizability of the findings of this study.
Author Contributions
Conceptualization: B.S., M.T.; methodology: B.S., A.W.R.; software: B.S., A.W.R.; validation: L.F., A.W.R.; formal analysis: B.S., L.F., A.W.R.; investigation: M.T.; resources: M.T., L.F.; data curation: B.S., A.W.R.; writing—original draft preparation: B.S., M.T.; writing—review and editing: M.T., L.F., A.W.R.; visualization: M.T., L.F., A.W.R.; supervision & project administration: M.T., L.F., A.W.R. All authors have read and agreed to the published version of the manuscript.
Funding
This paper did not have funding.
Conflicts of Interest
The authors declare no conflict of interest.
References
- Searcy, C.; Elkhawas, D. Corporate sustainability ratings: An investigation into how corporations use the Dow Jones Sustainability Index. J. Clean. Prod. 2012, 35, 79–92. [Google Scholar] [CrossRef]
- RobecoSAM. 2018. Available online: https://www.robecosam.com/en/media/press-releases/2018/robecosam-publishes-the-sustainability-yearbook-2018.html (accessed on 27 June 2020).
- Elkington, J. Cannibals with Forks: The Triple Bottom Line of 21st Century Business; New Society Publishers: Gabriola Island, BC, Ganada, 1998. [Google Scholar]
- RobecoSAM. 2019. Available online: https://www.robecosam.com/csa/ (accessed on 27 June 2020).
- Dow Jones Sustainability North America Composite Index-S&P Dow Jones Indices. Available online: https://www.spglobal.com/spdji/en/indices/equity/dow-jones-sustainability-north-america-composite-index/#overview (accessed on 27 June 2020).
- Dow Jones Sustainability Europe Index-S&P Dow Jones Indices. Available online: https://www.spglobal.com/spdji/en/indices/equity/dow-jones-sustainability-europe-index/#overview (accessed on 27 June 2020).
- Ates, S. Membership of sustainability index in an emerging market: Implications for sustainability. J. Clean. Prod. 2020, 250, 119465. [Google Scholar] [CrossRef]
- Chang, D.-S.; Chen, D.-S.; Hsu, C.-W.; Hu, A.H. Identifying Strategic Factors of the Implantation CSR in the Airline Industry: The Case of Asia-Pacific Airlines. Sustainability 2015, 7, 7762–7783. [Google Scholar] [CrossRef] [Green Version]
- Cheung, A.W.K. Do Stock Investors Value Corporate Sustainability? Evidence from an Event Study. J. Bus. Ethics 2011, 99, 145–165. [Google Scholar] [CrossRef]
- Cheung, A.; Roca, E. The effect on price, liquidity and risk when stocks are added to and deleted from a sustainability index: Evidence from the Asia Pacific context. J. Asian Econ. 2013, 24, 51–65. [Google Scholar] [CrossRef] [Green Version]
- Durand, R.; Paugam, L.; Stolowy, H. Do investors actually value sustainability indices? Replication, development, and new evidence on CSR visibility. Strateg. Manag. J. 2019, 40, 1471–1490. [Google Scholar] [CrossRef]
- Gómez-Bezares, F.; Przychodzen, W. Corporate sustainability and shareholder wealth—Evidence from British companies and lessons from the crisis. Sustainability 2016, 8, 276. [Google Scholar] [CrossRef] [Green Version]
- Hawn, O.; Chatterji, A.K.; Mitchell, W. Do investors actually value sustainability? New evidence from investor reactions to the Dow Jones Sustainability Index (DJSI). Strateg. Manag. J. 2018, 39, 949–976. [Google Scholar] [CrossRef]
- Ioannou, I.; Serafeim, G. The impact of corporate social responsibility on investment recommendations: Analysts’ perceptions and shifting institutional logics. Strateg. Manag. J. 2015, 36, 1053–1081. [Google Scholar] [CrossRef] [Green Version]
- Lee, H.S.; Kim, I.; Hun, C. Who Values Corporate Social Responsibility in the Korean Stock Market? Sustainability 2019, 11, 5924. [Google Scholar] [CrossRef] [Green Version]
- López, M.V.; Garcia, A.; Rodriguez, L. Sustainable Development and Corporate Performance: A Study Based on the Dow Jones Sustainability Index. J. Bus. Ethics 2007, 75, 285–300. [Google Scholar] [CrossRef]
- Oberndorfer, U.; Schmidt, P.; Wagner, M.; Ziegler, A. Does the stock market value the inclusion in a sustainability stock index? An event study analysis for German firms. J. Environ. Econ. Manag. 2013, 66, 497–509. [Google Scholar] [CrossRef] [Green Version]
- Robinson, M.; Kleffner, A.; Bertels, S. Signaling Sustainability Leadership: Empirical Evidence of the Value of DJSI Membership. J. Bus. Ethics 2011, 101, 493–505. [Google Scholar] [CrossRef]
- Santis, P.; Albuquerque, A.; Lizarell, F. Do sustainable companies have a better financial performance? A study on Brazilian public companies. J. Clean. Prod. 2016, 133, 735–745. [Google Scholar] [CrossRef]
- Sharkey, A.J.; Bromley, P. Can Ratings Have Indirect Effects? Evidence from the Organizational Response to Peers’ Environmental Ratings. Am. Sociol. Rev. 2014, 80, 63–91. [Google Scholar] [CrossRef]
- Su, C.H.; Chen, C.D. Does sustainability index matter to the hospitality industry? Tour. Manag. 2020, 81. [Google Scholar] [CrossRef]
- Waddock, S.; Graves, S. The corporate social Perfromace-Financial perfromance link. Strateg. Manag. J. 1997, 18, 303–319. [Google Scholar] [CrossRef]
- Yilmaz, M.K.; Aksoy, M.; Tatoglu, E. Does the stock market value inclusion in a sustainability Index? Evidence from Borsa Istanbul. Sustainability 2020, 12, 483. [Google Scholar] [CrossRef] [Green Version]
- Zhao, X.; Murrell, A.J. Revisiting the corporate social performance-financial performance link: A replication of Waddock and Graves. Strateg. Manag. J. 2016, 37, 2378–2388. [Google Scholar] [CrossRef]
- EU. 2050 Long-Term Strategy. Available online: https://ec.europa.eu/clima/policies/strategies/2050_en/ (accessed on 27 June 2020).
- The Paris Agreement. Available online: https://climatefocus.com/sites/default/files/20151228%20COP%2021%20briefing%20FIN.pdf (accessed on 27 June 2020).
- EU. Food Waste. Available online: https://ec.europa.eu/food/safety/food_waste_en/ (accessed on 27 June 2020).
- Chung, D.Y.; Hrazdil, K.; Novak, J.; Suwanyangyuan, N. Does the large amount of information in corporate disclosures hinder or enhance price discovery in the capital market? J. Contemp. Account. Econ. 2019, 15, 36–52. [Google Scholar] [CrossRef]
- Chai, S.; Kim, M.; Rao, H.R. Firms’ information security investment decisions: Stock market evidence of investors’ behavior. Decis. Support. Syst. 2011, 50, 651–661. [Google Scholar] [CrossRef]
- Chan, W.S. Stock price reaction to news and no-news: Drift and reversal after headlines. J. Financ. Econ. 2003, 70, 223–260. [Google Scholar] [CrossRef]
- MacKinlay, A.C. Event Studies in Economics and Finance. J. Econ. Lit. 1997, 35, 13–39. [Google Scholar]
- Sorescu, A.; Warren, N.L.; Ertekin, L. Event study methodology in the marketing literature: An overview. J. Acad. Mark. Sci. 2017, 45, 186–207. [Google Scholar] [CrossRef]
- Kothari, S.P.; Warner, J.B. The econometrics of event studies. SSRN Electron. J. 2004. [Google Scholar] [CrossRef]
- Brown, S.J.; Warner, J.B. Measuring security price performance. J. Financ. Econ. 1980, 8, 205–258. [Google Scholar] [CrossRef]
- Brown, S.; Warner, J.B. Using daily stock returns: The case of event studies. J. Financ. Econ. 1985, 14, 3–31. [Google Scholar] [CrossRef]
- Campbell, J.Y.; Lo, A.W.; MacKinlay, A.C. Event-Study Analysis. In The Econometrics of Financial Markets; Princeton University Press: Princeton, NJ, USA, 1997; pp. 149–180. [Google Scholar] [CrossRef]
- Fuji, H.; Managi, S. Economic development and multiple air pollutant emissions from the industrial sector. Environ. Sci. Pollut. Res. 2016, 23, 2802–2812. [Google Scholar] [CrossRef]
- Rehfeldt, M.; Worrell, E.; Eichhammer, E.; Fleiter, T. A review of the emission reduction potential of fuel switch towards biomass and electricity in European basic materials industry until 2030. Renew. Sustain. Energy Rev. 2020, 120, 109672. [Google Scholar] [CrossRef]
- Fuji, H.; Managi, S. Which industry is greener? An empirical study of nine industries in OECD countries. Energy Policy 2013, 57, 381–388. [Google Scholar] [CrossRef] [Green Version]
- Shen, W.; Liu, Y.; Yan, B.; Wang, J.; He, P.; Zhou, C.; Huo, X.; Zhang, W.; Xu, G.; Ding, Q. Cement industry of China: Driving force, environment impact and sustainable development. Renew. Sustain. Energy Rev. 2017, 75, 618–628. [Google Scholar] [CrossRef]
- Renaud, J.; Bart, T. Oil Company Total Faces Historic Legal Action in France for Human Rights and Environmental Violations in Uganda. 2020. Available online: https://www.foei.org/news/total-legal-action-france-human-rights-environment-uganda (accessed on 27 June 2020).
- Dive, U. Fossil Fuels on Trial: New York’s Lawsuit Against Exxon Begins. Available online: https://oglinks.news/exxonmobil/news/fossil-fuels-trial-new-yorks-lawsuit-exxon-begins (accessed on 27 June 2020).
- Cruden, J.C.; O’Rourke, S.; Himmelhoch, S.D. The Deepwater Horizon oil spill litigation: Proof of concept for the manual for complex litigation and the 2015 amendments to the Federal Rules of Civil Procedure. Mich. J. Environ. Adm. Law 2016, 6, 65. [Google Scholar]
Figure 1.
Additions and deletions of the U.S. firms: Dow Jones sustainability indices (DJSI), 2015–2018.
Figure 1.
Additions and deletions of the U.S. firms: Dow Jones sustainability indices (DJSI), 2015–2018.
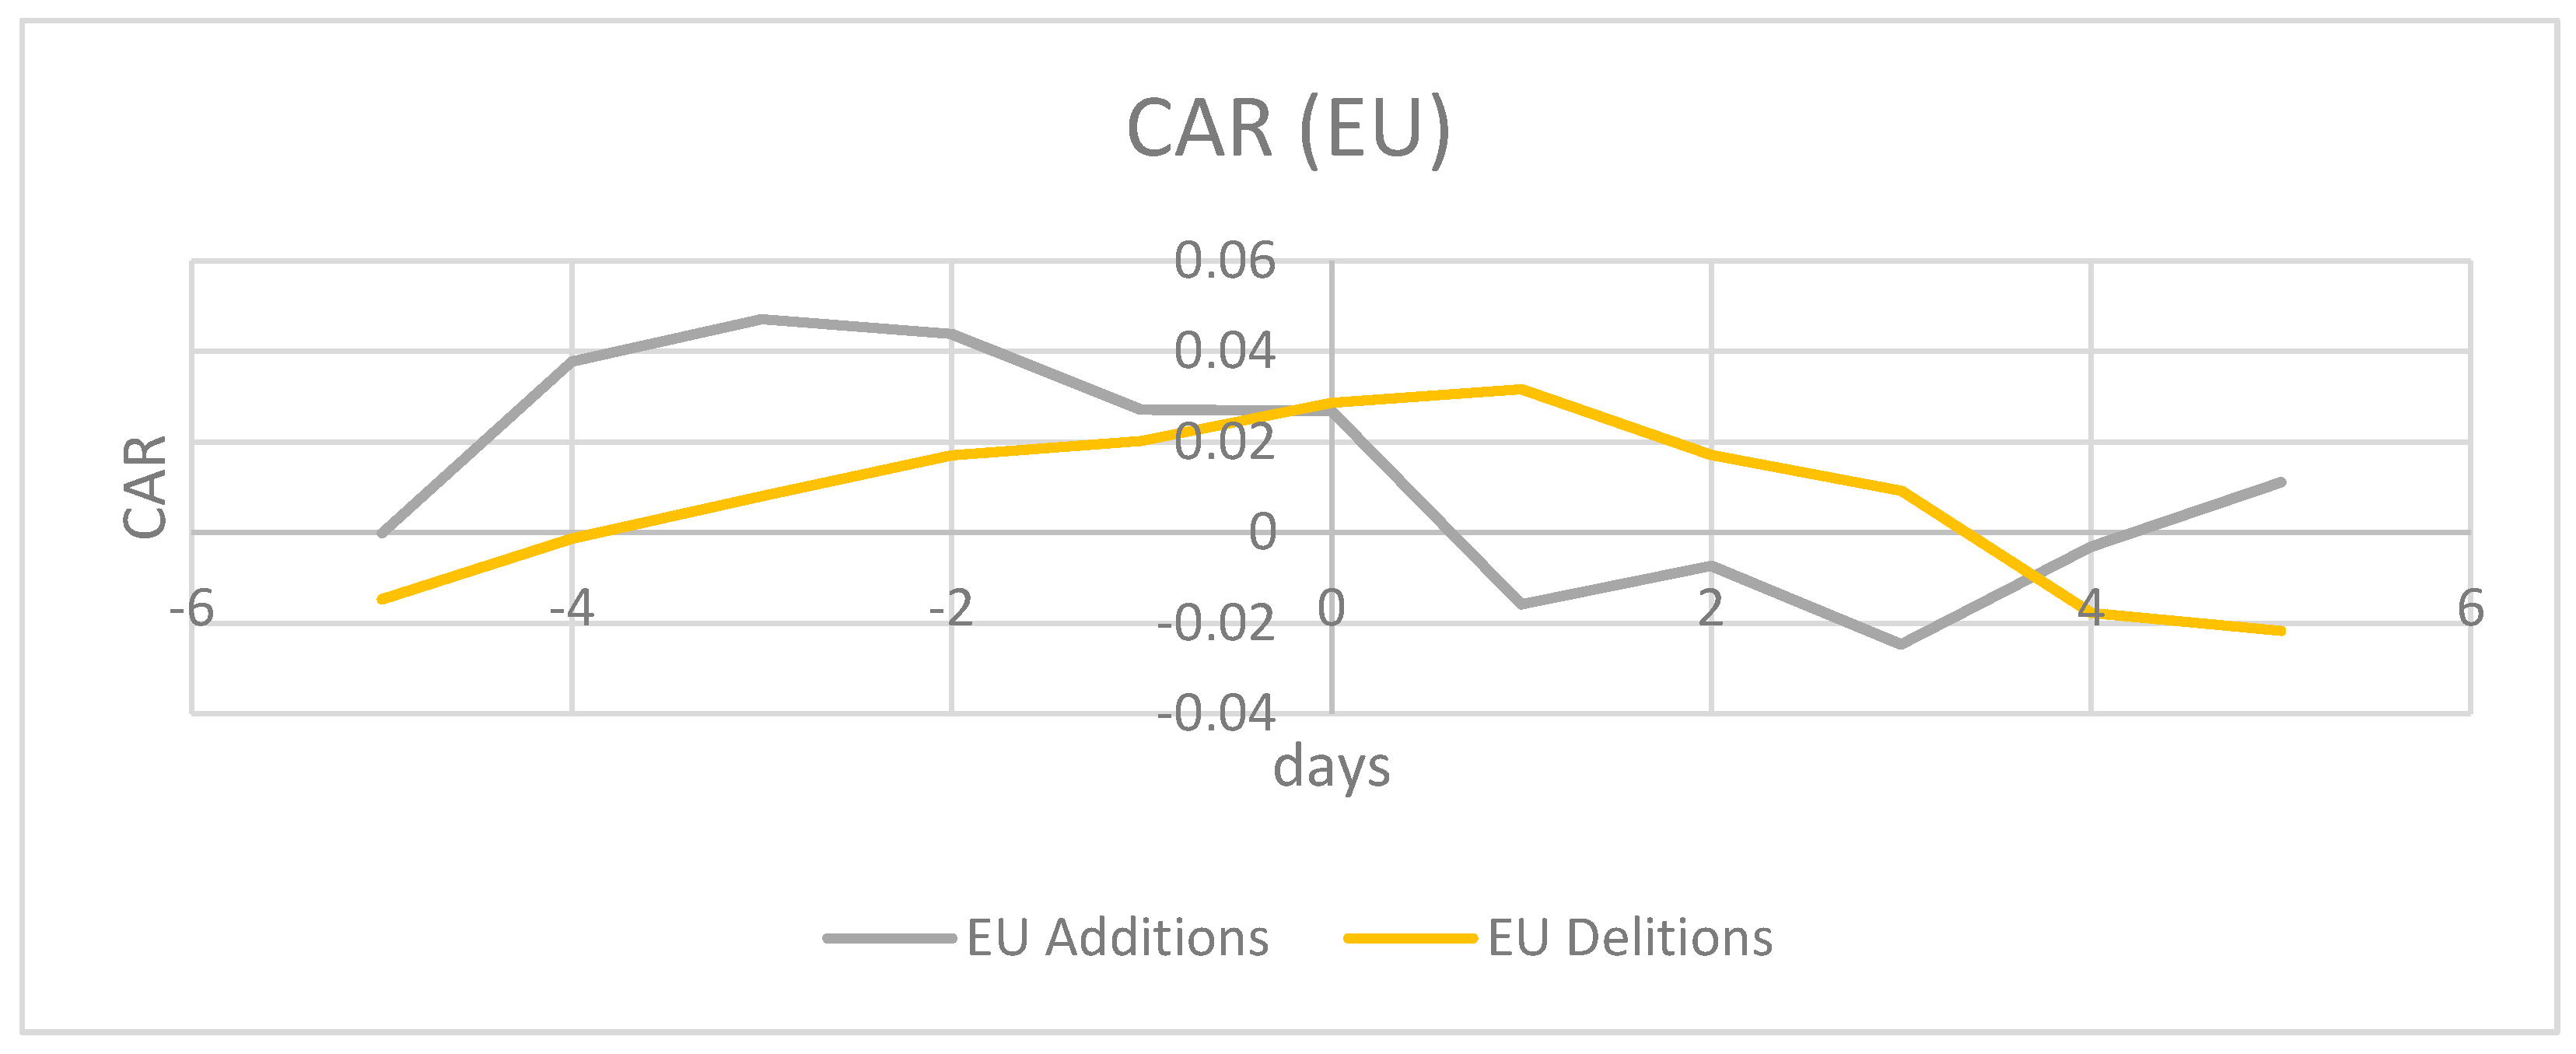
Figure 2.
Additions and deletions of the EU firms: DJSI, 2015–2018.

Table 1.
Summary statistics of the utilized data from 2015–2018: The EU and the U.S. companies listed on the three indices.
Table 1.
Summary statistics of the utilized data from 2015–2018: The EU and the U.S. companies listed on the three indices.
| Additions—Number of Firms | Deletions—Number of Firms | ||||||
|---|---|---|---|---|---|---|---|
| Year | EU | U.S. | Total | Year | EU | U.S. | Total |
| 2015–2018 | 29 | 28 | 57 | 2015–2018 | 31 | 24 | 55 |
| 2015 | 8 | 6 | 14 | 2015 | 7 | 7 | 14 |
| 2016 | 8 | 7 | 15 | 2016 | 5 | 6 | 11 |
| 2017 | 6 | 7 | 13 | 2017 | 10 | 6 | 16 |
| 2018 | 7 | 8 | 15 | 2018 | 9 | 5 | 14 |
Table 2.
The list of the EU and the U.S. companies on the addition list of the World, North America Composite, and the European Dow Jones sustainability (DJS) indices.
Table 2.
The list of the EU and the U.S. companies on the addition list of the World, North America Composite, and the European Dow Jones sustainability (DJS) indices.
| EU Additions | 2015 | U.S. Additions |
| BNP Paribas SA France | General Motors Co | |
| Societe Gernerale SA France | Goldman Sachs | |
| Sanofi France | Bristol-Myers Squibb Co | |
| Vinci SA France | Ecolab Inc | |
| GDF Suez France | Bank of America Group | |
| Deutsche Telecom Germany | Proctor and Gamble Co | |
| Telefonica SA Spain | ||
| BHP Billiton PLC UK | ||
| EU Additions | 2016 | U.S. Additions |
| Novo Nordisk A/S Denmark | PepsiCo Inc | |
| Nokia OYJ Finland | Merck and Co Inc | |
| TOTAL SA France | Allergan Plc | |
| Essilor Intl SA France | Schlumberger Ltd. | |
| Henkel AG and Co Germany | Adobe Systems Inc | |
| E.ON SE Germany | Cisco Systems Inc | |
| Iberdrola SA Spain | Reynolds American Inc | |
| Royal Dutch Shell Plc. Netherlands | ||
| EU Additions | 2017 | U.S. Additions |
| Capgemini SA France | Visa Inc | |
| Henkel AG and Co Germany | Cigna Corp | |
| Compass Group Plc. UK | Comcast Corp | |
| CRH Plc. Ireland | AT and T Inc | |
| ASML Holding NV Netherlands | Altria Group Inc | |
| British American Tobacco UK | General Motors Co | |
| Colgate-Palmolive Co | ||
| EU Additions | 2018 | U.S. Additions |
| Siemens AG Germany | MasterCard Inc | |
| STMicoelectronics Italy | Johnson and Johnson | |
| Assicurazioni Generali Italy | Schlumberger Ltd. | |
| Banco Bilbao Spain | Salesforce.com Inc | |
| Essily AB Sweden | Anthem Inc | |
| RELX Plc. UK | General Mills Inc | |
| Diageo Plc. UK | Sempra Energy | |
| Waste Management Inc |
Table 3.
The list of the EU and the U.S. companies that were deleted from the World, North America Composite, and the European DJS indices.
Table 3.
The list of the EU and the U.S. companies that were deleted from the World, North America Composite, and the European DJS indices.
| EU Deletions | 2015 | U.S. Deletions |
| Novo Nordisk A/S Denmark | United Technologies Corp | |
| Total SA France | Ford Motor Co | |
| Siemens Germany | PepsiCo Inc | |
| Henkel AG and Co Germany | Air Products and Chemical Inc | |
| UniCredit SPA Italy | Schlumberger Ltd. | |
| Diageo Plc UK | Waste Management Inc | |
| Experian Plc | UK | |
| EU Deletions | 2016 | U.S. Deletions |
| Eni SpA Italy | EMC Corp | |
| Banco Bilbao Spain | Target Corp | |
| WPP Plc UK | Spectra Energy Corp | |
| ARM Holdings Plc UK | Allstate Corp | |
| BT Group Plc UK | Halliburton Co | |
| British American Tobacco UK | Baker Hughes Inc | |
| Exxon Mobil Corp | ||
| Intl Corp | ||
| EU Deletions | 2017 | U.S. Deletions |
| Novo Nordisk A/S Denmark | Johnson and Johnson | |
| Sanofi France | Cardinal Health Inc | |
| Vinci SA France | Schlumberger Ltd. | |
| Cie Generale des Est France | Halliburton Co | |
| BASF SE Germany | Autodesk Inc | |
| E. ON SE Germany | Waste Management | |
| BAE Systems Plc UK | ||
| Recitt Benckiser Gr UK | ||
| Rio Tinto Plc UK | ||
| RELX Plc UK | ||
| EU Deletions | 2018 | U.S. Deletions |
| BNP Paribas SA France | PepsiCo Inc | |
| Dassault Systems Se France | Morgan Stanley | |
| BASF AG Germany | Merck and Co | |
| Henke AG and Co Germany | Humana Inc | |
| Telefonica SA Spain | Altria Group Inc | |
| Barclays Plc UK | ||
| Anglo American Plc UK | ||
| Compass Group Plc UK |
Table 4.
The market sectors of the utilized data for the companies on the additions list and deleted from the three indices, 2015–2018.
Table 4.
The market sectors of the utilized data for the companies on the additions list and deleted from the three indices, 2015–2018.
| Additions—Market Sectors | Total = 57 | Deletions—Market Sectors | Total = 55 |
|---|---|---|---|
| Industrials | 3 | Industrials | 7 |
| Basic Materials | 3 | Basic Materials | 5 |
| Financial Services | 8 | Financial Services | 6 |
| Technology | 7 | Technology | 4 |
| Consumer Defense | 11 | Conumser Defense | 9 |
| Consumer Cyclical | 3 | Consumer Cyclical | 3 |
| Healthcare | 9 | Healthcare | 8 |
| Energy | 4 | Energy | 8 |
| Communication Services | 5 | Communication Services | 4 |
| Utilities | 4 | Utilities | 1 |
Table 5.
Results of daily cumulative abnormal return for the U.S. and the EU firms (−5, 5).
| U.S. Additions | U.S. Deletions | EU Additions | EU Deletions | |
|---|---|---|---|---|
| n = 29 | n = 25 | n = 22 | n = 34 | |
| Day | Cumulative Abnormal Return | |||
| −5 | −0.0182475 | −0.0208032 | −0.0001171 | −0.0147359 |
| −4 | 0.0125626 | −0.0101438 | 0.0377317 | −0.0013163 |
| −3 | −0.0036320 | −0.0364558 | 0.0471392 | 0.0080623 |
| −2 | 0.0059064 | −0.0387933 | 0.0438605 | 0.0170888 |
| −1 | 0.0055572 | −0.0705078 | 0.0270714 | 0.0202253 |
| 0 | 0.0011186 | −0.1069450 | 0.0268761 | 0.0286871 |
| 1 | 0.0228153 | −0.1385233 | −0.0158339 | 0.0316696 |
| 2 | 0.0241182 | −0.1283157 | −0.0073473 | 0.0171266 |
| 3 | −0.0051642 | −0.1448410 | −0.0247007 | 0.0092496 |
| 4 | −0.0229824 | −0.1362925 | −0.0031249 | −0.0177682 |
| 5 | −0.0141983 | −0.1451793 | 0.0110849 | −0.0217336 |
Table 6.
Regression analysis indicating cumulative abnormal returns for the EU and the U.S. firms.
| Variables | CAR (0, 2) Estimate | p Value | CAR (−5, 5) Estimate | p Value |
|---|---|---|---|---|
| Log (Total Assets) | 0.001 | 0.550 | 0.006 | 0.139 |
| Return on Assets | 0.029 | 0.312 | 0.015 | 0.779 |
| Market to Book | 0.000 | 0.649 | 0.000 | 0.638 |
| Financial Leverage | 0.000 | 0.398 | 0.000 | 0.560 |
| Tobin’s Q | −0.003 | 0.304 | 0.000 | 0.913 |
| Indictor (Addition = 1) | −0.005 | 0.360 | 0.005 | 0.634 |
| Indicator (U.S. = 1)) | 0.012 * | 0.066 | 0.007 | 0.531 |
| Interaction Variable (U.S. = 1) × (Addition = 1) | 0.003 | 0.761 | −0.017 | 0.291 |
Table 7.
Regression models for cumulative abnormal returns (CARs) for different market sectors when added to or deleted from DJSI, 2015–2018.
Table 7.
Regression models for cumulative abnormal returns (CARs) for different market sectors when added to or deleted from DJSI, 2015–2018.
| Variables | CAR (0, 2) Estimate | p Value | CAR (−5, 5) Estimate | p Value |
| Log (Total Assets) | 0.003 | 0.18 | 0.006 | 0.15 |
| Return on Assets | 0.014 | 0.65 | 0.001 | 0.98 |
| Market to Book | 0.000 | 0.27 | 0.000 | 0.61 |
| Financial Leverage | −0.001 * | 0.10 | −0.001 | 0.50 |
| Tobin’s Q | −0.001 | 0.72 | −0.001 | 0.78 |
| Indictor (Addition = 1) | −0.001 | 0.77 | −0.002 | 0.84 |
| Indicator (Energy. = 1)) | 0.008 | 0.39 | −0.003 | 0.87 |
| Interaction Variable (Energy = 1) × (Add. = 1) | −0.028 * | 0.06 | −0.017 | 0.54 |
| Variables | CAR (0, 2) Estimate | p Value | CAR (−5, 5) Estimate | p Value |
| Log (Total Assets) | 0.003 | 0.26 | 0.006 | 0.15 |
| Return on Assets | 0.010 | 0.72 | 0.011 | 0.84 |
| Market to Book | 0.000 | 0.31 | 0.000 | 0.72 |
| Financial Leverage | −0.001 | 0.11 | 0.000 | 0.63 |
| Tobin’s Q | −0.001 | 0.78 | −0.001 | 0.90 |
| Indictor (Addition = 1) | −0.004 | 0.42 | −0.003 | 0.73 |
| Indicator (Industrials. = 1)) | −0.001 | 0.92 | 0.005 | 0.76 |
| Interaction Variable (Industrials = 1) × (Add. = 1) | −0.004 | 0.83 | 0.009 | 0.78 |
| Variables | CAR (0, 2) Estimate | p Value | CAR (−5, 5) Estimate | p Value |
| Log (Total Assets) | 0.002 | 0.31 | 0.005 | 0.21 |
| Return on Assets | 0.007 | 0.79 | 0.006 | 0.91 |
| Market to Book | 0.000 | 0.32 | 0.000 | 0.76 |
| Financial Leverage | −0.001 | 0.10 | 0.000 | 0.65 |
| Tobin’s Q | −0.001 | 0.76 | −0.001 | 0.85 |
| Indictor (Addition = 1) | −0.001 | 0.75 | 0.002 | 0.85 |
| Indicator (Basic Mat. = 1)) | 0.011 | 0.32 | 0.028 | 0.16 |
| Interaction Variable (Basic Mat. = 1) × (Add. = 1) | −0.035 ** | 0.05 | −0.058 * | 0.07 |
| Variables | CAR (0, 2) Estimate | p Value | CAR (−5, 5) Estimate | p Value |
| Log (Total Assets) | 0.003 | 0.25 | 0.004 | 0.36 |
| Return on Assets | 0.013 | 0.64 | 0.008 | 0.88 |
| Market to Book | 0.000 | 0.35 | 0.000 | 1.00 |
| Financial Leverage | −0.001 | 0.15 | 0.000 | 0.89 |
| Tobin’s Q | −0.001 | 0.72 | −0.003 | 0.56 |
| Indictor (Addition = 1) | −0.005 | 0.25 | −0.001 | 0.86 |
| Indicator (Utilitiies = 1)) | −0.058 ** | 0.01 | −0.085 ** | 0.04 |
| Interaction Variable (Utilities = 1) × (Add. = 1) | 0.063 ** | 0.02 | 0.052 | 0.27 |
Table 8.
Regression analysis for firms in the selected industries.
| Variables | CAR (0, 2) | p Value | CAR (−5, 5) | p Value |
|---|---|---|---|---|
| Log (Total Assets) | 0.002 | 0.37 | 0.005 | 0.29 |
| Return on Assets | 0.005 | 0.87 | 0.001 | 0.99 |
| Market to Book | 0.000 | 0.32 | 0.000 | 0.72 |
| Financial Leverage | −0.001 | 0.13 | 0.000 | 0.69 |
| Tobin’s Q | −0.002 | 0.54 | −0.003 | 0.57 |
| Indictor (Addition = 1) | 0.001 | 0.87 | 0.005 | 0.62 |
| Indicator (Sector group A = 1) | 0.003 | 0.67 | 0.004 | 0.72 |
| Interaction Variable (Group A = 1) × (Addition = 1) | −0.017 * | 0.08 | −0.026 | 0.14 |
© 2020 by the authors. Licensee MDPI, Basel, Switzerland. This article is an open access article distributed under the terms and conditions of the Creative Commons Attribution (CC BY) license (http://creativecommons.org/licenses/by/4.0/).
Share and Cite
MDPI and ACS Style
Schmutz, B.; Tehrani, M.; Fulton, L.; Rathgeber, A.W. Dow Jones Sustainability Indices, Do They Make a Difference? The U.S. and the European Union Companies. Sustainability 2020, 12, 6785. https://doi.org/10.3390/su12176785
AMA Style
Schmutz B, Tehrani M, Fulton L, Rathgeber AW. Dow Jones Sustainability Indices, Do They Make a Difference? The U.S. and the European Union Companies. Sustainability. 2020; 12(17):6785. https://doi.org/10.3390/su12176785
Chicago/Turabian StyleSchmutz, Bryan, Minoo Tehrani, Lawrence Fulton, and Andreas W. Rathgeber. 2020. "Dow Jones Sustainability Indices, Do They Make a Difference? The U.S. and the European Union Companies" Sustainability 12, no. 17: 6785. https://doi.org/10.3390/su12176785
Note that from the first issue of 2016, this journal uses article numbers instead of page numbers. See further details here.