Article

A Promotional Construction Approach for an Urban Three-Dimensional Compactness Model—Law-of-Gravitation-Based

1
Key Lab of Urban Environment and Health, Institute of Urban Environment, Chinese Academy of Sciences, Xiamen 361021, China
2
Xiamen Key Laboratory of Urban Metabolism, Xiamen 361021, China
3
University of Chinese Academy of Sciences, Beijing 100049, China
*
Authors to whom correspondence should be addressed.
Both of Xinyue Hu and Han Yan are the Co-First Author.
Sustainability 2020, 12(17), 6777; https://doi.org/10.3390/su12176777
Submission received: 17 July 2020 / Revised: 12 August 2020 / Accepted: 17 August 2020 / Published: 21 August 2020

Abstract

:
Urban sprawl has led to various economic, social, and environmental problems. Therefore, it is very significant to improve the efficiency of resource usage and promote the development of compact urban form. It is a common topic that measuring urban compactness is done with certain ways and methods as well. Presently, most urban compactness measurement methods are based on two-dimensional (2D) formats, but methods based on three-dimensional (3D) formats that can precisely describe the actual urban spatial conditions are still lacking. To measure the compactness of the 3D urban spatial form accurately, a 3D Compactness Index (VCI) was established based on the Law of Gravitation and the quantitative measurement model. In this model, larger 3D Compactness Index values indicate a more 3D-compact city. However, different urban scales may influence the discrepancy scale of different cities. Thus, the 3D Compactness Index model was normalized as the Normalized 3D Compactness Index (NVCI) to eliminate such discrepancies. In the Normalized 3D Compactness Index model, a sphere with the same volume of real urban buildings in the city was assumed as the most compact 3D urban form, and which was also calculated by 3D Compactness Index processing. The compactness value of the normalized 3D urban form is obtained by comparing the 3D Compactness Index with the most compact 3D urban form. In this study, 1149 typical communities in Xiamen, China, were selected as the experimental fields to verify the index. Some of communities have a quite different Normalized 3D Compactness Index, although they have a similar Normalized 2D Compactness Index (NCI), respectively. Moreover, comparing with the 2D Compactness Index (CI) and Normalized 2D Compactness Index (NCI), the 3D Compactness Index and Normalized 3D Compactness Index can describe and explain reality more precisely. The constructed 3D urban compactness model is expected to contribute to scientific study on urban compactness.

1. Introduction

With the urbanization process, urban land expansion leads to huge demands from city dwellers, a shortage of resources, and environmental degradation as well. The concept of compact city was proposed by Dantzig in 1973, which was characterized by high density and diversity, and tried to improve the disorderly sprawl of the city [1]. A compact city aims to satisfy various demands of urban residents with regard to their social culture as well as economic activities, and to achieve the goal of sustainable urban development. Additionally, “compact city” expects to promote efficient usage of urban resources and decrease the waste in both horizontal and vertical space [2].
Research of compact city commonly focuses on two areas: environmental effects of urban compactness and quantitative methods for measuring urban compactness. With regard to its environmental effects, it has been reported that the compact form can affect the climate regulation, landscape change, and usage of natural resources [1,3,4,5,6]. For example, Ye et al. focused on the effects of urban spatial form on the microclimate in Xiamen, China. Using geodetectors and regression analysis, they investigated the effects of urban compact form on urban green infrastructure distribution, urban microclimate changes, and carbon emissions generated from urban building energy consumptions, respectively [7,8,9,10,11]. Martina et al. assessed the urban sprawl impacts with multiple scales. Then, they extended the assessment results to planning as well as management for urban sustainable development [7]. In the present research works, four issues have been identified: gas emissions (mainly related to transportation and industry production), resources and energy consumption, climate change in urban areas, and fragmentation of urban natural spaces [12]. Compact city is becoming an effective management strategy for limiting urban sprawl, owing to its multiple positive effects, such as more efficient land resource usage, congestion improvement of traffic flow, and enhanced service efficiency of urban infrastructure. In the past years, some developed countries have begun to implement compact development strategies [13]. The United Nations and other countries around the world have formulated many related policies to alleviate various environmental problems caused by urban compactness such as the New Urban Agenda (Habitat 2017), the Paris Agreement (United Nations Framework Convention on Climate Change, 2015), the United Nations Sustainable Development Goals (United Nations Sustainable Development Group, 2015), the Sendai Framework for Disaster Risk Reduction (United Nations International Strategy for Disaster Reduction, 2015) and the Intergovernmental Panel on Climate Change (IPCC) [14,15,16,17,18]. Through reviewing and summarizing policies and frameworks of urban climate regulation on a global scale, Sharifi discussed the comprehensive assessment system for dealing with the trade-offs and conflicts among socioeconomic development, natural resources usage, and climate change, and provided suggestions on how to adopt the integrated framework, Urban Integrated Assessment Frameworks (UIAFs), more effectively [19].
In the past several decades, some developed countries have begun to implement compact development strategies [13]. Nowadays, urban compactness is generally accepted in developed countries, and it has also been adopted as one of the primary management strategies for urban sustainable development both in China and other developing countries [3]. However, excessive compactness also brings various problems such as economic or population pressure, environmental pollution, and climate change [19,20]. Whether compact cities can improve travel efficiency, promote social equity, and improve urban vitality, as well as promote or inhibit economic development, remains to be studied [21]. Song has taken a total of 287 prefecture-level and above cities in China as a statistical sample; the results showed that the population density had certain social, economic, and environmental sustainability. The population density (nonagricultural population) basically had no significant correlation with the efficiency of infrastructure provision, economic efficiency, and environmental efficiency of resources if the cities were too small or had reached a certain scale, and the sustainability had differences for those cities with different population densities [22]. Some existing climate challenges also for compact cities, such as land soil hardening, urban heat island effect, and urban pollution problems, which still have not been solved [23,24,25]. Greenhouse gas emissions have been one of the most serious environmental problems due to the excessive urban compactness, which limits the space of urban green space and may increase more energy demands [19,26,27].
Compared with the qualitative description of urban compactness, the quantitative calculation method can be more specific and intuitively show the compactness of the city. Thus, to develop appropriate quantitative measurement models, it is essential to understand the characteristics of the urban spatial form. Quantitative compactness measurement models commonly have two approaches: one is the physical form measurement method, and the other is the comprehensive multi-indicator method. The physical form measurement method often calculates the physical urban form firstly and then compares the irregular urban form to a regular geometric shape. As early as the 1960s, Richardson, Gibbs, and Cole proposed many methods of innovative compactness measurement for calculating urban compactness [28,29,30]. Subsequently, in 1999, Bertaud and Mapezzi invented the P compactness index model to describe city compactness. The P model was constructed with three parameters: the distance between the investigated area and the central business district (CBD), urban built-up area, and population density of the city [31]. The comprehensive multi-indicator method establishes a comprehensive index which includes many indicators. Indicators are not only related to physical characteristics of urban form, but related to various socioeconomic factors. In 2001, Glaster et al. selected eight indicators to calculate urban compactness, which included density, continuity, concentration, clustering, centrality, nuclearity, mixed use, and proximity [32]. Similarly, in 2005, Fang et al. used four indicators, size, density, equal distribution degree, and clustering degree, to analyze urban compactness. This model was widely used to distinguish urban compactness and urban sprawl [33,34]. However, the abovementioned models do not consider the interrelationship among each factor and the impact on different parts of the city. Therefore, in 2002, another method was proposed by Thinh et al. They divided an urban land-use map into grids with a certain size, and then constructed urban compactness by calculating gravitational value between every two grids based on the law of gravity [35]. In recent years, some new methods have been used for measuring the compactness of urban spatial functions, involving obtaining the point-of-interest data, night-light data, and road-network data of the city to be tested and dividing urban core area into plots according to road-network data [36].
In the past five decades, measurements for a compact city were mainly based on two-dimensional (2D) form, whereas it is difficult to accurately measure the three-dimensional (3D) compactness of the real city. Methods for 3D urban compactness measurement are still lacking. To fill in the gap and develop measurement of urban compactness, in this paper, the 3D Compactness Index (VCI) and Normalized 3D Compactness Index (NVCI) were developed based on previous breakthroughs of the 2D Compactness Index (CI) and Normalized 2D Compactness Index (NCI), as well as the Law of Gravitation. The VCI and NVCI models can accurately explain the real urban spatial conditions, which will provide a new creative way for studies on 3D compactness of the city and support for urban management and planning.

2. Method

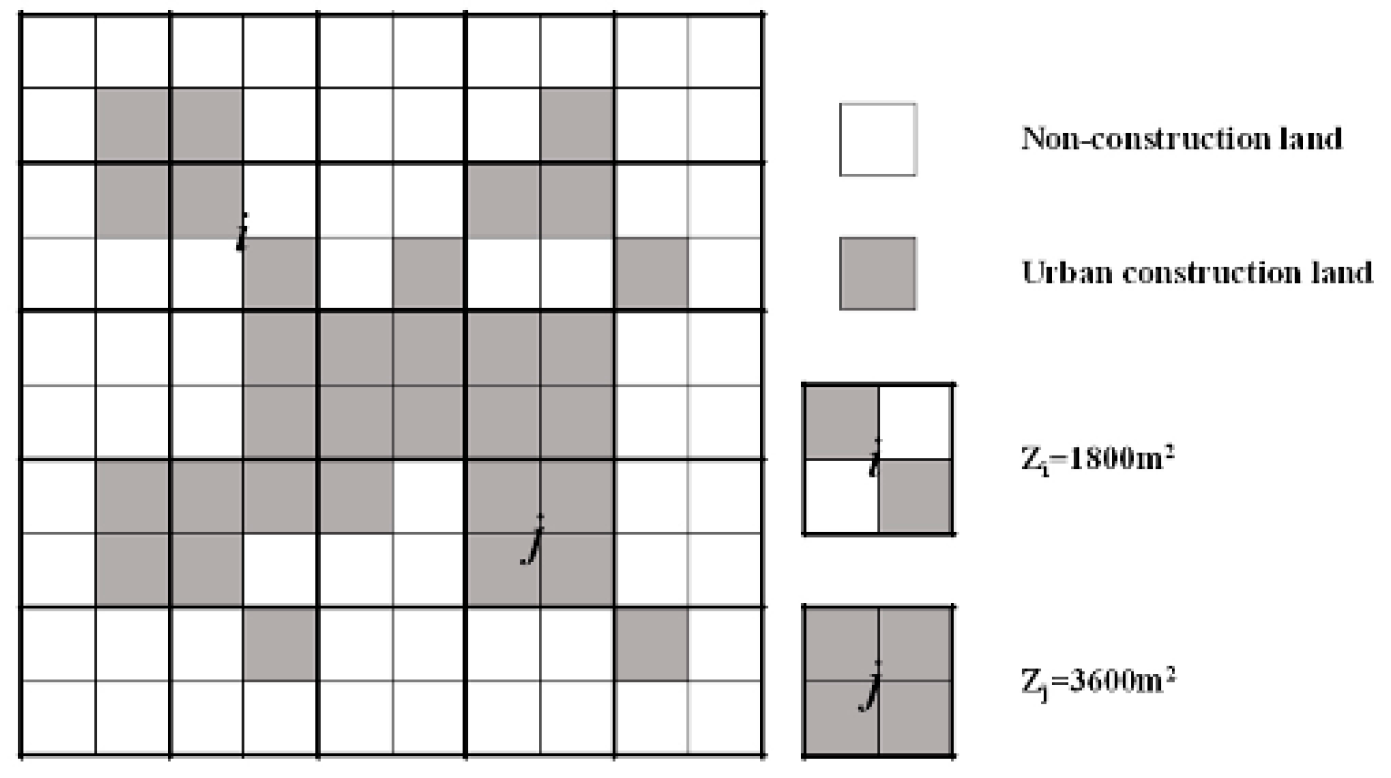
2.1. Law of Gravitation

Cavendish discovered that gravitation existed between any two objects, and it was determined by gravitational constant, mass of objects, and the distance between those objects. Based on Cavendish’s discovery, Newton proposed the Law of Gravitation in the “Mathematical Principles of Natural Philosophy,” published in 1687. The Law of Gravitation, which is a basic universal law, is positive to the mass of objects, while it is negative to the square of their distance [37,38]. The Law of Gravitation is expressed as follows:
F   =   G M m r 2   =   G ρ i V i ρ j V j r 2 ,
where F is the Gravitation, G is the gravitational constant (G = 6.67 × 10 11 N · m 2 / k g 2 ), M and m are the mass of objects i and j (ij), r is the distance between objects i and j (ij), ρ i and ρ j are the density of objects i and j (ij), V i and V j are the volume of objects i and j (ij).

2.2. 2D Urban Compactness Index Model Based on Law of Gravitation

According to the Law of Gravitation, in 2002, Thinh et al. proposed a quantitative measurement model (T model) to calculate urban compactness. In the T model, the study area is divided by grids which share a certain size based on geographic information system (GIS) and the land-use data [35]. Figure 1 shows the urban land-use data obtained from Landsat remote-sensing images. As an example, the pixel size of the image is 30 m × 30 m, and the grid size is 60 m × 60 m [39]. The T model can measure the 2D spatial gravity between different parts of an urban built-up area. The stronger the spatial gravitation, the more compact the urban form will be. The T model is expressed as follows [39]:
C I   =   1 c Z i Z j d 2 ( i , j ) N ( N 1 ) / 2 ,
where CI is the 2D Compactness Index, Zi and Zj are the area of urban construction land (grey part in Figure 1) in urban grids i and j (ij), d(i,j) is the geometric distance between the grids i and j (ij), c is the constant (m2, to make the calculation result dimensionless), the value of c depends on the size of the region in which we calculate the 2D Compactness Index, and N is the number of the grids.

2.3. Normalization of 2D Urban Compactness Index Model

T model is significantly affected by the scale of urban built-up area. Previous studies have reported that cities with smaller compactness tend to occupy larger areas, according to the results of 116 case cities in Germany [35]. In 2011, Zhao et al. improved the T model and proposed a new quantitative method, the Normalized 2D Compactness Index (NCI). The NCI model is defined as the ratio of the actual urban construction land to the equivalent circular land [39]. As is known to all, for all 2D shapes with the same area, the shape will become more compact when their circumferences become smaller, and circularity is the most compact shape with its smallest circumference [40]. Therefore, in the NCI model, they used circularity with the same area as a reference to judge urban compactness by measuring its roundness, and the irregular urban form was normalized by the equivalent circular form which has the same area. The NCI model does not only quantitatively represent the compactness degree of urban form, but also helps to compare compactness of different cities. Figure 2 shows an example for land shape and its equivalent circular land in the urban built-up area. The NCI model is expressed as follows [39]:
N C I   =   C I C I m a x ,
where NCI is the Normalized 2D Compactness Index of which the value is between 0 and 1, CI is the 2D Compactness Index, CImax is the 2D Compactness Index of the equivalent circularity, i.e., the closer NCI is to 1, the more compact the 2D urban form.
According to Equations (2) and (3), the formula for calculating the normalized compactness index could be further obtained by Equation (4) [39]:
N C I   =   C I C I m a x   =   Q ( Q 1 ) N ( N 1 ) × Z i Z j d 2 ( i , j ) S i S j d 2 ( i , j ) ,
where Zi, Zj, d(i, j) and N are given in Equation (2), Si, Sj are the equivalent circular land area in grid i’ and j’, d’(i’, j’) is the geometric distance between grid i’ and j’, Q is the total grid number where the equivalent circular area occupies.

2.4. 3D Compactness Index (VCI)

The T model and NCI model are advanced measurements to calculate 2D urban compactness. However, the actual spatial form of cities also has a vertical dimension. Therefore, it is difficult for the 2D Compactness Index to measure 3D urban compactness space form accurately. To develop measurement of urban compactness, a 3D urban compactness form model is constructed.
According to the Law of Gravitation and the T model, this paper proposes a 3D Compactness Index model (VCI), which can quantitatively assess the 3D spatial form of cities. In this model, urban building represents the 3D urban space, and the compactness of urban building represents the 3D urban compactness, which is the most important 3D element in the city. Moreover, the distances between urban buildings will be described by the distances between their individual centroid. The VCI model can explain the total 3D spatial attractions of a city. A larger VCI result indicates stronger urban spatial attraction. The VCI model can be used to optimize quantitative measurement of a 3D compact city.
Due to diversity of urban form, in the T model, urban area is divided into 2D grids with a certain scale, which eliminates the influence of different shapes. Therefore, in the VCI model, the urban unit cube in the VCI model is constructed for the same purpose, and the volume of urban buildings is divided based on the urban cubes. As shown in Figure 3, the 3D urban spatial form is divided into an appropriate scale of unit cubes. Then, the urban building volumes are divided by these cubes. The cube and buildings within it share the same centroid. The VCI model is expressed by Equation (5), as follows:
V C I   =   1 c V i V j d 2 ( i , j ) N ( N 1 ) / 2 ,
where VCI is the 3D Compactness Index, Vi and Vj are the volume of urban buildings in urban cube i and cube j (ij), d(i, j) is the geometric distance between centroids of urban cube i and cube j, c is constant (m4, to make the calculation result dimensionless), the value of c depends on the size of the region in which we calculate the 3D Compactness Index, N is the number of all cubes.

2.5. Normalized 3D Compactness Index (NVCI)

The Normalized 3D Compactness Index (NVCI) is a further development of VCI, which can eliminate errors caused by city scale differences. It could be applied to different cities as well as different scales of urban area. The sphere is the most compact 3D spatial form in the universe because of gravity. Consequently, we use sphere as the maximum compactness form of 3D urban space and propose the NVCI model, which is defined as the ratio of actual 3D urban spatial form to its equivalent sphere (Figure 4). The actual urban spatial form shares the same volume with its equivalent sphere, and the value of NVCI ranges between 0 and 1. The NVCI model is expressed by Equation (6), as follows:
N V C I   =   V C I V C I m a x ,
where NVCI is the Normalized 3D Compactness Index, VCI is the 3D Compactness Index, VCImax is the 3D Compact Index of the equivalent sphere, r is the radius of the equivalent sphere, i.e. the closer the value of NVCI is to 1, the more compact the urban spatial form.
According to Equations (5) and (6), the NVCI model can be further obtained by Equation (7):
N V C I   =   V C I V C I m a x   =   Q ( Q 1 ) N ( N 1 ) × V i V j d 2 ( i , j ) V i V j d 2 ( i , j ) ,
where Vi, Vj, d (i, j), and N are given in Equation (6), Vi, Vj are the volumes of the equivalent sphere in the cube i’ and j’, d’(i’, j’) is the distance between cube i’ and j’, Q is the total number of cubes where the equivalent sphere occupies.

3. Model Verification
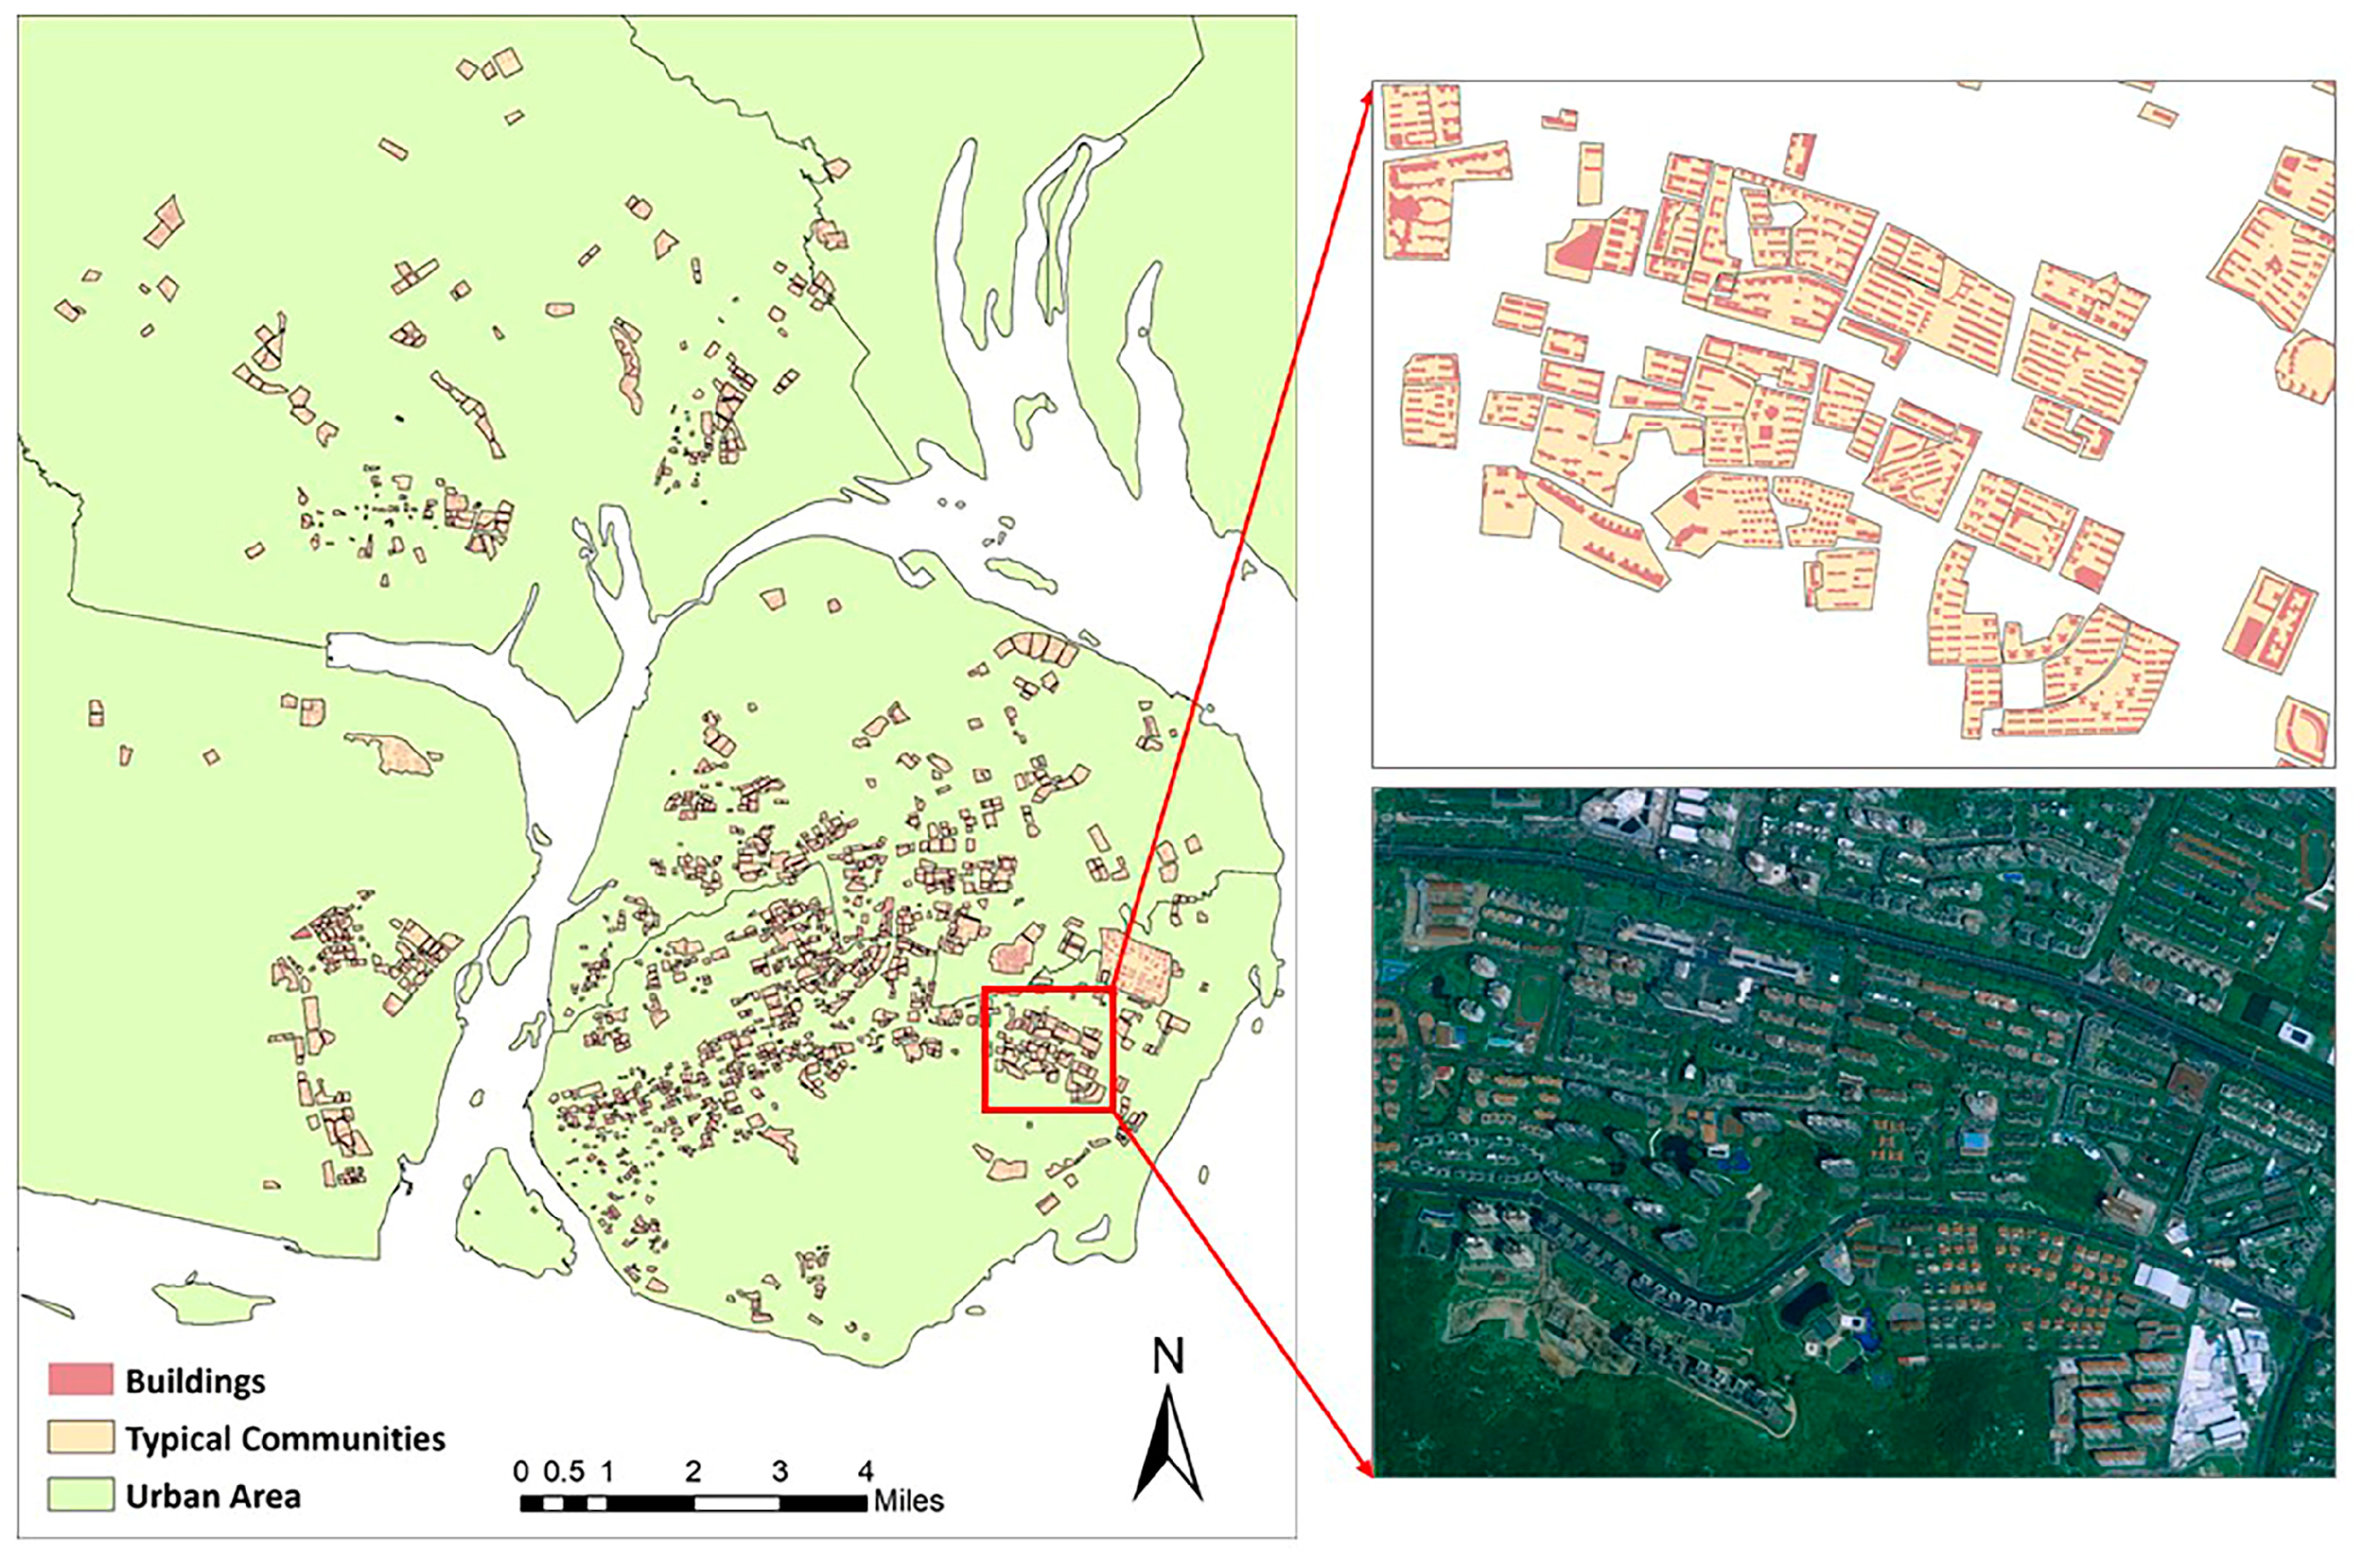
3.1. Case Study

Based on the above method, we selected a typical coastal city, Xiamen, a subtropical city located in southeastern China, as the model verification experimental field. As shown in Figure 5, the experimental field comprised 1449 communities in Xiamen, southeastern China. The volumes of urban buildings are used as factors of the VCI and NVCI models based on land-use data of Xiamen in 2017. The volumes of urban buildings were combined with urban construction areas as well as heights of urban buildings. Using geographical information system (GIS), we extracted the urban construction areas by spatial analysis methods in ArcGIS. Land-use data of Xiamen in 2017 were derived from GF-1 satellite remote-sensing images. The data of buildings’ heights come from field surveys and statistical data in 2017. We built an urban unit cube with a scale of 5 m × 5 m × 5 m and then calculated the VCI and NVCI of each community. Then, we measured the average building height and calculated building density, plot ratios, and NCI of all communities. Average building height, building density, and plot ratios served as control groups. NCI is the compact character of urban 2D form.

3.2. Results and Discussions

Based on the case study, we found that VCI and NVCI are positively correlated with building height, building density, and plot ratios. However, comparing with the compact characters of urban 2D form, it is shown that NVCI can reflect the real 3D compactness of communities more significantly.
As presented in Table 1, we selected 9 communities which had the same value of NCI to compare their 3D compactness characters. It revealed that the 9 communities had totally different NVCI values among each other due to different 3D conditions such as average heights, building density, and plot ratios. For example, the community Shuichanjituan (SCJT) had a lower NVCI value than community Wanjinghuayuan (WJHY), which are 0.032 and 0.045 respectively, because SCJT had a lower average height, density, as well as plot ratio than WJHY. However, the differences in average height, density, and plot ratio are not so large, so the NVCI values between these two communities are also less different. As can be seen, NVCI describes the actual 3D urban compactness form in a more accurate and detailed manner.
Among the 9 residential communities, 4 are located in Huli District and 5 are located in Siming District. Siming District and Huli District are urban areas on Xiamen island. The history of urbanization in Siming District is longer than that in Huli District. Siming District is the oldest city center in Xiamen, while Huli District is a newly developed city center. In short, the 3D compactness of communities in Siming District is generally lower than that in Huli District. This is because Siming District is a historical city with communities built in different periods. For example, JFY community was built earlier and its 3D compactness is low, while SCJT is a new community with higher 3D compactness. In addition, in order to protect the historical area, Xiamen has also issued relevant policies to protect the historical features of Siming District. The overall 3D compactness of Huli District is relatively high, due to the development of Huli District into a new urban center which followed uniform policies and regulations for community construction.
In order to verify the correctness of the Normalized 3D Compactness Index (NVCI) we constructed, we used plot ratio, which can also express the urban compactness to verify the obtain results. The density, 2D compactness, and 3D compactness of 1449 communities were compared with their plot ratio. Results showed that the precision R2 of NVCI is 0.390, while that of NCI is 0.290. The precision of density is the lowest, with the R2 value of 0.150. It means that 3D compactness is closer to the distribution of buildings in the different communities. Through the correlation analysis with the plot ratio of each community, it is proven that the Normalized 3D Compactness Index can better reflect the actual compactness of urban area compared with density and the Normalized 2D Compactness Index.
However, there are several limitations of our current study. Firstly, we used the VCI and NVCI models to calculate and analyze the urban compactness of 1449 communities in Xiamen. The compactness of other cities has not yet been calculated due to the lack of data. Secondly, although the compactness of the urban physical space (physical structure) is the main indicator of the compactness of the city, we still need more factors such as the compactness of urban functions in our future research. We will further analyze the 3D compact state of more cities by expanding the data and further deepen the method in our future research by verifing and comparing with other 3D methods. In addition, the current research focuses on the model construction and validation. The application of the 3D Compactness Index in the environment will continue in future research, such as the impact of 3D urban compact form on urban heat environment and atmospheric environment.

4. Conclusions

Urban sprawl has led to numerous environmental problems. Some policy makers and urban planners suggested compactness as an urban sustainable development form. However, there has been widespread research on 2D urban compactness; models which could reflect 3D compact form reality have seldom been developed. This study innovatively constructed a 3D urban compactness model (VCI) based on Newton’s law of universal gravitation and successfully normalized the model (NVCI) to offset scale discrepancies among cities. Based on the Law of Gravitation and T model, we proposed the VCI model, which innovatively uses volume of urban buildings as one of the factors and divides the building volume by urban 3D unit cubes. The 3D compactness is positive for the volume of urban buildings and negative for the distance between them. Moreover, the NVCI model was established and further improved based on the VCI model to accurately measure 3D compactness of different cities. In the NVCI model, the urban 3D compactness is calculated by constructing an equivalent sphere that has the same city buildings volume with city buildings. The NVCI model is a normalized 3D measurement model, which can effectively eliminate errors produced by different city forms.
The VCI and NVCI models provide a new approach toward quantitative measurement of 3D urban spatial form compactness. The establishment of the VCI and NVCI will further explore the relationship between the urban spatial form and socioeconomy, as well as urban environment, which also contribute toward urban sustainable development. This scientific and efficient 3D compact city model is expected to be beneficial to the construction of sustainable urban form, which provides a quantitative tool for exploring the optimal 3D compact three-dimensional urban form in the future.

Author Contributions

X.H. and H.Y. (Han Yan) contributed equally to this work. Data curation, X.H and H.Y. (Han Yan); methodology, X.H., H.Y. (Han Yan), G.Z., and H.Y. (Hong Ye); validation, X.H. and H.Y. (Han Yan); writing original draft, X.H., H.Y. (Han Yan), G.Z., and H.Y. (Hong Ye); formal analysis, H.Y. (Han Yan); software, H.Y. (Han Yan) and G.Z.; writing review and editing, X.H., H.Y. (Han Yan) and H.Y. (Hong Ye); supervision, D.W., Z.Z., and H.Y. (Hong Ye); investigation, D.W.; visualization, Z.Z.; resources, T.L. and H.Y. (Hong Ye); project administration, T.L. and H.Y. (Hong Ye); funding acquisition, T.L. and H.Y. (Hong Ye). All authors have read and agreed to the published version of the manuscript.

Funding

This research was funded by the National Key Research and Development Program of China (2016YFC0502700), Projects 41771570, 41871167, supported by the National Natural Science Foundation of China, the Key Research Program of the Chinese Academy of Sciences, KFZD-SW-324.

Acknowledgments

We are grateful to reviewers for their helpful comments and suggestions for improving the manuscript.

Conflicts of Interest

The authors declare no conflict of interest. The funders had no role in the design of the study; in the collection, analyses, or interpretation of data; in the writing of the manuscript, or in the decision to publish the results.

References

  1. Dantzig, G.B. The ORSA New Orleans Address on Compact City. Manag. Sci. 1973, 19, 1151–1161. [Google Scholar] [CrossRef]
  2. Brotchie, J.F. Compact city, a plan for a liveable urban environment: G.A. Danzig and T.L. Saaty. Urban Ecol. 1975, 1, 325–328. [Google Scholar] [CrossRef]
  3. Borrego, C.; Martins, H.; Tchepel, O.; Salmim, L.; Monteiro, A.; Miranda, A.I. How urban structure can affect city sustainability from an air quality perspective. Environ. Model. Softw. 2006, 21, 461–467. [Google Scholar] [CrossRef]
  4. Breuste, J.; Astner, A. Which kind of nature is liked in urban context? A case study of solarcity linz, Austria. Mitt. Der Osterreichischen Geogr. Ges. 2017, 159, 105–129. [Google Scholar]
  5. Paul, V.; Tonts, M. Containing Urban Sprawl: Trends in Land Use and Spatial Planning in the Metropolitan Region of Barcelona. J. Environ. Plan. Manag. 2005, 48, 7–35. [Google Scholar] [CrossRef]
  6. Ye, H.; Hu, X.; Ren, Q.; Lin, T.; Li, X.; Zhang, G.; Shi, L. Effect of urban micro-climatic regulation ability on public building energy usage carbon emission. Energy Build. 2017, 154, 553–559. [Google Scholar] [CrossRef]
  7. Artmann, M.; Inostroza, L.; Fan, P. Urban sprawl, compact urban development and green cities. How much do we know, how much do we agree? Ecol. Indic. 2019, 96, 3–9. [Google Scholar] [CrossRef]
  8. Ye, H.; He, X.; Song, Y.; Li, X.; Zhang, G.; Lin, T.; Xiao, L. A sustainable urban form: The challenges of compactness from the viewpoint of energy consumption and carbon emission. Energy Build. 2015, 93, 90–98. [Google Scholar] [CrossRef]
  9. Ye, H.; Qiu, Q.; Zhang, G.; Lin, T.; Li, X. Effects of natural environment on urban household energy usage carbon emissions. Energy Build. 2013, 65, 113–118. [Google Scholar] [CrossRef]
  10. Ye, H.; Ren, Q.; Hu, X.; Lin, T.; Shi, L.; Zhang, G.; Li, X. Modeling energy-related CO2 emissions from office buildings using general regression neural network. Resour. Conserv. Recycl. 2018, 129, 168–174. [Google Scholar] [CrossRef]
  11. Ye, H.; Ren, Q.; Shi, L.; Song, J.; Hu, X.; Li, X.; Zhang, G.; Lin, T.; Xue, X. The role of climate, construction quality, microclimate, and socio-economic conditions on carbon emissions from office buildings in China. J. Clean. Prod. 2018, 171, 911–916. [Google Scholar] [CrossRef]
  12. Van der Waals, J.F.M. The compact city and the environment: A review. Tijdschr. Voor Econ. En Soc. Geogr. 2000, 91, 111–121. [Google Scholar] [CrossRef]
  13. Burton, E. Measuring urban compactness in UK towns and cities. Environ. Plan. B-Plan. Des. 2002, 29, 219–250. [Google Scholar] [CrossRef]
  14. Habitat III. New Urban Agenda; United Nations: Quito, Ecuador, 2017.
  15. United Nations Framework Convention on Climate Change (UNFCCC). Paris Agreement; United Nations: New York, NY, USA, 2016.
  16. United Nations Sustainable Development Group (UNSDG). About the Sustainable Development Goals; United Nations: New York, NY, USA, 2015.
  17. United Nations International Strategy for Disaster Reduction (UNISDR). Sendai Framework for Disaster Risk Reduction 2015–2030; United Nations: Sendai, Japan, 2015.
  18. The Intergovernmental Panel on Climate Change (IPCC). Climate Change 2007: Impacts, Adaptation and Vulnerability; Cambridge University Press: Cambridge, UK, 2007.
  19. Sharifi, A. Trade-offs and conflicts between urban climate change mitigation and adaptation measures: A literature review. J. Clean. Prod. 2020, 276, 122813. [Google Scholar] [CrossRef]
  20. Cervero, R. Efficient Urbanisation: Economic Performance and the Shape of the Metropolis. Urban. Stud. 2001, 38, 1651–1671. [Google Scholar] [CrossRef]
  21. Reilly, M.K.; O’Mara, M.P.; Seto, K.C. From Bangalore to the Bay Area: Comparing transportation and activity accessibility as drivers of urban growth. Landsc. Urban. Plan. 2009, 92, 24–33. [Google Scholar] [CrossRef]
  22. Song, Y. Study on the Theories and Assessment Methodologies of the Compact City; University of Chinese Academy of Sciences: Beijing, China, 2011. [Google Scholar]
  23. Gaigne, C.; Riou, S.; Thisse, J.-F. Are compact cities environmentally friendly? J. Urban. Econ. 2012, 72, 123–136. [Google Scholar] [CrossRef]
  24. Burton, E. The Compact City: Just or Just Compact? A Preliminary Analysis. Urban Stud. 2000, 37, 1969–2006. [Google Scholar] [CrossRef]
  25. Lau, S.S.Y.; Yang, F.; Tai, J.; Wu, X.L.; Wang, J. The study of summer-time heat island, built form and fabric in a densely built urban environment in compact Chinese cities: Hong Kong, Guangzhou. Int. J. Sustain. Dev. 2011, 14, 30–48. [Google Scholar] [CrossRef]
  26. Pierer, C.; Creutzig, F. Star-shaped cities alleviate trade-off between climate change mitigation and adaptation. Environ. Res. Lett. 2019, 14, 085011. [Google Scholar] [CrossRef] [Green Version]
  27. Stokes, E.C.; Seto, K.C. Climate change and urban land systems: Bridging the gaps between urbanism and land science. J. Land Use Sci. 2016, 11, 698–708. [Google Scholar] [CrossRef]
  28. Richardson, H.W. Harry Ward Richardson; Saxon House: Lexington, KY, USA, 1973. [Google Scholar]
  29. Gibbs, J.P. Urban. Research Methods. NEW YORK; Van Nostrand: Princeton, NJ, USA, 1961. [Google Scholar]
  30. Cole, J.P. Study of Major and Minor. Civil. Division in Pllitical Geography; Miemgraphed: Seattle, WA, USA, 1960. [Google Scholar]
  31. Bertaud, A.; Malpezzi, S. The Spatial Distribution of Population in 35 World Cities: The Role of Markets, Planning, and Topography; University of Wisconsin Center for Urban Land Economic Research: Wisconsin, WI, USA, 2001. [Google Scholar]
  32. Galster, G.; Hanson, R.; Ratcliffe, M.R.; Wolman, H.; Coleman, S.; Freihage, J. Wrestling sprawl to the ground: Defining and measuring an elusive concept. Hous. Policy Debate 2001, 12, 681–717. [Google Scholar] [CrossRef]
  33. Chuanglin, F.; Weifeng, Q.I. Research Progress and Thinking of Compact City and Its Measurement Methods. Urban Plan. Forum 2007, 4, 65–73. [Google Scholar]
  34. Chuanglin, F.; Weifeng, Q.I.; Jitao, S. Researches on Comprehensive Measurement of Compactness of Urban Agglomerations in China. Acta Geogr. Sin. 2008, 63, 1011–1021. [Google Scholar]
  35. Thinh, N.X.; Arlt, G.; Heber, B.; Hennersdorf, J.; Lehmann, I. Evaluation of urban land-use structures with a view to sustainable development. Environ. Impact Assess. Rev. 2002, 22, 475–492. [Google Scholar] [CrossRef]
  36. Zhao, F.; Tang, L.; Qiu, Q.; Wu, G. The compactness of spatial structure in Chinese cities: Measurement, clustering patterns and influencing factors. Ecosyst. Health Sustain. 2020, 6, 1743763. [Google Scholar] [CrossRef] [Green Version]
  37. Padmanabhan, T. Gravitation: Foundations and Frontiera; Peking University Press: Beijing, China, 2013. [Google Scholar]
  38. Newton, I. Mathematical Principles of Natural Philosophy; University of California Press: Oakland, CA, USA, 1999. [Google Scholar]
  39. Zhao, J.; Song, Y.; Shi, L.; Tang, L. Study on the compactness assessment model of urban spatial form. Acta Ecol. Sin. 2011, 31, 6338–6343. [Google Scholar]
  40. Sun, M. Digital Image Processing and Analysis: MATLAB and VC++ Implementation; Electron. Industry Press: Beijing, China, 2013. [Google Scholar]
Figure 1. Grids in 2D urban compactness model [39].
Sustainability 12 06777 g001
Figure 2. Urban construction land and its equivalent circular land [39].
Sustainability 12 06777 g002
Figure 3. Process of constructing a 3D Compactness Index (VCI) model.
Sustainability 12 06777 g003
Figure 4. Urban buildings and their equivalent volume sphere.
Sustainability 12 06777 g004
Figure 5. Distribution of urban buildings of Xiamen communities.
Sustainability 12 06777 g005
Table 1. 3D spatial parameters of 9 communities in Xiamen.
Community IDLocation
(District)
NCINVCIAverage Height (m)DensityPlot Ratio
Lianfabinhaimingju (LFBH)Siming0.5540.00550.0000.1243.031
Jinfengyuan (JFY)Siming0.5540.00721.3530.3682.932
Xiagangxincun (XGXC)Siming0.5540.01415.1670.3502.226
Dunshangxiaoqu (DSXQ)Huli0.5540.02228.9090.2353.149
Jinqiuhuayuan (JQHY)Huli0.5540.02223.5710.3793.850
Shuichanjituan (SCJT)Siming0.5540.03212.2500.3192.091
Wanjinghuayuan (WJHY)Huli0.5540.04519.5000.3872.654
Lvquanxincun (LQXC)Siming0.5540.05413.2860.4482.812
Dongrongshequ (DRSQ)Huli0.5540.06116.6000.4082.875
NCI: Normalized 2D Compactness Index; NVCI: Normalized 3D Compactness Index.

