Article

Has China’s Belt and Road Initiative Intensified Bilateral Trade Links between China and the Involved Countries?

1
Department of International Economics & Trade, Business School, Hubei University, Wuhan 430062, China
2
Open Economy Research Centre, Hubei University, Wuhan 430062, China
3
Department of Finance & Economics, McCoy College of Business Administration, Texas State University, San Marcos, TX 78666, USA
4
Coggin College of Business, University of North Florida, Jacksonville, FL 32224, USA
*
Author to whom correspondence should be addressed.
Sustainability 2020, 12(17), 6747; https://doi.org/10.3390/su12176747
Submission received: 14 July 2020 / Revised: 11 August 2020 / Accepted: 12 August 2020 / Published: 20 August 2020
(This article belongs to the Section Economic and Business Aspects of Sustainability)

Abstract

:
The Belt and Road Initiative (BRI) is designed to intensify reciprocal trade preferentiality between China and the Belt-Road countries. However, there has been little research empirically examining the policy effects on the trade links between China and the involved countries. This paper attempts to evaluate the BRI effects quantitatively by constructing a new bilateral revealed trade preference index to measure the bilateral trade preferentiality between China and its 114 trading partners. Using a difference in differences model, we show that the trade of China with the Belt-Road countries has become more preferentially linked since the implementation of the BRI. In particular, the bilateral revealed trade preference index between China and the Belt-Road countries has grown approximately 8% faster than has that with the non-Belt-Road countries. We further show that the BRI effects are heterogeneous across different regions. The bilateral trade links have been more significantly intensified in the regions of the China–Indochina Peninsula Economic Corridor, the China–Pakistan Economic Corridor, the China–Central Asia–West Asia Economic Corridor and the Bangladesh–China–India–Myanmar Economic Corridor. The findings strongly indicate that BRI has been acting as a catalyst for intensifying bilateral trade preferentiality between China and the Belt-Road countries.

1. Introduction

The Belt and Road Initiative (BRI), described as “China’s grand connectivity blueprint,” is the most ambitious international project that China has initiated since 2013 [1,2,3]. The BRI aims to stimulate economic growth by strengthening inter-regional cooperation over a vast area covering sub-regions in Asia, Europe, and Africa, as the grand project has highlighted five different priorities for China and the BRI participating countries: policy coordination, unimpeded trade, facility connectivity, financial integration, and the bond between people [2,4]. In particular, it signals a shift in China’s foreign policy toward prioritizing the trading relationship with her neighboring countries [5,6].
The dominant purpose of the BRI is to adopt a win–win mode of an integrative economic project that is free of geopolitical strategy at the regional level [3,4,5,6,7,8,9]. During the past seven years, China’s economic cooperation with the Belt-Road countries has achieved remarkable results. On the one hand, the bilateral trade between China and Belt-Road countries has significantly increased. The total trade value of goods between China and Belt-Road countries had exceeded $7.8 trillion from 2013 to 2019, according to the data reported by the Ministry of Commerce of China. In 2019, the growth of bilateral trade between China and countries along the Belt and Road reached 10.8 percent, outpacing China’s aggregate trade growth by 7.4 percentage points [10]. As for the sub-regions, the growth in bilateral trade between China and the Association of Southeast Asian Nations (ASEAN) achieved the highest year-by-year increase, at 14.1 percent, outpacing those with the other two vital trading partners: the United States (US) and the European Union (EU) [11]. On the other hand, facility connectivity represented by the six economic corridors under the BRI has been strengthened significantly. The enhancement of regional connectivity of the six economic corridors under the BRI, which include the New Eurasia Land Bridge Economic Corridor (NELBEC), the China–Central Asia–West Asia Economic Corridor (CCWAEC), the China–Mongolia–Russia Economic Corridor (CMREC), the China–Indochina Peninsula Economic Corridor (CICPEC), the Bangladesh–China–India–Myanmar Economic Corridor (BCIMEC), and the China–Pakistan Economic Corridor (CPEC), has facilitated the trade flows along the corridors. A prominent example is that the successful running of Nanning, China-Hanoi, and Vietnam Cross-Border container trains [12], has significantly stimulated the trade flows along the corridor of CICPEC.
In light of the above achievements in China’s economic cooperation with the Belt-Road countries, the purpose of the paper is to provide a quantitative assessment of BRI’s priority of “unimpeded trade.” In particular, we endeavor to answer the following questions: How to quantitatively assess the impact of BRI on the reciprocal trade preferentiality between China and the Belt-Road countries? Does there exist any significant regional heterogeneity of the BRI effect?
This topic is very important for several reasons: (1) Trade integration has important implications for business cycle synchronization [13,14], and there is substantial empirical evidence indicating that business cycles are more synchronized in countries with strong trade intensity [15,16,17], which provides further indication of policy coordination [18,19], one of the five priorities of the BRI; (2) Bilateral trade links have always played an important role in the overall relationship between countries. In a world economy that increasingly has a regional architecture, national developments and regional trajectories will be intertangled [20], so that countries with more intense reciprocal trade links are inclined to have fewer trade conflicts. For example, Brülhart and Thorpe [21] find that the increase in “two-way” trade among the East Asian economies reduces the labor market adjustment costs and, hence, reduces the trade friction between nations and has led to the extraordinary growth in exports from the 1970s to the mid−1990s. (3) Trade integration encourages the reallocation of resources to more efficient activities and thus opens up opportunities and boosts demands and employment [22,23,24]. This is particularly important within the context of the foreseeable global economic adversity caused by the Covid−19 pandemic. (4) Estimating the impact of the BRI on the trade links quantitatively may provide policymakers with valuable references about making further free trade arrangements with the Belt-Road countries.
This paper aims to take the lead in quantitatively examining the impact of the BRI on bilateral trade preferentiality. Specifically, we use a new measure of bilateral revealed trade preference (RTP) index and unique trade data series to investigate the dynamics of bilateral trade preferentiality between China and Belt-Road countries. Recently, Iapadre and Tironi [25] and Iapadre and Tajoli [26] constructed a country-region version of RTP to map either the extent of trade regionalization or the preferentiality of regional trade within specific regions such as the ASEAN, the Commonwealth of Independent States (CIS) and the Southern Common Market (MERCOSUR). Iapadre and Tajoli [26] also used the RTP indicator to construct a regional trade leadership index to measure the trade leadership patterns in emerging regions such as ASEAN–China and the Commonwealth of Independent States (CIS). We adopt the construction of RTP proposed by Iapadre et al. [25,26], but focus mainly on the bilateral version of the indicator in depicting either the bilateral trade preferentiality or the intensity of preferential trade links between China and the Belt-Road countries. As the RTP index has addressed the range symmetry issue raised by Iapadre et al. [25,26], it can better capture either the relative bilateral trade links or the preferentiality across countries compared to the traditional trade intensity indicators, such as the export potential index, which can only depict the unilateral trade performance. Based on the RTP indices, we find that the trade of China with the Belt-Road countries has become more preferentially linked during the sample period of 2008–2016, as the statistical results show that China’s average level of RTP with the Belt-Road countries grew faster than did that with the non-Belt-Road countries, with the gap between the two groups widening since the BRI began in 2013.
We rely on the difference-in-differences (DID) methodology to gauge how the BRI impacts the reciprocal trade preferentiality between China and the Belt-Road countries. Our empirical results show that BRI has intensified bilateral preferential trade links between China and the Belt-Road countries, with the RTP level between China and the Belt-Road countries growing approximately 8% faster than that between China and the non-Belt-Road countries. Furthermore, we also confirm the existence of a regional heterogeneity impact of the BRI. The empirical results indicate that the bilateral trade links have been intensified more significantly in the CICPEC, the CPEC, the CCWAEC, and the BCIMEC.
Our paper is most related to the study of Foo et al. [6]. However, Foo et al. only investigate the impact of China’s BRI on the ASEAN-China bilateral trade relationships, as the ASEAN is just one of the sub-regions along the vast Belt-Road route. Moreover, Foo et al. only investigate the changes in trade flows between China and ASEAN before and after the implementation of the BRI, without analyzing the impact of the BRI on reciprocal preferential trade links. Thus, going a step further than Foo et al., who find that the BRI has a positive impact on the improvement in the bilateral trade partnerships between China and the ASEAN countries located along the “Maritime Silk Road,” our paper serves as a more comprehensive study of the impacts of the BRI on the bilateral trade linkage between China and the Belt-Road countries.
This paper is organized as follows. Section 2 reviews the literature. Section 3 analyzes the dynamics of preferential trade links between China and the Belt-Road countries. Section 4 applies the DID methodology to quantitatively assess the impact of BRI on the intensity of trade links between China and the Belt-Road countries. Section 5 summarizes the empirical findings. Section 6 presents the concluding remarks and policy implications.

2. Literature Review

As the BRI, in essence, can be viewed as an infrastructure-led economic integration plan, one strand of the literature that our study is related to are the studies regarding either trade relations or trade links in the context of the regional integration. On the one hand, some studies have investigated the impact of regional economic integration on the trade links between the economies of the sub-regions of the Belt-Road area. For example, Kalirajan [27] provides evidences that the Indian Ocean Rim-Association for Regional Cooperation increases trade intensity between member countries. Rana et al. [13,14] argue that the increasing economic integration in East Asia has intensified the preferentiality of trade relations between countries within East Asia. Iapadre and Tajoli [26] further point out the fact that the increasing regionalization of trade and the proliferation of regional trade agreements have increased the preferentiality of regional trade. On the other hand, Fei [28] and Williams et al. [29] argue that BRI is expected to reshape the processes of globalization and urbanization in the coming decades. The BRI will have profound implications for regional trade relations among the countries along the Belt-Road route [30].
Another strand of the literature that our study is mostly related to are the studies that quantitatively examine the impact of the BRI on the trade links. However, as the BRI is still a flexible conceptual and institutional initiative that is far from a well-defined action plan, the vagueness of the BRI project and the lack of data lead to paucity of empirical evidence on the assessment of the impact of the BRI. To date, only a handful of studies have touched upon the trade linkage impact of the BRI. As significant priority has been given to policy coordination and to unimpeded trade as facility connectivity under the institutional framework of the BRI, it is generally agreed that the BRI will either facilitate trade or lead to trade creation among the countries along the Belt-Road route. Han et al. [31] and Sang et al. [32] find complementation and competitiveness coexisting in bilateral trade relations between China and the Belt-Road countries. Zhai [33] concludes, from using a global computational general equilibrium model, that there will be a trade creation effect for the economies along and beyond the Belt-Road route. More specifically, Herrero and Xu [34] confirm that EU countries will benefit considerably from the BRI as a consequence of the reduction in transportation costs and the increase in trade volumes. Ramasamy and Yeung [35] and Soyres et al. [36] draw similar conclusions, finding that improvements in border administration and physical infrastructure from implementing the BRI reduce shipment time and trade costs and are export-promoting for the countries involved. Yang et al. [37] find that most Belt-Road countries’ foreign trade and trade terms are promoted due to the infrastructure investment under the BRI.
Furthermore, some studies have investigated whether there is an intensification of bilateral trade links among China and the BRI participating countries. On the one hand, some studies confirm the positive trade linkage effect of the BRI from the perspective of the BRI participating countries. For example, Devadason et al. [38] argue that the BRI offers another opportunity for ASEAN to expand the trade links of its member countries and find a new market to bolster economic growth via Chinese trade relations. Similarly, Boffa [39] quantifies trade linkages within the regional value chains between the economies along the Belt-Road route and finds that the value-added trade has largely increased. He argues that the BRI provides substantial room for improving trade linkages between China and the BRI countries. In the most recent studies, Foo et al. [6] conclude that ASEAN countries benefit from the BRI through closer international trade links. On the other hand, there is also evidence that the implementation of the BRI has strengthened China’s trade links with the Belt-Road countries. Sun et al. [40] and Chen et al. [41] conclude that the BRI has significantly stimulated the exports of China to the Belt-Road countries. Li et al. [42] provide empirical evidence of the effects of the BRI on the export performance of the inland small-to-medium enterprises located in the Western Region of China targeting the “One Belt” area, while Yu et al. [43] find that China’s export potential to the Belt and Road countries grew significantly after the BRI began. Moreover, evidence of the strengthening trade links between China and the countries involved in the six economic corridors has also been documented in Zheng et al. [44] and Karim et al. [45].
This paper contributes to the extant literature in the following respects. First, we are the first to examine the dynamics of reciprocal trade preferentiality measured by RTP between China and the Belt-Road countries after the implementation of BRI. The dynamics of reciprocal trade preferentiality can better help depict the changes in reciprocal preferential trade links between China and the Belt-Road countries. The RTP index that we employ measures the combined effect of the facilitating factors on bilateral trade intensity (Iapadre et al. [25,26]; Cingolani et al. [46]), which can better capture the degree of reciprocal preferential trade links resulting from policy coordination, unimpeded trade, facility connectivity, and financial integration embodied in the BRI. Computation of the RTP indices is very tedious work due to their sophistication, and the difficulty level is increased by the large sample of international trade data covering the 56 Belt-Road countries and 58 non-Belt-Road countries.
Second, the paper contributes to the literature by quantitatively assessing the impact of BRI on bilateral trade links between China and the Belt-Road countries. Although a few studies have touched upon the trade linkage impact of the BRI, none of them have quantitatively assessed the impact of the BRI on the reciprocal trade preferentiality between China and the Belt-Road countries. As there is controversy concerning the win-win effects of the BRI from different economic perspectives, the empirical results of this paper will provide rich implications for policymakers both from China and the Belt-Road countries in the wake of the current uncertain economic climate.
Third, this paper is by far the first to examine the heterogeneous effects of the BRI on China’s bilateral trade preferentiality with the six economic corridors under the BRI. As most trade flows along a few high-density routes, i.e., the economic corridors [47], we explore the possible regional heterogeneous effects of the BRI on China’s bilateral trade preferentiality. We also confirm that the implementation of BRI has been the major driving force of intensifying bilateral trade preferentiality between China and the Belt-Road countries, with a more conspicuous intensification effect of intra-regional trade preferentiality found in the economic corridors of CCWAEC, CICPEC, BCIMEC, and CPEC. The conclusion that more intensified bilateral trade preferentiality was found in the economic corridor of CICPEC is completely consistent with Foo et al. [6].

3. Dynamics of Bilateral Trade Preferentiality between China and Belt-Road Countries

3.1. Measuring Bilateral Trade Preferentiality

Many attempts have been made to measure the bilateral trade links between two countries. The typical measure starts with the gravity model approach pioneered by Tinbergen [48] and Linneman [49]. However, there is a problem with the measures in that the bilateral trade shares of different partners are strongly correlated with the total trade size, so the strength of bilateral trade linkages is size-dependent according to Iapadre et al. [25,26]. Kojima [50] and Balassa [51] developed the most widely used form of revealed comparative advantage index (it is, in essence, a bilateral trade intensity index) to correct for the size-dependent problem. The traditional trade intensity index (TI) is defined as a partner country’s share of the reporting country’s total trade divided by its share of world trade and is calculated as Equation (1)
T I i j = S i j / W j
where Sij and Wj are a partner country j’s share of the reporting country i’s total trade and country j’s weight in total trade of the rest of the world, respectively. However, three factors limit the usefulness of this traditional trade intensity index. These are the range variability (the range of the index is not homogeneous across partner countries), the range asymmetry (the index is asymmetric around the geographic neutrality threshold of one), and the dynamic ambiguity (the change of the index over time is difficult to interpret). To overcome the problems, Iapadre et al. [25,26] constructed a relative bilateral trade intensity measurement and defined it as bilateral revealed trade preference index. In this paper, we will employ the methodology of Iapadre et al. in specifying the bilateral RTP index to measure the degree of reciprocal preferential trade links between China and Belt-Road countries. Following Iapadre et al., the RTP index is calculated as Equation (2)
R T P i j = ( H I i j H E i j ) / ( H I i j + H E i j )
where H I i j = S i j / V i j = ( T i j / T i w ) / ( T o j / T o w ) which is the ‘homogeneous’ bilateral trade intensity index, and H E i j = ( 1 S i j ) / ( 1 V i j ) , which is the complementary ‘extra-bilateral’ trade intensity index. Tij indicates total trade (exports plus imports) between reporting country i and partner country j; Tiw indicates total trade between reporting country i and the world; Toj indicates total trade between the rest of the world (excluding country i) and partner country j; Tow indicates total trade between the rest of the world and the whole world.
It can be seen that, being defined by the ratio between the difference and the sum of HIij and HEij, the RTPij index is, in essence, an indicator of relative bilateral trade intensity because it is modified based on the traditional bilateral trade intensity defined by Equation (1). Compared to the traditional trade intensity index, RTPij has the following good features. First, as the range of HIij goes from zero (no bilateral trade) to infinity (only bilateral trade), with a threshold of one, when the importance of country j for country i is equal to country j’s weight in the world trade, HIij can solve the range variability problem of the traditional trade intensity index, as it is homogeneous in the sense that its maximum value does not depend on the size of the partner country. Second, HEij as the complementary ‘extra-bilateral’ trade intensity index, measures the intensity of trade relations between country i and all the other countries except country j. HEij can solve the dynamic ambiguity problem of the traditional trade intensity index. Third, RTPij is perfectly independent of country size and is symmetrical across partner countries in the sense that RTPij = RTPji.
The value of RTPij ranges from minus one (no bilateral trade) to one (only bilateral trade) and is equal to zero in the case of geographic neutrality, when the degree of reciprocal trade preference between two trading partners is equal to each country’s weight in world trade [52]. The RTPij index actually measures the extent to which the reciprocal trade preference between two countries differs from the geographic neutrality benchmark based on their relative weight in world trade. The closer the value of the RTPij index to one, the more intensively do two trading partners tend to trade with each other than with third countries.
Similarly, a country–region version of the RTP index can also be constructed to map the reporting country’s trade preferences within a region r according to Iapadre et al. [25,26]. Thus, the index of RTPir can be computed simply by applying the above formula to the reporting country’s trade with the rest of the region using Equation (3)
R T P i r = ( H I i r H E i r ) / ( H I i r + H E i r )
where HIir is the weighted average of the corresponding bilateral indices between country i and its regional partners, with weights given by the relative trade size of country i’s partners for the rest of the world. The RTPir index actually measures the extent to which a region’s member countries tend to trade more intensively with the region as a whole than with third countries. If the value of the RTP index is greater than zero, it indicates that a specific country in a region tends to trade more intensively with the region as a whole than with the third countries.
In this section, we will first compute the RTP indices by using Equation (2) to analyze the dynamics of reciprocal preferential trade links between China and her trading partners over time. While computing the above indices, we treat China as the reporting country, i, and China’s trading partners as the partner country, j. We then compute RTPir indices by using Equation (3) to analyze China’s intra-regional trade preferences with sub-regions of the six economic corridors along the Belt-Road route, and we treat each region of six economic corridors (excluding China) as a single partner, r.
The number of the BRI participating countries increased to 65 in 2019. However, due to data availability, our sample covers only 56 Belt-Road countries and 58 non-Belt-Road trading partners from 2008 to 2016. We take the Belt-Road countries in our sample as the treatment group and the 58 non-Belt-Road trading partners, including the US, the EU, Japan, and other developing economies as the control group. We exclude Hong Kong SAR, Macau SAR, and Taiwan from our sample because our focus is between China and other sovereign countries. A detailed list of the Belt-Road countries and non-Belt-Road trading partners in our sample is shown in Appendix Table A1 and Appendix Table A2 respectively.
To compute the RTP indices, we have to collect the following trade data from 2008–2016: the data of total trade (exports plus imports) between China and both its Belt-Road and non-Belt-Road partner countries, the total trade between China and the world, the total trade of China’s trading partners with the whole world, total world trade, trade between the rest of the world (excluding China) and China’s trading partners, and trade between the rest of the world (excluding China) and the whole world. All the trade data with the classification of SITC Rev.3 are sourced from the United Nations COMTRADE database.
Based on the computation of the RTP indices, we first examine the dynamics of the bilateral preferential trade links between China and the 56 Belt-Road countries. Furthermore, we also analyze the dynamics of China’s intra-regional trade preferences with the sub-regions of the six economic corridors along the Belt-Road route. The detailed Belt-Road countries involved in the six economic corridors can be seen in Appendix Table A3.

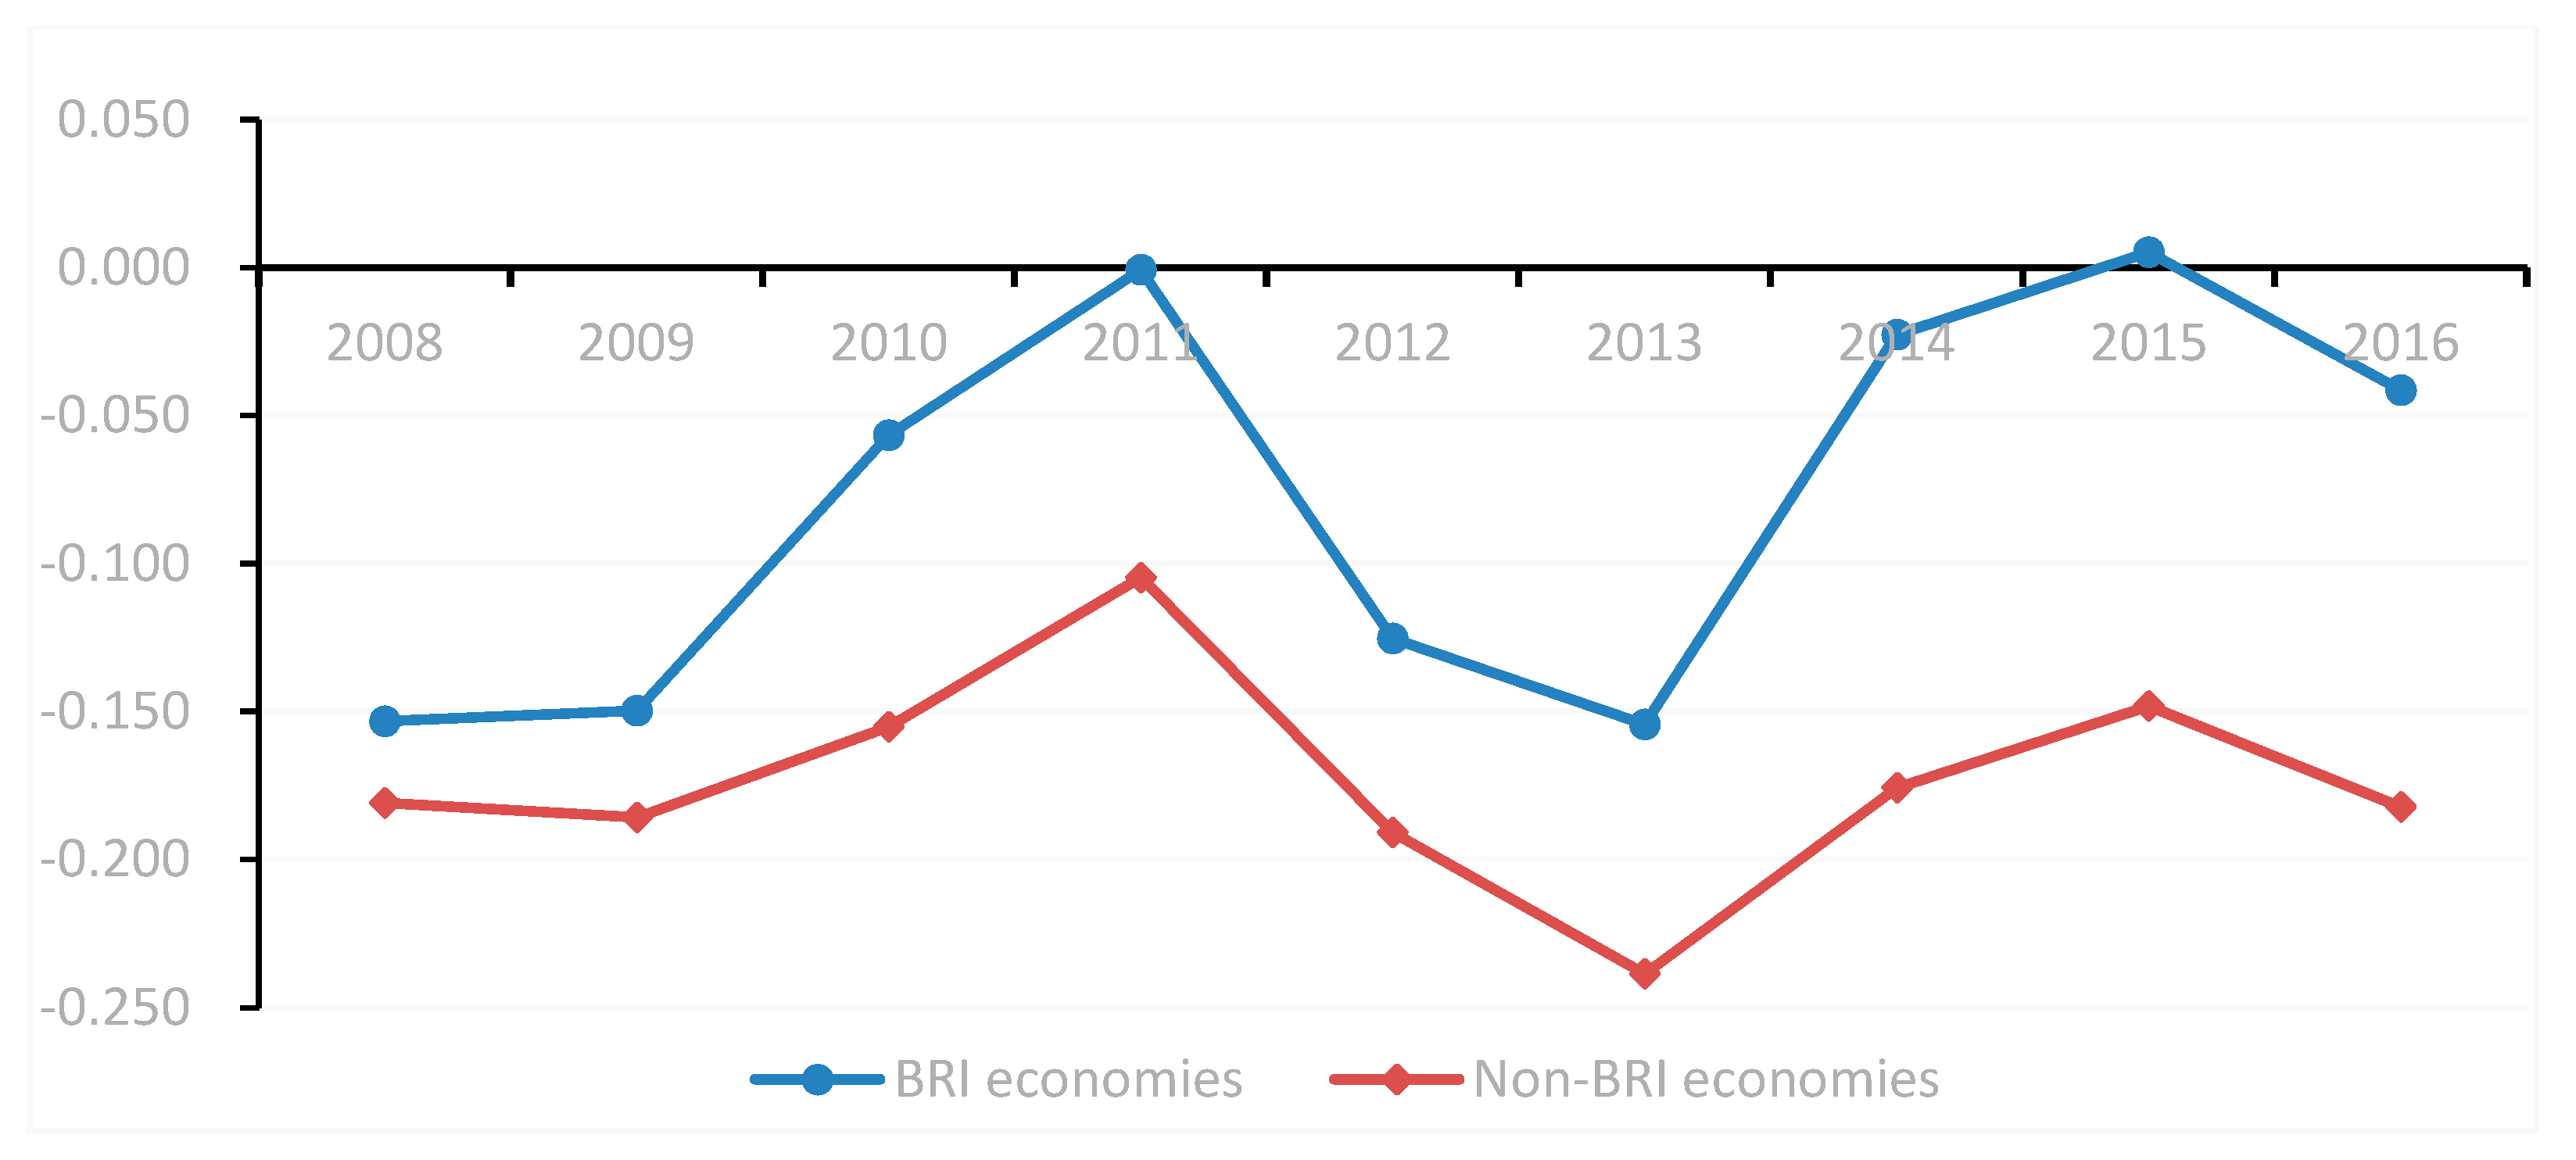
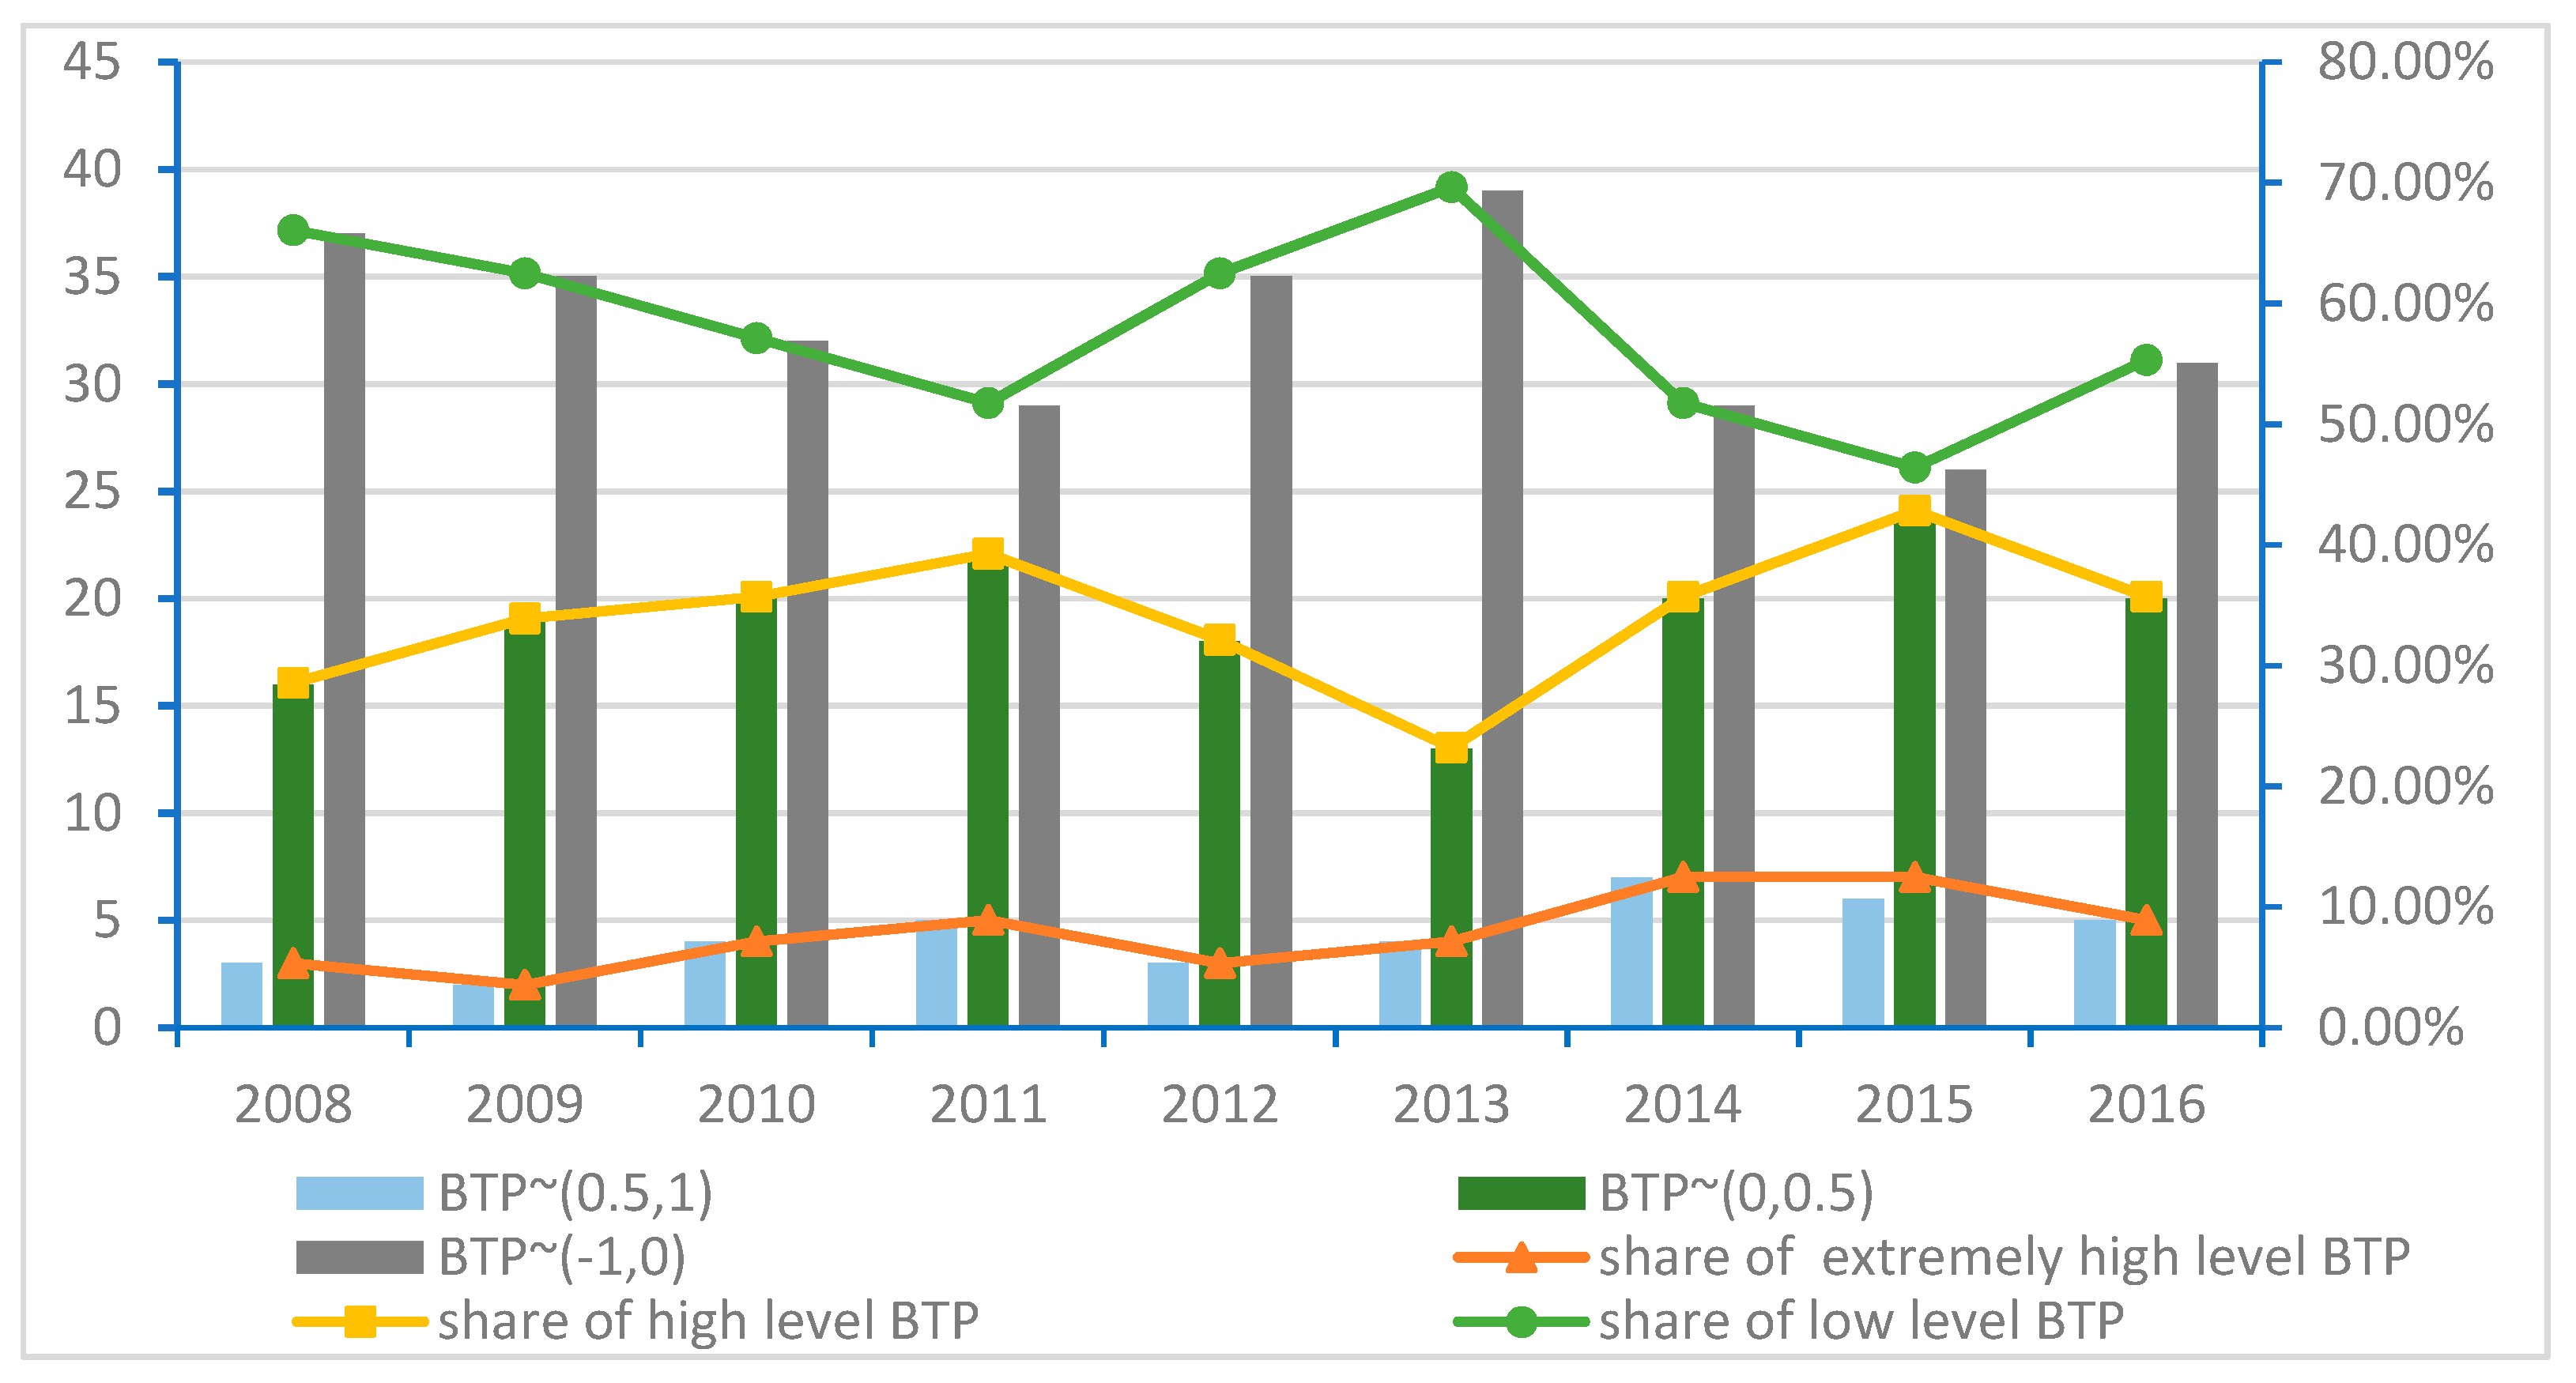
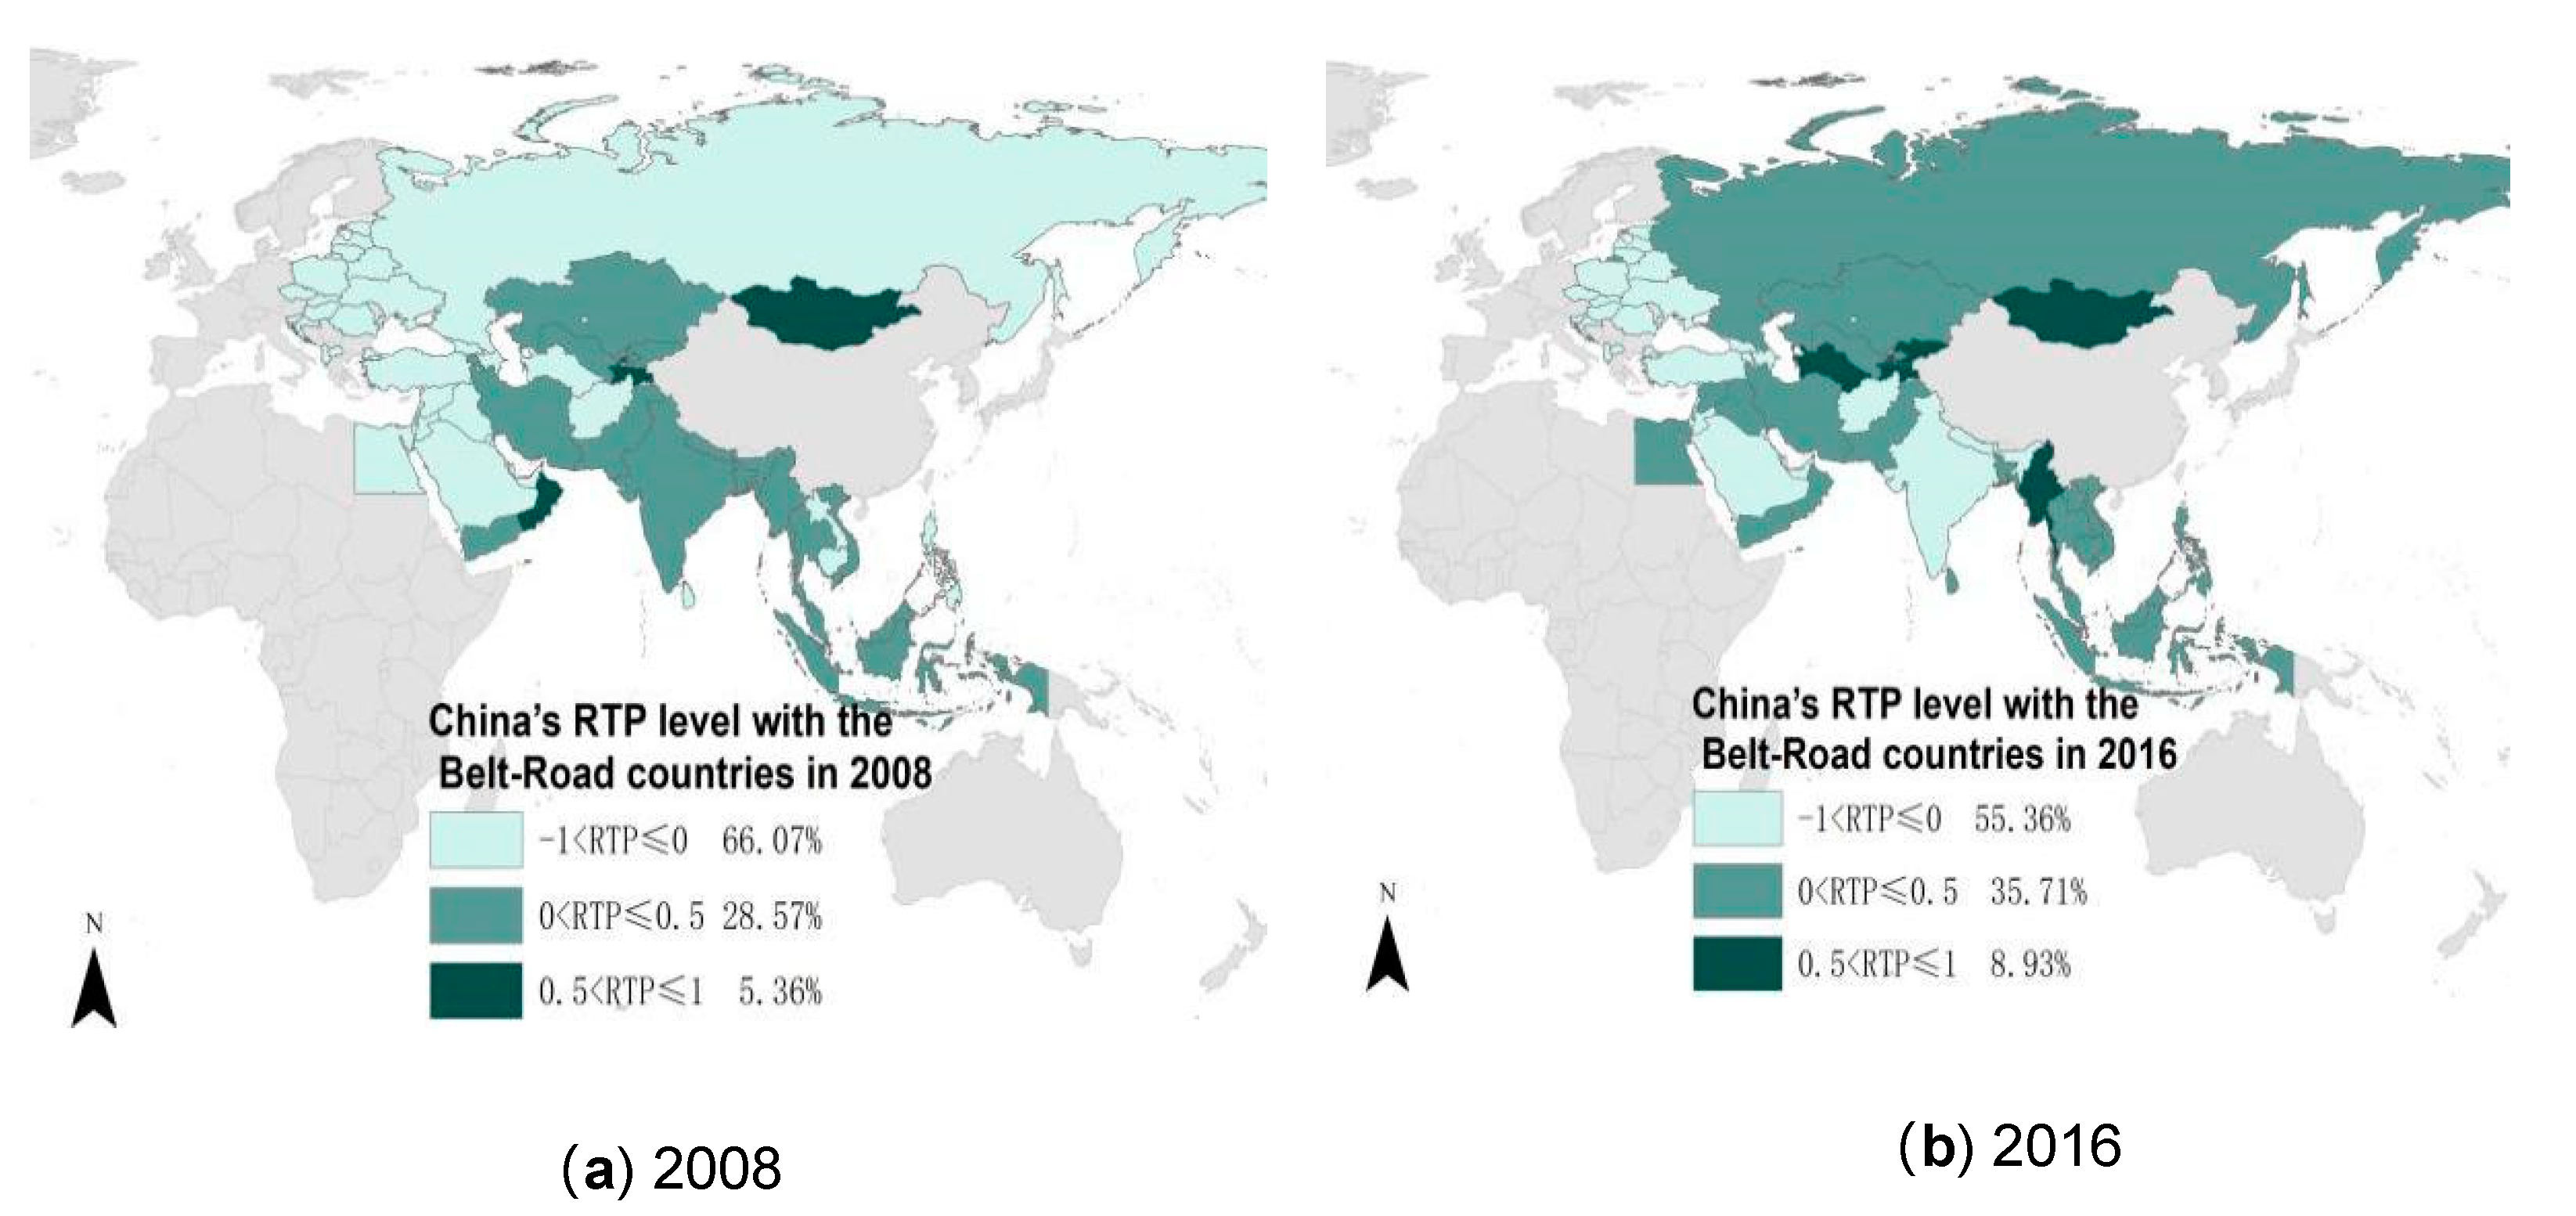
3.2. The Dynamics of Bilateral Preferential Trade Links between China and Belt-Road Countries

The statistical analysis of dynamics of the bilateral preferential trade links (measured by RTP indices) between China and the 56 Belt-Road countries involves the following steps. Firstly, we compute both the average value of China’s RTP indices with the 56 Belt-Road countries (treatment group) and the 58 non-Belt-Road trading partners (control group) from 2008 to 2016, and we plot their trend in Figure 1. Figure 1 shows that China’s average level of RTP with the Belt-Road countries grew faster than did that with non-Belt-Road countries, with the gap between two groups widening since 2013, when the initiative began.
Secondly, we investigate the detailed dynamic changes of the bilateral preferential trade links between China and the Belt-Road countries by classifying the degree of reciprocal trade preferentiality. We divide the RTP indices between China and the Belt-Road countries into three groups of interval values: (−1,0), (0,0.5), and (0.5,1). An RTP value within (−1,0) indicates a low level of trade links or preferentiality, whereas a value at (0,0.5) indicates a high level of bilateral trade links or preferentiality, a value at (0.5,1) indicates an extremely high level of trade links or preferentiality. We present the number and the percentage of the three different groups of countries in Figure 2. We also present the intuitive comparison of the number and the percentage of the three different groups of countries in 2008 to that of 2016, by visualizing the data on the map (see Figure 3).
It can be seen that the share of the “extremely high level RTP” group shows a slight yet steady increasing trend. The share of the “high-level RTP” group increased from 2013 to 2015, whereas the share of the “low-level RTP” group decreased during the same time (see Figure 2). Furthermore, it can be seen that both the number and the percentage of the “extremely high-level RTP” group and “high-level RTP” group increased significantly in 2016 compared to those of 2008 (see Figure 3). All the statistical results show that China and the Belt-Road countries tended to trade more intensively with each other than with third countries after the BRI began in 2013.

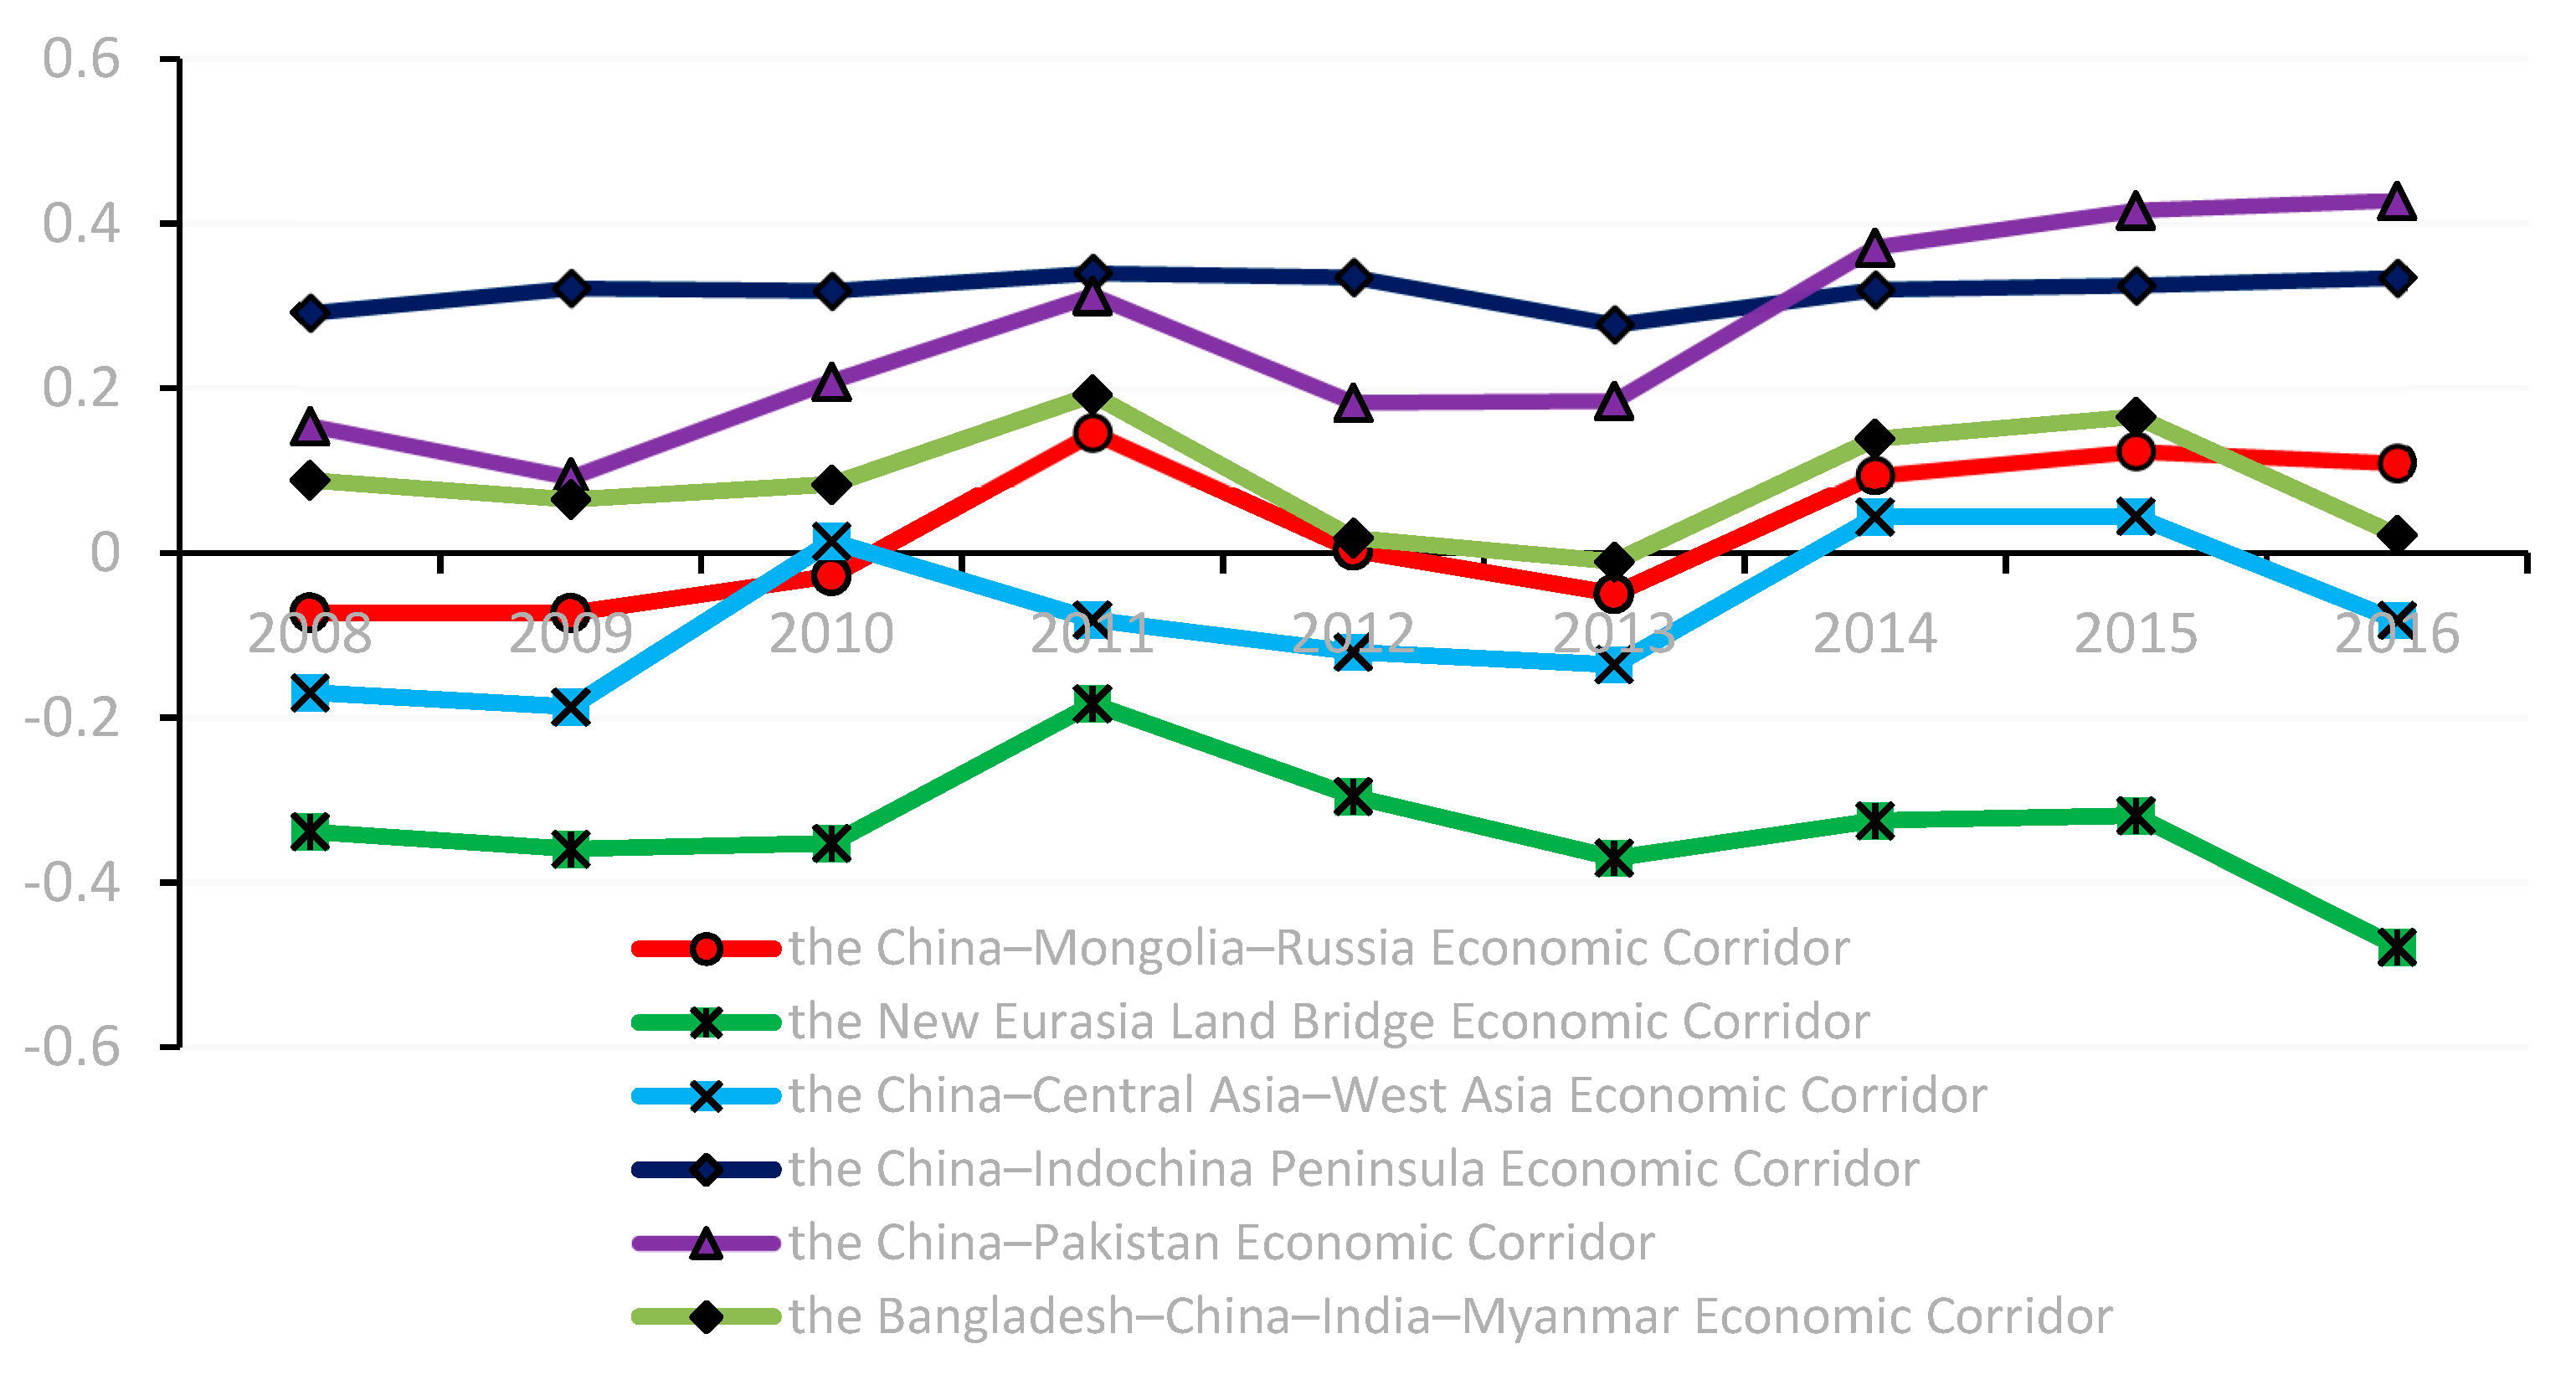
3.3. Dynamics of RTP between China and the Six Economic Corridors

In this section, we specifically analyze heterogeneous dynamics of China’s intra-regional trade preferences with the six economic corridors in the Belt-Road area measured by RTPir indices. As shown in Figure 4, the China–Pakistan Economic Corridor and the China–Indochina Peninsula Economic Corridor witnessed the highest intra-regional RTP during 2008–2016, with a slight increase after 2013. This finding indicates an obvious intensification in intra-regional trade preferences of China toward the economic corridors of the CPEC and the CICPEC. To be more exact, the finding indicates that China and the rest of the countries (ASEAN countries) involved in the region of the CICPEC have closer intra-regional trade preferentiality than is the case with other economic corridors, which implies an obvious trend of trade regionalization in the CICPEC. The main reason is that these two economic corridors are supported by free trade agreements (FTAs) between China and Pakistan and China and ASEAN, respectively, where trade facilitation was strengthened by the implementation of the BRI and, hence, the intra-regional trade preferences were intensified.
However, the NELBEC witnessed the lowest intra-regional RTP, indicating that the intra-regional trade preferentiality between China and the rest of the countries (CIS countries and central European countries) involved in the corridor is quite low in the sample period. This implies that there is a great potential for intensifying the trade links between China and the rest of the countries along the NELBEC.

4. Model Specifications

To quantitatively gauge the effects of the BRI on bilateral trade intensity between China and the Belt-Road countries, we employ the DID methodology. The Belt-Road countries belong to the treatment group, and the non-Belt-Road countries are in the control group. As the Belt-Road Initiative was unveiled for the first time on 7 September 2013, the period from 2014 to 2016 is considered as the post-shock period, and, correspondingly, the period from 2010 to 2013 is taken as the pre-shock period.
The DID regression equation is specified as follows
R T P c j t = β 0 + β 1 B R I j t P o s t t + β 2 δ j + β 3 η t + β 4 Z j t + ε j t
where RTPcjt is the reciprocal trade preference between China and its trading partner j in year t. BRIjt is a dummy variable that has a value of 1 if a sample country is involved in the Belt-Road Initiative, and 0 otherwise; Postt is a dummy variable that takes the value 1 if the time interval is the post-shock period of 2014–2016, and 0 otherwise; BRIjt*Postt is the interaction term that takes the value 1 if country j belongs to the treatment group for the post-shock period, and 0 otherwise; δ j . represents country-fixed effects; η t represents year-fixed effects; Ζ j t represents other control variables, which help to isolate the effect of the implementation of the BRI on RTP; and ε i t denotes the regression error term.
Following Zhang et al. [53], Gaulier et al. [54] and Shen [55], who investigate the determinants of bilateral trade linkages, we choose the following control variables shown in Table 1. The summary statistics of the key variables are presented in Table 2.
It is noted that the key assumptions of the DID estimation approach are satisfied. The first assumption is the random sampling of the treatment group. We think this assumption is satisfied due to the following reasons: (1) according to Huang [56], the BRI, as an open initiative to revive the ancient Silk Road, is more limited in geographical coverage than many of the existing international arrangements, so that the countries involved in the BRI are determined primarily by their geographical location in the history; (2) just as Zhang et al. [24] and Yu et al. [43] point out, many regions along the Belt-Road route such as the Middle East and South Asia are unstable and crisis-prone, which is not conducive to FDI or infrastructure investment. What is more, some neighboring countries do not trust China [5] and could even become future potential rivals in international affairs [43]. Therefore, we argue that there is no evidence indicating that China may have chosen the BRI’s participating countries based on economic and political considerations. The second assumption is the parallel trend assumption underlying the DID estimation to account for unobserved variables. Figure 1 provides graphical support for the parallel trend assumption. Figure 1 shows that China’s RTPs with the 56 Belt-Road countries (treatment group) and the 58 non-Belt-Road countries (control group) experience almost the same growth trends before 2013. After the implementation of the BRI, the average growth of RTP between China and the treatment group increased tremendously compared to that between China and the control group. However, the two groups still exhibit almost the same parallel trend.

5. Empirical Results

5.1. Baseline Regression Results

To conduct further analysis, we have run an ordinary least squares regression by adopting the DID approach specified in Equation (1). As FTA and border do not change over time, running a fixed effect panel regression model will omit the estimated coefficient of FTA and border because of collinearity. Therefore, the random effect panel regression models are used in all estimations.
The baseline regression results are reported in Table 3. The results in the column (1) of Table 3 show that the effect of the BRI on RTP is significantly positive, as reflected by the positive and statistically significant estimated coefficient of the interaction term BRI*Postt. Columns (2–5) report the estimation results with additional control variables, including the technology gap, the gap in real GDP per capita between China and the trading partner, the infrastructure level and Economic Freedom of China’s trading partners, and the Outward FDI from China. The coefficients of the interaction term BRI*Postt are still positive and statistically significant. As to the magnitude of the estimated effect of the BRI, it increased the RTP between China and the Belt-Road countries by approximately 8% more than that with the non-Belt-Road countries. The direct reason for this is that the BRI facilitates trade flows between China and the Belt-Road countries. Foo et al. [6] and Yu et al. [43] also find that China’s trade with the Belt-Road countries increased significantly after the BRI began.

5.2. Extended Regression Results

Next, we further examine the heterogeneous effects of the BRI on RTP across regions of the six economic corridors along the Belt-Road route. Column (1) and Column (5) in Table 4 demonstrate that the effects of the BRI on strengthening China’s intra-regional RTP with the economic corridors of the CICPEC, the CPEC, the CCWAEC, and the BCIMEC are significantly positive, but the effects are insignificant for the other two economic corridors. To summarize, our empirical results show that the heterogeneous effect of the BRI on intra-regional RTP differs across regions, which indicates that the intra-regional trade preferences between China and the economic corridors of the CICPEC, the CPEC, the CCWAEC, and the BCIMEC have been more significantly intensified than have those with the other two economic corridors. Similarly, Foo et al. [6] also show that the BRI further facilitates the bilateral trade partnerships between ASEAN countries that are involved in the CICPEC and China.

5.3. Robustness Checks

This section performs the robustness checks. First, we conduct a placebo test to examine what happens if the “post” dummy is set differently, for instance, 2 or 3 years before the treatment. Considering that there may be other random factors causing the differences in RTP indices between the control and treatment groups, the placebo test is employed to check if the effects can be replicated for different years of the treatment, assuming that the BRI was proposed in either 2011 or 2012, rather than 2013. We rerun the baseline regression model, keeping other specifications the same. Table 5 shows the results of the placebo test. It can be found that the coefficients of the interaction variables BRI*Postt−2 in columns (1,2) are statistically insignificant. The coefficients of the interaction variables BRI*Postt−3 in columns (3,4) are also statistically insignificant. All the findings suggest that the positive BRI impact is not valid when assuming the BRI was proposed in either 2011 or 2012. In other words, the positive effects of the BRI cannot be replicated for different years of the treatment. The above placebo test results imply that the BRI has a significantly positive impact on the bilateral trade preferentiality between China and the Belt-Road countries.
Considering that the time nodes when the Belt-Road countries respond to and participate in the BRI are different, as the BRI is a flexible regional economic integration initiative, the second robustness check is to investigate the lag effects of the BRI. We rerun the baseline regression with the lag of BRI*Postt+1 and BRI*Postt+2 and the results are reported in Table 6. The coefficients of the interaction variables of BRI*Postt+1 and BRI*Postt+2 are significantly positive (see columns (2) and (4) in Table 6). These results show that the BRI also had a significant positive impact on the bilateral trade preferentiality between China and the Belt-Road countries over the two years after 2013, when the BRI was proposed. The findings also imply that the BRI has a stable and long-term positive effect on intensifying preferential trade links between China and the Belt-Road countries.

6. Conclusions

This study attempts to examine the policy impact of the Belt and Road Initiative (BRI) on preferential trade links between China and the Belt-Road countries. The bilateral trade preference level between China and 56 Belt-Road countries and 58 non-Belt-Road countries from 2008 to 2016 was calculated. Our statistical results show that China’s average level of bilateral revealed trade preference (RTP) with the Belt-Road countries grew faster than did that with non-Belt-Road countries, with the gap widening since 2013, when the initiative was adopted. Furthermore, the difference-in-differences methodology is employed to further gauge the policy impact of the BRI. We find that the RTP level between China and the Belt-Road countries grew approximately 8% faster than did that with the non-Belt-Road countries after the BRI began. We also confirm the existence of the regional heterogeneity of the BRI effect and find that the intra-regional trade preferences between China and the economic corridors of the China–Indochina Peninsula Economic Corridor (CICPEC), the China–Pakistan Economic Corridor (CPEC), the China–Central Asia–West Asia Economic Corridor (CCWAEC), and the Bangladesh–China–India–Myanmar Economic Corridor (BCIMEC) have been more intensified than have those with the other two economic corridors. All these results provide strong evidence for the efficiency of BRI in strengthening reciprocal trade links between China and the Belt-Road countries.
We argue that the empirical findings in the paper may contribute to a comprehensive discussion of further strengthening economic cooperation, especially trade integration, under the institutional framework of the BRI. Given the current pressure of global economic downturn and uncertainty, it is vital to strengthen the bilateral trade partnership between China and Belt-Road countries. Thus, the policymakers from China and the Belt-Road countries should further coordinate international trade development policies, focusing on achieving a high level of trade facilitation and creating a more stable trading environment along the Belt-Road route. As for China, it will make sense for Chinese policymakers to formulate region-specific economic cooperation plans according to the regional heterogeneity of the BRI effect. The priority should be to deepen economic cooperation in the CICPEC, the CPEC, the CCWAEC, and the BCIMEC. The docking of infrastructure construction projects and national development plans of the countries along these economic corridors during the process of promoting infrastructure connectivity should be emphasized. In particular, emphasis should be placed on upgrading the strategic partnership between China and the ASEAN countries by promoting the deep integration of the BRI and the “ASEAN Connectivity Master Plan 2025”, focusing on helping the less-developed ASEAN countries with infrastructure construction to boost trade and foreign direct investment flows along the CICPEC.
The paper conducts a preliminary study by identifying a causal relationship between the BRI and the bilateral trade preferences between China and Belt-Road countries. We argue that the empirical findings of the paper may contribute to a comprehensive discussion of bilateral trade partnerships between China and Belt-Road economies. The mechanics through which the BRI strengthens the reciprocal trade preference between China and Belt-Road countries are worth discussing. Although the BRI is just unfolding, the benefit is becoming obvious and is ready to be measured. Over time, we will obtain more evidence of various impacts of this grand project on regional trade integration. This paper has several limitations and can be expanded on through further research in the following directions. First, it is worth systematically discussing the mechanics, for instance facility connectivity, policy coordination or financial integration, through which the BRI strengthens the reciprocal trade preference between China and Belt-Road countries. Second, as this study analyzes the effects of the BRI on bilateral trade preferentiality from the country-specific and regional perspective, it is worth further research distinguishing the effects of the BRI on the trade preferentiality of various industries, for instance the machinery and electronics industry between China and the Belt-Road countries. Lastly, further research can be conducted to investigate how the BRI impacts the trade gains of the Belt-Road countries from participating in the regional global value chains. We leave those to future study.

Author Contributions

C.Y. and L.A. conceived and designed the research; C.Y. performed the research and wrote the original draft; Z.Y. led data collection, performed the raw data analysis; R.Z. gave advice onto the econometric models; C.Y., L.A. and R.Z. revised and verified the paper. All authors have read and agreed to the published version of the manuscript.

Funding

Financial support from the National Social Science Foundation of China (grant number 16BJL102) and Faculty Scholarship Development Grant of University of North Florida are gratefully acknowledged.

Acknowledgments

The authors thank the anonymous reviewers for their valuable comments for improving this paper. The authors are particularly grateful to the editor, Daniel Pacurar, for his detailed comments on the paper throughout the review process.

Conflicts of Interest

The authors declare no conflict of interest.

Appendix A

Table A1. RTP indices between the China and the Belt-Road countries.
Country20082010201120122013201420152016
Afghanistan−0.145−0.498−0.293−0.290−0.8040.0310.105−0.341
Albania−0.169−0.293−0.161−0.319−0.322−0.252−0.230−0.182
Armenia0.062−0.4720.1800.046−0.0390.1630.186−0.269
Azerbaijan−0.528−0.520−0.707−0.708−0.806−0.722−0.714−0.528
Bahrain−0.254−0.4440.034−0.250−0.275−0.029−0.125−0.625
Bangladesh0.2250.190−0.0600.035−0.0030.2860.1850.210
Belarus−0.491−0.661−0.371−0.440−0.412−0.596−0.211−0.647
Brunei Darussalam−0.700−0.058−0.272−0.463−0.611−0.586−0.463−0.164
Cambodia−0.0960.1780.116−0.0430.0210.1760.1320.301
Croatia−0.315−0.417−0.264−0.385−0.657−0.711−0.695−0.630
Czech Republic−0.299−0.498−0.065−0.269−0.359−0.275−0.205−0.583
Egypt−0.225−0.068−0.100−0.198−0.221−0.1300.0180.016
Estonia−0.404−0.522−0.278−0.421−0.492−0.429−0.419−0.558
Georgia−0.458−0.377−0.205−0.304−0.385−0.213−0.187−0.229
Hungary−0.435−0.373−0.343−0.464−0.549−0.519−0.539−0.516
India0.0720.0520.2060.011−0.0390.0850.119−0.075
Indonesia0.0210.2040.2420.0670.0790.1340.1640.225
Iran0.3540.418−0.0500.3490.5210.6800.6430.489
Iraq−0.8950.0480.2460.0830.229−0.0690.4000.270
Israel−0.354−0.177−0.168−0.273−0.321−0.259−0.240−0.209
Jordan−0.029−0.0390.037−0.167−0.196−0.0880.038−0.025
Kazakhstan0.2570.4740.4830.3350.3220.3170.2870.234
Kuwait−0.524−0.023−0.368−0.080−0.549−0.430−0.217−0.064
Kyrgyzstan0.3810.8070.4750.1800.2940.7840.4070.824
Lao People’s Dem. Rep.−0.0760.4900.009−0.218−0.0820.1540.2910.492
Latvia−0.792−0.444−0.743−0.791−0.810−0.785−0.734−0.497
Lebanon−0.792−0.242−0.044−0.185−0.141−0.0050.023−0.163
Lithuania−0.733−0.649−0.719−0.753−0.778−0.713−0.690−0.677
Macedonia−0.491−0.731−0.292−0.332−0.477−0.445−0.434−0.845
Malaysia0.0760.3790.2080.0220.0740.1420.1480.329
Maldives−0.598−0.336−0.185−0.326−0.351−0.221−0.0990.056
Mongolia0.8050.7560.8860.6700.7960.8800.8670.809
Myanmar0.4610.6020.5090.1970.4220.5660.6230.663
Nepal0.1060.1090.2960.032−0.0490.1530.189−0.161
Oman0.5170.3620.567−0.547−0.5180.5970.5070.455
Pakistan0.1550.2080.3130.1830.1850.3710.4160.428
Philippines−0.0270.4370.061−0.176−0.0770.0570.0630.457
Poland−0.305−0.520−0.256−0.362−0.417−0.309−0.309−0.506
Qatar−0.523−0.513−0.405−0.276−0.266−0.140−0.152−0.375
Romania−0.515−0.518−0.475−0.608−0.686−0.611−0.589−0.605
Russian Federation−0.093−0.0590.114−0.026−0.0780.0610.0890.083
Saudi Arabia−0.4200.171−0.226−0.383−0.391−0.278−0.083−0.041
Singapore0.251−0.0620.3080.1470.1530.2560.279−0.063
Slovakia−0.445−0.542−0.299−0.397−0.408−0.309−0.353−0.593
Slovenia−0.554−0.542−0.503−0.559−0.658−0.568−0.565−0.480
Sri Lanka−0.2060.0000.018−0.024−0.0290.0560.1150.105
Syria−0.070−0.0860.0610.000−0.1760.0760.2610.171
Tajikistan0.6870.6280.7890.5470.6450.7440.7000.665
Thailand0.1300.1920.3070.1570.1290.2310.2450.205
Turkey−0.227−0.325−0.051−0.201−0.214−0.136−0.118−0.407
Turkmenistan−0.1620.3450.7750.6570.7620.7940.8270.702
Ukraine−0.406−0.200−0.192−0.223−0.242−0.173−0.159−0.214
United Arab Emirates−0.263−0.155−0.345−0.183−0.221−0.002−0.250−0.337
Uzbekistan0.0210.2440.2800.2200.3530.4300.3760.289
Vietnam0.4180.4300.4190.4120.4080.4210.4190.451
Yemen0.4390.4730.4640.2820.0690.090−0.0480.362
Source: Calculated by the authors based on United Nations COMTRADE data.
Table A2. RTP indices between the China and the non-Belt-Road countries.
Country20082010201120122013201420152016
Algeria−0.394−0.269−0.213−0.207−0.249−0.159−0.070−0.073
Bolivia−0.323−0.1660.027−0.073−0.259−0.0460.0600.067
Argentina0.1040.0390.124−0.043−0.0200.0020.1180.022
Australia0.3200.4820.4780.3830.4720.4210.3920.436
Austria−0.511−0.474−0.398−0.490−0.543−0.463−0.496−0.553
Belgium−0.486−0.489−0.373−0.493−0.549−0.520−0.535−0.586
Botswana0.167−0.533−0.073−0.680−0.836−0.829−0.811−0.873
Brazil0.0640.2050.2750.1710.2240.1950.2030.187
Cameroon−0.1910.0360.0090.040−0.1100.1690.1640.060
Canada−0.222−0.186−0.090−0.176−0.256−0.211−0.208−0.268
Chile0.2350.4380.4030.3260.3660.3470.3250.429
Colombia−0.180−0.0450.014−0.0030.0010.1330.044−0.020
Costa Rica−0.267−0.493−0.411−0.518−0.498−0.449−0.245−0.276
Cyprus−0.547−0.590−0.617−0.715−0.780−0.662−0.651−0.680
Denmark−0.388−0.342−0.312−0.395−0.464−0.395−0.369−0.416
Dominican Republic−0.156−0.1000.038−0.088−0.175−0.132−0.099−0.174
Ecuador−0.240−0.337−0.053−0.251−0.123−0.0790.004−0.091
Ethiopia0.6420.6040.4730.4700.5630.6170.6510.663
Finland−0.316−0.281−0.385−0.310−0.418−0.379−0.377−0.413
French−0.369−0.321−0.209−0.291−0.386−0.322−0.309−0.373
Germany−0.239−0.134−0.009−0.168−0.188−0.143−0.185−0.257
Ghana−0.100−0.1270.020−0.043−0.1530.2540.351−0.010
Greece−0.307−0.323−0.307−0.434−0.495−0.431−0.445−0.450
Ireland−0.497−0.621−0.578−0.623−0.672−0.592−0.621−0.621
Italy−0.380−0.307−0.238−0.406−0.488−0.418−0.416−0.484
Jamaica−0.464−0.381−0.300−0.378−0.385−0.247−0.199−0.324
Japan0.4280.4540.4760.3280.3680.3340.3120.332
Luxembourg−0.805−0.789−0.751−0.760−0.799−0.751−0.753−0.773
Madagascar0.4270.1130.0370.012−0.047−0.0170.0160.090
Mali0.3070.2500.158−0.016−0.317−0.314−0.382−0.118
Malta−0.811−0.771−0.745−0.793−0.845−0.852−0.813−0.806
Mauritius−0.039−0.0180.0350.133−0.059−0.012−0.0220.043
Mexico−0.151−0.094−0.019−0.118−0.177−0.111−0.115−0.178
Morocco−0.324−0.212−0.263−0.343−0.386−0.319−0.344−0.365
Mozambique−0.508−0.613−0.286−0.177−0.435−0.416−0.217−0.430
Namibia0.197−0.405−0.428−0.463−0.563−0.460−0.305−0.555
Netherlands−0.390−0.357−0.309−0.411−0.416−0.386−0.412−0.473
New Zealand0.0790.1820.2360.2230.2890.2650.2210.274
Nicaragua−0.336−0.335−0.278−0.298−0.353−0.173−0.214−0.151
Nigeria−0.430−0.155−0.083−0.011−0.268−0.1790.134−0.056
Norway−0.516−0.428−0.337−0.449−0.482−0.377−0.334−0.407
Panama−0.287−0.141−0.054−0.257−0.372−0.294−0.222−0.255
Paraguay0.3860.4550.4470.3240.2050.2000.1350.132
Peru0.2480.3280.3020.2510.2550.2770.3050.354
Portugal−0.701−0.692−0.643−0.648−0.736−0.669−0.670−0.707
Republic of Korea0.5290.5030.4630.3640.4170.3670.3530.399
Senegal−0.343−0.289−0.367−0.541−0.429−0.425−0.265−0.297
South Africa−0.0770.0670.100−0.0630.041−0.048−0.0040.020
Spain−0.298−0.329−0.273−0.383−0.474−0.384−0.372−0.417
Sweden−0.534−0.424−0.398−0.490−0.519−0.467−0.453−0.512
Switzerland−0.641−0.593−0.531−0.518−0.456−0.362−0.337−0.311
The United States0.2450.2800.2990.1900.1800.2040.2120.192
Tunisia−0.601−0.486−0.415−0.405−0.537−0.437−0.407−0.436
Uganda0.0760.0560.1820.2160.0270.2540.3120.288
United Kingdom−0.230−0.158−0.100−0.256−0.335−0.172−0.150−0.279
United Republic of Tanzania0.1780.2520.1930.019−0.0350.1060.1350.150
Uruguay−0.100−0.0100.037−0.0230.0970.0750.0440.007
Zimbabwe−0.4290.076−0.043−0.300−0.261−0.305−0.251−0.242
Source: Calculated by the authors based on United Nations COMTRADE data.
Table A3. BRI-participating Countries and the six economic corridors.
RegionCountries
the New Eurasia Land Bridge Economic Corridor (NELBEC)Albania, Belarus, Croatia, Czech Republic, Estonia, Hungary, Kazakhstan, Latvia Lithuania Macedonia, Poland, Romania, Slovakia, Slovenia, Ukraine
the China-Central Asia-West Asia Economic Corridor (CCWAEC)Afghanistan, Armenia, Azerbaijan, Bahrain, Georgia, Iran, Iraq, Israel, Jordan, Kazakhstan, Kuwait, Kyrgyzstan, Lebanon, Turkey, Turkmenistan, Oman, Saudi Arabia, T
ajikistan, Qatar, Uzbekistan, United Arab Emirates, Syria, Yemen
the China-Indochina Peninsula Economic Corridor (CICPEC)Brunei, Cambodia, Malaysia, Thailand, Singapore, Indonesia, Laos, Vietnam, Myanmar, Philippines
The China-Mongolia-Russia Economic Corridor (CMREC)Mongolia, Russia
the Bangladesh-China-India-Myanmar Economic Corridor (BCIMEC)Bangladesh, India, Myanmar, Maldives, Nepal,
Sri Lanka
China–Pakistan Economic Corridor (CPEC)Pakistan
Notes: The classification of the countries involved in the six economic corridors is mainly based on the authors’ own interpretation of the Vision and Actions on Jointly Building the Silk Road Economic Belt and 21st Century Maritime Silk Road Report, issued by The National Development and Reform Commission (NDRC) of China on 28 March 2015.The authors also referred to the specification of the six economic corridors by OECD Business and Finance Outlook 2018. See “China’s Belt and Road Initiative in the Global Trade, Investment and Finance Landscape”. OECD Business and Finance Outlook, OECD, 2018. Available online: https://www.oecd.org/finance/Chinas-Belt-and-Road-Initiative-in-the-global-trade-investment-and-finance-landscape.pdf.

References

  1. Chung, C.P. What are the strategic and economic implications for South Asia of China’s maritime silk road initiative? Pac. Rev. 2017, 31, 315–332. [Google Scholar] [CrossRef]
  2. Khan, M.K.; Sandano, I.A.; Pratt, C.B.; Farid, T. China’s Belt and Road Initiative: A Global Model for an Evolving Approach to Sustainable Regional Development. Sustainability 2018, 10, 4234. [Google Scholar] [CrossRef] [Green Version]
  3. Flint, C.; Zhu, C. The geopolitics of connectivity, cooperation, and hegemonic competition: The belt and road initiative. Geoforum 2019, 99, 95–101. [Google Scholar] [CrossRef]
  4. Lin, Y. The belt and road and a new model of international development cooperation. In China’s Belt and Road Initiatives; Liu, W., Ed.; Springer: Singapore, 2018. [Google Scholar]
  5. Zhao, H. Institute of Southeast Asian studies. In China’s New Maritime Silk Road: Implications and Opportunities for Southeast Asia: Trends in Southeast Asia; ISEAS: Singapore, 2015. [Google Scholar]
  6. Foo, N.; Lean, H.H.; Salim, R. The impact of China’s one belt one road initiative on international trade in the ASEAN region. North Am. J. Econ. Financ. 2019. [Google Scholar] [CrossRef]
  7. Ehizuelen, M.M.O. More African countries on the route: The positive and negative impacts of the belt and road initiative. Transnatl. Corp. Rev. 2017, 9, 341–359. [Google Scholar] [CrossRef]
  8. Ehizuelen, M.M.O.; Abdi, H.O. Sustaining China-Africa relations: Slotting Africa into China’s one belt, one road initiative makes economic sense. Asian J. Comp. Pol. 2018, 3, 285–310. [Google Scholar] [CrossRef]
  9. Ndzendze, B.; Monyae, D. China’s Belt and Road Initiative: Linkages with the African union’s agenda 2063 in historical perspective. Transnatl. Corp. Rev. 2019, 11, 38–49. [Google Scholar] [CrossRef]
  10. China’s Trade with BRI Countries Surges to $1.34 trillion in 2019. The Economic Times, 15 January 2020. Available online: https://economictimes.indiatimes.com/news/international/business/chinas-trade-with-bri-countries-surges-to-1-34-trillion-in2019/articleshow/73271222.cms?utm_source=contentofinterest&utm_medium=text&utm_campaign=cppst(accessed on 20 March 2020).
  11. China’s Foreign Trade with Belt & Road Countries Robust in 2019. Business Reporting Desk. Available online: https://www.beltandroad.news/2020/01/15/chinas-foreign-trade-with-belt-road-countries-robust-in-2019/ (accessed on 15 January 2020).
  12. The Advancement of Construction of the Six Economic Corridors. 26 April 2019. Available online: http://www.cssn.cn/jjx/jjx_zt/jjx_zt_ydyl2019/jjx_zt_ydyl2019_gtgzhzxd/201904/t20190426_4870885.shtml (accessed on 22 October 2019). (In Chinese).
  13. Rana, P.B. Trade intensity and business cycle synchronization: The case of east Asian Countries. Singap. Econ. Rev. 2008, 53, 279–292. [Google Scholar] [CrossRef]
  14. Rana, P.B.; Cheng, T.; Chia, W.M. Trade intensity and business cycle synchronization: East Asia versus Europe. J. Asian Econ. 2012, 23, 701–706. [Google Scholar] [CrossRef]
  15. Frankel, J.A.; Rose, A.K. The endogeneity of the optimum currency area criteria. Econ. J. 1998, 108, 1009–1025. [Google Scholar] [CrossRef]
  16. Calderon, C.; Chong, A.; Stein, E. Trade intensity and business cycle synchronization: Are developing countries any different? J. Int. Econ. 2007, 71, 2–21. [Google Scholar] [CrossRef] [Green Version]
  17. Juvenal, L.; Monteiro, P.S. Trade and synchronization in a multi-country economy. Eur. Econ. Rev. 2017, 92, 385–415. [Google Scholar] [CrossRef] [Green Version]
  18. Grossman, V.; Enrique, M.G.; Wynne, M.A.; Zhang, R. Ties That Bind: Estimating the Natural Rate of Interest for Small Open Economies; Federal Reserve Bank of Dallas Globalization and Monetary Policy Institute: Dallas, TX, USA, 2019. [Google Scholar]
  19. Wynne, M.A.; Zhang, R. Measuring the world natural rate of interest. Econ. Inq. 2018, 56, 530–544. [Google Scholar] [CrossRef] [Green Version]
  20. Zysman, J.; Doherty, E.; Schwartz, A. Tales from the global economy: Cross-national production networks and the reorganisation of the European Economy. Struct. Chang. Econ. Dyn. 1997, 8, 45–85. [Google Scholar] [CrossRef] [Green Version]
  21. Brülhart, M.; Thorpe, M. East-Asian export growth, intra-industry trade and adjustment. Asia Pac. J. Econ. Bus. 1999, 3, 34–47. [Google Scholar]
  22. Önder, A.S.; Yilmazkuday, H. Trade partner diversification and growth: How trade links matter. J. Macroecon. 2016, 50, 241–258. [Google Scholar] [CrossRef] [Green Version]
  23. Zhang, J. Oil and gas trade between China and countries and regions along the “Belt and Road”: A panoramic perspective. Energy Policy 2019, 129, 1111–1120. [Google Scholar] [CrossRef]
  24. An, L.; Wynne, M.A.; Zhang, R. Shock-Dependent Exchange Rate Pass-Through: Evidence Based on a Narrative Sign Approach; Federal Reserve Bank of Dallas Globalization and Monetary Policy Institute: Dallas, TX, USA, 2020. [Google Scholar]
  25. Iapadre, L.; Tironi, F. Measuring Trade Regionalisation: Case of Asia; UNU-CRIS Working Paper: Bruges, Belgium, 2009. [Google Scholar]
  26. Iapadre, L.; Tajoli, L. Emerging countries and trade regionalization. A network analysis. J. Policy Model. 2014, 36, S89–S110. [Google Scholar] [CrossRef]
  27. Kalirajan, K.P. Indian ocean rim association for regional cooperation (IOR-ARC): Impact on Australia’s trade. J. Econ. Integr. 2000, 15, 533–547. [Google Scholar] [CrossRef] [Green Version]
  28. Fei, D. Worlding developmentalism: China’s economic zones within and beyond its border. J. Int. Dev. 2017, 29, 825–850. [Google Scholar] [CrossRef]
  29. Williams, J.; Robinson, C.; Bouzarovski, S. China’s belt and road initiative and the emerging geographies of global urbanisation. Geogr. J. 2020, 186, 128–140. [Google Scholar] [CrossRef]
  30. Zhang, C.; Xiao, C.; Liu, H. Spatial big data analysis of political risks along the belt and road. Sustainability 2019, 11, 2216. [Google Scholar] [CrossRef] [Green Version]
  31. Han, Y.; Luo, X.; Zou, J. Trade cooperation competitiveness and complementarities of China and West Asia under the background of silk road economic belt and maritime silk road strategy. World Econ. Stud. 2015, 3, 89–98. (In Chinese) [Google Scholar]
  32. Sang, B.; Yang, L. China’s trading relations with the countries of “one belt one road”: Based on the trade competitiveness and trade complementarities. Econ. Issue 2015, 8, 1–5. (In Chinese) [Google Scholar]
  33. Zhai, F. China’s belt and road initiative: A preliminary quantitative assessment. J. Asian Econ. 2018, 55, 84–92. [Google Scholar] [CrossRef]
  34. Herrero, A.G.; Xu, J.W. China’s belt and road initiative: Can Europe expect trade gains? China World Econ. 2017, 25, 84–99. [Google Scholar] [CrossRef] [Green Version]
  35. Ramasamy, B.; Yeung, M.C.H. China’s one belt one road initiative: The impact of trade facilitation versus physical infrastructure on exports. World Econ. 2019, 42, 1673–1694. [Google Scholar] [CrossRef]
  36. De Soyres, F.; Mulabdic, A.; Murray, S.; Rocha, N.; Michele, R. How much will the belt and road initiative reducetrade costs? Int. Econ. 2019, 159, 151–164. [Google Scholar] [CrossRef] [Green Version]
  37. Yang, G.; Huang, X.; Huang, J.; Chen, H. Assessment of the effects of infrastructure investment under thebelt androad initiative. China Econ. Rev. 2020, 60, 101418. [Google Scholar] [CrossRef]
  38. Devadason, P.; Govindaraje, V.C. What does the “One belt, one road” initiative mean for ASEAN? Asia Res. News 2017, 47, 189–205. [Google Scholar]
  39. Boffa, M. Policy Research Working Paper#8423. In Trade Linkages between the Belt and Road Economies; The World Bank: Washington, DC, USA, 2018. [Google Scholar]
  40. Sun, C.; Zhang, N.; Liu, Y. One belt one road initiatives and the export growth of China to the related countries. Int. Trade Issues 2017, 2, 83–96. (In Chinese) [Google Scholar]
  41. Chen, S.C.; Hou, J.; Xiao, D. “One Belt, One Road” initiative to stimulate trade in China: A counter-factual analysis. Sustainability 2018, 10, 3242. [Google Scholar] [CrossRef] [Green Version]
  42. Li, J.; Liu, B.; Qian, G. The belt and road initiative, cultural friction and ethnicity: Their effects on the export performance of SMEs in China. J. World Bus. 2019, 54, 50–359. [Google Scholar] [CrossRef]
  43. Yu, L.; Zhao, D.; Niu, H.; Lu, F. Does the belt and road initiative expand China’s export potential to countries along the belt and road? China Econ. Rev. 2020, 60, 1–16. [Google Scholar] [CrossRef]
  44. Zheng, L.; Liang, S.; Liu, L. Research on the trade links between China and the countries along the six economic corridors. Contemp. Econ. Manag. 2019, 3, 45–52. (In Chinese) [Google Scholar]
  45. Karim, M.A.; Islam, F. Bangladesh-China-India-Myanmar (BCIM) economic corridor: Challenges and prospects. Korean J. Def. Anal. 2018, 30, 283–302. [Google Scholar]
  46. Cingolani, I.; Piccardi, C.; Tajoli, L. Discovering preferential patterns in sectoral trade networks. PLoS ONE 2015, 10, e0140951. [Google Scholar] [CrossRef] [Green Version]
  47. Sequeira, S.; Hartmann, O.; Kunaka, C. Reviving Trade Routes: Evidence from the Maputo Corridor. Sub-Saharan Africa Transport Policy Program (SSATP); World Bank: Washington, DC, USA, 2014. [Google Scholar]
  48. Tinbegen, J. Shaping the World Economy-Suggestions for an International Economic Policy; Twentieth Century Fund: New York, NY, USA, 1962. [Google Scholar]
  49. Linnemann, H. An Econometric Study of World Trade Flows; North Holland: Amsterdam, The Netherlands, 1966. [Google Scholar]
  50. Kojima, K. The pattern of international trade among advanced countries. Hitotsubashi J. Econ. 1964, 5, 16–36. [Google Scholar]
  51. Balassa, B. Trade liberalization and ‘revealed’ comparative advantage. Manch. Sch. Econ. Soc. Stud. 1965, 33, 99–123. [Google Scholar] [CrossRef]
  52. Kunimoto, K. Typology of trade intensity indices. Hitotsubashi J. Econ. 1977, 17, 15–32. [Google Scholar]
  53. Zhang, J.; Witteloostuijn, A.V. economic openness and trade linkages of China: An empirical study of the determinants of Chinese trade intensities from 1993 to 1999. Rev. World Econ. 2004, 140, 254–281. [Google Scholar] [CrossRef]
  54. Gaulier, G.; Sébastien, J. Regionalism and the Regionalization of International Trade; Pitard, G., Ed.; CEPII Working Paper: Paris, France, 2004; Volume 16. [Google Scholar]
  55. Shen, G.; Zhang, X. The Evolution of parts and components trade intensity between countries and its main influencing factors within global production networks. World Econ. Stud. 2016, 6, 73–86. (In Chinese) [Google Scholar]
  56. Huang, Y. Understanding China’s belt & road initiative: Motivation, framework and assessment. China Econ. Rev. 2016, 40, 314–321. [Google Scholar]
Figure 1. Average revealed trade preference (RTP) variation trajectory. Source: Calculated by the authors based on United Nations COMTRADE data.
Sustainability 12 06747 g001
Figure 2. Changes in RTP level between China and the Belt-Road countries.
Sustainability 12 06747 g002
Figure 3. Comparison of China and the Belt-Road countries’ RTP level in 2008 to that of 2016. (Source: Constructed by the authors based on Baidu map of 2019.
Sustainability 12 06747 g003
Figure 4. Evolution of regional RTP along the Belt-Road route.
Sustainability 12 06747 g004
Table 1. Definition of the control variables.
VariablesDescriptionSource
lnTechcjLogarithm of technology gap measured by the equation: lnTechcj = Ln{1+|m(rdit)-m(rdjt)]},
where rdit and rdjt represent the number of R&D personnel in every one million people in China and country j, respectively.
World Bank database
lnPGPDcjLogarithm of the gap of real GDP per capita between China and the trading partner jWorld Bank database
lnInfrjtLogarithm of the level of information and communication Infrastructure measured by the number of domestic Internet security servers of country jWorld Bank database
lnEFjtLogarithm of Economic Freedom index measured by the annual Index of Economic Freedom Report issued by the Heritage FoundationThe Heritage Foundation
lnOFDIjtLogarithm of China’s Outward Foreign Direct Investment (FDI) to country j measured by the stock of China’s FDI to the host countryhttp://olap.epsnet.com.cn/
FTAcjDummy variable that takes a value of 1 if the FTA between China and country j entered into force, otherwise 0CEPII database
BorcjDummy variable that takes a value of 1 if country j shares a common border with China, otherwise 0Statistics from WTO
Table 2. Summary Statistics.
CountMeansdMinMax
RTPcjt798−0.110.37−0.8730.886
BRI*Postt7980.210.410.0001.000
lnTechcj7986.980.870.6418.886
lnPGPDcj7988.761.432.02211.622
lnInfrjt7986.702.810.00015.122
lnEFjt7984.130.173.0634.493
lnOFDIjt79810.072.462.48515.617
FTAcj7980.070.220.0001.000
Borcj7980.110.310.0001.000
Table 3. Estimated results of the baseline regression.
Variables(1)(2)(3)(4)(5)
BRI*Postt0.0637 ***0.0826 ***0.0823 ***0.0760 ***0.0756 ***
(3.65)(4.54)(4.55)(4.19)(4.18)
lnTechcj 0.009100.007930.008040.00682
(0.76)(0.67)(0.68)(0.58)
lnPGPDcj 0.0131 *0.0136 *0.01250.0129 *
(1.66)(1.73)(1.59)(1.65)
lnInfrjt −0.0190 **−0.0227 ***−0.0153 *−0.0191 **
(−2.16)(−2.64)(−1.76)(−2.24)
lnEFjt −0.253 **−0.269 **−0.197 *−0.214 *
(−2.21)(−2.39)(−1.73)(−1.91)
lnOFDIjt 0.0267 ***0.0233 ***0.0222 ***0.0189 ***
(3.73)(3.28)(3.09)(2.66)
FTAcj 0.521 *** 0.511 ***
(4.24) (4.27)
Borcj 0.352 ***0.340 ***
(3.89)(3.94)
Year fixed effectYYYYY
N798798798798798
Notes: T statistics are in parentheses. * p < 0.10, ** p < 0.05, *** p < 0.01.
Table 4. Estimated results of the extended regression: heterogeneous effects of the BRI across regions.
Variables(1)(2)(3)(4)(5)
BRI*Postt*area 1−0.0501 *−0.0264−0.0255−0.0329−0.0323
(−1.87)(−0.95)(−0.92)(−1.19)(−1.17)
BRI* Postt *area 20.112 ***0.121 ***0.123 ***0.117 ***0.119 ***
(4.80)(5.16)(5.25)(5.02)(5.11)
BRI* Postt *area 30.09710.124 *0.130 *0.1040.109
(1.45)(1.82)(1.92)(1.54)(1.62)
BRI* Postt *area 40.0844 ***0.112 ***0.103 ***0.101 ***0.0920 ***
(2.65)(3.42)(3.15)(3.12)(2.83)
BRI* Postt *area 50.0896 **0.0929 **0.0963 **0.0858 **0.0888 **
(2.07)(2.13)(2.21)(1.98)(2.05)
BRI* Postt *area 60.192 **0.211 **0.215 **0.191 **0.195 **
(2.05)(2.23)(2.28)(2.04)(2.07)
lnTECHcj 0.005000.003740.003880.00255
(0.42)(0.32)(0.33)(0.22)
lnPGPDcj 0.009830.01020.009140.00938
(1.25)(1.31)(1.17)(1.21)
lnInfrjt −0.0163 *−0.0202 **−0.0124−0.0162 *
(−1.87)(−2.38)(−1.42)(−1.92)
lnEFjt −0.256 **−0.271 **−0.200 *−0.214 *
(−2.26)(−2.44)(−1.77)(−1.94)
OFDIjt 0.0242 ***0.0214 ***0.0196 ***0.0168 **
(3.42)(3.05)(2.75)(2.39)
FTAcj 0.514 *** 0.504 ***
(4.29) (4.32)
Borcj 0.347 ***0.335 ***
(3.88)(3.98)
Year fixed effectYYYYY
N798798798798798
Notes: area1, area 2, area 3, area 4, area 5, and area 6 are dummies indicating whether the Belt-Road countries belong to the region of the six economic corridors, with area 1 indicating the New Eurasia Land Bridge Economic Corridor, area 2 indicating the China–Central Asia–West Asia Economic Corridor, area 3 indicating the China–Mongolia–Russia Economic Corridor, area 4 indicating the China–Indochina Peninsula Economic Corridor, area 5 indicating the Bangladesh–China–India–Myanmar Economic Corridor and area 6 indicating the China–Pakistan Economic Corridor. T statistics are in parentheses. * p < 0.10, ** p < 0.05, *** p < 0.01.
Table 5. The results of the placebo test.
(1)(2)(3)(4)
BRI*Postt−10.02420.0317
(1.27)(1.62)
BRI*Postt−2 0.02940.0295
(1.24)(1.23)
lnTECHcj 0.00334 0.00262
(0.28) (0.22)
lnPGPDcj 0.0114 0.0110
(1.45) (1.40)
lnInfrjt −0.0152 * −0.0141 *
(−1.78) (−1.66)
lnEFjt −0.207 * −0.206 *
(−1.84) (−1.83)
OFDIjt 0.0177 ** 0.0173 **
(2.44) (2.38)
FTAcj 0.509 *** 0.507 ***
(4.25) (4.23)
Borcj 0.354 *** 0.356 ***
(4.09) (4.07)
Year fixed effectYYYY
N798798798798
Notes: The variables of BRI*Postt−1 and BRI*Postt−2, respectively, represent the BRI being assumed to be proposed in either 2012 or 2011, rather than 2013. T statistics are in parentheses. * p < 0.10, ** p < 0.05, *** p < 0.01.
Table 6. The results of the lag effects of the BRI.
(1)(2)(3)(4)
BRI*Postt+10.0482 **0.0562 ***
(2.54)(2.86)
BRI*Postt+2 0.02980.0410 *
(1.24)(1.65)
lnTECHcj 0.000703 −0.00117
(0.05) (−0.08)
lnPGPDcj 0.00270 −0.00778
(0.31) (−0.73)
lnInfrjt −0.0220 ** −0.0265 ***
(−2.43) (−2.75)
lnEFjt −0.0844 −0.0400
(−0.69) (−0.29)
OFDIjt 0.0182 ** 0.0213 **
(2.32) (2.51)
FTAcj 0.503 *** 0.507 ***
(4.13) (4.07)
Borcj 0.358 *** 0.358 ***
(4.07) (3.98)
Year fixed effectYYYY
N684684570570
Notes: The variables of BRI*Postt+1 and BRI*Postt+2 represent the BRI being assumed to be popularized in 2014 and 2015, respectively. T statistics are in parentheses. * p < 0.10, ** p < 0.05, *** p < 0.01.

