Carbon Footprint of Dwelling Construction in Romania and Spain. A Comparative Analysis with the OERCO2 Tool


Abstract
1. Introduction
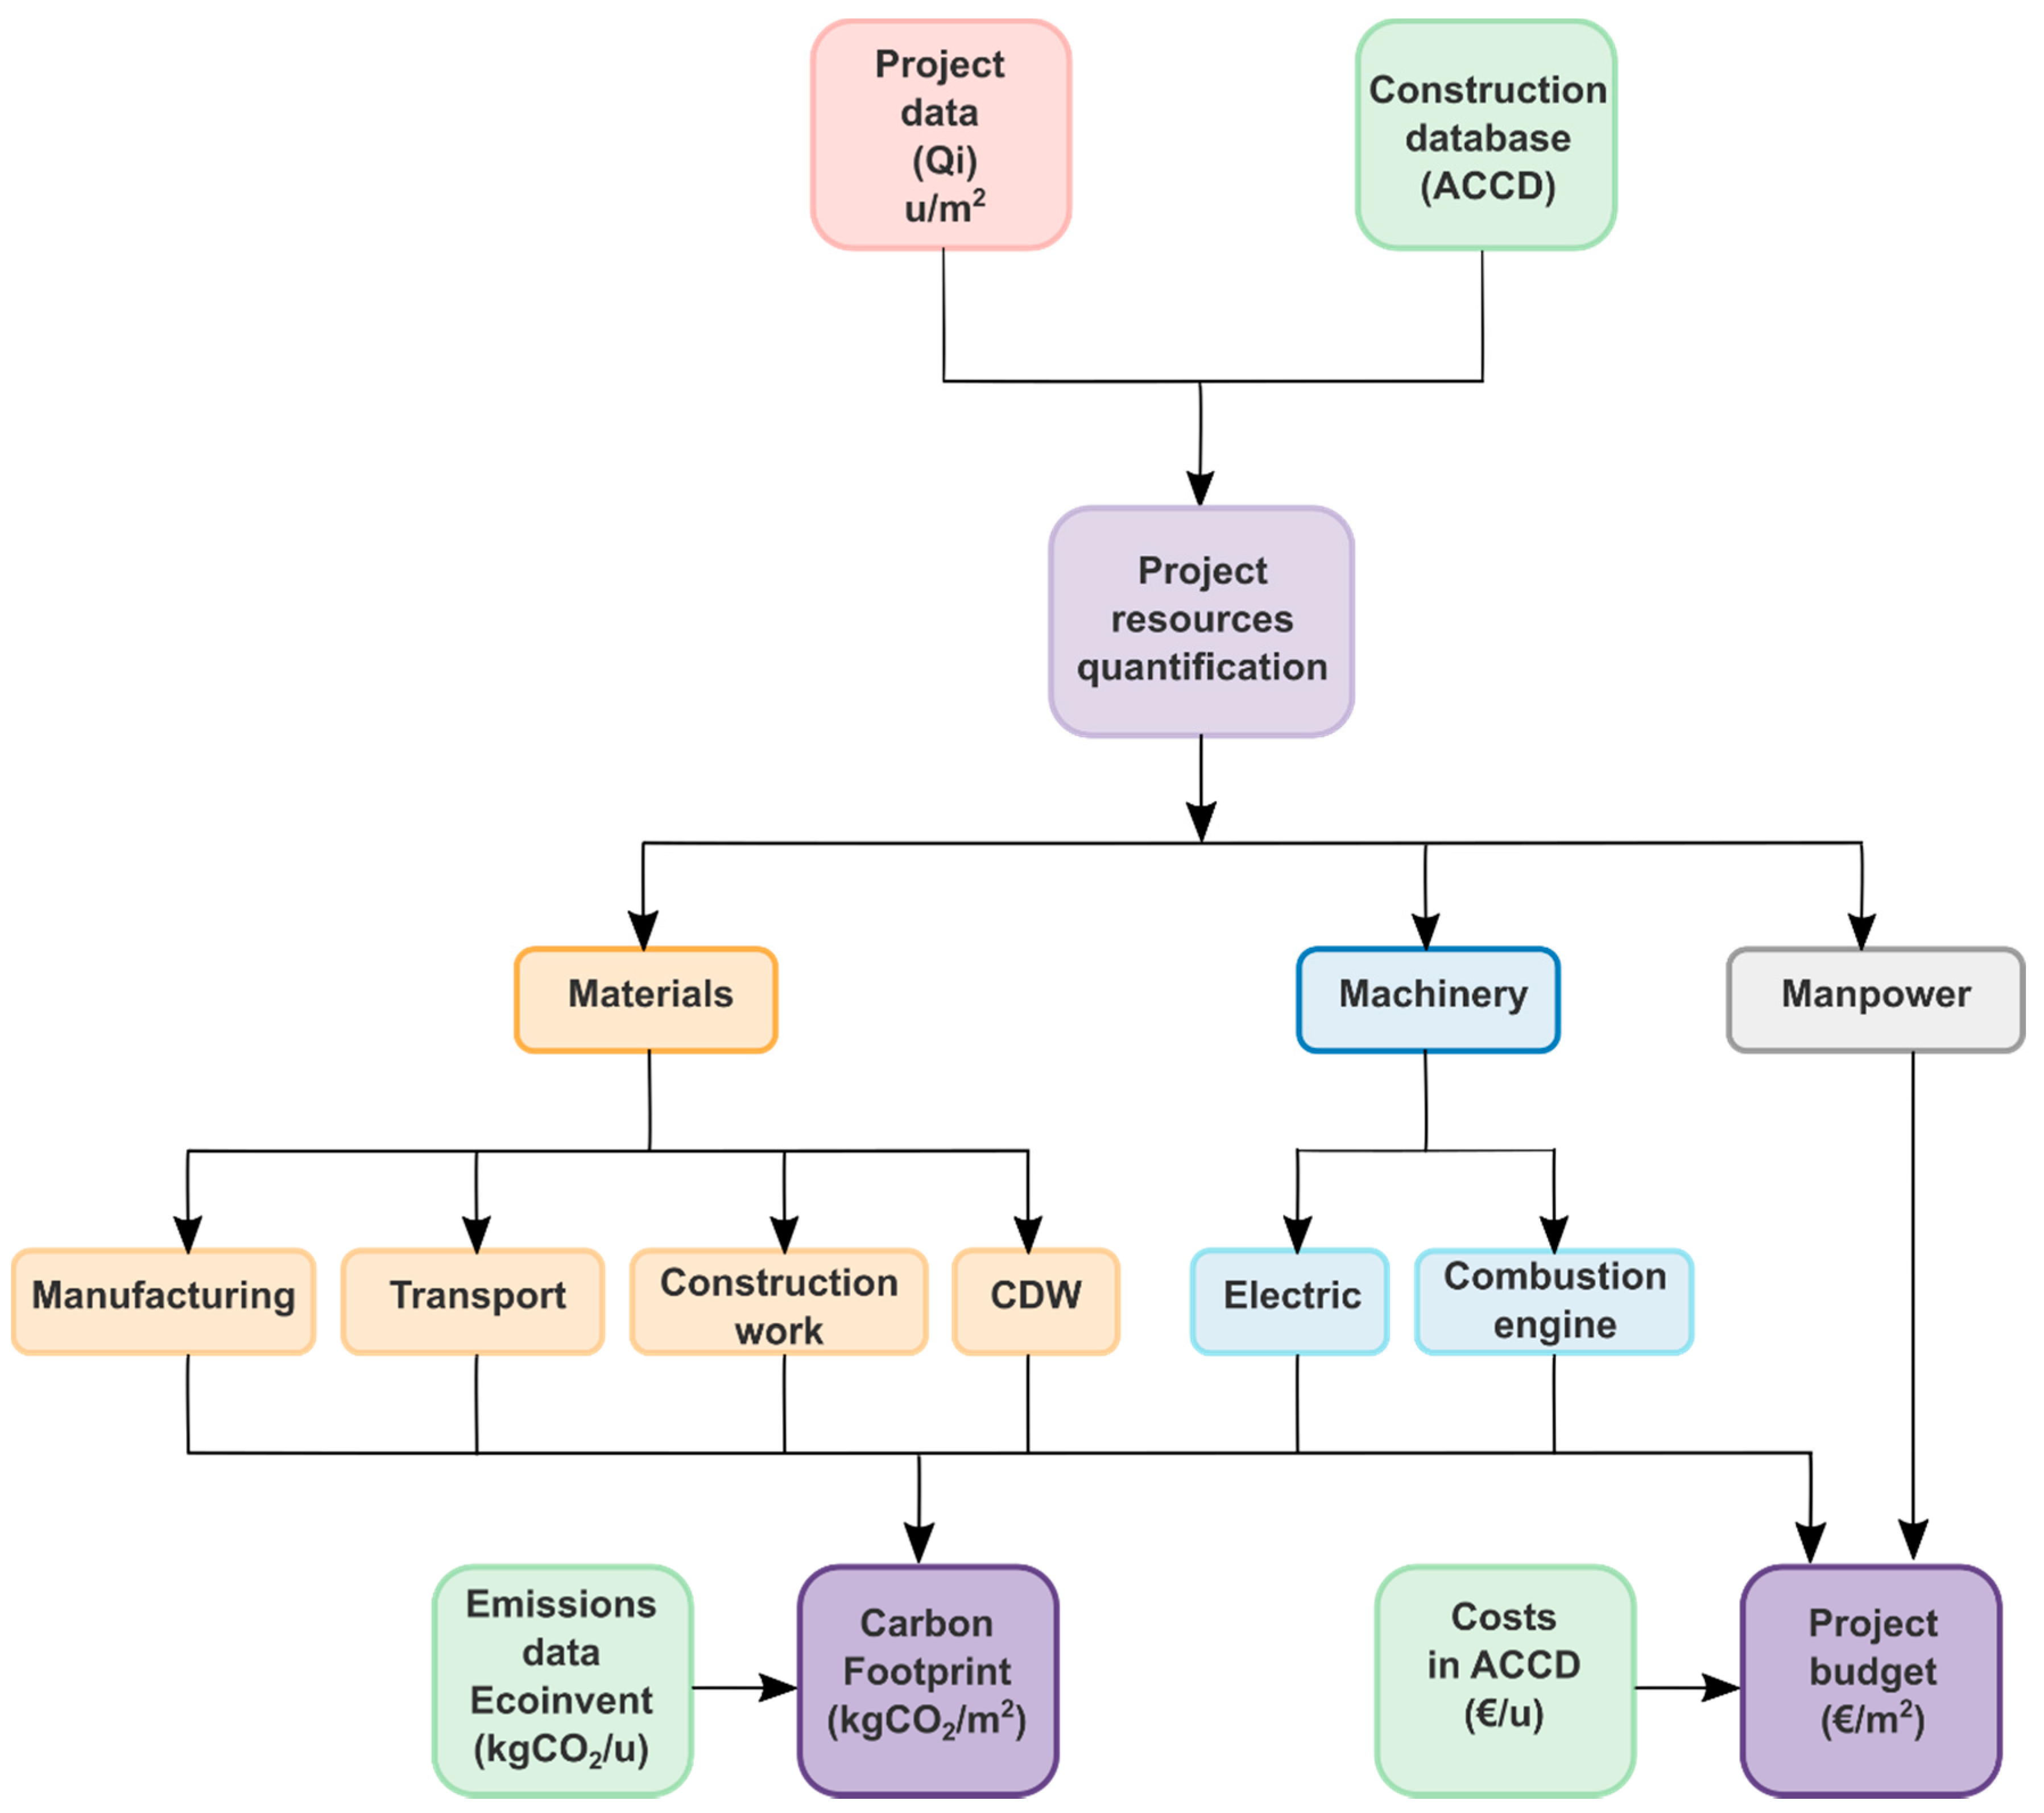
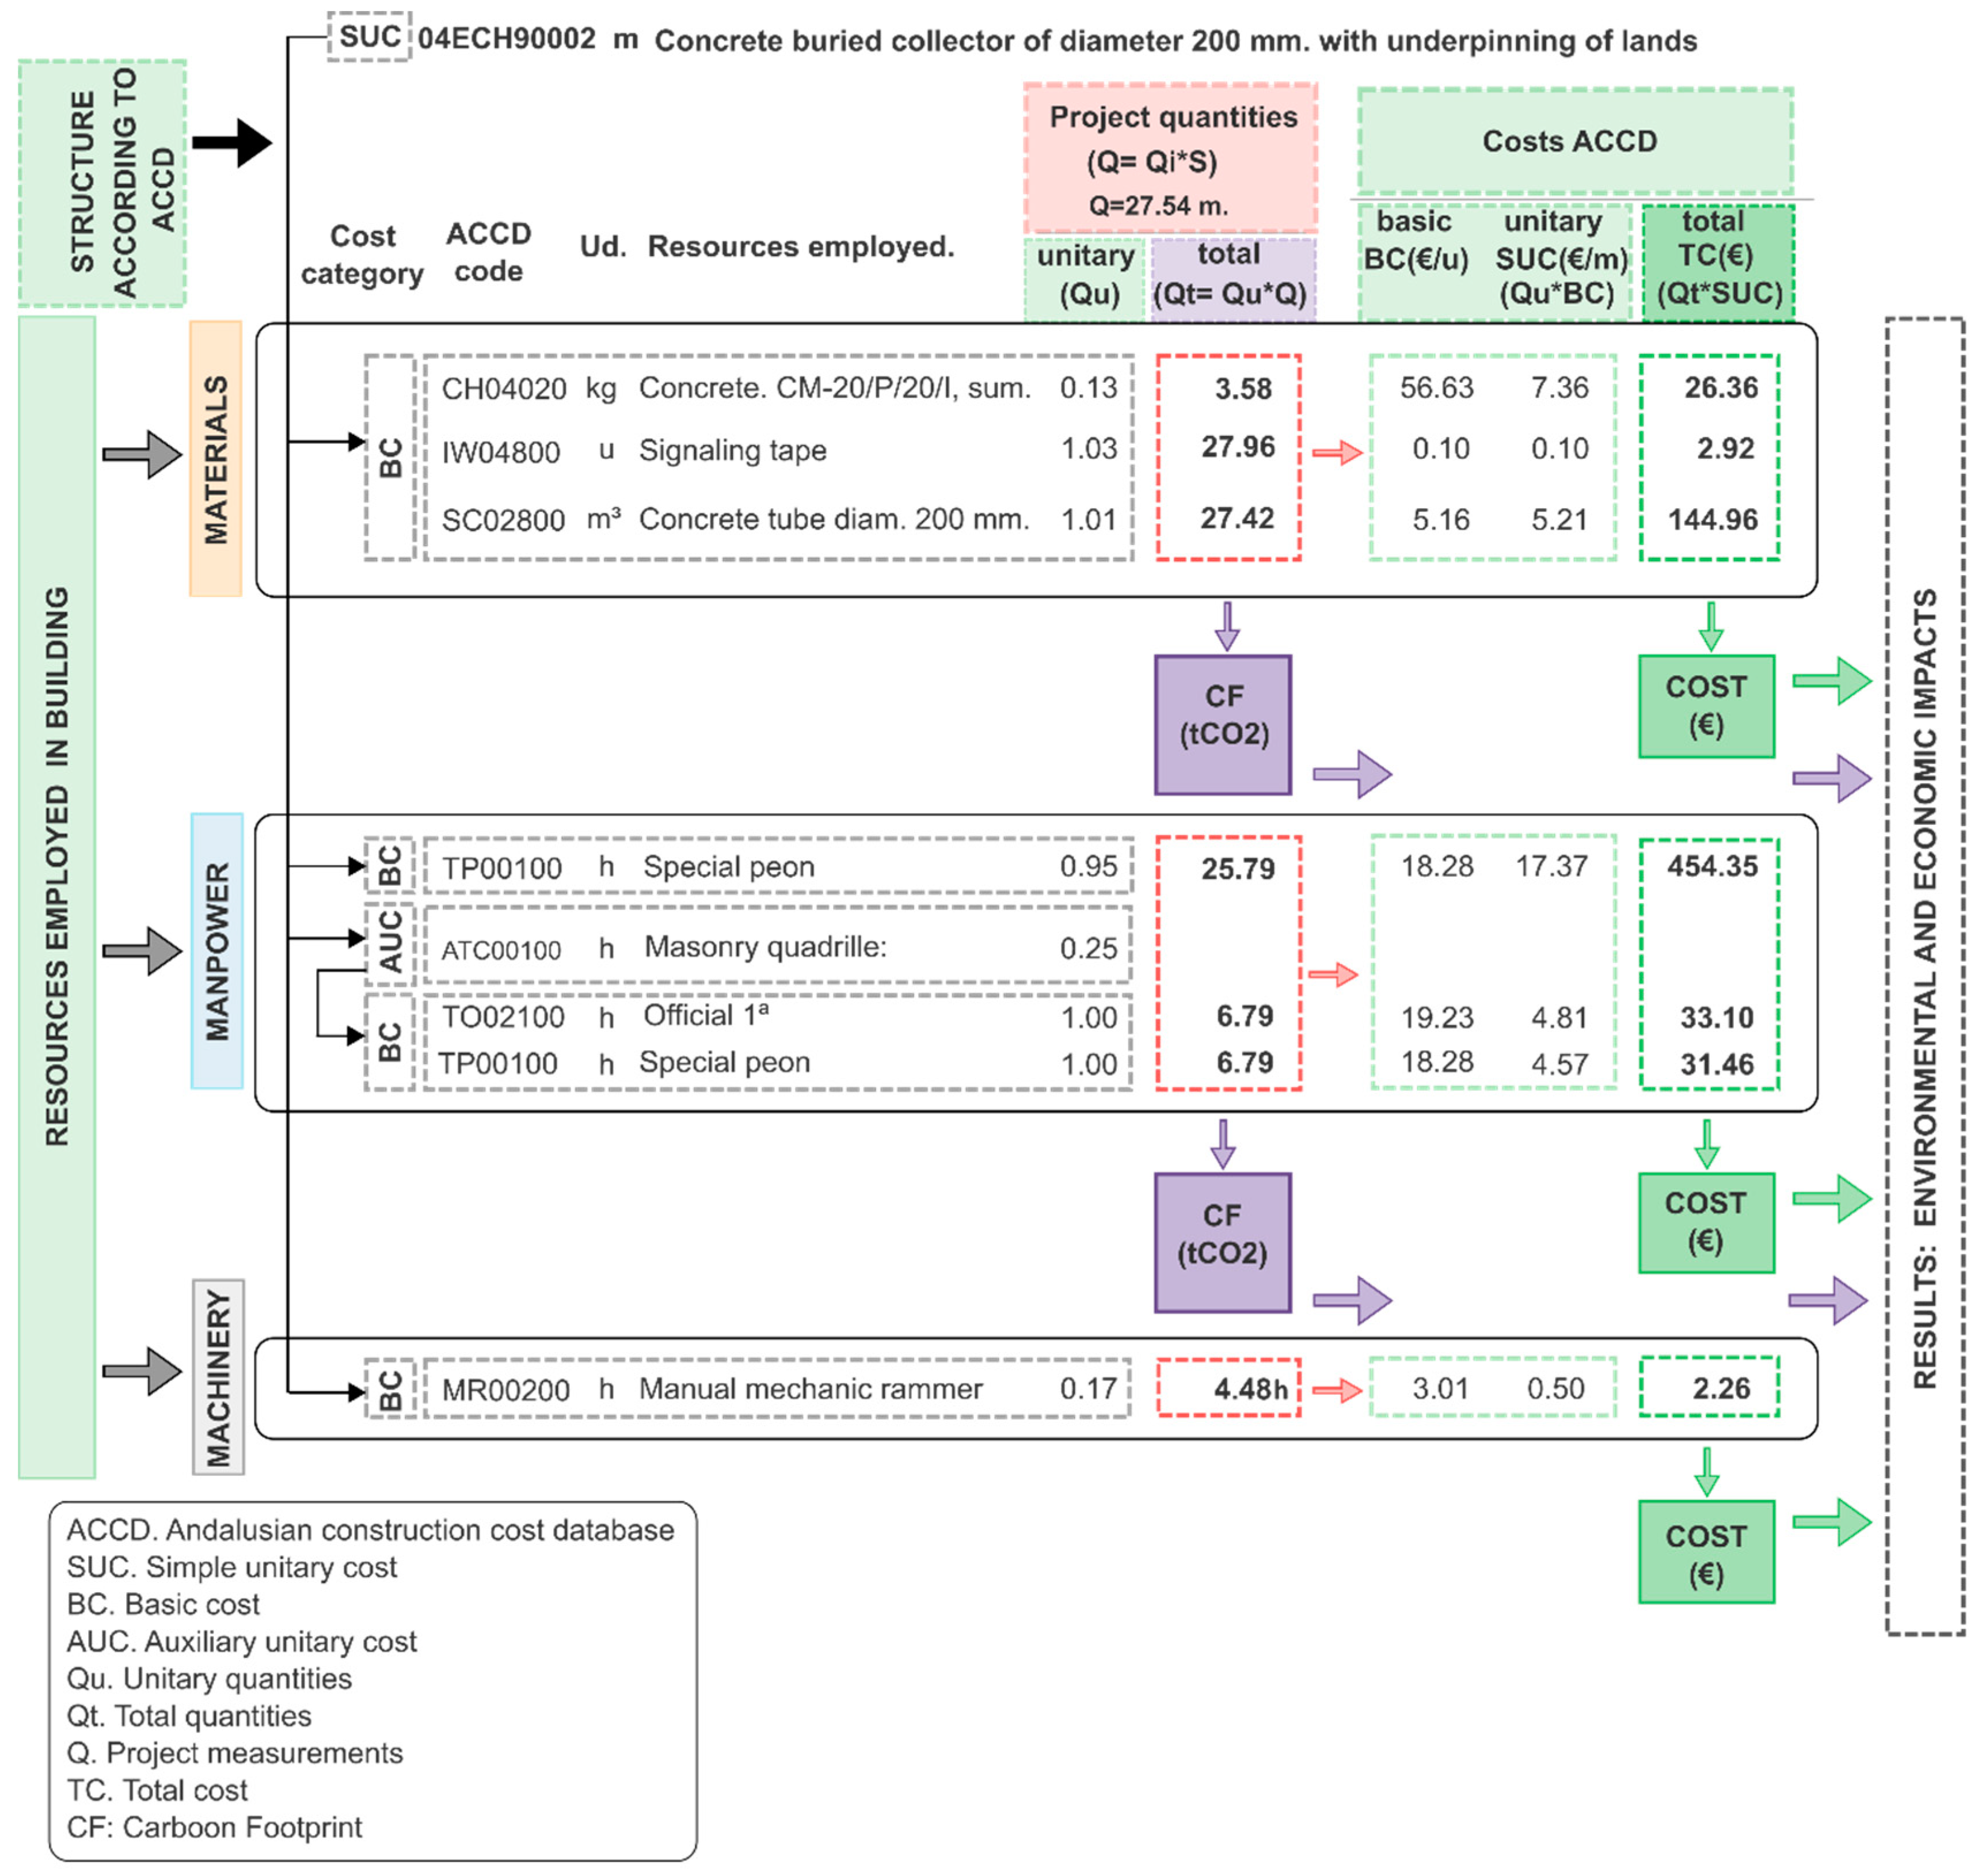
2. Materials and Methods
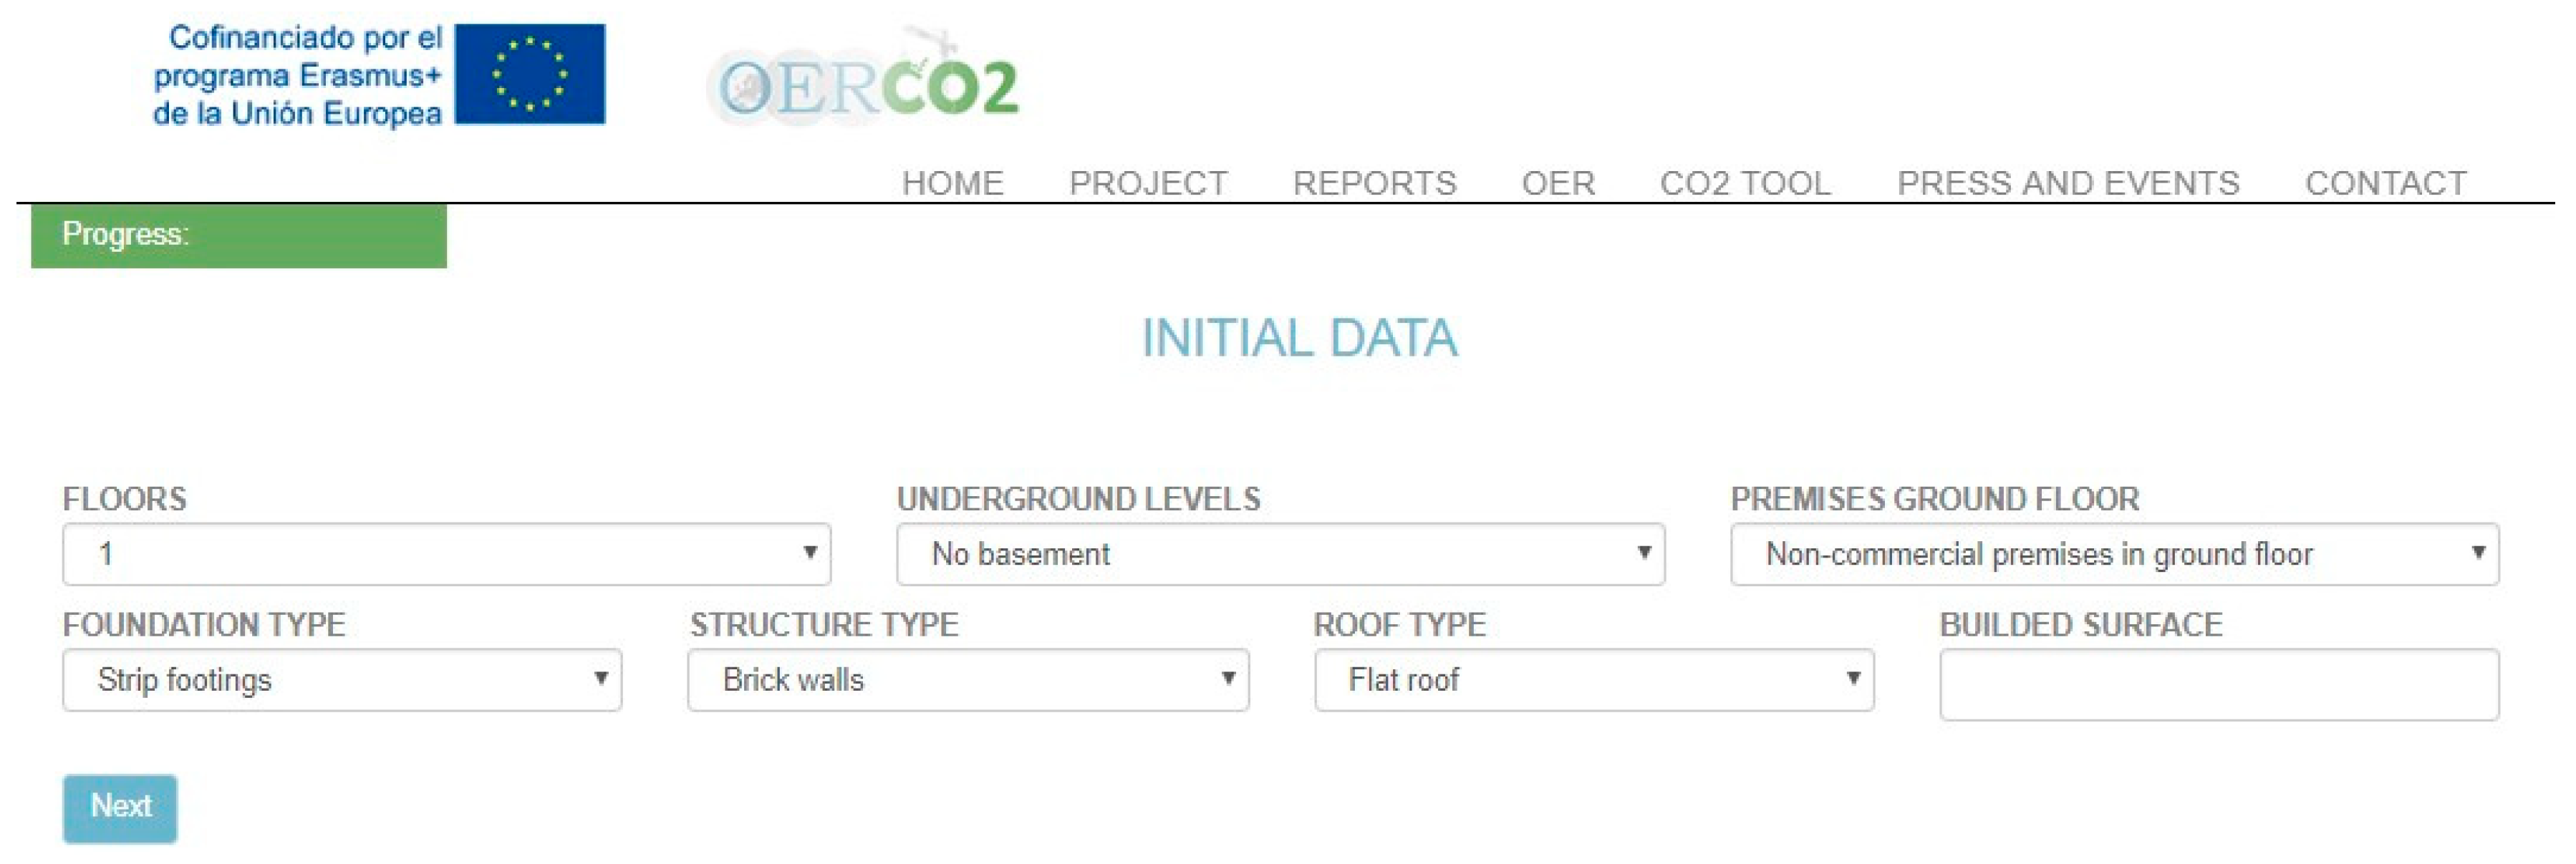
OERCO2 Tool
3. Case Studies
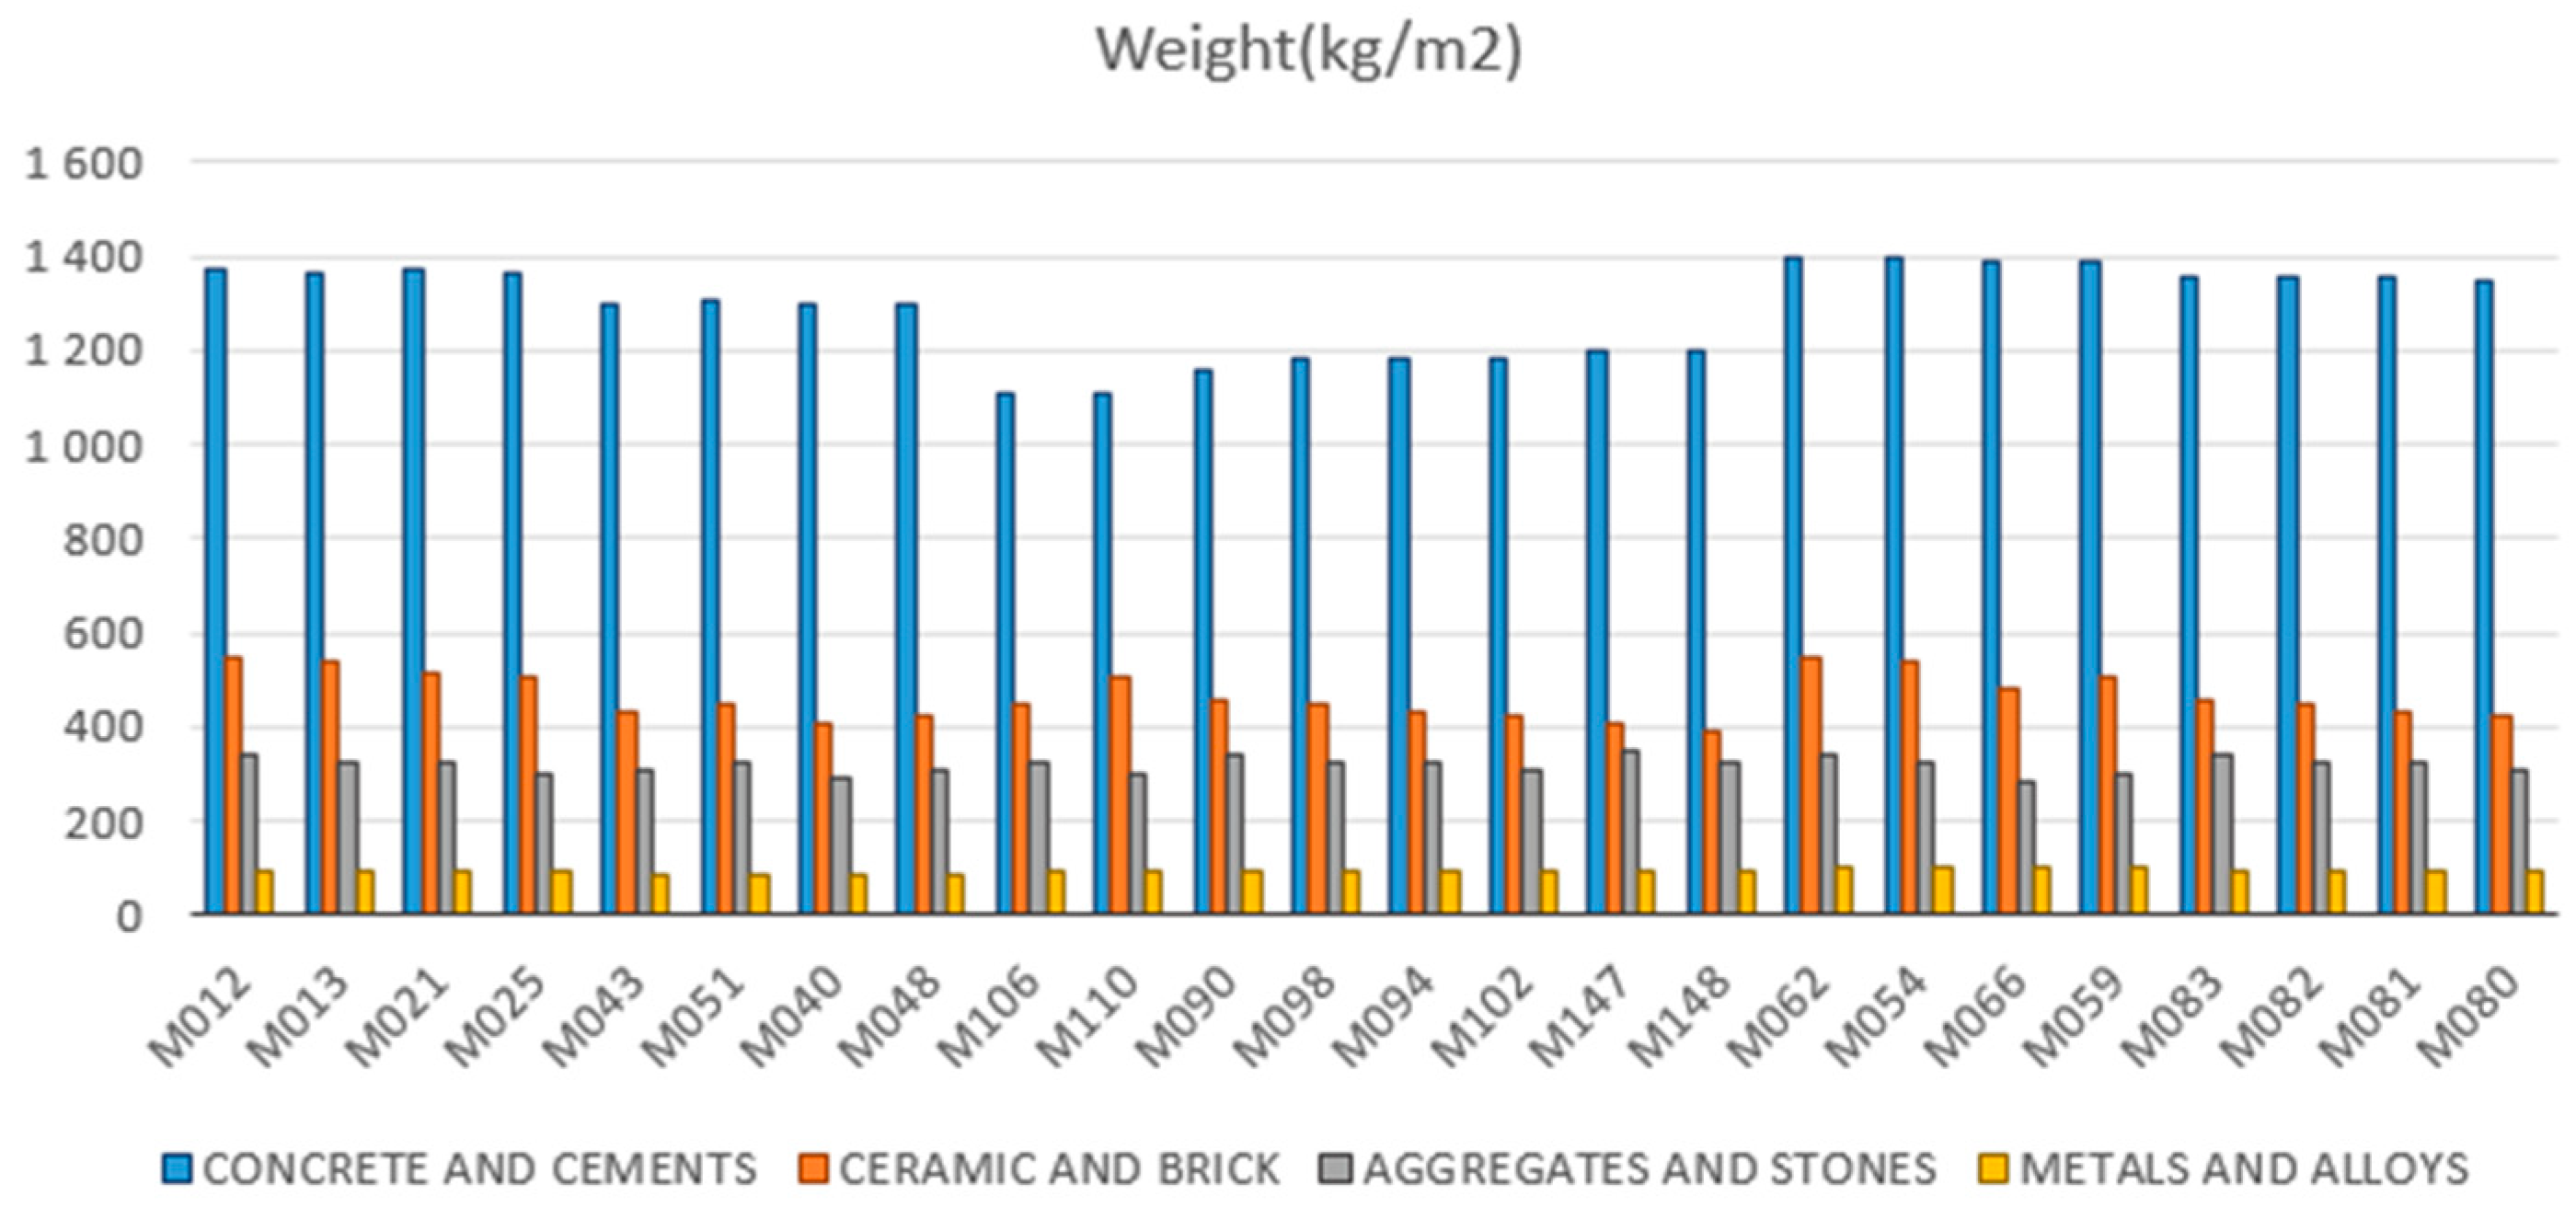
3.1. Statistical Data
3.2. Selected Projects
4. Results and Discussion
5. Conclusions
Supplementary Materials
Author Contributions
Funding
Acknowledgments
Conflicts of Interest
References
- European Parliament—Council of the European Union DIRECTIVE (EU) 2018/844 of the European Parliament and of the Council of 30 May 2018 amending Directive 2010/31/EU on the Energy Performance of Buildings and Directive 2012/27/EU on Energy efficiency (Text with EEA Relevance). Available online: http://data.europa.eu/eli/dir/2018/844/oj (accessed on 1 August 2020).
- UNE, Normalización Española. UNE-EN ISO 14020 Environmental Labels and Declarations—General Principles; UNE: Madrid, Spain, 2002. [Google Scholar]
- UNE, Normalización Española. UNE-EN ISO 14025 Environmental Labels and Declarations—Type III Environmental Declarations—Principles and Procedures; UNE: Madrid, Spain, 2006. [Google Scholar]
- UNE, Normalización Española. UNE-EN 15804 Sustainability of Construction Works—Environmental Product Declarations—Core Rules for the Product Category of Construction Products; UNE: Madrid, Spain, 2012. [Google Scholar]
- UNE, Normalización Española. UNE-EN ISO 14021 Environmental Labels and Declarations—Self-Declared Environmental Claims (Type II Environmental Labelling); UNE: Madrid, Spain, 2017. [Google Scholar]
- UNE, Normalización Española. UNE-EN ISO 14040 Environmental Management—Life Cycle Assessment—Principles and Framework; UNE: Madrid, Spain, 2006. [Google Scholar]
- UNE, Normalización Española. UNE-EN ISO 14044 Environmental Management—Life cYcle Assessment—Requirements and Guidelines; UNE: Madrid, Spain, 2006. [Google Scholar]
- UNE, Normalización Española. UNE-EN 15978 Sustainability of Construction Works. Assessment of Environmental Performance of Buildings. Calculation Methods; UNE: Madrid, Spain, 2012. [Google Scholar]
- UNE, Normalización Española. UNE-EN ISO 14001 Environmental Management Systems—Requirements with Guidance for Use; UNE: Madrid, Spain, 2015. [Google Scholar]
- International Organization for Standardization (ISO). ISO 15686-5 Buildings and Constructed Assets—Service Life Planning—Part 5: Life-Cycle Costing; ISO: Geneva, Switzerland, 2017. [Google Scholar]
- Giesekam, J.; Barrett, J.R.; Taylor, P. Construction sector views on low carbon building materials. Build. Res. Inf. 2016, 44, 423–444. [Google Scholar] [CrossRef]
- Giesekam, J.; Barrett, J.; Taylor, P.; Owen, A. The greenhouse gas emissions and mitigation options for materials used in UK construction. Energy Build. 2014, 78, 202–214. [Google Scholar] [CrossRef]
- Asif, M.; Muneer, T.; Kelley, R. Life cycle assessment: A case study of a dwelling home in Scotland. Build. Environ. 2007, 42, 1391–1394. [Google Scholar] [CrossRef]
- Dimoudi, A.; Tompa, C. Energy and environmental indicators related to construction of office buildings. Resour. Conserv. Recycl. 2008, 53, 86–95. [Google Scholar] [CrossRef]
- Radhi, H.; Sharples, S. Global warming implications of facade parameters: A life cycle assessment of residential buildings in Bahrain. Environ. Impact Assess. Rev. 2013, 38, 99–108. [Google Scholar] [CrossRef]
- You, F.; Hu, D.; Zhang, H.; Guo, Z.; Zhao, Y.; Wang, B.; Yuan, Y. Carbon emissions in the life cycle of urban building system in China-A case study of residential buildings. Ecol. Complex. 2011, 8, 201–212. [Google Scholar] [CrossRef]
- Cellura, M.; Guarino, F.; Longo, S.; Mistretta, M. Energy life-cycle approach in Net zero energy buildings balance: Operation and embodied energy of an Italian case study. Energy Build. 2014, 72, 371–381. [Google Scholar] [CrossRef]
- Scheuer, C.; Keoleian, G.A.; Reppe, P. Life cycle energy and environmental performance of a new university building: Modeling challenges and design implications. Energy Build. 2003, 35, 1049–1064. [Google Scholar] [CrossRef]
- Buyle, M.; Braet, J.; Audenaert, A. Life cycle assessment in the construction sector: A review. Renew. Sustain. Energy Rev. 2013, 26, 379–388. [Google Scholar] [CrossRef]
- Ramesh, T.; Prakash, R.; Shukla, K.K. Life cycle energy analysis of buildings: An overview. Energy Build. 2010, 42, 1592–1600. [Google Scholar] [CrossRef]
- Schwartz, Y.; Raslan, R.; Mumovic, D. The life cycle carbon footprint of refurbished and new buildings—A systematic review of case studies. Renew. Sustain. Energy Rev. 2018, 81, 231–241. [Google Scholar] [CrossRef]
- Cabeza, L.F.; Rincón, L.; Vilariño, V.; Pérez, G.; Castell, A. Life cycle assessment (LCA) and life cycle energy analysis (LCEA) of buildings and the building sector: A review. Renew. Sustain. Energy Rev. 2014, 29, 394–416. [Google Scholar] [CrossRef]
- Chau, C.K.; Leung, T.M.; Ng, W.Y. A review on life cycle assessment, life cycle energy assessment and life cycle carbon emissions assessment on buildings. Appl. Energy 2015, 143, 395–413. [Google Scholar] [CrossRef]
- Marrero, M.; Wojtasiewicz, M.; Martínez-Rocamora, A.; Solís-Guzmán, J.; Alba-Rodríguez, M.D. BIM-LCA Integration for the Environmental Impact Assessment of the Urbanization Process. Sustainability 2020, 12, 4196. [Google Scholar] [CrossRef]
- Weidema, B.P.; Thrane, M.; Christensen, P.; Schmidt, J.; Løkke, S. Carbon Footprint. A Catalyst for Life Cycle Assessment? J. Ind. Ecol. 2008, 12, 3–6. [Google Scholar] [CrossRef]
- Cagiao, J.; Gómez, B.; Doménech, J.L.; Gutiérrez Mainar, S.; Gutiérrez Lanza, H. Calculation of the corporate carbon footprint of the cement industry by the application of MC3 methodology. Ecol. Indic. 2011, 11, 1526–1540. [Google Scholar] [CrossRef]
- Bare, J.C.; Hofstetter, P.; Pennington, D.W.; Haes, H.A.U. Midpoints versus endpoints: The sacrifices and benefits. Int. J. Life Cycle Assess. 2000, 5, 319–326. [Google Scholar] [CrossRef]
- Geng, S.; Wang, Y.; Zuo, J.; Zhou, Z.; Du, H.; Mao, G. Building life cycle assessment research: A review by bibliometric analysis. Renew. Sustain. Energy Rev. 2017, 76, 176–184. [Google Scholar] [CrossRef]
- Dossche, C.; Boel, V.; De Corte, W. Use of Life Cycle Assessments in the Construction Sector: Critical Review. Procedia Eng. 2017, 171, 302–311. [Google Scholar] [CrossRef]
- Chastas, P.; Theodosiou, T.; Kontoleon, K.J.; Bikas, D. Normalising and assessing carbon emissions in the building sector: A review on the embodied CO2 emissions of residential buildings. Build. Environ. 2018, 130, 212–226. [Google Scholar] [CrossRef]
- Oregi Isasi, X.; Tenorio, J.A.; Gazulla, C.; Zabalza, I.; Cambra, D.; Leao, S.O.; Mabe, L.; Otero, S.; Raigosa, J. SOFIAS—Software for life-cycle assessment and environmental rating of buildings. Inf. De La Constr. 2016, 68. [Google Scholar] [CrossRef]
- SpainGBC VERDE Tool Website. Available online: http://www.gbce.es/es/pagina/herramientas-de-evaluacion-de-edificios (accessed on 22 November 2019).
- BREEAM.ES Website. Available online: http://www.breeam.es/ (accessed on 9 November 2019).
- Asociación Ecómetro Ecometro LCA Tool Website. Available online: http://acv.ecometro.org/ (accessed on 9 November 2019).
- SOFIAS Project SOFIAS Project Website. Available online: http://www.sofiasproject.org/ (accessed on 9 November 2019).
- e2CO2cero Tool Website. Available online: http://tienda.e2co2cero.com/ (accessed on 9 November 2019).
- Ecoinvent Centre Ecoinvent Database. Available online: http://www.ecoinvent.org/database/ (accessed on 15 November 2019).
- Martínez-Rocamora, A.; Solís-Guzmán, J.; Marrero, M. LCA databases focused on construction materials: A review. Renew. Sustain. Energy Rev. 2016, 58, 565–573. [Google Scholar] [CrossRef]
- PRé Sustainability SimaPro 8. Available online: https://simapro.com/ (accessed on 9 November 2019).
- Council, G.S.B. DGNB. German Sustainable Building Council. Available online: https://www.dgnb.de/en/index.php (accessed on 7 June 2020).
- Romania Green Building Council GREEN HOMES Certification System. Available online: www.rogbc.org (accessed on 7 June 2020).
- Integrated Environmental Solutions Limited Intelligent Communities Lifecycle. Available online: https://www.iesve.com/ (accessed on 26 November 2019).
- Popiţ, G.-E.; Baciu, C.; Rédey, A.; Frunzeti, N.; Ionescu, A.; Yuzhakova, T.; Popovici, A. Life cycle assessment (LCA) of municipal solid waste management systems in Cluj County, Romania. Environ. Eng. Manag. J. 2017, 16, 47–57. [Google Scholar]
- 360 Optimi. Available online: https://www.360optimi.com/app/sec/main/list (accessed on 5 July 2020).
- Colliers International Romania. Available online: https://www.oneclicklca.com/case-study-warehouse-romania-leed/ (accessed on 4 July 2020).
- Living Building Challenge Standard 3.0. Available online: https://living-future.org/ (accessed on 5 July 2020).
- University of Seville and Partners OERCO2. Available online: http://oerco2.eu/es/ (accessed on 21 June 2020).
- Solís-Guzmán, J.; Rivero-Camacho, C.; Alba-Rodríguez, D.; Martínez-Rocamora, A. Carbon footprint estimation tool for residential buildings for non-specialized users: OERCO2 project. Sustainability 2018, 10, 1359. [Google Scholar] [CrossRef]
- Proiectare, P.D.E. COD DE PROIECTARE SEISMICĂ—PARTEA I—PENTRU CLĂDIRI; Ministerul Lucrărilor Publice, Dezvoltării și Administrației: Bucharest, Romania, 2013.
- González-Vallejo, P.; Marrero, M.; Solís-Guzmán, J. The ecological footprint of dwelling construction in Spain. Ecol. Indic. 2015, 52, 75–84. [Google Scholar] [CrossRef]
- Solís-Guzmán, J.; González-Vallejo, P.; Martínez-Rocamora, A.; Marrero, M. The Carbon Footprint of Dwelling Construction in Spain. In The Carbon Footprint Handbook; Taylor and Francis Group: Abingdon, UK, 2015; Volume 1, pp. 261–263. ISBN 978-1-4822-6222-3. [Google Scholar]
- Solís-Guzmán, J.; Marrero, M.; Ramírez-de-Arellano, A. Methodology for determining the ecological footprint of the construction of residential buildings in Andalusia (Spain). Ecol. Indic. 2013, 25, 239–249. [Google Scholar] [CrossRef]
- Solís-Guzmán, J.; Marrero, M.; Montes-Delgado, M.V.; Ramírez-de-Arellano, A. A Spanish model for quantification and management of construction waste. Waste Manag. 2009, 29, 2542–2548. [Google Scholar] [CrossRef]
- Martínez-Rocamora, A.; Solís-Guzmán, J.; Marrero, M. Ecological footprint of the use and maintenance phase of buildings: Maintenance tasks and final results. Energy Build. 2017, 155, 339–351. [Google Scholar] [CrossRef]
- Marrero, M.; Puerto, M.; Rivero Camacho, C.; Freire Guerrero, A.; Solís-Guzmán, J. “Assessing the economic impact and ecological footprint of construction and demolition waste during the urbanization of rural land”. Resour. Conserv. Recycling. Resour. Conserv. Recycl. 2017, 117, 160–174. [Google Scholar] [CrossRef]
- González-Vallejo, P.; Muñoz-Sanguinetti, C.; Marrero, M. Environmental and economic assessment of dwelling construction in Spain and Chile. A comparative analysis of two representative case studies. J. Clean. Prod. 2019, 208, 621–635. [Google Scholar] [CrossRef]
- Marrero, M.; Ramírez de Arellano Agudo, A. The building cost system in Andalusia: Application to construction and demolition waste management. Constr. Manag. Econ. 2010, 28, 495–507. [Google Scholar] [CrossRef]
- Consejería de Fomento y Vivienda Junta de Andalucía. Consejería de Fomento y Vivienda. Available online: https://www.juntadeandalucia.es/organismos/fomentoinfraestructurasyordenaciondelterritorio/areas/vivienda-rehabilitacion/planes-instrumentos/paginas/bcca-sept-2017.html (accessed on 3 July 2020).
- Marrero, M.; Rivero-camacho, C.; Alba-rodríguez, M.D. What are we discarding during the life cycle of a building? Case studies of social housing in Andalusia, Spain. Waste Manag. 2020, 102, 391–403. [Google Scholar] [CrossRef] [PubMed]
- González-Vallejo, P. Herramienta para la estimación de costes económicos y ambientales en el ciclo de vida de edificios residenciales. Fase de construcción. Hábitat SustenTable 2018, 8, 32–51. [Google Scholar] [CrossRef]
- Alba Rodríguez, D.; Ferreira Sánchez, A.; Marrero, M.; Ramirez de Arellano Agudo, A. Ecological Footprint of Building Recovery: Foundation Pinning Under Emergency Conditions. In Proceedings of the II International Congress on Sustainable Construction and Eco-Efficient Solutions, Seville, Spain, 25–27 May 2015; pp. 35–45. [Google Scholar]
- González-Vallejo, P.; Solís-Guzmán, J.; Llácer, R.; Marrero, M. La construcción de edificios residenciales en España en el período 2007-2010 y su impacto según el indicador Huella Ecológica. Inf. De La Construcción 2015, 67, e111. [Google Scholar] [CrossRef]
- Instituto para la Diversificación y Ahorro de la Energía (IDAE) Conducción Eficiente de Vehículos Industriales. Informe del Instituto para la Diversificación y Ahorro de la Energía; IDAE: Madrid, Spain, 2012. [Google Scholar]
- REE. Red Eléctrica Española Avance; Red Eléctrica de España: Madrid, Spain, 2015. [Google Scholar]
- Autoritatea Nationala de Reglementare in Domeniul Energiei. Available online: https://www.anre.ro/en/about-anre/annual-reports-archive (accessed on 21 June 2020).
- Freire-Guerrero, A.; Alba-Rodríguez, M.D.; Marrero, M. A budget for the ecological footprint of buildings is possible: A case study using the dwelling construction cost database of Andalusia. Sustain. Cities Soc. 2019, 51, 101737. [Google Scholar] [CrossRef]
- Spain Government. Instrucción de Hormigón Estructural. Structural Concrete Instruction, Normative Series 2011; Spain Government: Madrid, Spain, 2008.
- Solís-Guzmán, J.; Rivero-Camacho, C.; Tristancho, M.; Martínez-Rocamora, A.; Marrero, M. Software for Calculation of Carbon Footprint for Residential Buildings. In Environmental Footprints and Eco-Design of Products and Processes; Springer: Berlin, Germany, 2020; pp. 55–79. [Google Scholar]
- National Institute of Statistics of Romania. Organization and Functioning of Official Statistics in Romania. Available online: http://www.insse.ro/cms/en/content/official-statistics-romania (accessed on 5 February 2019).
- Romanian Government. Strategia Națională a Locuirii 2017–2030; Romanian Government: Bucharest, Romania, 2017.
- Bruno, M.; Pleskovic, B. Proceedings of the World Bank Annual Conference on Development Economics, 1994; World Bank Group: Washington, DC, USA, 1995; ISBN 0821329081. [Google Scholar]
- Instituto Nacional de Estadísticas (INE) de España. Censo de Población y Viviendas; INE: Madrid, Spain, 2001.
- De Groot, I.B.; Bucknal, R.L. European Construction Costs. Available online: http://constructioncosts.eu/ (accessed on 3 August 2020).
- Vázquez-López, E.; Garzia, F.; Pernetti, R.; Solís-Guzmán, J.; Marrero, M. Assessment model of end-of-life costs and waste quantification in selective demolitions: Case studies of nearly zero-energy buildings. Sustainability 2020, 12, 6255. [Google Scholar] [CrossRef]
- Muñoz, C.; Zaror, C.; Saelzer, G.; Cuchí, A. Estudio del flujo energético en el ciclo de vida de una vivienda y su implicancia en las emisiones de gases de efecto invernadero, durante la fase de construcción Caso Estudio: Vivienda Tipología Social. Región del Biobío, Chile. Rev. De La Construcción 2012, 11, 125–145. [Google Scholar] [CrossRef]


| Leed | Breeam | Verde | Ecometro | Sofias | Gabi | Green Homes | |
|---|---|---|---|---|---|---|---|
| Site and construction | X | X | X | X | X | X | X |
| Transport | X | X | X | X | X | X | |
| Energy management | X | X | X | X | X | X | X |
| Water management | X | X | X | X | X | X | X |
| Materials and resources management | X | X | X | X | X | X | X |
| Waste management | X | X | X | X | X | X | X |
| Comfort | X | X | X | X | X | ||
| Health | X | X | X | X | X | ||
| Environmental charges | X | X | X | X | X | X | X |
| Services | X | X | X | X | |||
| Economic aspects | X | X | X | X | |||
| Social aspects | X | X | X |
| Material | Carbon Footprint (t CO2 eq./t) |
|---|---|
| Soil | 0.007 |
| Wood | −0.992 |
| Concrete | 0.112 |
| Asphalt | 0.21 |
| Ceramic | 0.22 |
| Aggregates and Stones | 0.004 |
| Metals | 1.50 |
| Plastics | 3.25 |
| Glass | 0.669 |
| Plaster and Pastes | 0.002 |
| Construction Material |
| EMAT: emissions per material (kg CO2/kg material) |
| Cmi: construction material i (kg) |
| UCFMAT: unit carbon footprint per material (tCO2eq/kg of material) |
| UCFTRAN: unit carbon footprint of material transport (tCO2eq/kg of material) |
| Machinery |
| CFMCOMB: Combustion engine machinery (tCO2eq) |
| UCFCOMB: unit impact of gasoline or gasoil (tCO2eq/l) Data obtained from Ecoinvent [37] |
| V: gasoil consumption (liters) |
| P: power of the electric engine (kW) |
| T: working time (hours) |
| Ef: efficiency, liters of gasoil or gasoline consumed per engine power (l/kWh) |
| ECOMB: emission factor of the combustion engine of gasoil or gasoline 2.616 kg CO2/l [63] |
| CFMELEC: Electric engine machinery (tCO2eq) |
| EELEC: emission factor of electric mix In Spain: 0.248 kg CO2/kWh [64]/in Romania: 0.264 kg CO2 [65] |
| UCFELEC: unit impact of the electric mix (tCO2eq) |
| Concrete | Other Materials | |
|---|---|---|
| Truck load capacity (t) | 24 | 2 |
| Distance to factory (km) | 20 | 250 |
| Average diesel consumption (l/100 km) | 26 | 26 |
| Diesel emissions (tCO2/l) | 2.62 × 10⁻³ | 2.62 × 10⁻³ |
| Diesel consumed water (m3/l) | 1.26 | 1.26 |
| Diesel embodied energy (MJ/l) | 57.70 | 57.70 |
| Electricity embodied energy (MJ/kWh) | 3.60 | 3.60 |
| Year | Number of Permits for Residential Buildings | Administrative Buildings | Others | Total Number of Permits | Apartments | Total Floor Area, Residential (m2) |
|---|---|---|---|---|---|---|
| 2014 | 37,672 | 234 | 7568 | 45,474 | 60,270 | 7,162,041 |
| 2015 | 39,112 | 237 | 7164 | 46,513 | 67,293 | 7,839,961 |
| 2016 | 38,653 | 196 | 6185 | 45,034 | 80,608 | 8,892,555 |
| 2017 | 41,603 | 204 | 6551 | 48,358 | 88,029 | 9,628,297 |
| 2018 | 42,694 | 255 | 7170 | 50,119 | 98,103 | 10,664,822 |
| General information | Number of Floors | Number of Underground Floors | Use of Ground Floor | |
| 5 | 0/1/2 | Shops/dwelling | ||
| Foundation | Structure | Roof Type | Floor Area (m2) | |
| Isolated Footings/Reinforced Slab/Piles | Metal/Reinforced Concrete | Flat/Sloping | 72 | |
| MS and CS Buildings (Romania and Spain) | ||||
|---|---|---|---|---|
| General information | Earthworks | |||
| Excavations | Fillings | Earth Transport | ||
| Excavator | Mechanic means | Mechanic means | ||
| Sewer System | ||||
| Manholes | Sewage pipes | Downpipes and roof sinks | ||
| In situ | PVC | Reinforced PVC | ||
| Structure | ||||
| Formwork | Floor slabs | Flat roof | Sloping roof | |
| Metallic | Waffle slab with recoverable caissons/One-way slab with concrete vaults | Passable and ventilated/Passable and inverted | Ceramic tiles | |
| Masonry | ||||
| Façades | Claddings | Partitions | ||
| One-foot brick wall with chamber/0.5-foot brick wall with chamber | Single layer mortar | Double hollow brick 9 cm | ||
| Installations | Air-Conditioning System | |||
| Air-Conditioning | Terminal units | Ducts | Pipes | |
| None | None | None | None | |
| Heating | Insulation | |||
| Radiators | Boiler | Pipe insulation | ||
| Classic steel | Gasoil | Applies | ||
| Water supply and ventilation | ||||
| Cold-water pipes | Hot-water pipes | Sinks | Ventilation | |
| Copper | Copper | PVC | Concrete | |
| Domestic Hot water | ||||
| Heater | Solar panels | |||
| Gas | Applies/Does not apply | |||
| Accessibility | ||||
| Lift | ||||
| Applies | ||||
| Finishes | Insulation | Vertical finishing | ||
| Thermal-acoustic | Continuous | |||
| Polyurethane/Rock wool | Rendering | |||
| Finishes | ||||
| Floors | Ceilings | |||
| Ceramic | Continuous laminated gypsum | |||
| Carpentry | ||||
| Windows | Glazing | Doors | ||
| Lacquered aluminum casement with thermal bridge break | Thermal-acoustic 6 + 12 + 6 | Wood | ||
| Protection elements | ||||
| Blinds | Protection grids | Railings | ||
| Anodized aluminum | Hot-rolled steel | Steel | ||
| Foundation | Number Underground Floors | Ground Floor | Roof Type | MS OERCO2 Code | CS OERCO2 Code |
|---|---|---|---|---|---|
| ISOLATED FOOTINGS | 0 | Dwelling | Flat | M012 | C012 |
| Sloping | M013 | C013 | |||
| Shops | Flat | M021 | C021 | ||
| Sloping | M025 | C025 | |||
| ISOLATED FOOTINGS | 1 | Dwelling | Flat | M043 | C043 |
| Sloping | M051 | C051 | |||
| Shops | Flat | M040 | C040 | ||
| Sloping | M048 | C048 | |||
| REINFORCED SLAB | 0 | Shops | Flat | M106 | C106 |
| Sloping | M110 | C110 | |||
| REINFORCED SLAB | 1 | Dwelling | Flat | M090 | C090 |
| Sloping | M098 | C098 | |||
| Shops | Flat | M094 | C094 | ||
| Sloping | M102 | C102 | |||
| REINFORCED SLAB | 2 | Dwelling | Flat | M147 | C147 |
| Sloping | M148 | C148 | |||
| PILES | 0 | Dwelling | Flat | M062 | C062 |
| Sloping | M054 | C054 | |||
| Shops | Flat | M066 | C066 | ||
| Sloping | M059 | C059 | |||
| PILES | 0 | Dwelling | Flat | M083 | C083 |
| Sloping | M082 | C082 | |||
| Shops | Flat | M081 | C081 | ||
| Sloping | M080 | C080 |
| Project of Spain | ||||||||
|---|---|---|---|---|---|---|---|---|
| FOUNDATION | ISOLATED FOOTINGS | REINFORCED SLAB | PILES | |||||
| UGF: Under Ground Floor | W/O UGF | One UGF | W/O UGF | One UGF | Two UGF | W/O UGF | One UGF | |
| CODE | C012/C013/ C021/C025 | C040/C043/C048/C051 | C106/ C110 | C090/C094/ C098/C102 | C147/C148 | C054/C059/C062/C066 | C080/C081/ C082/C083 | |
| CHARTERS | FOUNDATION | 9.79% | 10.89% | 9.16% | 9.98% | 11.47% | 11.23% | 12.73% |
| STRUCTURES | 20.29% | 18.67% | 19.61% | 18.80% | 19.05% | 19.79% | 18.28% | |
| MASONRY | 21.81% | 21.22% | 22.36% | 21.37% | 19.93% | 21.69% | 20.78% | |
| INSTALLATIONS | 30.63% | 30.81% | 31.28% | 31.02% | 29.29% | 30.52% | 30.17% | |
| FINISHES | 6.79% | 7.56% | 6.99% | 7.61% | 7.87% | 6.73% | 7,40% | |
| % CF TOTAL | 89.31% | 89.15% | 89.41% | 88.78% | 87.61% | 89.97% | 89.36% | |
| CF (%) of Romania Project Chapters | ||||||||
|---|---|---|---|---|---|---|---|---|
| FOUNDATION | ISOLATED FOOTINGS | REINFORCED SLAB | PILES | |||||
| UGF: Under Ground Floor | W/O UGF | One UGF | W/O UGF | One UGF | Two UGF | W/O UGF | One UGF | |
| CODE | M012/M013 M021/M025 | M040/M043 M048/M051 | M106/M110 | M090/M094 M098/M102 | M147/M148 | M054/M059/ M062/M066 | M080/M081/M082/M083 | |
| CHARTERS | FOUNDATION | 7.50% | 8.56% | 7.10% | 7.77% | 9.39% | 8.74% | 9.96% |
| STRUCTURES | 34.53% | 34.12% | 34.09% | 33.90% | 31.81% | 34.18% | 33.25% | |
| MASONRY | 21.57% | 20.88% | 22.16% | 20.82% | 20.02% | 21.34% | 20.35% | |
| INSTALLATIONS | 22.08% | 22.10% | 22.15% | 22.04% | 21.82% | 21.84% | 21.54% | |
| FINISHES | 5.30% | 5.95% | 5.42% | 5.93% | 6.44% | 5.24% | 5.79% | |
| % CF TOTAL | 90.97% | 91.61% | 90.92% | 90.46% | 89.48% | 91.33% | 90.89% | |
| Foundation | Concrete Structure (CS) | Metallic Structure (MS) | ||||
|---|---|---|---|---|---|---|
| Cost | Cost | |||||
| Economic | Environmental | Economic | Environmental | |||
| ACCD (Spain) | European | CF | ACCD (Spain) | European | CF | |
| (€/m2) | (€/m2) | (kgCO2/m2) | (€/m2) | (€/m2) | (kgCO2/m2) | |
| Isolated footings | 647.64 | 861.22 | 0.571 | 777.11 | 1033.39 | 0.740 |
| Reinforced slab | 639.05 | 849.80 | 0.556 | 754.80 | 1003.72 | 0.720 |
| Piles | 697.42 | 927.42 | 0.588 | 821.44 | 1092.34 | 0.753 |
© 2020 by the authors. Licensee MDPI, Basel, Switzerland. This article is an open access article distributed under the terms and conditions of the Creative Commons Attribution (CC BY) license (http://creativecommons.org/licenses/by/4.0/).
Share and Cite
González-Vallejo, P.; Muntean, R.; Solís-Guzmán, J.; Marrero, M. Carbon Footprint of Dwelling Construction in Romania and Spain. A Comparative Analysis with the OERCO2 Tool. Sustainability 2020, 12, 6745. https://doi.org/10.3390/su12176745
González-Vallejo P, Muntean R, Solís-Guzmán J, Marrero M. Carbon Footprint of Dwelling Construction in Romania and Spain. A Comparative Analysis with the OERCO2 Tool. Sustainability. 2020; 12(17):6745. https://doi.org/10.3390/su12176745
Chicago/Turabian StyleGonzález-Vallejo, Patricia, Radu Muntean, Jaime Solís-Guzmán, and Madelyn Marrero. 2020. "Carbon Footprint of Dwelling Construction in Romania and Spain. A Comparative Analysis with the OERCO2 Tool" Sustainability 12, no. 17: 6745. https://doi.org/10.3390/su12176745
APA StyleGonzález-Vallejo, P., Muntean, R., Solís-Guzmán, J., & Marrero, M. (2020). Carbon Footprint of Dwelling Construction in Romania and Spain. A Comparative Analysis with the OERCO2 Tool. Sustainability, 12(17), 6745. https://doi.org/10.3390/su12176745