Abstract
Rainfall, tide, and wave overtopping can together cause inundation in some coastal areas. However, there have been few cases of inundation analysis considering compound flooding due to the difficulty of the interdisciplinary technique. The purpose of this study is to suggest an analysis technique of compound flooding in coastal areas that links flow simulation tools of coasts and watershed. XP-SWMM was used to analyze rainfall–runoff simulation and 2D surface inundation analysis. A coupled model of ADCIRC and SWAN (ADCSWAN) was used for analyzing expected flow, including wave spectrum, tide, and storm surge from the distant ocean, and the FLOW-3D model was used to estimate the flow and wave overtopping in the coastal area. The analysis technique was applied to Marine City located in Busan, the Republic of Korea, where rainfall and wave overtopping occurred simultaneously during typhoons, and the results were reasonable. The study results are meaningful as they can contribute to the improvement of reproducibility of real phenomena of compound flooding in coastal areas through linked application of flow simulation tools of coasts and watershed.
1. Introduction
Many urban areas with various infrastructures are located in coastal areas, as the land of the Republic of Korea is situated in the Korean Peninsula and is mountainous [1]. Climate change due to recent global warming raises the risk of disasters occurring in those coastal regions. These disasters may be a result of a rise in the average seawater level and increases in rainfall intensity and typhoon strength [2]. Under these circumstances, the development of coastal areas through reclamation has increased the risk of flooding, which has caused loss of life and damage to property [3].
Coastal areas can be flooded by compound factors, such as rainfall, rises in seawater level at high tide and wave overtopping by storm surge. The phenomenon was defined as compound flooding (CF), which is an extreme event taking place in low-lying coastal areas as a result of the interaction between co-occurring high sea levels and large amounts of rainfall [4]. When the two hazards interact, the resulting impact can be worse than when they occur individually [5]. In fact, many areas were flooded as the tide of Masan Bay increased more than 2 m above the forecast during Typhoon Maemi in Korea in 2003. As a result, the disaster caused significant loss of life and property [6]. The heavy rainfall combined with high tide in Busan on July 7, 2009 caused poor drainage, and the flood damage was aggravated [7]. Typhoon Chaba in 2016 also caused massive flooding in Marine City in Haeundae-gu, Busan, due to the rainfall and wave overtopping which was caused by storm surge [1]. Therefore, these compound external forces must be included for reasonable simulations of flooding in the above coastal areas. However, there is a critical knowledge gap that exists in the attempt to address the effects of compound flooding due to the combined effects of different flood sources. Accordingly, these processes have been studied separately using different types of models [8].
The previous studies in hydrologic field related to inundation analysis in coastal areas were conducted considering only rainfall and tides as boundary conditions. For example, Pokharel et al. [9] analyzed an inundation situation of Nagoya Bay in Japan for the heavy rainfall and seawater level rise due to global warming by a synthetic analysis model that includes a sea model, an inundation model, a river model and a sewer system model. However, wave overtopping was not considered in this study. Similarly, Ray et al. [10] analyzed the combined effect of storm surge and inland rainfall on the floodplain of a coastal bayou in the Houston area by using Hydrologic Engineering Center’s (HEC) hydrologic modeling system (HEC-HMS) and river analysis system (HEC-RAS), excluding wave overtopping. Karamouz et al. [11] analyzed floodplain delineation in the coastal area of the Bronx River in New York City by using a storm water management model (SWMM) to simulate the runoff from rainfall and the HEC-RAS. Choi and Jun [12] conducted flooding analysis considering the rainfall and seawater level rise due to storm surge by using XP-SWMM.
Meanwhile, most of the coastal engineering studies were carried out, analyzing coastal inundation using physical phenomena from the sea. Leroy et al. [13] proposed a methodology to simulate coastal flooding by wave overtopping with spatio-temporal variability in an urban area with a very high-resolution digital elevation model (DEM). They simulated a flood event induced by overtopping during the Johanna storm in the village of Gâvres in France using the SURF-WB (two-dimensional SURFace water flow with Well-Balanced scheme) model. Gallien [14] estimated maximum wave run-up elevation and overtopping volumes using numerical (XBeach) and empirical (EurOtop) models to validate the coastal flood model. Suh and Kim [15] studied inundation analysis, calculating discharge of wave overtopping by incorporating the empirical formulas of the EurOtop module into the storm surge models of ADCIRC (ADvanced CIRCulation model) and SWAN (Simulating WAves Nearshore) during Typhoon Chaba in Marine City, Busan, Korea. O’Grady et al. [16] demonstrated the combined effect of overtopping with a rising surge–tide inundation and highlighted the importance of wave overtopping to inundation by using the numerical model, that is, the shallow water integrated flood tool (SWIFT).
Recently, studies have been conducted considering both rainfall–runoff and wave overtopping. Song et al. [1] compared an inundation area with or without application of the wave overtopping in Suyoung Bay, Busan, the Republic of Korea by XP-SWMM. However, there was a limit in the analysis method of this study in that wave overtopping discharge was calculated by using the dimensionless discharge formula [17]. As a case similar to the current study, Chen et al. [18] developed a coupled model for predicting and analyzing inundation in coastal nuclear power plants (CNPP) in China under the combined action of extreme rainfall, wave overtopping and seawater level based on TELEMAC-2D and SWMM. The focus of this study was to present an imaginary extreme scenario causing the most dangerous situation to the CNPP. In other words, they did not consider the actual physical phenomena for each of the external forces, and the results of the inundation analysis were not real but possible.
Most of the previous studies of coastal inundation analysis focusing on coastal areas took account of a single external force condition corresponding to their own research field. In the cases of studies considering various external force conditions, some external force conditions were incorporated by some simple empirical formulas rather than the physical mechanism. In other words, few studies realized the actual phenomena for the inundation analysis of the coastal areas by physically configuring all external force conditions. This is because most studies of inundation analysis focusing on the coast were conducted independently by hydrological engineers or coastal engineers. The current study is different from previous studies in that it was conducted by hydrological engineers in cooperation with coastal engineers to analyze real phenomena by using physical models for hydrological and coastal engineering.
XP-SWMM, ADCIRC, SWAN and FLOW-3D models were used to simulate inundation analysis due to complex factors in the coastal area. The adequacy of analysis was validated by applying the models to the area where the inundation damage occurred.
2. Materials and Methods
2.1. Research Area
The research area is the Marine City basin located in Busan, the Republic of Korea (Figure 1). The area is a residential-oriented town area that was built on a part of the land reclamation area of Suyoung Bay.
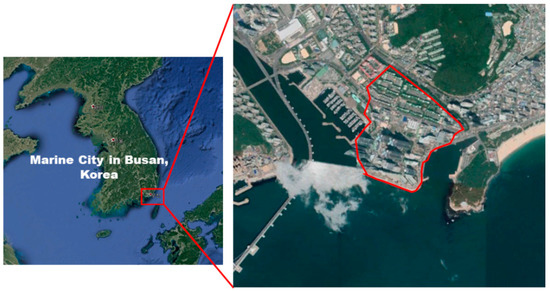
Figure 1.
Marine City in Busan, the Republic of Korea.
Although the major buildings are adjacent to the coastline, active installation of prevention facilities against wave overtopping has been restricted due to the right of the local residents to view the sea. Because of these regional characteristics, many roads and shopping districts in Marine City were inundated due to overflow of seawater caused by wave overtopping during Typhoon Chaba in 2016 (Figure 2) and Typhoon Kong-Rai in 2018. That is, Marine City frequently flooded when typhoons accompanied by heavy rainfall and storm surge hit the area.
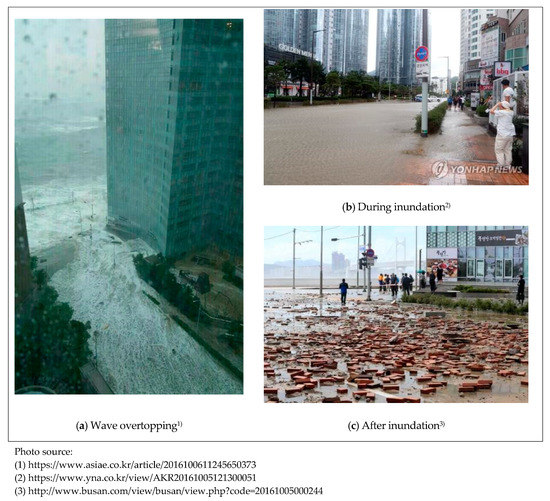
Figure 2.
Marine City during Typhoon Chaba in 2016.
2.2. Characteristics of Watershed and Storm Sewer Networks
The watersheds and storm sewer networks of the study area were analyzed by collecting the digital topographic map, planned floor plan for stormwater facilities, etc. The analyzed results were also checked through a field investigation. The total watershed area of Marine City is 0.53 km2; and the region is a typical urban area consisting mostly of residential areas, commercial areas and roads, with the exclusion of some bare lands.
The total watershed was divided into 25 subcatchments, and they were connected by 25 elements of storm sewers. The watershed runoff discharges to eight outfalls. The main drainage system of Marine City watershed is the system with the outfall element of Out 1 as the outlet. All the eight drainage systems directly discharge runoffs from rainfall to the sea. Figure 3 shows the watershed including the subcatchments connected by storm sewers and a schematic diagram of the drainage systems.
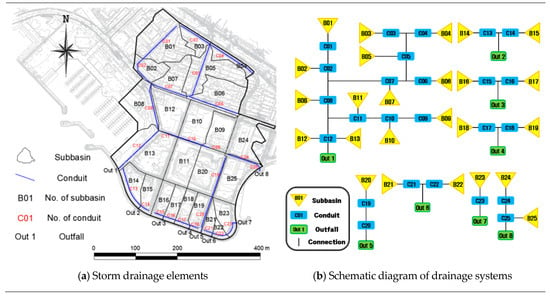
Figure 3.
Watershed and schematic diagram of drainage systems.
2.3. Models for Analyses
2.3.1. ADCSWAN (ADCIRC+SWAN) Model
To predict the impact of storm surge caused by typhoons, the prediction model should reproduce the following comprehensive phenomena: sea-level variation induced by typhoons incurring pressure drop and sea surface winds; topographic effects; tides; and waves [19,20]. The coupled model of ADCIRC and SWAN, named as ADCSWAN, was used in this study. The ADCSWAN had various application and verification cases simulating the possible phenomena caused by typhoons [21,22,23,24,25]. The ADCSWAN calculation data became the boundary condition data for the FLOW-3D model.
We used the 2D depth-integrated version of ADCIRC [26] that solves the vertically integrated generalized wave continuity equation (GWCE) and the momentum equation (Equations (1) and (2), respectively)
where is the bathymetric depth, is the time, is the surge elevation above MSL (mean sea level), is the depth-averaged horizontal velocity vector, is the barometric pressure, is the Coriolis force coefficient, is a vertical unit vector, is the free surface shear stress, is the bottom shear stress, is the water density, and is the gravitational acceleration.
The wave model of SWAN follows a fully implicit finite difference method solving the wave action balance equation [27]. SWAN computes the wave action density spectrum in geographical space and time , with the relative frequency and the wave direction, as governed by the action balance equation [28].
where is the wave action density spectrum, is the wave group velocity, is the ambient current vector, is the propagation velocity and is the wave propagation velocity. The source term, represents all physical processes that generate, dissipate or redistribute wave energy. Detailed information regarding governing equations related to ADCIRC and SWAN can be found in [26,28].
ADCIRC uses the SWAN results to extrapolate forward the wave forcing in time. After completion of the coupled time interval, ADCIRC passes on the wind velocity, water levels and currents to SWAN to further update the radiation stress. In this way, the radiation stress gradients used by ADCIRC and the wind speeds, water levels and currents used by SWAN are mutually exchanged between both models [25]. Further details about the coupled ADCSWAN model can be found in [22].
2.3.2. FLOW-3D Model
The FLOW-3D model solves three-dimensional Navier–Stokes equations and is a non-hydrostatic model to simulate high-speed fluids with excellence considering the advection to the vertical direction. The model is a full three-dimensional model; it may simulate complicated free surface water motion such as scattering and wave breaking by adopting the numerical scheme of the volume of fluid [29]. Here, in order to express the free surface, the surface shape of the liquid in contact with the gas is defined as the VOF (volume of fluid) function F(x, y, z, t) as in Equation (4), and F is per unit volume when it contains the free surface. It represents the volume ratio occupied by the fluid.
where, is the volume change rate of the fluid due to the generation and disappearance of mass, and the turbulence diffusion term is as follows (Equation (5)):
where, is the turbulent diffusion coefficient.
Turbulent diffusion coefficients can be selectively simulated vortices near structures by employing the Prandtl mixing length model, the one-equation, the two-equation k-ε, the renormalization group (RNG) k- ε model, and large eddy simulation (LES). The RNG k-ε model was applied in this study [30]. The RNG k-ε model is a method of adjusting the coefficients of the existing k-ε model through statistical techniques, removing the motion of the fluid with small-scale turbulent motion, and influencing the effects of large-scale fluid motion and viscosity. It is expressed using coefficient adjustment and a modified viscous force.
Notably, the model incorporates flows, waves, and irregular waves considering the two-dimensional wave spectrum [31], which can yield reasonable simulation results of storm surge heights and storm wave generations during a typhoon event and dynamic exercises of sea water [32,33].
2.3.3. XP-SWMM
Simulations of inundation in an urban area require an urban runoff model coupled with a hydrodynamic model. The urban runoff model must be able to simulate water flows from subcatchments and through storm sewers. The necessary functions of the urban runoff model are overflow computation out of storm sewer nodes and upstream propagation of water through storm sewers. The hydrodynamic model must be able to simulate inundation flow induced by water wave overtopping and overflow from storm sewer nodes.
XP-SWMM is a fully, dynamic hydraulic and hydrologic modeling software that combines 1D calculations for upstream to downstream flow with 2D overland flow calculations [34]. XP-SWMM, developed by XP Solutions Inc. [35,36,37], is highly utilized for urban flooding simulations around the world [38,39,40,41]. Therefore, XP-SWMM was used to analyze runoff of watersheds and inundation in coastal areas in this study. Notably, XP-SWMM can input external flows to nodes and thereby consider the wave overtopping calculated by the FLOW-3D model.
2.3.4. Connections Among the Models
The hydrostatic approximation of the ADCSWAN model needs the experimental equation suggested by a manual [15,42] to simulate wave overtopping with low computational burdens. The FLOW-3D model, however, directly simulates wave overtopping over shore protection structures or breakwaters without an experimental equation, allowing high computational burdens. Hence, the current study applied the ADCSWAN model to the areas of distant sea and the FLOW-3D model to calculate wave overtopping rates around the coastal areas.
Meanwhile, XP-SWMM is also used to analyze rainfall–runoff of watersheds and ground surface inundation in coastal areas. Figure 4 represents the connection relations of the models used in compound flooding analysis in coastal areas and the results calculated by each model.
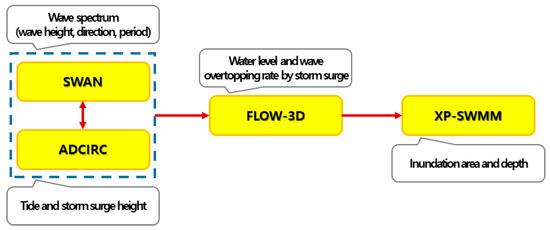
Figure 4.
Connections among the models for inundation analysis in coastal areas.
3. Results
3.1. Estimation of the Wave Overtopping Rate
The storm surge and wave models were built using the ADCSWAN model. Table 1 provides important information on how to simulate the ADCSWAN model. The depth of the model used KHOA (Korea Hydrographic and Oceanographic Agency, http://www.khoa.go.kr/eng/) and GEBCO (General Bathymetric Chart of the Oceans) data, and air pressure and wind used the typhoon best track information of KMA (Korea Meteorological Administration, http://www.kma.go.kr/eng/index.jsp). For the sea surface wind, the Holland gradient wind vortex algorithm was applied, and the calculation area was set wide enough considering the effect of typhoons, and the grid resolution was composed of a triangular grid of at least 30 m with a maximum of 30 km (See Table 1). Figure 5 shows the grid and water depth map of the storm surge model constructed by the ADCSWAN model. Figure 6 and Figure 7 shows the analysis results of the tidal level and storm surge height and significant wave height of Typhoon Chaba. The results were compared with the observed data of the tide station in Busan and Haeundae Buoy for verification of the ADCSWAN model.

Table 1.
ADCSWAN simulation method.
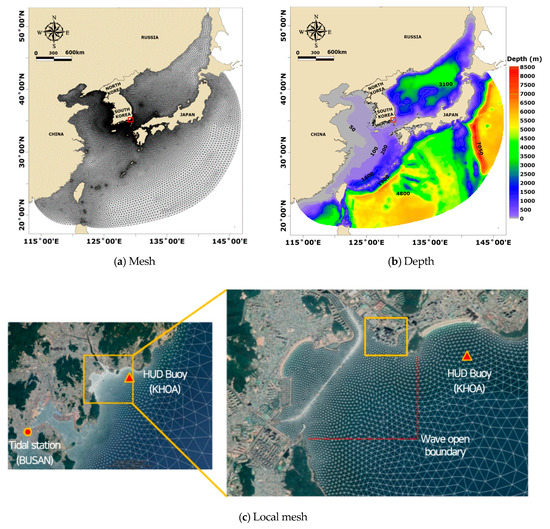
Figure 5.
Mesh and depth map for the storm surge model of the ADCSWAN model.
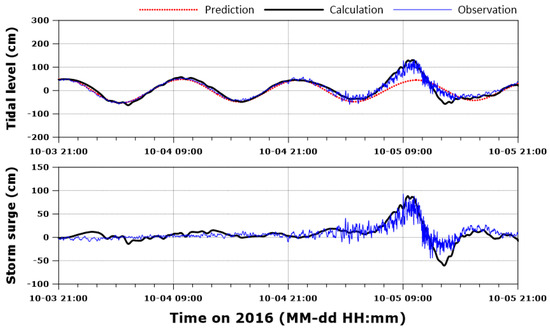
Figure 6.
Verification of tidal level and storm surge during Typhoon Chaba.

Figure 7.
Verification of significant wave height during the Typhoon Chaba.
The wave overtopping rates, which were input data to XP-SWMM, were calculated by the FLOW-3D model. The area of the FLOW-3D model for the target area is 4.8 km north–south and 4.0 km east–west, and the grid resolution is composed of a Cartesian coordinate system with a minimum of 3.0 m and a maximum of 12.0 m. The duration of the experiment was simulated for a total of 5 h based on when the maximum significant wave height occurred. The input boundary of the FLOW-3D model for wave and storm surge was divided into three zones, and the results of the ADCSWAN model were assigned as boundary conditions to the target area. The wave and storm surge boundary data should be considered in both the south and east directions, but as a result of analyzing the observations before and after the overtopping occurs in the target area, the wave is proceeding in the south. Therefore, for convenience of calculations, boundary values were applied only to the south direction. The number of grids created in the target area where overtopping occurs was 32, and the interval was 30 m along the breakwater in front of Marine City. Each flow rate passing through a grid point was calculated and determined as a wave overtopping rate.
Figure 8a represents the area enclosed by the boundary conditioned by the input of the wave and storm surge of the FLOW-3D model; Figure 8b represents the boundary of the output-producing wave overtopping rate. Figure 9 shows the time series of the total wave overtopping rate per hour for the 32 grids calculated by the FLOW-3D model. The calculated total wave overtopping volume was 68,340 m³ from 8 a.m. to 12 a.m. on October 5, 2016 when Typhoon Chaba passed, and the maximum wave overtopping rate was 97.35 m3/s at around 9:20 a.m.
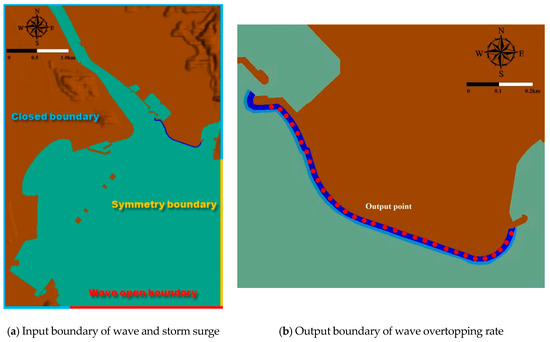
Figure 8.
Simulation boundaries of the FLOW-3D Model.
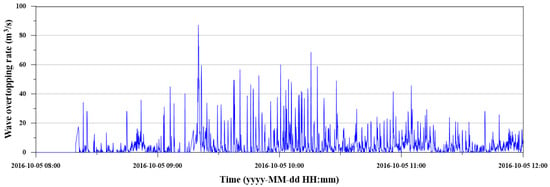
Figure 9.
Wave overtopping rate calculated by the FLOW-3D model at Marine City during Typhoon Chaba.
3.2. Rainfall–Runoff and the 2D Simulation Model By XP-SWMM
The drainage system of Marine City watershed shown in Figure 3 was modeled by using XP-SWMM (Figure 10). Table 2 includes major information and options used in the rainfall–runoff simulation by XP-SWMM. The observed rainfall data were collected from the Haeundae automatic weather system (AWS), from which the Marine City watershed is located within 3 km (Figure 11). The nonlinear storage equation and the dynamic wave model were used for watershed and channel routings, respectively. The Horton equation was applied to calculate infiltration of the ground surface. The time interval of rainfall and calculation time steps of watershed and channel routings were set by considering the sizes of the subcatchments and the lengths of the pipes.
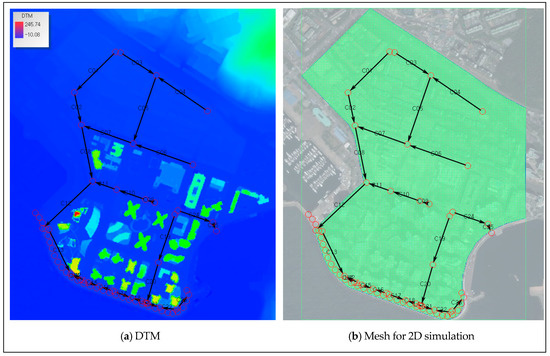
Figure 10.
Inundation simulation model by XP-SWMM.

Table 2.
Information and options used in rainfall–runoff simulation.
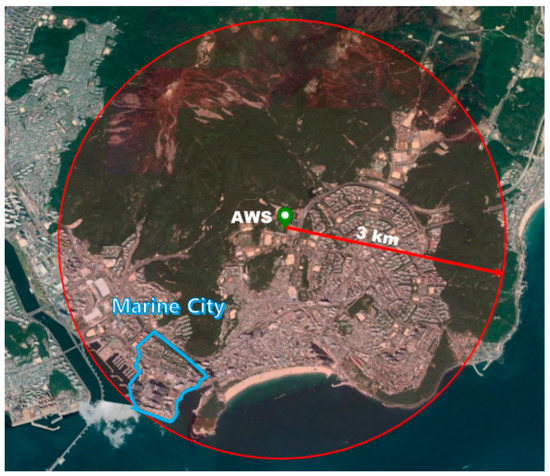
Figure 11.
Locations of the Haeundae AWS and Marine City watershed.
XP-SWMM requires topographical data to analyze two-dimensional surface inundation. A digital terrain model (DTM) was constructed by using a digital map with the scale of 1:5,000 and survey results by a drone, as shown in Figure 10a. The DTM was used to create two-dimensional simulation grids, as shown in Figure 10b. The size of the grid is 3 × 3 m and the number of generated grids is 72,728. The time step of numerical simulation of inundation was set to 1 s for stable calculation.
On the other hand, a number of junctions were located along the shoreline, as shown in Figure 10b. The 32 junctions were set to accept the water from wave overtopping calculated by the FLOW-3D model.
3.3. Results of Inundation Simulation
The inundation simulation model constructed for Marine City was verified during Typhoon Chaba in 2016. The inundation simulation period was from 8 a.m. to 12 a.m. on October 5, 2016. The followings were the rainfall records of the Haeundae AWS for the simulation period: the total amount of rainfall was 59.0 mm; the maximum rainfall intensity was 40.5 mm/h.
Figure 12 shows the simulation results of flooding in Marine City over time during Typhoon Chaba. Wave overtopping started at 09:20, and it was shown that the inundation area increased over time. After the time of maximum wave overtopping, the wave overtopping rate decreased, and the floodwater on the road drained through the storm sewers into the sea, which resulted in a reduction in the flooding area.
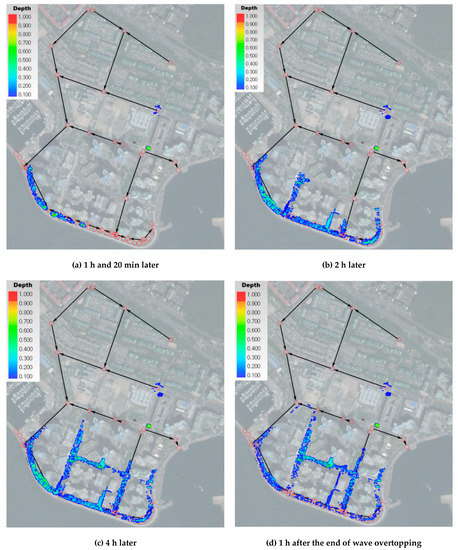
Figure 12.
Flooding simulation results over time during Typhoon Chaba in Marine City.
Figure 13 shows the five collected photographs for the flooding event and the corresponding spots of the maximum flooding area obtained from the simulation results. An area with inundation depth less than 10 cm was not considered as a flooding area. The matching of flooding between the simulation results and photographs reveals the adequacy of the simulation results for compound flooding. A field survey was also conducted for three locations to analyze the inundation results quantitatively. Figure 14 shows the images of the field survey for the sites to estimate maximum inundation depths, and the spots correspond to A, F and G in Figure 13. The analysis accuracy ranged from 88% to 92%, and the errors were less than 10 cm for the maximum inundation depths at the sites (Table 3).
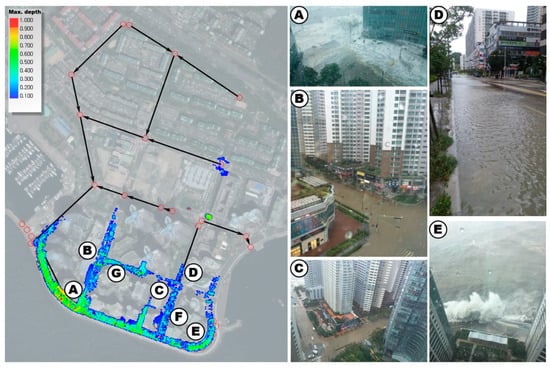
Figure 13.
Collected photographs and the corresponding spots of the maximum flooding area from the simulation.
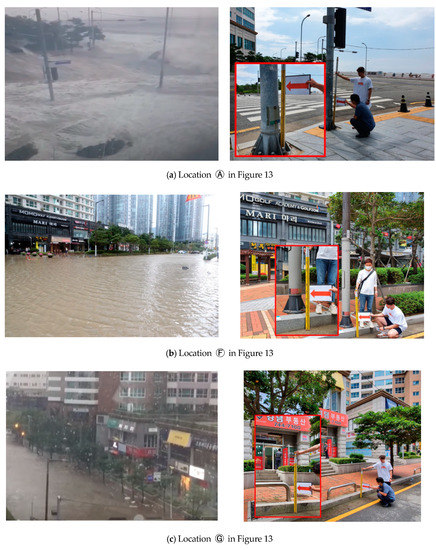
Figure 14.
Estimation of inundation depths by the field survey (right) with the actual images of the flooding (left).

Table 3.
The accuracy of simulated maximum depths.
Meanwhile, Figure 15 is the archived inundation map of the Marine City area provided by the public data portal (https://www.data.go.kr/). Compared with the analysis results, it can be confirmed that the flooding area is quite similar to the inundation map. Specifically, the areas of inundation estimated by the archived inundation map and simulation results were 35,500 m2 and 34,776 m2, respectively; the simulated inundation area was 98.0% coincident with the archived inundation map. That is, the analysis procedures of compound flooding in coastal areas by linking flow simulation models of coasts and watershed were reasonably validated.
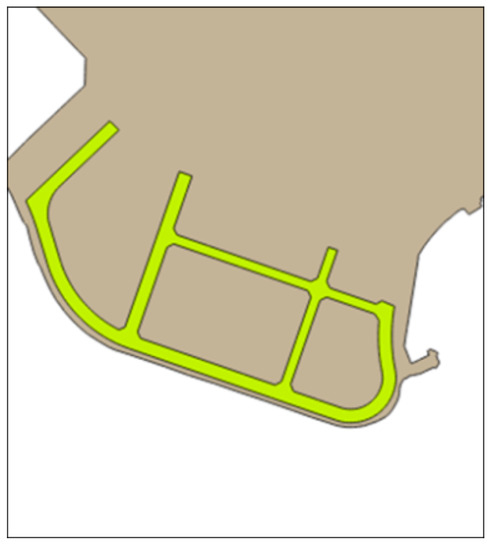
Figure 15.
Archived inundation map of the Marine City area.
4. Discussion
The compound flooding in coastal areas was analyzed by using the XP-SWMM, ADCIRC, SWAN and FLOW-3D models. As the wave overtopping during Typhoon Chaba was the main cause of the inundation, we were able to accurately simulate such inundation by using only the ADCIRC, SWAN, and FLOW-3D models. (Figure 16).
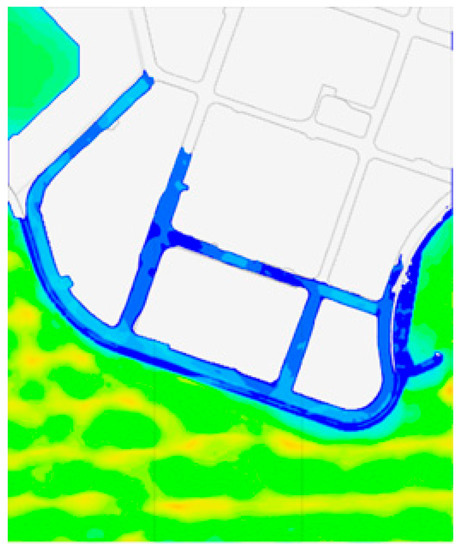
Figure 16.
Simulation results obtained from wave overtopping only.
However, under conditions where rainfall is relatively large, the flooding phenomenon can be clearly reproduced by reflecting the rainfall–runoff only. The following analyses were performed in cases of increased rainfall under a certain storm surge condition to examine the inundation effect. The return periods of rainfall were 30-year, 50-year and 100-year under the 50-year frequency storm surge yielding wave overtopping and tide. The rainfall duration was 1 h and the time distribution followed a Huff curve for third-quartile storms. The center of rainfall hyetograph was set to coincide with that of the wave overtopping series.
Figure 17 represents the analysis results. The higher the return period of rainfall, the wider the inundation area. Hence, one may obtain an enhanced result of flooding of coastal areas by linking flow simulation models of coasts with a watershed runoff model.
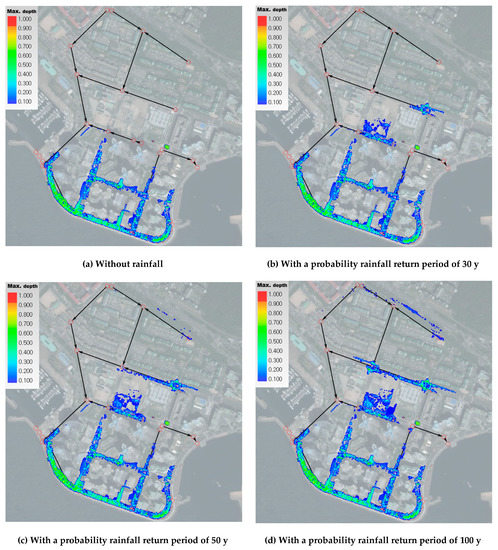
Figure 17.
Inundation areas by return periods of rainfall under the storm surge and overtopping rate of a 50 y period.
5. Conclusions
Rainfall, tide, and wave overtopping can together cause inundations in coastal areas. While analyzing compound flooding has been restricted due to difficulties of interdisciplinary analyses between hydrological and coastal engineering sectors, our study analyzed the connected processes of storm surge, waves, wave overtopping, and rainfall–runoff.
A coupled model of ADCIRC and SWAN (ADCSWAN) was used for analyzing the expected flow, including the elements of wave spectrum, tide, and storm surge from the distant ocean. Then, the FLOW-3D model was used to estimate the flow and wave overtopping rate in the coastal area. Under the boundary conditions of the sea level and wave overtopping rate, the XP-SWMM model yielded the results of the rainfall–runoff and 2D surface inundation simulations. The analysis technique was applied to Marine City located in Busan, the Republic of Korea, where the rainfall and wave overtopping occurred simultaneously during the period of Typhoon Chaba.
We visually presented the state of variation in the flooding area and depth over time from the inundation analysis. Besides, the analysis results were validated by comparing them with the archived inundation map and image materials, namely, newspapers, photos, and videos. As a result, the simulated inundation area was approximately 98% coincident with the archived inundation map, and the maximum inundation depths were about 90% accurate at the three surveyed sites. These results supported the notion that the analysis technique was reasonable.
The procedures in this study are meaningful as they can contribute to the improvement of reproducibility of real phenomena of compound flooding in coastal areas through linked application of flow simulation tools of coasts and watershed.
Author Contributions
Conceptualization, S.L. and T.K.; methodology, T.K. and S.L.; software, T.K., D.S. and J.-J.P.; validation, T.K., D.S. and J.-J.P.; formal analysis, T.K. and S.L.; investigation, T.K., D.S. and J.-J.P.; resources, D.S. and J.-J.P.; writing—original draft preparation, T.K. and D.S.; writing—review and editing, S.L.; supervision, S.L.; project administration, S.L.; funding acquisition, S.L. All authors have read and agreed to the published version of the manuscript.
Funding
This research received no external funding.
Acknowledgments
This research was supported by a grant (2018-MOIS31-008) of Fundamental Technology Development Program for Extreme Disaster Response funded by Ministry of Interior and Safety (MOIS, Korea).
Conflicts of Interest
The authors declare no conflict of interest.
References
- Song, Y.S.; Joo, J.G.; Lee, J.H.; Park, M.J. A study on estimation of inundation area in coastal urban area applying wave overtopping. J. Korean Soc. Hazard Mitig. 2017, 17, 501–510. [Google Scholar] [CrossRef]
- Kang, T.U.; Lee, S.H.; Sun, D.K. A technical review for reducing inundation damage to high-rise and underground-linked complex buildings in coastal areas (1): Proposal for analytical method. J. Korean Soc. Hazard Mitig. 2019, 19, 35–43. [Google Scholar] [CrossRef]
- Kim, J.S.; Lee, W.H. Analysis on complex disaster information contents for building disaster map of coastal cities. J. Korean Assoc. Geogr. Inf. Stud. 2016, 19, 43–60. [Google Scholar] [CrossRef]
- Vousdoukas, M.; Mentaschi, L.; Voukouvalas, E.; Kakoulaki, G.; De Souza Perreira, P.; Lino, A.; Feyen, L. Assessing compound flooding risk through dynamic simulations: Application in Recife, Brazil. In Proceedings of the 20th EGU General Assembly Conference, Vienna, Austria, 4–13 April 2018; Volume 20, p. 2589. [Google Scholar]
- Bevacqua, E.; Maraun, D.; Vousdoukas, M.I.; Voukouvalas, E.; Vrac, M.; Mentaschi, L.; Widmann, M. Higher probability of compound flooding from precipitation and storm surge in Europe under anthropogenic climate change. Sci. Adv. 2019, 5, eaaw5531. [Google Scholar] [CrossRef]
- Yook, K.Y.; Jung, J.H.; Shin, C.O.; Ahn, Y.S.; Lee, A.R. Evaluation and improvement of coastal areas’ climate change response capabilities: With focus on climate change adaptation capability of coastal municipalities. Korea Marit. Inst. 2012, 178–180. [Google Scholar]
- Kim, S.G. Busan City to Prepare Measures for Damage from Heavy Rain on July 7th. Available online: https://www.busan.go.kr/nbtnews/163377?curPage=1871&srchBeginDt=&srchEndDt=&srchKey=&srchText (accessed on 5 February 2020).
- Ye, F.; Zhang, Y.J.; Yu, H.; Sun, W.; Moghimi, S.; Myers, E.; Martins, K. Simulating storm surge and compound flooding events with a creek-to-ocean model: Importance of baroclinic effects. Ocean Model. 2020, 145, 101526. [Google Scholar] [CrossRef]
- Pokharel, P.; Takeda, M.; Matsuo, N. Study of inundation in the coastal city due to heavy rainfall considering the effect of global warming. In Proceedings of the World Environmental and Water Resources Congress 2007: Restoring Our Natural Habitat, Tampa, FL, USA, 15–19 May 2007; pp. 1–9. [Google Scholar]
- Ray, T.; Stepinski, E.; Sebastian, A.; Bedient, P.B. Dynamic modeling of storm surge and inland flooding in a Texas coastal floodplain. J. Hydraul. Eng. 2011, 137, 103–110. [Google Scholar] [CrossRef]
- Karamouz, M.; Zahmatkesh, Z.; Goharian, E.; Nazif, S. Combined impact of inland and coastal floods: Mapping knowledge base for development of planning strategies. J. Water Resour. Plan. Manag. 2015, 141, 04014098. [Google Scholar] [CrossRef]
- Choi, J.W.; Jun, H.D. Inundation Damage Assessment for Coastal Urban Area Considering Complex Causes of Inundation. J. Korean Soc. Hazard Mitig. 2018, 18, 283–290. [Google Scholar] [CrossRef][Green Version]
- Leroy, S.; Pedreros, R.; Andre, C.; Paris, F.; Lecacheux, S.; Marche, F.; Vinchon, C. Coastal flooding of urban areas by overtopping: Dynamic modelling application to the Johanna storm (2008) in Gâvres (France). Nat. Hazard Earth Syst. Sci. Discuss. 2014, 2, 4947–4985. [Google Scholar] [CrossRef]
- Gallien, T.W. Validated coastal flood modeling at Imperial Beach, California: Comparing total water level, empirical and numerical overtopping methodologies. J. Coast. Eng. 2016, 111, 95–104. [Google Scholar] [CrossRef]
- Suh, S.W.; Kim, H.J. Simulation of Wave Overtopping and Inundation over a Dike Caused by Typhoon Chaba at Marine City, Busan, Korea. J. Coast. Res. 2018, 85, 711–715. [Google Scholar] [CrossRef]
- O’Grady, J.G.; Cohen, R.C.; Prakash, M.; McInnes, K.L.; Hoeke, R.K. Wave overtopping in the city scale coupled hydrodynamic/hydraulic numerical inundation model: C-FAST. In Proceedings of the Australasian Coasts and Ports 2019 Conference: Future Directions from 40 [degrees] S and beyond, Hobart, Australia, 10–13 September 2019; pp. 924–927. [Google Scholar]
- Owen, M.W. Design of Seawalls Allowing for Wave Overtopping; Report No. Ex 924; Hydraulic Research: Wallingford, UK, 1980. [Google Scholar]
- Chen, X.; Ji, P.; Wu, Y.; Zhao, L. Coupling simulation of overland flooding and underground network drainage in a coastal nuclear power plant. Nucl. Eng. Des. 2017, 325, 129–134. [Google Scholar] [CrossRef]
- Ferreira, C.M.; Irish, J.L.; Olivera, F. Quantifying the potential impact of land cover changes due to sea-level rise on storm surge on lower Texas coast bays. Coast Eng. 2014, 94, 102. [Google Scholar] [CrossRef]
- Ferreira, C.M.; Irish, J.L.; Olivera, F. Uncertainty in hurricane surge simulation due to land cover specification. J. Geophys. Res. Ocean. 2014, 119, 1812–1827. [Google Scholar] [CrossRef]
- Bunya, S.; Dietrich, J.C.; Westerink, J.J.; Ebersole, B.A.; Smith, J.M.; Atkinson, J.H. A high resolution coupled riverine flow, tide, wind, wind wave and storm surge model for southern Louisiana and Mississippi: Part II—Synoptic description and analyses of Hurricanes Katrina and Rita. Mon. Weather Rev. 2010, 138, 378–404. [Google Scholar] [CrossRef]
- Dietrich, J.C.; Zijlema, M.; Westerink, J.J.; Holthuijsen, L.H.; Dawson, C.; Luettich, R.A.; Jensen, R.E.; Smith, J.M.; Stelling, G.S.; Stone, G.W. Modeling hurricane waves and storm surge using integrally-coupled scalable computations. Coast Eng. 2011, 58, 45–65. [Google Scholar] [CrossRef]
- Suh, S.W.; Lee, H.Y.; Kim, H.J.; Fleming, J.G. An efficient early warning system for typhoon storm surge based on time-varying advisories by coupled ADCIRC and SWAN. Ocean Dyn. 2015, 65, 617–646. [Google Scholar] [CrossRef]
- Xie, D.M.; Zou, Q.P.; Cannon, J.W. Application of SWAN + ADCIRC to tide-surge and wave simulation ingulf of maine during patriot’s day storm. Water Sci. Eng. 2016, 9, 33–41. [Google Scholar] [CrossRef]
- Deb, M.; Ferreira, C.M. Simulation of cyclone-induced storm surges in the low-lying delta of Bangladesh using coupled hydrodynamic and wave model (SWAN + ADCIRC). J. Flood Risk Manag. 2018, 11, 750–765. [Google Scholar] [CrossRef]
- Luettich, R.A.; Westerink, J.J. Formulation and Numerical Implementation of the 2D/3D ADCIRC Finite Element Model Version 44.XX; Theory report; University of North Carolina at Chapel Hill: North Carolina, NC, USA, 2004. [Google Scholar]
- Ziilema, M. Computation of wind-wave spectra in coastal waters with SWAN on unstructured grids. Coast. Eng. 2010, 57, 267–277. [Google Scholar] [CrossRef]
- Booij, N.; Ris, R.C.; Holthuijsen, L.H. A third-generation wave model for coastal regions: 1. Model description and validation. J. Geophys. Res. 1999, 104, 7649–7666. [Google Scholar] [CrossRef]
- Dentale, F.; Donnarumma, G.; Carratelli, E.P. Wave run up and reflection on tridimensional virtual breakwater. J. Hydrogeol. Hydrol. Eng. 2012, 1, 102–110. [Google Scholar] [CrossRef]
- Yakhot, V.; Orszag, S.A.; Thangam, S.; Gatski, T.B.; Speziale, C.G. Development of Turbulence Models for Shear Flows by a Double Expansion Technique. Phys. Fluids A Fluid Dyn. 1992, 4, 1510–1520. [Google Scholar] [CrossRef]
- Musa, M.A.; Maliki, A.Y.; Ahmad, M.F.; Sani, W.N.; Yaakob, O.; Samo, K. Numerical Simulation of Wave Flow Over the Overtopping Breakwater for Energy Conversion (OBREC) Device. Procedia Eng. 2017, 194, 166–173. [Google Scholar] [CrossRef]
- Kim, G.B. Numerical Simulation of Three-Dimensional Tsunami Generation by Subaerial Landslides. Ph.D. Thesis, Texas A&M University, Texas, TX, USA, 2012. [Google Scholar]
- Sogut, D.V.; Yalciner, A.C. Performance Comparison of NAMI DANCE and FLOW-3D® Models in Tsunami Propagation, Inundation and Currents using NTHMP Benchmark Problems. Pure Appl. Geophys. 2018, 176, 3115–3153. [Google Scholar] [CrossRef]
- Anees, M.T.; Abdullah, K.; Nordin, M.N.M.; Ab Rahman, N.N.N.; Syakir, M.I.; Kadir, M.O.A. One-and two-dimensional hydrological modelling and their uncertainties. Flood Risk Manag. 2017, 11, 221–244. [Google Scholar]
- Walch, M.P.; Christ, T.J.; Brant, W.M. Combining new Technologies with computer modeling to prevent sanitary sewer overflows resulting from urban rainfall induced peak flow conditions: The Miami–Dade Water and Sewer Department experience. In Proceedings of the ASCE 29th Annual Water Resources Planning and Management Conference, Tempe, AZ, USA, 6–9 June 1999; pp. 1–6. [Google Scholar]
- Phillips, B.C.; Yu, S.; Thompson, G.R.; De Silva, N. 1D and 2D modelling of urban drainage systems using XP-SWMM and TUFLOW. In Proceedings of the 10th International Conference on Urban Drainage, Copenhagen, Denmark, 21–26 August 2005; p. 68. [Google Scholar]
- Barnard, T.; Kuch, A.; Thompson, G.R.; Mudaliar, S.; Phillips, B.C. Evolution of an integrated 1D/2D modeling package for urban drainage. J. Water Manag. Model. 2007, 18, 343–365. [Google Scholar] [CrossRef]
- Ricks, M.D. Development of Computer Simulation Model for Urban Region Using XP-SWMM in Savannah, Georgia. Ph.D. Thesis, University of South Carolina, Columbia, CA, USA, 2015. [Google Scholar]
- Kang, N.R.; Kim, S.J.; Kim, Y.S.; Noh, H.S.; Hong, S.J.; Kim, H.S. Urban drainage system improvement for climate change adaptation. Water 2016, 8, 268. [Google Scholar] [CrossRef]
- Diya, S.G.; Kamarudin, M.K.A.; Gasim, M.B.; Toriman, M.E.; Juahir, H.; Umar, R.; Saudi, A.S.M.; Abdullahi, M.G.; Rabiu, A.A. Flood simulation model using XP-SWMM along Terengganu River, Malaysia. J. Fundam. Appl. Sci. 2017, 9, 66–81. [Google Scholar] [CrossRef][Green Version]
- Hasan, H.H.; Razali, M.; Fatin, S.; Zaki, A.; Ibrahim, A.Z.; Mohamad Hamzah, F. Integrated hydrological-hydraulic model for flood simulation in tropical urban catchment. Sustainability 2019, 11, 6700. [Google Scholar] [CrossRef]
- Lee, H.Y.; Suh, S.W. Application of EurOtop to improve simulations of coastal inundations due to wave overtopping. J. Coast. Res. 2016, 75, 1377–1381. [Google Scholar] [CrossRef]
© 2020 by the authors. Licensee MDPI, Basel, Switzerland. This article is an open access article distributed under the terms and conditions of the Creative Commons Attribution (CC BY) license (http://creativecommons.org/licenses/by/4.0/).