Article

Making Use of Sustainable Local Plant Genetic Resources: Would Consumers Support the Recovery of a Traditional Purple Carrot?

by
Azucena Gracia
1,2,*,
Ana María Sánchez
3,2,
Francesc Jurado
1 and
Cristina Mallor
3,2
1
Unidad de Economía Agroalimentaria y de los Recursos Naturales, Centro de Investigación y Tecnología Agroalimentaria de Aragón (CITA), Avda Montañana, 930, 50059 Zaragoza, Spain
2
Instituto Agroalimentario de Aragón-IA2, (CITA-Universidad de Zaragoza), Zaragoza, Spain
3
Unidad de Hortofruticultura, Centro de Investigación y Tecnología Agroalimentaria de Aragón (CITA), Avda Montañana, 930, 50059 Zaragoza, Spain
*
Author to whom correspondence should be addressed.
Sustainability 2020, 12(16), 6549; https://doi.org/10.3390/su12166549
Submission received: 4 July 2020 / Revised: 9 August 2020 / Accepted: 11 August 2020 / Published: 13 August 2020

Abstract

:
Local plant genetic resources are of vital importance for the resilience of the agroecosystems, especially under conditions of global climate change. The diversification of production using these resources is postulated as an alternative for the development of rural areas with non-optimal farming conditions and/or disadvantaged by depopulation. However, in order to sustainably utilize local genetic resources, their use has also to provide products accepted by consumers. The aim of this study was to evaluate consumer acceptance of a local purple carrot that is a Spanish landrace at risk of genetic erosion from Teruel, a province in the Aragón region seriously affected by depopulation and extreme weather conditions, to contribute to its sustainable recovery. Consumer preferences for carrots with different characteristics (color, price, variety, and production system) were studied, and their willingness to pay (WTP) for the local purple carrots was assessed. Data from a survey conducted in this Spanish region was used. We identified two segments of consumers with different willingness to pay, hedonic liking, and intention to purchase the purple local carrots. These traditional purple carrots would be accepted by the segment of consumers more willing to pay for and more likely to purchase these carrots. The traditional purple carrots should be promoted, emphasizing that they are produced by a local landrace whose purple color is due to anthocyanic pigments with known antioxidant properties.

1. Introduction

Agricultural intensification with modern plant varieties has contributed to the loss of traditional crop species and their genetic diversity. This loss of variation in crops, known as genetic erosion, constitutes a major problem. The main cause of genetic erosion, according to the Food and Agriculture Organization of the United Nations [1], is the replacement of local varieties with modern varieties. Modern varieties are preferred over landraces (locally adapted, traditional plant varieties, or farmers’ varieties) because they typically provide higher benefits to producers, such as crop yield [2]. Contrary to modern varieties, landraces tend not to be genetically uniform and contain high levels of genetic diversity [1]. Landraces may present a higher resistance to pests, diseases, and abiotic stresses and may be better adapted to local climate conditions and drought stress, which could compensate their lower yield. In any case, both landraces and modern varieties have merit depending on a farmer’s priorities and farming conditions (for more details, see the review of Ficiciyan et al. [2]).
Access to local and adapted varieties is of vital importance for the resilience of the agroecosystems, especially under the current condition of global climate change [2]. The recently published EU “Farm to Fork Strategy” states that sustainable food systems should rely on seed security and diversity. Therefore, the Commission will take measures to facilitate the registration of seed varieties and to ensure easier market access for locally-adapted varieties [3].
In this context, small-scale farmers may prefer once again using local landraces not only due to regional cultural features (family traditions, cooking characteristics for special dishes, taste, etc.), which make them more profitable in the local area [2], but also to enhance biodiversity in situ preservation and to obtain a sustainable food system. The diversification of production using local plant genetic resources is postulated as an alternative for the development of rural areas disadvantaged by depopulation [4]. In these areas, it is important to find alternative or complementary agricultural products that contribute to regional economic development and, consequently, to social sustainability. The use of local plant genetic resources could be a socio-economically sustainable activity for producers in areas with non-optimal farming conditions by contributing to population stabilization in rural areas.
Nowadays, a local purple carrot landrace is maintained in the Spanish Genebank at the Centro de Investigación y Tecnología Agroalimentaria de Aragón (CITA-Aragón). This variety was traditionally produced in a remote area of the province of Teruel (NUTS 3; Maestrazgo county), in the Spanish region of Aragón (NUTS 2), although it is no longer produced. There is a significant interest in restoring the cultivation of this local purple carrot landrace due to its adaptation to the local agro-environmental conditions of the rural area [5]. The province of Teruel is predominantly rural, sparsely populated, and is classified as a “less favored area” in the EU rural development schemes [6]. It is characterized by extreme climatic conditions, low productivity soils, extensive arid areas affected by strong north-easterly winds, scarce and irregular rainfall, and one of the lowest population densities in Spain [7]. The specific rural area of Maestrazgo covers an area of 1204.3 square kilometers and has a population of 3177 inhabitants, giving it a population density of 2.6 inhabitants per square kilometer, which is defined as a demographic desert [8].
Consumers are increasingly interested in buying local food products for socio-economic reasons, such as increasing farmers’ incomes, adding greater value to local stakeholders, and maintaining the population of a territory, and for environmental reasons, such as decreasing transport and energy use and reducing the use of packaging [9,10]. Past research reviewed by Feldmann and Hamm [11] indicated that the most important reasons to purchase local food products were related to the product quality (i.e., freshness, better quality, taste), followed by other altruistic motives, such as care for the environment and support of the local farmers and the local economy. However, in the case of purple carrots, consumers may be reluctant to accept them because they are too used to orange ones, and they could not recognize the purple carrots as a traditional variety. Thus, this research was an attempt to evaluate, by analyzing consumer acceptance, the sustainability prospects of recovering a local purple carrot.

2. Literature Review, Research Objective, and Hypotheses

Empirical studies on consumer preferences for carrots are scarce, and most of them have analyzed consumers’ preferences for carrots of different colors [12,13,14,15,16]. In particular, Surles et al. [12], Szymczak et al. [13], and Schifferstein et al. [16] studied sensory preferences for carrots of different colors (e.g., orange, purple, yellow) using liking scores for different sensory characteristics, purchase intention, and familiarity. Surles et al. [12] stated that orange carrots were the most preferred, while the purple carrots tended to be the least favorite. In the same way, Szymczak et al. [13] reported higher scores for orange carrots than for yellow, white, and purple ones. Shifferstein et al. [16] found that non-orange carrots (yellow, purple, and red) were perceived as less attractive and less familiar and that consumers were more likely to prepare and eat the orange carrots than the other ones. However, these studies on carrots do not analyze consumers’ preferences for non-sensory carrot characteristics, such as the production system (e.g., organic), origin (e.g., local), or price.
As far as we know, only Nganje et al. [14] analyzed consumer preferences for spinach and carrots with different non-sensory attributes: production origin (i.e., country, state), traceability (yes or not), locally produced (local logo), and price. They used a choice experiment to assess willingness to pay for the different attributes. Choice modeling assumes that consumers choose between alternative products that possess different attributes with different levels in order to maximize their utility. This utility, according to Lancaster [17], is the sum of the separate utilities for their attributes. This utility is known to the individual but not to the researcher, who observes some product attributes, while some components are unobservable and considered stochastic following the random utility theory of McFadden [18]. Thus, consumers’ utility is assumed to be a random variable.
Traditionally, consumers’ preferences were assumed to be homogeneous, and the consumers’ utility was specified as conditional logit models [18]. However, numerous choice experiment applications for food products have found that consumers’ preferences are heterogeneous [19,20,21,22,23], although they do not explain this heterogeneity. Several studies on consumers’ valuation of food products have increasingly used a latent class (LC) model specification when the objective is to explain heterogeneity and to find consumer segments [24,25,26,27,28] and, in particular, for horticultural products [29,30]. Based on this evidence, it is necessary to deepen and expand previous literature on consumers’ preferences for carrots by analyzing one important sensory attribute for carrots (color) in relation to other important extrinsic attributes (e.g., price, local variety), taking into account and explaining the consumers’ heterogeneity in preferences.
The aim of this study was to evaluate consumer acceptance of a local purple carrot that is a Spanish landrace at risk of genetic erosion from Teruel, a province in the Aragón region seriously affected by depopulation and extreme weather conditions, to contribute to its sustainable recovery. Our research question asks if consumers in the region where the local landrace was produced would support the recovery of this local purple carrot. Two hypotheses guide our research:
Hypotheses (H1).
Consumers’ preferences for carrots are heterogeneous. This hypothesis is based on results from Carroll et al. [19], Hempel and Hamm [20,21], Onozaka and McFadden [22], Skreli et al. [29], and Yue et al. [30].
Hypotheses (H2).
The valuation of the purple color of carrots is improved when adding information on the local origin and/or the organic method of production. This hypothesis builds on findings from Surles et al. [12], Szymzcak et al. [13], Shifferstein et al. [16], and Martinez-Carrasco et al. [31].
In this work, attributes influencing consumers’ utility of carrots were studied through an online survey, including a choice experiment. The parameters of the consumers’ utility function for carrots were estimated using a latent class (LC) model that allows integration of the choice experiment and consumer segmentation to approach heterogeneity. Marginal willingness to pay (WTP) for each of the attributes and for their interactions was studied to give an estimation on the maximum consumer price for the recovered purple carrots. Additionally, heterogeneity was explained based on socio-demographic characteristics, food purchase and consumption habits, knowledge on carrots, hedonic preferences, and intention to purchase purple carrots. These hedonic preferences and the intention to purchase were assessed under different levels of information about the local landrace and health benefits.

3. Materials and Methods

3.1. Data Collection and Survey Description

Data were collected from an online survey conducted in the region where the local landrace was produced (Aragón) in July 2016. Consumers were stratified by gender, age, and the province of residence. The final sample size consisted of 405 people, resulting in a sampling error of ±5%, and a confidence level of 95.5% (k = 2) when estimating proportions for the more conservative scenario (p = q = 0.5).
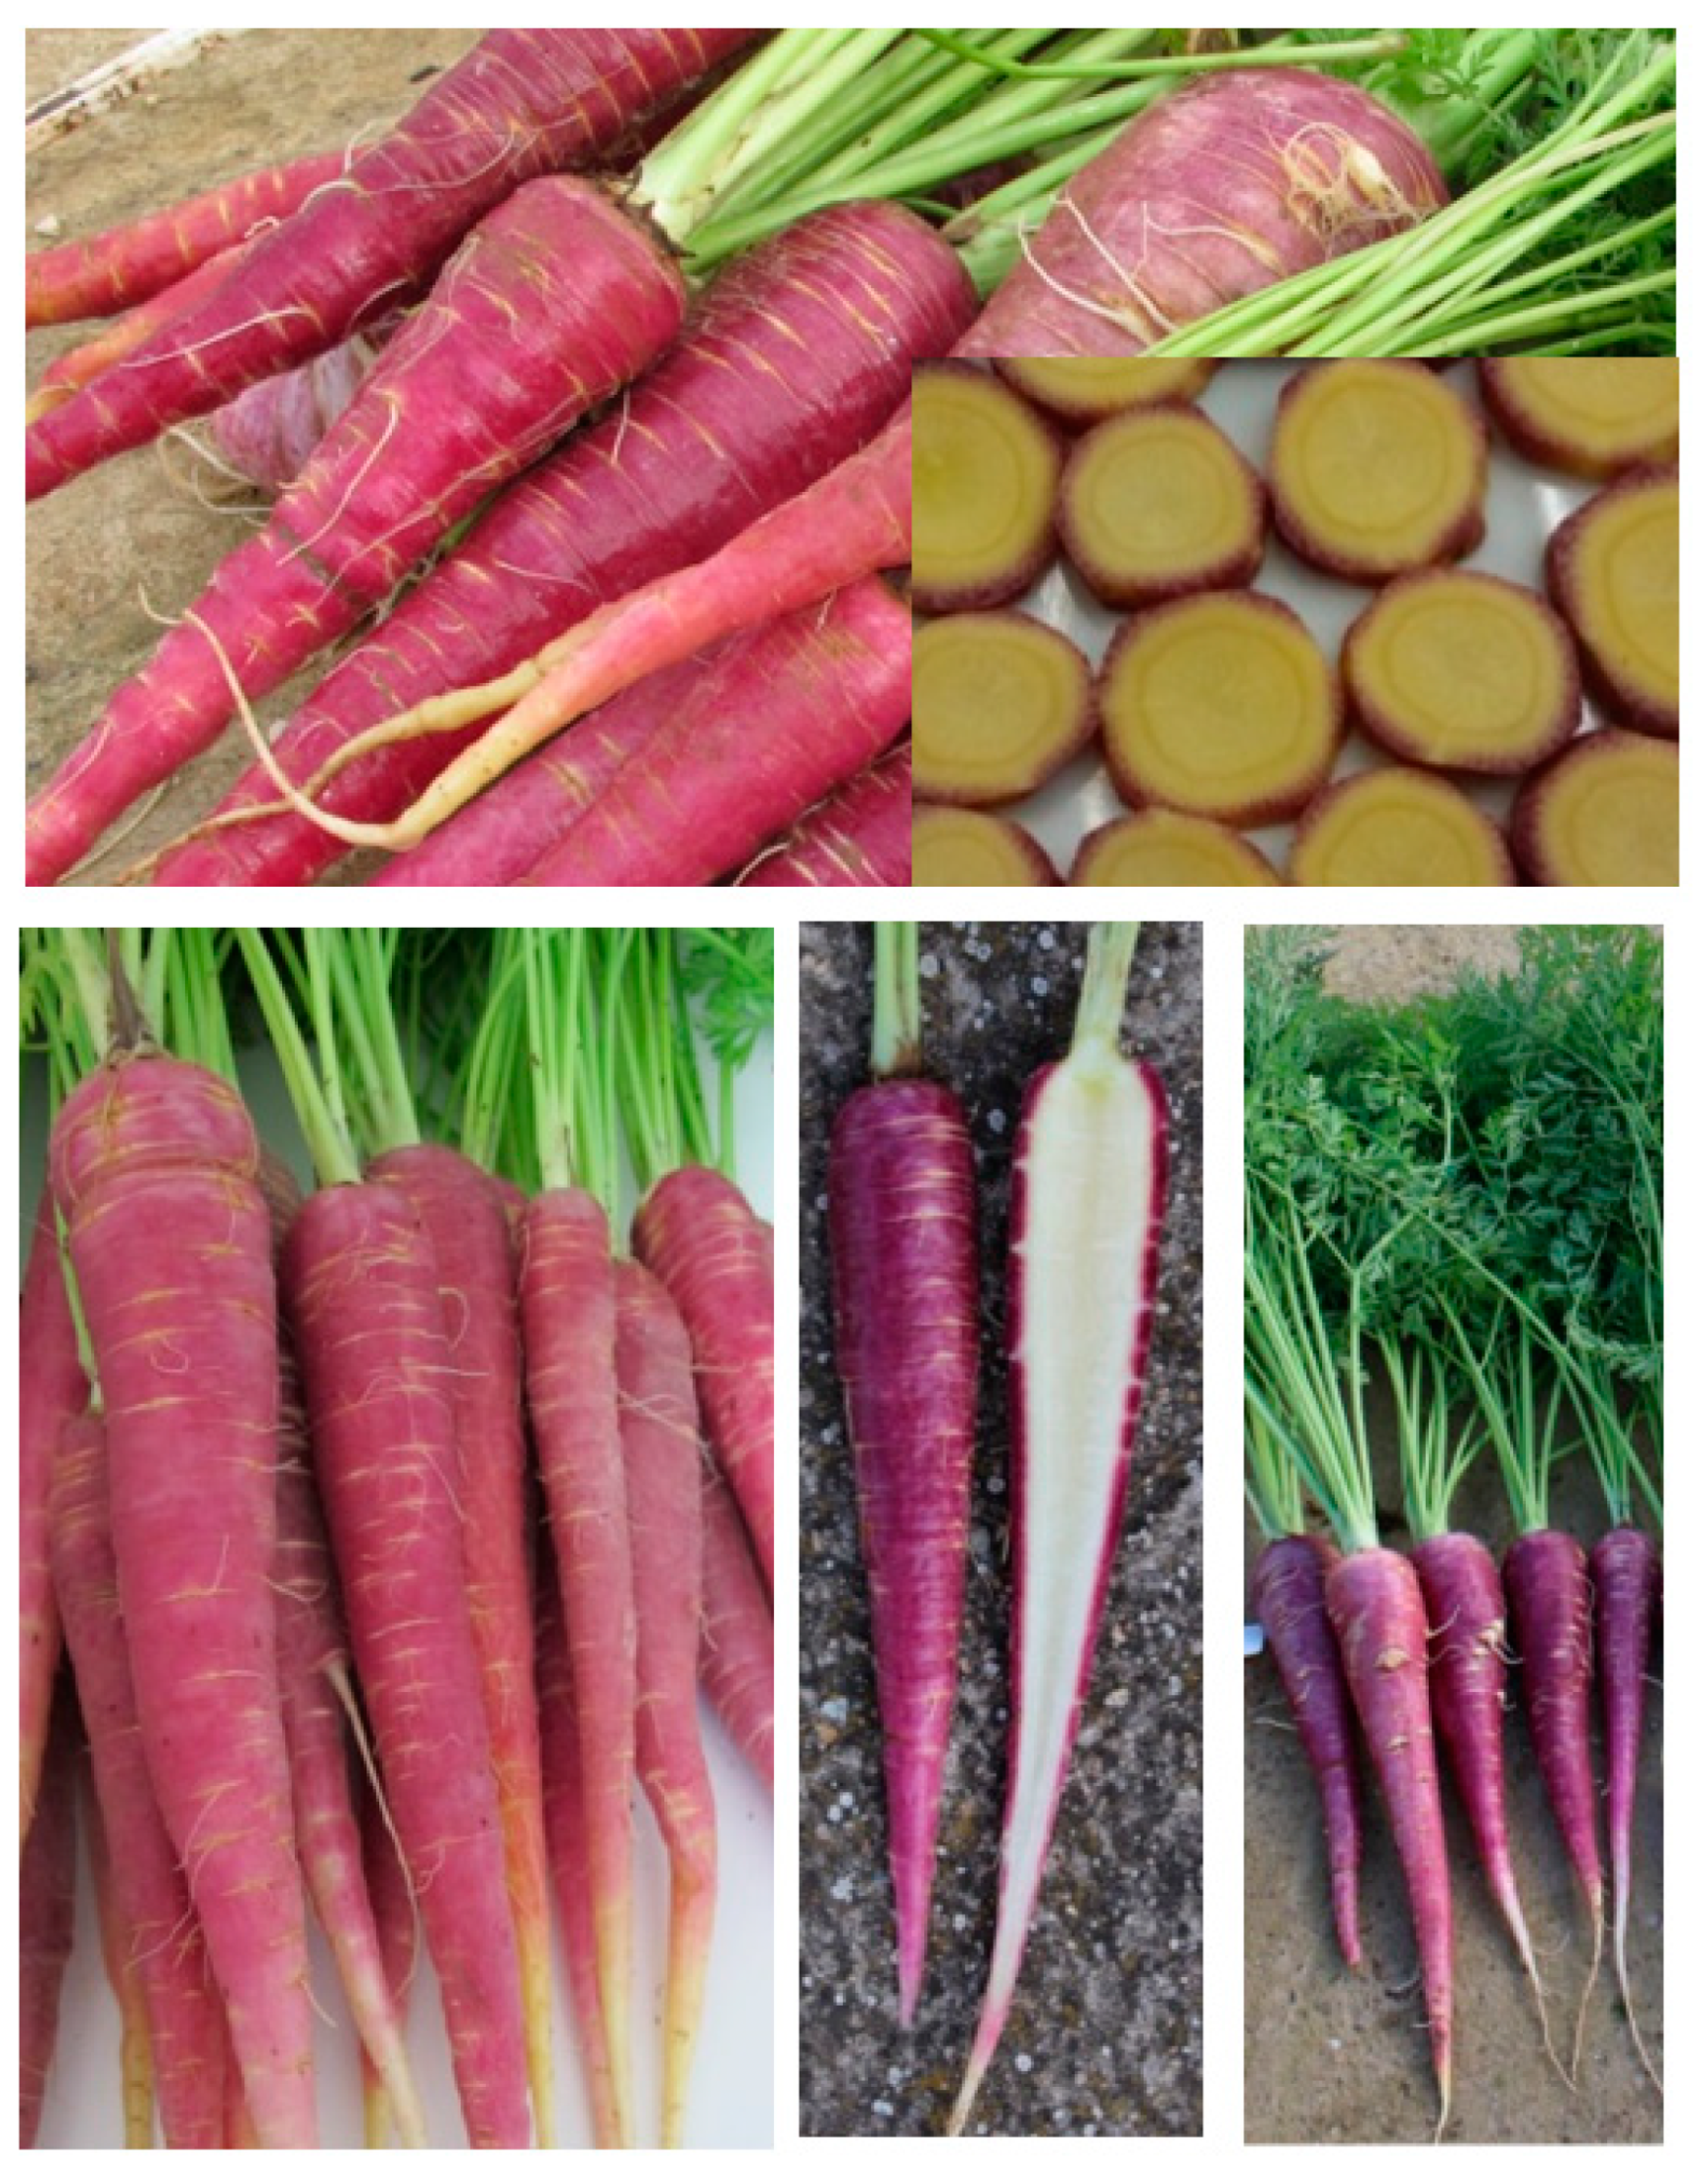
Before the final questionnaire was distributed, a pilot survey was conducted with a sample of respondents (N = 15) to test general understanding and response time. The final questionnaire was structured into four parts. The first part contained questions related to consumers’ consumption and purchase habits regarding vegetables and carrots and on knowledge about carrots. In order to measure knowledge of carrots, an “objective knowledge” approach was used. Respondents were asked to indicate if five sentences related to carrots were true or false. The statements were: (1) carrots have vitamin A; (2) a carrot is a tuber; (3) carrots can only be orange; (4) carrots are high in antioxidants; (5) eating carrots helps preserve eyesight. Sentences (1), (4), and (5) are true, while sentences (2) and (3) are false. When an answer was correct, the sentence received the value 1, and the value of 0 when wrong. A summary index was created for the five sentences. Thus, the knowledge index ranged from 0 to 5. The second part asked respondents about the appeal of and their potential intention to purchase purple carrots after they were shown different pictures of purple carrots (whole and cut in slices) (Figure 1). They rated how much they liked the appeal of purple carrots using a 9-point hedonic scale from 1 (extremely dislike) to 9 (extremely like).
In addition, we asked respondents about their intention to purchase the purple carrots using a scale from 1 (very unlikely) to 5 (very likely). Afterward, respondents received the following information “These purple carrots are from a local landrace from Aragón, more specifically, from Maestrazgo County (Teruel). These carrots are purple because they have different natural pigments”. Then, the two previous questions on the carrot’s appeal and the consumer’s intention to purchase were asked again to respondents. After that, participants received the following information “These purple carrots have high antioxidant content; thus, their consumption has health benefits for preventing cardiovascular and metabolic diseases”. The same two questions were again posed to participants. The third part consisted of the choice experiment task described in Section 3.2 below.
Before the choice experiment questions, a description of the attributes and levels was presented to participants to ensure that they were aware of the alternative products. Participants were asked to read a cheap talk script to encourage and motivate them to reveal their real preferences and minimize potential hypothetical bias [32]. Finally, questions on socio-demographic characteristics (i.e., age, family size, income, education level, and the province of residence) were included in the fourth part of the questionnaire.

3.2. Choice Experiment Design

First, we selected the product (half kilo package of carrots) and, second, the attributes and their levels. Table 1 shows the selected attributes and their levels.
Besides the price, we selected the attributes of color (purple and orange) and the variety (local or non-local) based on our objective. Previous empirical studies on fresh fruits and vegetables have indicated that being organically produced is also an important product characteristic together with the local origin [19,20,21,22,23,31]. Thus, we selected the production system (organic or conventional) as an important attribute. The price levels were established based on the market prices at the time of the experiment: 0.5 €/package, 0.8 €/package, 1.1 €/package, and 1.4 €/package. The other three attributes had two levels: orange or purple for “color”; local or not local for “variety”; organic or conventional for “production method” (Table 1).
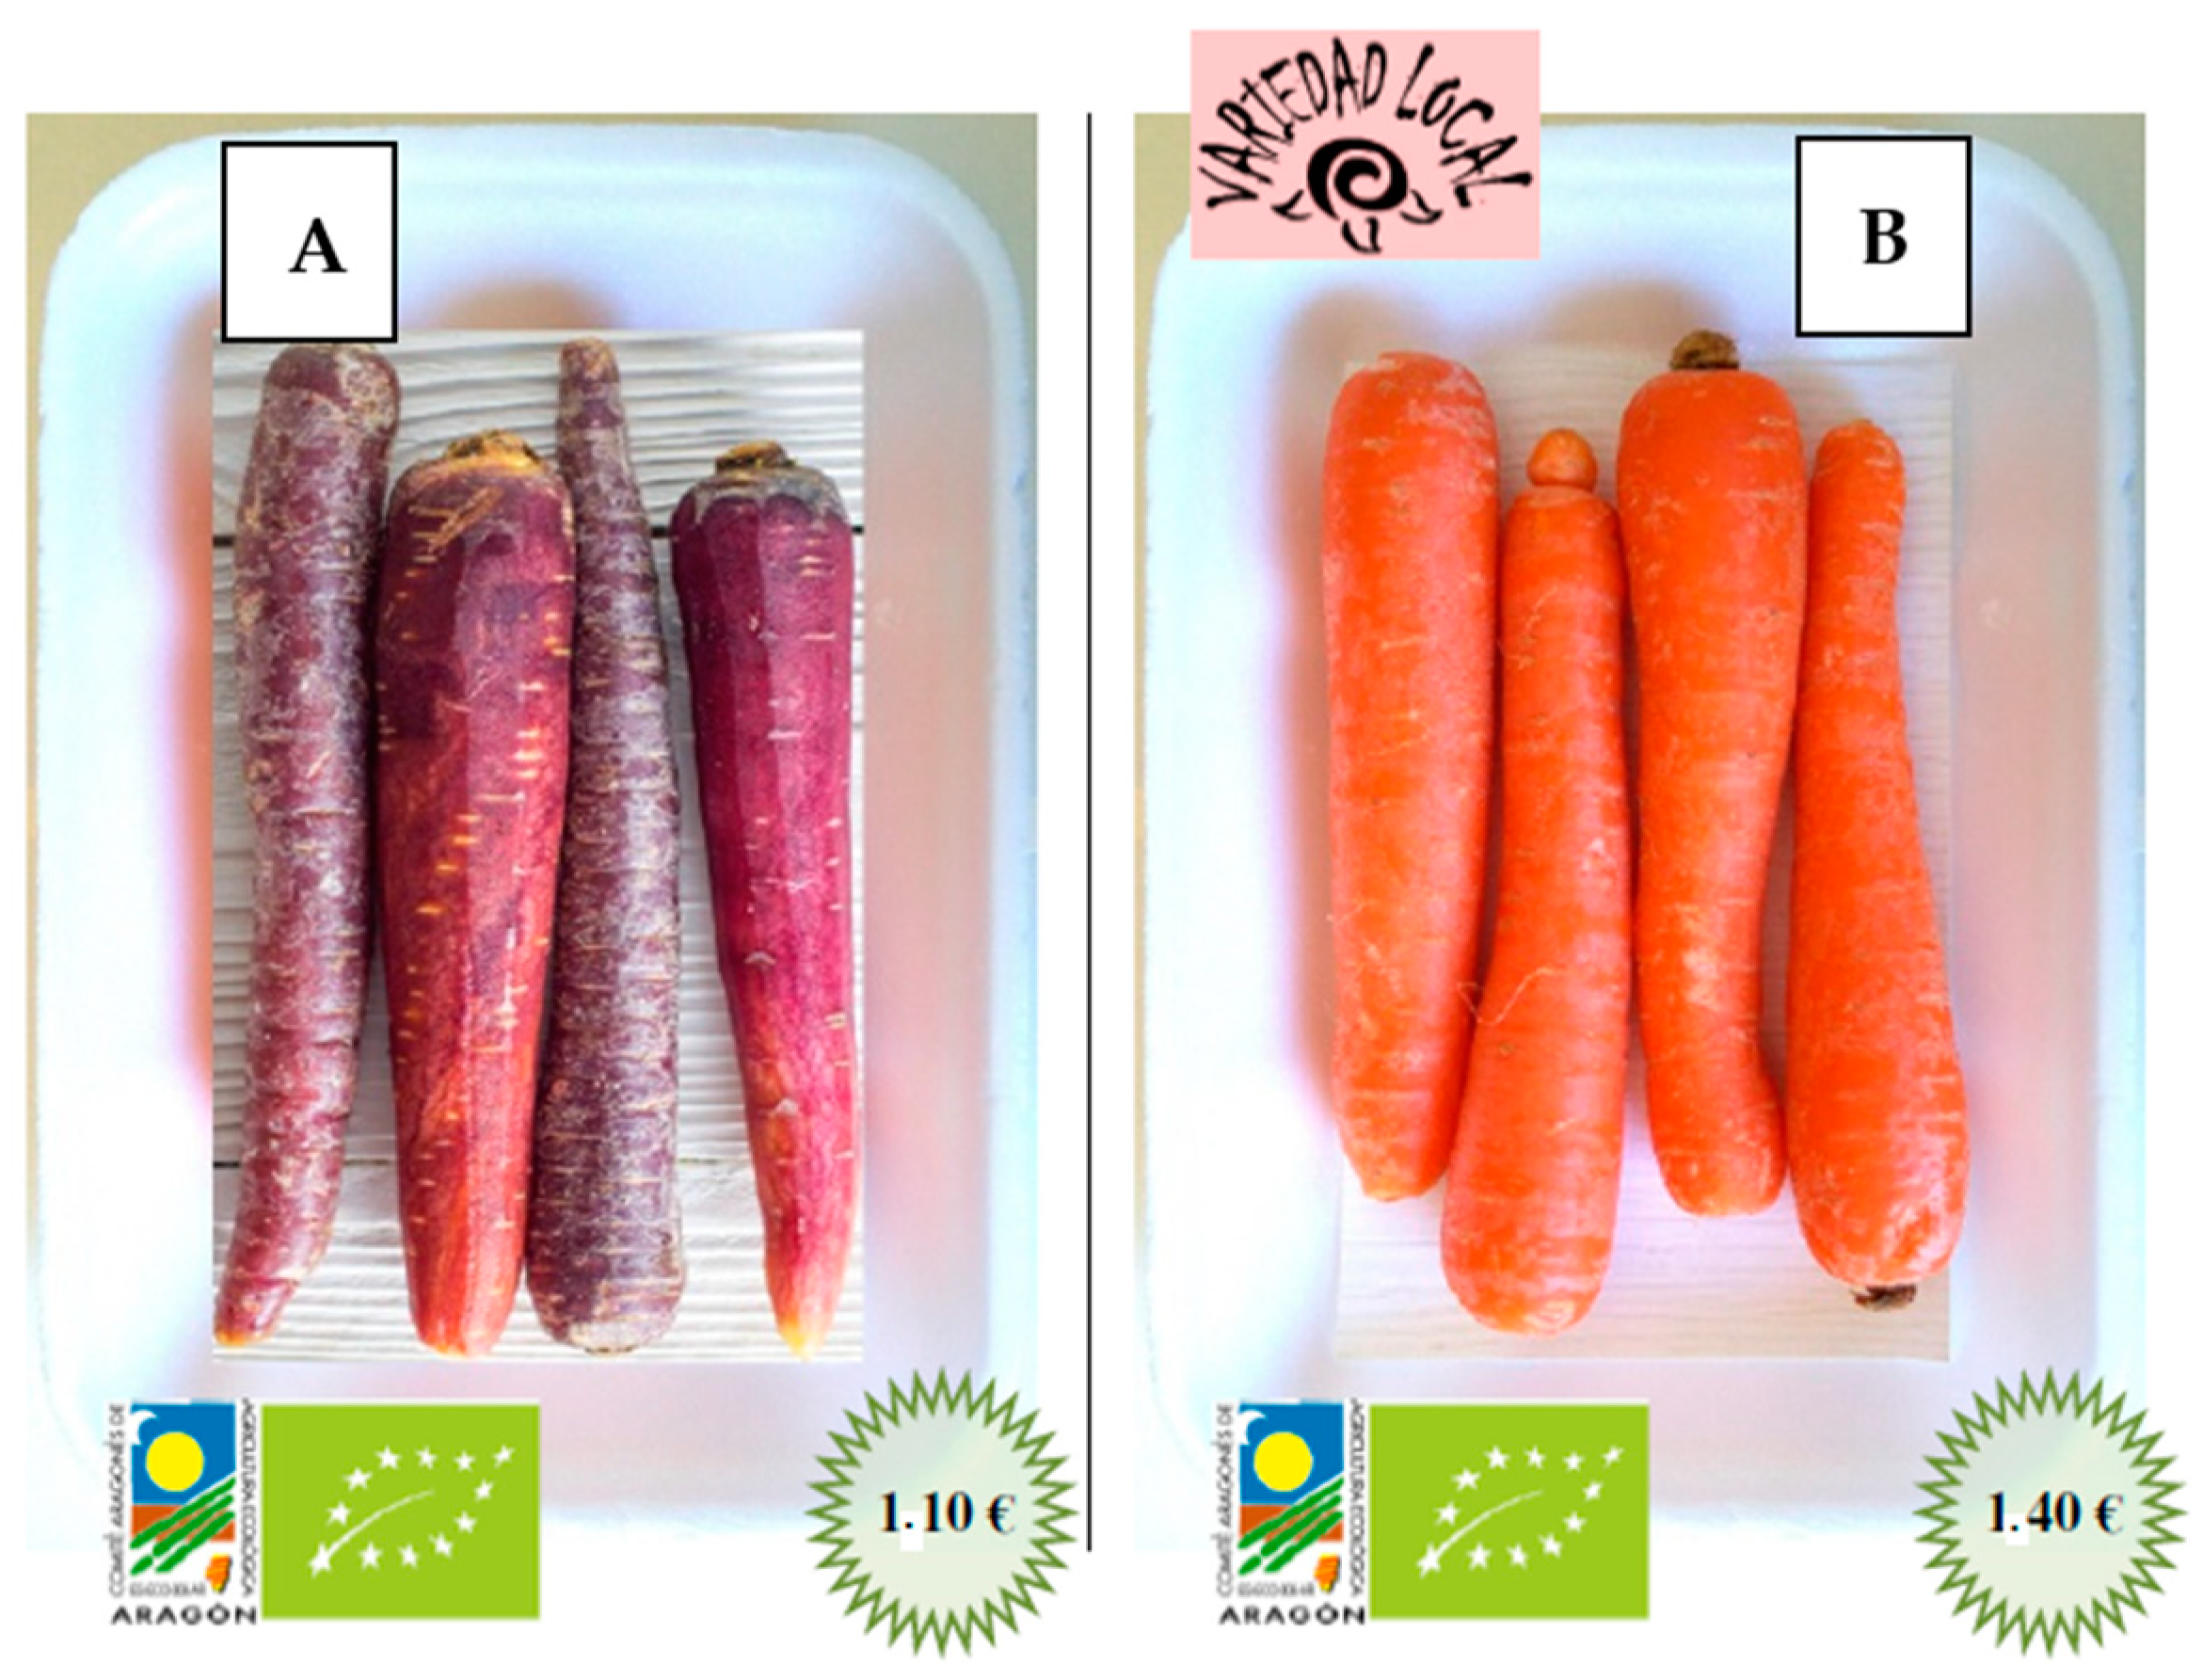
The Street and Burgess [33] approach was used to design the choice sets, which allows the estimation of the main and the two-way interaction effects between the color attribute and the other non-monetary attributes (variety and production method). With the 4 attributes with 4, 2, 2, and 2 levels, respectively, and 2 options, the design consisted of 24 combinations. To avoid having each participant respond to a high number of choice tasks, the total combinations were randomly split into six blocks. Thus, each respondent was asked to make four choices that included three alternatives: two designed alternatives consisting of different carrots (alternatives A and B) and a non-buy option. An example of a chosen card is shown in Figure 2.

3.3. Model Specification and Estimation

The random consumers’ utility defined by Lancaster [17] and McFadden [18] was specified following a latent class (LC) choice model and estimated using NLOGIT 5.0. This utility of individual n of the segment s choosing alternative j in the tth choice occasion for the LC model was:
U n j t | s = β s X n j t + ε n j t | s
where βs is the parameter vector of segment s associated with the explanatory variables Xnjt, and ε n j t | s are error terms that follow a Type I (or Gumbel) distribution. The choice probability that individual n, conditional to belonging to segment s (s = 1, …, S), chooses alternative i from a particular set J, comprised of j alternatives in a particular choice occasion t, was represented as:
P n i t | s = exp ( β s X n i t ) j = 1 J exp ( β s X n j t )
We assumed that the tth choice occasions were independent [34]; thus, for a given segment, the choice probability that individual n, conditional to belonging to segment s (s = 1, …, S), chooses alternative i from a particular set J, comprised of j alternatives, was represented as:
P n i | s = t = 1 T P n i t | s
In order to derive a model that simultaneously accounts for choice and segment allocation, the probability that a randomly chosen individual n chooses alternative i was given by:
P n i = s = 1 S P n s t = 1 T P n i t | s
where Pns is the probability of membership in segment s.
Equation (4) was used to estimate the segment-specific utility and segment probabilities using a maximum likelihood method.
To determine the best number of segments, we calculated the Akaike information criterion (AIC), the Bozdogan Akaike information criterion (AIC3), the Bayesian information criterion (BIC), and the Akaike likelihood ratio index ( ρ ¯ 2 ) for different segment specifications:
AIC = 2 ( L L p )
AIC 3 = 2 L L + 3 p
BIC = L L + ( p / 2 ) * ln N
ρ ¯ 2 = 1 AIC / 2 L L ( 0 )
where LL is the log-likelihood at convergence, p is the number of parameters, N is the number of observations (N = 1620), and LL(0) is the restricted log-likelihood. The preferred specification should be the one with the lowest AIC, AIC3, and BIC and the highest ρ ¯ 2 [35]. In addition, the optimal number of segments was selected by assessing whether additional segments provide any further information, with the overall aim of attaining segment parsimony, according to Swait [36]. We stopped looking for further segments when the model started to deteriorate, meaning when much larger standard errors appeared, as suggested by Louviere et al. [37].
In our empirical application and for the selected attributes and levels, the utility function (Equation (1)) was defined as follows:
Unjt|s = β0 + β1s PRICEnjt + β2s PURPLEnjt + β3s LOCALnjt + β4s ORGnjt + β5s LOCAL*PURPLEnjt + β6s ORG*PURPLEnjt + εnjt|s
where n is the number of respondents, j the alternatives (A, B, and the non-buying option), t the number of choice sets, and s the number of segments. The parameter β0 is the coefficient associated with the alternative-specific constant that considers the value 1 for the non-buying option and the value 0 otherwise (i.e., for alternatives A and B). The price variable (PRICE) was defined by the price levels in the design (Table 1). The attributes of color, variety, and production method were represented by dummy variables PURPLE, LOCAL, and ORG, where 1 indicated purple, local, or organic carrots, and 0 indicated orange, non-local, and conventional ones. Finally, interactions between the color and the other two non-monetary attributes were also calculated by multiplying the dummy variables (LOCAL*PURPLE, and ORG*PURPLE). These interactions are named, since now, as LOCAL*PURPLE, and ORG*PURPLE.
To test the overall statistical significance of the model, we calculated the likelihood ratio (LR) between the log-likelihood of the model at convergence and the restricted log-likelihood as:
LR = 2 ( L L ( 0 ) L L )
To measure the consumers’ importance ranking for the different attributes levels, importance scores (IS) for each attribute were calculated, according to Chang et al. [38], as follows:
I S k = | β k | ( Highest Lowest ) 1 6 | β k | ( Highest Lowest ) 100
where k ranges from 1 to 6 (coefficients in Equation (9)); (Highest-Lowest) is the difference between the highest and lowest value of each attribute level.
From the estimated parameters, the marginal WTP for PURPLE, LOCAL, ORG and for the interactions LOCAL*PURPLE and ORG*PURPLE was calculated as follows:
WT P m = β m β 1
where m ranges from 2 to 6.
The marginal WTP is the price change associated with a change in a given attribute, which represents the extra price consumers are willing to pay for each attribute. In addition, the total marginal WTP, accounting for both the main and interaction effects, was calculated, according to Merritt et al. [39], as follows:
WT P total L O C A L * P U R P L E = ( β 2 + β 3 + β 5 ) β 1
WT P total O R G * P U R P L E = ( β 2 + β 4 + β 6 ) β 1

3.4. Preference Heterogeneity

To explain the differences between consumers’ segments, we characterized them using the information regarding the socio-demographics of participants, their consumption and purchase habits for vegetables and carrots, the knowledge on carrots, their hedonic preferences, and intention to purchase purple carrots. First, we conducted a series of bivariate analyses between the segments and the participant characteristics to test for differences. In particular, a chi-square or analysis of variance test was used depending on the nature of the characterization variables. Second, we profiled the segments according to the characteristics found statistically different. Statistical analyses were done using STATA 16.0.

4. Results and Discussion

4.1. Sample Description

The socio-demographic characteristics of the population, the sample, and the segments found in Section 4.2 are shown in Table 2. This sample was representative of the population in terms of gender, age, and the province of residence. However, respondents with secondary education were under-represented, while participants with a higher level of education were over-represented, which is common in the majority of studies because they are more disposed to respond to questionnaires [40]. Half of the respondents were female (51%), with an average age of 48. Most respondents lived in the Zaragoza province. More than half of the households had a medium net income higher than 2500 €/month (55%).

4.2. Estimated Utility Parameters

The statistic results to select the optimal number of consumer segments are presented in Table 3.
The calculated information criteria decreased, while the Akaike likelihood ratio index increased, as the number of segments increased up to four segments with the highest variation observed from one to two segments. These decreases in information criteria were more than twice as much the decrements observed from two to three segments, and 9–11 times more than the decreases from three to four segments. The magnitude of the increment observed from one to two segments in the Akaike likelihood ratio index was nearly four and 11 times higher than the increment observed from two to three segments and from three to four segments, respectively. The following facts made us conclude that the optimal number of segments was two: (i) the lack of change in the increasing or decreasing trend of criteria parameters up to four segments, (ii) the improvement in the log-likelihood, information criteria, and Akaike likelihood ratio index was greater when comparing the models of one and two segments than the observed change from two to three segments or from three to four ones, and (iii) the value of the estimated parameters in the model for three segments started to deteriorate, giving much larger standard errors, and, furthermore, one of the segments included only 5% of respondents. Further information on the estimated parameters is available from the authors upon request. Then, results supported heterogeneous consumer preferences, and H1 was accepted.
Table 4 shows the results of the LC model for two segments as well as for non-segmented (homogeneous preferences) for comparison. The likelihood ratio (LR) accounted for 1072.96 with a p-value of (0.00), corroborating the overall statistical significance of the two-segment model. In this model, segment 1 was the major segment and accounted for 62% of respondents, while segment 2 accounted for the rest (38%). In segment 1, apart from the estimated coefficient β0, which is associated with the alternative of buying, the coefficient that had the highest absolute value was β1, and, therefore, the price variable (PRICE) showed the highest effect on consumers’ utility. The coefficient β1 was slightly higher in absolute value (approximately 1.2 times) than the coefficient of LOCAL*PURPLE (β5), more than twice as much the coefficient of ORG (β4), and nearly three times the coefficient of LOCAL (β3). The coefficients of PURPLE (β2) and ORG*PURPLE (β6) were not statistically different from zero. In segment 2, the absolute value of coefficient β1 was about 1.4 times higher than in segment 1, but, unlike in segment 1, the highest absolute value was found in the coefficient of PURPLE (β2), which was around 1.6 times the coefficient of PRICE (β1). The rest of the coefficients were not statistically different from zero in segment 2. Considering the non-segmented model (homogeneous consumer preferences), as in segment 1, without taking into consideration β0, the highest absolute value was found in the coefficient of PRICE (β1), which was more than twice the coefficients of PURPLE (β2) and LOCAL*PURPLE (β5) and nearly three times the coefficients of LOCAL (β3) and ORG (β4), for this model. In the majority of cases, the absolute value of coefficients was higher in the segmented model than in the non-segmented one, indicating that the two-segmented model provided higher effects of most of the studied attributes in the utility.
Looking at the sign of estimated parameters that were statistically significant, it was found that β0 and β1 were negative in all cases, which indicated that consumers attained a higher utility from choosing any alternative instead of the non-buy option and that increments in the price decreased consumers’ utility in accordance with economic theory, whether their preferences were considered heterogeneous or homogeneous. The estimated coefficient for the PURPLE variable (β2) was also negative in segment 2 and in the non-segmented model, meaning a lower utility for purple carrots than for orange ones. On the contrary, in segment 1, the estimated coefficients for the LOCAL and ORG variables, β3 and β4, respectively, and for the interaction LOCAL*PURPLE (β5) were positive. This result indicated that the utility for the carrots produced from the local landrace or organic production method was higher than the utility derived by the non-local landrace or conventional production system and that consumers’ utility for purple carrots produced from the local landrace was higher than the sum of the utilities derived by either the purple or the local landrace carrots. The same coefficients (β3, β4, and β5) resulted as positive in the non-segmented model. According to the results for the interaction LOCAL*PURPLE (β5) in segment 1, consumers’ valuation of the purple carrot variety was improved when adding information on the local variety. The positive effect of adding information on the local variety was also observed in the estimation of the non-segmented model. However, the interaction coefficient β6 for ORG*PURPLE was not statistically significant in any model, suggesting that these two attributes were independent. Therefore, the hypothesis H2 was accepted with respect to the local attribute, but not with respect to the production system.

4.3. Economic Results: Importance of Attributes and Willingness to Pay

Table 5 reports the ranking of carrot attribute levels by the degree of importance (IS) that consumers attach when purchasing and shows that the most important attribute levels varied between segments.
For segment 1, the price was the most important attribute with a negative impact on the utility (β1), followed by the combination of local origin and the purple color of the carrots, which positively influenced the consumers’ utility (β5). However, apart from the combination of organic and purple carrots, which was unimportant, the least important attribute was the purple color, which was not statistically affecting the utility (β2). By contrast, the most important attribute level for segment 2 was the color of the carrots, followed by the price. Both of them had a negative impact on consumers’ utility (β1 and β2). This last result regarding importance was in line with Frank et al. [43], who found that the color was the most important attribute for peppers. The rest of the attribute levels were not so important for segment 2, with importance scores less than 8%. For the non-segmented model, the most important attribute was the price with a negative impact on the utility, while the least important attribute was the interaction between organic and the color purple. The importance of the rest of the attributes was quite similar and lower than 18%. We can conclude that the price was one of the most important attributes for consumers, but the combination of local origin and the purple color was also very important for segment 1, and the color was the most important characteristic for segment 2.
The main and total marginal WTPs for each of the attributes and for their interactions from the two-segment and the non-segmented models are shown in Table 6. The results indicated that the highest marginal WTP estimates were observed when considering preference heterogeneity, except for the attribute LOCAL.
Consumers in segment 1 were willing to pay extra prices of 34% and 46% on the average market price of 1 €/half-kilo package for the local landrace and for the carrots organically produced, respectively. Previous studies have also found a positive WTP for organic [29,30] and locally-produce food [14,19,44]. Nganje et al. [14] found that consumers were willing to pay a premium of 12% for locally grown carrots and 8% for local spinach in relation to the non-local. In the same way, Brugarolas et al. [45] found that the WTPs for two local tomato varieties in Spain (Muchamiel and De la Pera) accounted for an extra price of around 79% and 68%, respectively, relative to the market prices for non-local tomato varieties. In our case, the price premium for the carrot local landrace was approximately three times the extra price for the local carrots reported by Nganje et al. [14], four times the extra price for local spinach reported by the same authors [14], and half of the extra price reported for local tomatoes by Brugarolas et al. [45]. Campbell et al. [46] also found higher WTP values for organic produce than for local produce for two of their three segments of consumers, and Gracia et al. [47] stated that the majority of consumers valued the local attribute more than the organic one for eggs, but a segment of consumers placed more value on the organic aspect than on the local origin. However, other studies have consistently found that consumers are more willing to pay for fresh local produce than for organic produce [20,21,22], although Yue and Tong [23] noted a similar WTP for both attributes.
The WTPs for the LOCAL*PURPLE interaction in segment 1 indicated a premium price of 80%, and the total marginal WTP accounting for the LOCAL*PURPLE interaction effect indicated a premium price of 133%. Even though there was not an ORG*PURPLE interaction effect, the total marginal WTP accounting for this interaction effect indicated a price premium of 64%.
Very different WTP results were observed for segment 2. The WTP for the purple carrots indicated that orange carrots were strongly preferred, and −1.61 €/package represented the discount for consumers to purchase a package of purple carrots (a discount of 161%). Total marginal WTPs accounting for the LOCAL*PURPLE and ORG*PURPLE interaction effects indicated discounts of 129% and 172%, respectively.
In summary, the most valued carrots for consumers in segment 1 were the purple carrots from the local landrace. On the contrary, consumers in segment 2 negatively valued the purple carrots, even when they were informed that these carrots were produced from a local landrace or organically produced.

4.4. Explaining Consumers’ Heterogeneity

Table 2, Table 7 and Table 8 provide the characterization of the two segments based on their statistically significant differences. Socio-demographic characteristics of segment 1 and segment 2 presented in Table 2 showed that segment 1 included more consumers living in the province of Zaragoza and less in the province of Huesca than segment 2. For the rest of the socio-demographic characteristics (Table 2), no statistically significant differences were found. Table 7 presents the food purchase and consumption habits of fruit and vegetables and the participants’ knowledge about carrots.
We observed that the importance that consumers attached to the forms of commercial presentation (bulk, packaged, canned, etc.), freshness, and being organic was statistically higher in segment 1 than in segment 2. The proportion of consumers who purchase in green grocery stores and who purchase carrots in bulk with and without tops and canned was also statistically higher in segment 1 than in segment 2. The proportion of consumers who had never eaten carrots in salads or used them to cook a dessert was lower in segment 1 than in segment 2. Consumers in segment 1 were more knowledgeable than those in segment 2.
Table 8 shows consumer preferences (hedonic scale) and the intention to purchase the purple carrots under different levels of information. First, results for the hedonic preferences for the purple carrots’ appeal showed that consumers, on average, neither liked nor disliked the purple carrots without information and presented hedonic scores around 5. This result was different from that previously reported by Szymczak et al. [13], who found that the hedonic score for the color (outer part) of the purple variety was slightly more than 8 in one scale from 0 to 10. Consumers’ hedonic preferences positively changed when they were informed first about the local origin and then about the health benefits, which are both sustainability-related aspects. The impact of the information about the local landrace on hedonic preferences was higher in segment 1 than in segment 2, with a relative increment in the average value of 23% and 13% in segment 1 and segment 2, respectively. However, the impact of the information concerning the health benefits on hedonic preferences was similar in both segments with relative increments of 7% and 8% for segment 1 and segment 2, respectively. In addition, consumers in segment 1 presented statistically higher hedonic scores than consumers in segment 2, respectively, under the three information scenarios.
The intention to purchase in the sample was placed between “do not know” and “likely” (39% and 31% of respondents, respectively), with an average value of around 3. This intention was higher than the one by Schifferstein et al. [16], who found an average intention to purchase for the purple carrots of 3 on one scale from 1 to 7 (very improbable to very probable). Like in hedonic preferences, the intention to purchase purple carrots increased as information about the local variety and the health benefits was given. This intention statistically differed between segments under the three information scenarios, with a higher proportion of consumers in segment 1 being likely or very likely to purchase the purple carrots. In particular, 51.8% of segment 1 said they were likely or very likely to purchase these carrots, and the percentage increased to 81.5% and 91.2% if they were informed about the carrots’ local origin and health benefits, respectively. The same growing effect was observed in segment 2, but the percentages were lower at 17.3%, 39.1%, and 46.8% for scenarios without information, with information on the carrots’ origin, and their health benefits, respectively.

5. Conclusions and Limitations

We evaluated consumer acceptance of purple and orange carrots considering extrinsic attributes, such as price, local variety, and organic production. From our findings, we concluded that a local purple carrot that is a Spanish landrace at risk of genetic erosion from a region seriously affected by depopulation and extreme weather conditions was positively valued by a group of consumers from this region, which could contribute to its sustainable recovery by buying it. The size of this group, accounting for 62% of consumers, was much higher than previous studies on consumers’ preferences for purple carrots would have suggested.
As in previous empirical evidence for fresh fruit and vegetables, our results with respect to the following carrot attributes: color, variety, and method of production, indicated that consumer preferences were heterogeneous. We extended this previous literature by explaining such heterogeneity according to consumers’ socio-demographics, their consumption and purchase habits for vegetables and carrots, knowledge about carrots, hedonic preferences, and intention to purchase purple carrots. Two segments of consumers were identified. Consumers included in the largest segment equally valued purple carrots and orange ones and showed improvements in the valuation of the purple carrots when adding information on the local landrace. Besides, consumers in this largest segment were less price-sensitive. It should be noted that this segment was more knowledgeable on carrots and presented higher hedonic preferences and intention to purchase purple carrots regardless of the level of information. By contrast, consumers in the smallest segment presented a strong preference for orange carrots over the purple carrots, which persisted even when they were informed about the production of the purple carrots from the local landrace or organically. These consumers valued neither the local variety nor the organic production certification.
In our study, the hedonic preferences for the appeal of purple carrots were lower than those reported in previous papers, and they increased when consumers received additional information, first, on the local origin of the purple landrace and, second, on the healthy components of these carrots. However, the intention to purchase in our study was higher than in previous research and also increased when the mentioned additional information was provided. Our findings supported previous evidence on the positive willingness to pay for local carrots in relation to non-local and indicated that the purple color and the local origin were complementary characteristics. Besides, our study provided new knowledge on the interaction between sensory and non-sensory attributes in the consumers’ valuation of carrots. Contrary to previous findings on fresh fruits and vegetables, our results indicated that organic carrots were more preferred over local ones by most of the consumers studied, while the valuation was the same and zero for the minority of them.
The outcomes of this research have several implications for the stakeholders in the purple local carrots chain interested in recovering, producing, and marketing in a sustainable way this local resource. Purple local carrots would be accepted by a segment of local consumers that would include most of them. If the information on their local origin is provided, consumers will be willing to pay a higher extra price for the product, and their hedonic preferences and intention to purchase will likely be higher. The same is foreseen if the information on the health benefits of the local purple carrot is provided. Therefore, to be successful in the recovery of this purple carrot, information about their local origin and possible health benefits due to components with known antioxidant properties is recommended. In addition, information about these carrots should first be targeted at the segment of consumers more willing to pay for and to accept the product recovered. We can advise stakeholders in the chain to sell this purple local carrot with an extra price up to 1.3 €/package of half a kilo (+133% the average market price) if they inform consumers that the purple carrots are locally produced from a traditional landrace. The cost of production of this landrace in the study area is not currently available.
Due to product specificity suggested when comparing our results with previous empirical evidence on consumers’ preferences, we can advise to stakeholders in other local fresh food products chains to undertake specific consumers’ studies before introducing the local product in a particular market. Although the cost of doing such studies could be high, it will be compensated by different economic, social, and environmental benefits if the new local food chain is sustainable. The society as a whole will also be an indirect beneficiary through the recovery of a local landrace and their implications for the diversity and the environment.
Our study possessed some limitations that should be taken into account. First, the limitation of product availability. We studied a local landrace that is no longer cultivated in the area and, consequently, is just preserved ex-situ in a germplasm bank. Additionally, the sample was based on consumers from the Spanish region of Aragón, and the results might, therefore, deviate in other countries or regions due to social and cultural aspects. Moreover, the online survey only showed the carrot in pictures and did not allow consumers to taste the product. Other studies have suggested that the valuation of new products using a choice experiment without tasting them differs in results from a choice experiment after tasting the product. Consequently, future research could be conducted to value local landraces using a choice experiment after tasting the new product.

Author Contributions

Conceptualization, A.G., A.M.S., C.M., and F.J.; Formal analysis, A.G., A.M.S., C.M., and F.J.; Investigation, A.G., A.M.S., C.M., and F.J.; Resources, A.G. and C.M.; Software, A.G.; Writing-original draft, A.G., A.M.S., and C.M. All authors have read and agree to the published version of the manuscript.

Funding

The authors acknowledge Gobierno de Aragón for the funding of the Research Group named ‘Economía Agroalimentaria y de los Recursos Naturales’, which has financed the gathering and analysis of the data. The National Institute for Agricultural and Food Research and Technology (INIA) has funded the permanent activities of the CITA vegetable genebank (BGHZ-CITA) responsible for the collection of the seeds and the associated knowledge, as well as the conservation of the purple local carrot used in this study, being the project currently in force RFP2015-00012.

Conflicts of Interest

The authors declare no conflict of interest.

References

  1. Food and Agriculture Organization of United Nations. The State of the World’s Plant Genetic Resources for Food and Agriculture. Food and Agriculture Organization of the United Nations: Rome, Italy, 1997; pp. 33–34. [Google Scholar]
  2. Ficiciyan, A.; Loos, J.; Sievers-Glotzbach, S.; Tscharntke, T. More than yield: Ecosystem services of traditional versus modern crop varieties revisited. Sustainability 2018, 10, 2834. [Google Scholar] [CrossRef] [Green Version]
  3. European Union (EU) Commission. Farm to Fork Strategy for a Fair, Healthy and Environmentally-Friendly Food System; European Commission: Brusels, Belgium, 2020; p. 9. Available online: https://eur-lex.europa.eu/legal-content/EN/TXT/?qid=1590404602495&uri=CELEX%3A52020DC0381 (accessed on 10 June 2020).
  4. Petropoulos, S.A.; Barros, L.; Ferreira, I.C.F.R. Editorial: Rediscovering Local Landraces: Shaping Horticulture for the Future. Front. Plant Sci. 2019, 10, 126. [Google Scholar] [CrossRef] [PubMed] [Green Version]
  5. Mallor, C.; Montaner, C.; Díaz, A.; Sánchez, A.M. La colección de zanahoria (Daucus carota) del Banco de Germoplasma Hortícola del CITA (BGHZ): Caracterización y selección de la zanahoria morada del Maestrazgo (Teruel). Actas Hortic. 2018, 80, 51–54. [Google Scholar]
  6. PDR. Spain—Rural Development Programme (Regional)—Aragon 2014–2020; The European Agricultural Fund for Rural Development, Europe investing in rural areas; Gobierno de Aragón, Departamento de Agricultura, Ganadería y Medio Ambiente: Aragon, Spain, 2016; p. 871. [Google Scholar]
  7. Pérez y Pérez, L.P.; Gracia, A.; Barreiro-Hurlé, J. Not Seeing the Forest for the Trees: The Impact of Multiple Labelling on Consumer Choices for Olive Oil. Foods 2020, 9, 186. [Google Scholar] [CrossRef] [Green Version]
  8. IAEST (Instituto Aragonés de Estadística). Estadística Local 2019. Gobierno de Aragón. 2019. Available online: http://www.aragon.es/iaest (accessed on 3 March 2020).
  9. Pearson, D.; Henryks, J.; Trott, A.; Jones, P.; Parker, G.; Dumaresq, D.; Dyball, R. Local food: Understanding consumer motivations in innovative retail formats. Brit. Food J. 2011, 113, 886–899. [Google Scholar] [CrossRef]
  10. Richards, T.J.; Hamilton, S.F.; Gomez, M.; Rabinovich, E. Retail intermediation and local foods. Am. J. Agric. Econ. 2017, 99, 637–659. [Google Scholar] [CrossRef]
  11. Feldmann, C.; Hamm, U. Consumers’ perceptions and preferences for local food: A review. Food Qual. Prefer. 2015, 40, 152–164. [Google Scholar] [CrossRef]
  12. Surles, R.L.; Weng, N.; Simon, P.W.; Tanumihardjo, S.A. Carotenoid profiles and consumer sensory evaluation of specialty carrots (Daucus carota, L.) of various colors. J. Agric. Food Chem. 2004, 52, 3417–3421. [Google Scholar] [CrossRef] [PubMed]
  13. Szymczak, P.; Gajewski, M.; Radzanowska, J.; Dąbrowska, A. Sensory quality and consumer liking of carrot cultivars of different genotype. Veg. Crop. Res. Bull. 2007, 67, 163–176. [Google Scholar] [CrossRef]
  14. Nganje, W.E.; Hughner, R.S.; Lee, N.E. State-branded programs and consumer preference for locally grown produce. Agric. Resour. Econ. Rev. 2011, 40, 20–32. [Google Scholar] [CrossRef]
  15. Di Muro, M.; Wongprawmas, R.; Canavari, M. Consumers’ preferences and willingness-to-pay for misfit vegetables. Econ. Agro-Aliment. 2016, 18, 133–154. [Google Scholar] [CrossRef]
  16. Schifferstein, H.N.; Wehrle, T.; Carbon, C.C. Consumer expectations for vegetables with typical and atypical colors: The case of carrots. Food Qual. Prefer. 2019, 72, 98–108. [Google Scholar] [CrossRef]
  17. Lancaster, K. A new approach to consumer theory. J. Polit. Econ. 1966, 74, 132–157. [Google Scholar] [CrossRef]
  18. McFadden, D. Conditional Logit Analysis of Qualitative Choice Behavior. In Frontiers in Econometrics; Zarembka, P., Ed.; Academic Press: New York, NY, USA, 1974; pp. 105–142. [Google Scholar]
  19. Carroll, K.A.; Bernard, J.C.; Pesek, J.D., Jr. Consumer preferences for tomatoes: The influence of local, organic, and state program promotions by purchasing venue. J. Agric. Resour. Econ. 2013, 38, 379–396. [Google Scholar]
  20. Hempel, C.; Hamm, U. Local and/or organic: A study on consumer preferences for organic food and food from different origins. Int. J. Consum. Stud. 2016, 40, 732–741. [Google Scholar] [CrossRef]
  21. Hempel, C.; Hamm, U. How important is local food to organic-minded consumers? Appetite 2016, 96, 309–318. [Google Scholar] [CrossRef]
  22. Onozaka, Y.; McFadden, D.T. Does local labeling complement or compete with other sustainable labels? A conjoint analysis of direct and joint values for fresh produce claim. Am. J. Agric. Econ. 2011, 93, 693–706. [Google Scholar] [CrossRef]
  23. Yue, C.; Tong, C. Organic or local? Investigating consumer preference for fresh produce using a choice experiment with real economic incentives. HortScience 2009, 44, 366–371. [Google Scholar] [CrossRef] [Green Version]
  24. Boncinelli, F.; Contini, C.; Romano, C.; Scozzafava, G.; Casini, L. Territory, environment, and healthiness in traditional food choices: Insights into consumer heterogeneity. Int. Food Agribus. Man. 2017, 20, 143–157. [Google Scholar] [CrossRef]
  25. Peschel, A.O.; Grebitus, C.; Steiner, B.; Veeman, M. How does consumer knowledge affect environmentally sustainable choices? Evidence from a cross-country latent class analysis of food labels. Appetite 2016, 106, 78–91. [Google Scholar] [CrossRef] [Green Version]
  26. Peschel, A.O.; Grebitus, C.; Alemu, M.H.; Hughner, R.S. Personality traits and preferences for production method labeling-A latent class approach. Food Qual. Prefer. 2019, 74, 163–171. [Google Scholar] [CrossRef]
  27. Steiner, B.E.; Peschel, A.O.; Grebitus, C. Multi-Product Category Choices Labeled for Ecological Footprints: Exploring Psychographics and Evolved Psychological Biases for Characterizing Latent Consumer Classes. Ecol. Econ. 2017, 140, 251–264. [Google Scholar] [CrossRef] [Green Version]
  28. Wu, X.; Hu, B.; Xiong, J. Understanding Heterogeneous Consumer Preferences in Chinese Milk Markets: A Latent Class Approach. J. Agric. Econ. 2020, 71, 184–198. [Google Scholar] [CrossRef] [Green Version]
  29. Skreli, E.; Imami, D.; Chan, C.; Canavari, M.; Zhllima, E.; Pire, E. Assessing consumer preferences and willingness to pay for organic tomatoes in Albania: A conjoint choice experiment study. Span. J. Agric. Res. 2017, 15, 2. [Google Scholar] [CrossRef]
  30. Yue, C.; Campbell, B.; Hall, C.; Behe, B.; Dennis, J.; Khachatryan, H. Consumer preference for sustainable attributes in plants: Evidence from experimental auctions. Agribusiness 2016, 32, 222–235. [Google Scholar] [CrossRef]
  31. Martínez-Carrasco, L.; Brugarolas-Mollá, M.; Martínez-Poveda, A.; Ruiz-Martínez, J.J.; García-Martínez, S. Aceptación de variedades tradicionales de tomate en mercados locales. Un estudio de valoración contingente. ITEA 2015, 111, 56–72. [Google Scholar]
  32. Cummings, R.G.; Taylor, L.O. Unbiased value estimates for environmental goods: A cheap talk design for the contingent valuation method. Am. Econ. Rev. 1999, 89, 649–665. [Google Scholar] [CrossRef]
  33. Street, D.; Burgess, L. The Construction of Optimal Stated Choice Experiments; John Wiley & Sons Inc.: Hoboken, NJ, USA, 2007. [Google Scholar]
  34. Greene, W.; Hensher, D. A latent class model for discrete choice analysis: Contrasts with mixed logit. Transp. Res. B-Meth. 2003, 37, 681–698. [Google Scholar] [CrossRef]
  35. Hu, W.; Hunnemeyer, A.; Veeman, M.; Adamowicz, W.; Srivastava, L. Trading off health, environmental and genetic modification attributes in food. Eur. Rev. Agric. Econ. 2004, 31, 389–408. [Google Scholar] [CrossRef]
  36. Swait, J. A structural equation model of latent segmentation and product choice for cross-sectional revealed preference choice data. J. Retail. Consum. Serv. 1994, 1, 77–89. [Google Scholar] [CrossRef]
  37. Louviere, J.J.; Hensher, D.A.; Swait, J.D. Stated Choice Methods: Analysis and Applications; Cambridge University Press: Cambridge, UK, 2000. [Google Scholar]
  38. Chang, J.B.; Moon, W.; Balasubramanian, A.K. Consumer valuation of health attributes for soy-based food: A choice modeling approach. Food Policy 2012, 37, 335–342. [Google Scholar] [CrossRef]
  39. Merritt, M.G.; Delong, K.L.; Griffith, A.P.; Jensen, K.L. Consumer willingness to pay for Tennessee certified beef. J. Agric. Appl. Econ. 2018, 50, 233–254. [Google Scholar] [CrossRef] [Green Version]
  40. Verhoef, P.C. Explaining Purchases of Organic Meat by Dutch Consumers. Eur. Rev. Agric. Econ. 2005, 32, 245–267. [Google Scholar] [CrossRef]
  41. INE (Instituto Nacional de Estadística). INEbase/Demografia y Poblacion/Cifras de Poblacion y Censos Demograficos/Cifras de Población. 2016. Available online: https://www.ine.es/dynt3/inebase/es/index.htm?padre=1894&capsel=1900 (accessed on 6 July 2016).
  42. OECE (Organisation for Economic Co-Operation and Development). Compare Your Country—Education at a Glance. 2014. Available online: http://www.oecd.org/education/Education-at-a-Glance-2014.pdf (accessed on 6 July 2016).
  43. Frank, C.A.; Nelson, R.G.; Simonne, E.H.; Behe, B.K.; Simonne, A.H. Consumer preferences for color, price, and vitamin C content of bell peppers. HortScience 2001, 36, 795–800. [Google Scholar] [CrossRef] [Green Version]
  44. Meas, T.; Hu, W.; Batte, M.T.; Woods, T.A.; Ernst, S. Substitutes or complements? Consumer preference for local and organic food attributes. Am. J. Agric. Econ. 2015, 97, 1044–1071. [Google Scholar] [CrossRef]
  45. Brugarolas, M.; Martínez-Carrasco, L.; Martínez-Poveda, A.; Ruiz-Martínez, J.J. A competitive strategy for vegetable products: Traditional varieties of tomato in the local market. Span. J. Agric. Res. 2009, 7, 294–304. [Google Scholar] [CrossRef] [Green Version]
  46. Campbell, B.L.; Lesschaeve, I.; Bowen, A.J.; Onufrey, S.R.; Moskowitz, H. Purchase drivers of Canadian consumers of local and organic produce. HortScience 2010, 45, 1480–1488. [Google Scholar] [CrossRef] [Green Version]
  47. Gracia, A.; Barreiro-Hurlé, J.; López-Galán, B. Are local and organic claims complements or substitutes? A consumer preferences study for eggs. J. Agric. Econ. 2013, 65, 49–67. [Google Scholar] [CrossRef]
Figure 1. Picture of local purple carrots from the Maestrazgo presented to consumers.
Sustainability 12 06549 g001
Figure 2. Example of a carrot choice set.
Sustainability 12 06549 g002
Table 1. Attributes and levels used in the carrot’s choice design.
AttributesLevels
Price (€/package)0.5
0.8
1.1
1.4
ColorOrange
Purple
VarietyLocal landrace
Non-local landrace
Method of productionOrganic
Conventional
Note: Levels in bold are reference levels in the model estimation.
Table 2. Socio-demographic characteristics of the population, sample, and of the segments. Data expressed in % unless stated. Details on the segments are found in Section 4.2 and Section 4.3.
CharacteristicsPopulationSample
(n = 405)
Segment 1Segment 2
Gender: Female50.93 151.3654.2246.79
Age (average) 42.68 147.7247.6947.78
18–34 years21.63 121.2320.8821.79
35–44 years20.94 121.9821.2923.08
45–54 years19.20 119.2620.0817.95
≥55 years38.22 137.5337.7537.18
Education attained
Primary17.00 223.2122.0925.00
Secondary50.00 229.6329.3230.13
Higher33.00 247.1648.5944.87
Net household income 3
≤1500 €/monthN/A 421.1619.6723.53
1501–2500 €/monthN/A 424.1822.1327.45
>2500 €/monthN/A 454.6658.2049.02
Household size (average)N/A2.872.852.91
Province of residence 5
Huesca17.00 114.4610.2021.15
Teruel11.00 14.494.095.13
Zaragoza72.00 181.0585.7173.72
Notes: 1 INE-Census [41]; 2 OECD indicators [42]; 3 1.98% of the participants did not know or preferred not to say; 4 N/A means not available. 5 The distribution of the sample in the three provinces was different between segments using the χ2-square test (12.39, p-value = 0.006).
Table 3. Statistics to determine the optimal number of consumer segments.
Number of SegmentsNumber of Parameters1 Log Likelihood at Convergence (LL) 2 AIC3 AIC34 BIC5 ρ ¯ 2
17−1422.442858.772865.881432.600.19
214−1243.272514.542528.541263.600.30
321−1162.512367.022388.021193.000.33
428−1136.792329.582357.581177.440.34
Notes: 1 Restricted log-likelihood evaluated at zero: LL (0) = −1779.75; 2 AIC: Akaike information criterion; 3 AIC3: Bozdogan Akaike information criterion; 4 BIC: Bayesian information criterion; 5 ρ ¯ 2 : Akaike likelihood ratio index.
Table 4. Estimated parameters: Latent class choice model with two segments in comparison with the non-segmented model.
Parameters in Utility Function and Segment ProbabilityTwo-Segment ModelNon-Segmented Model
Segment 1Segment 2
Coefficientt-RatioCoefficientt-RatioCoefficientt-Ratio
β0−2.97 ***−11.69−2.85 ***−7.79−2.17 ***−15.44
β1: PRICE−1.37 ***−7.29−1.95 ***−4.82−1.04 ***−7.81
β2: PURPLE0.251.19−3.14 ***−5.12−0.42 ***−2.89
β3: LOCAL0.47 **2.170.351.280.37 ***2.69
β4: ORG0.63 ***3.590.251.220.36 ***3.23
β5: LOCAL*PURPLE1.10 ***3.050.280.400.46 **2.03
β6: ORG*PURPLE0.000.01−0.47−0.85−0.12−0.88
Segment probability0.62 ***20.340.38 ***12.26
Notes: Number of observations: 1620; Number of participants: 405. Log-likelihood at convergence: −1243.3; Likelihood ratio (LR) = 1072.96 (0.00). Pseudo R-square: 0.30. *** and ** denote statistical significance at 1% and 5% significance levels, respectively. Segment probability multiplied by 100 indicates the percentage of participants in each segment; thus, segment one consisted of 62% of respondents, and segment 2 of 38%.
Table 5. Importance scores, IS, of the carrots’ attribute levels (%) and place in the ranking of importance.
Variable or InteractionTwo-Segment Model IS (%) and Ranking PlaceNon-Segmented Model IS (%) and Ranking Place
Segment 1Segment 2
PRICE33.4 (1st)28.1 (2nd)35.2 (1st)
PURPLE6.9 (5th)50.2 (1st)15.7 (3rd)
LOCAL12.7 (4th)5.6 (4th)13.9 (4th)
ORG17.1 (3rd)4.1 (6th)13.4 (5th)
LOCAL*PURPLE29.9 (2nd)4.4 (5th)17.4 (2nd)
ORG*PURPLE0.0 (6th)7.6 (3rd)4.4 (6th)
Table 6. Marginal willingness to pay, WTP, for attributes PURPLE, LOCAL, ORG and interactions LOCAL*PURPLE and ORG*PURPLE; and total WTP with interactions (€/half-kilo package).
Variable or InteractionWTP (€/half-kilo Package)
Segment 1Segment 2Non-Segmented Model
Estimatest-RatioEstimatest-RatioEstimatest-Ratio
PURPLE0.181.28−1.61 ***−3.56−0.40 ***−2.38
LOCAL0.34 **2.480.181.510.36 ***3.20
ORG0.46 ***3.260.131.180.34 **3.00
LOCAL*PURPLE0.80 **2.370.140.390.45 *1.72
ORG*PURPLE0.000.00−0.24−0.83−0.11−0.87
Total LOCAL*PURPLE1.33 ***6.18−1.29 ***−3.740.40 ***3.64
Total ORG*PURPLE0.64 ***4.09−1.72 ***−3.39−0.17−1.08
Note: ***, **, and * denote statistical significance at 1%, 5%, and 10% significance levels, respectively.
Table 7. Food purchase and consumption habits and knowledge on carrots (%, unless stated).
Characteristics of Food Purchase, Consumption Habits, and Knowledge of Carrots EvaluatedSampleSegment 1Segment 2
Consumption frequency (once a day or more)
Fruits55.0655.8053.80
Vegetables23.2125.3019.87
Carrots2.963.212.56
The importance attached to these attributes when buying carrots (measured in a 5-point increasing scale, average) 1
Commercial presentation **3.443.513.33
Freshness ***4.234.344.06
Organic *2.592.672.47
Place of purchase Green grocery store ***54.0759.4445.51
Sales packaged format of the carrots
Bulk **46.1750.2039.74
Bulk with tops ***15.8020.098.97
Canned ***12.5916.057.05
How the carrots are consumed at home 1
Raw in salads **
Always18.2718.4817.95
Often24.2026.5120.51
Sometimes27.1628.1125.64
Hardy ever14.0715.6611.54
Never16.3011.2424.36
In a dessert **
Always0.981.610.00
Often2.722.812.56
Sometimes8.158.847.05
Hardy ever29.8835.7420.52
Never58.2751.0069.87
Knowledge on carrots ** (index average)2.802.892.67
Notes: ***, **, and * denote statistical significance between segments at 1%, 5%, and 10% significance levels, respectively. 1 Consumers were also asked about other attributes (size, price, color, package size, and place of production) with respect to their importance when buying carrots or specific uses and ways of consumption (an ingredient in a dish, pickled, ham, juice), but no statistical differences between segments were found regarding these attributes.
Table 8. Hedonic preferences and intention to purchase purple carrots (%, unless stated).
SampleSegment 1Segment 2
Hedonic preferences 1 (appeal, average)
Purple carrots without information ***5.395.644.97
Purple carrots with information on the local landrace ***,26.436.965.60
Purple carrots with information on the local landrace and health benefits ***,36.927.456.07
Intention to purchase
Purple carrots without information ***3.17 ± 1.003.44 ± 0.952.73 ± 0.92
Very unlikely6.172.8111.54
Unlikely16.7912.8623.08
I do not know38.5332.5348.08
Likely30.8640.5615.38
Very likely7.6511.241.92
Purple carrots with information on the local landrace ***,23.75 ± 0.944.06 ± 0.793.23 ± 0.93
Very unlikely1.980.803.85
Unlikely7.652.8115.38
I do not know25.1914.8641.67
Likely43.9551.8131.41
Very likely21.2329.727.69
Purple carrots with information on the local landrace and health benefits ***,33.95 ± 0.864.29 ± 0.643.41 ± 0.90
Very unlikely0.990.002.56
Unlikely4.450.8010.26
I do not know20.498.0340.38
Likely46.1752.2136.54
Very likely27.938.9610.26
Notes: *** denotes statistical significance between segments at 1% significance level. 1 Nine-point hedonic scale from 1 (extremely dislike) to 9 (extremely like). 2 Before responding to the hedonic question, consumers were asked to read the following paragraph: “These purple carrots are from a local landrace from Aragón, in particular, from Maestrazgo County (Teruel). These carrots are purple because they have different natural pigments”. 3 Before responding to the hedonic question, consumers were asked to read the following paragraph: “These purple carrots have a high antioxidant content; thus, their consumption has health benefits for preventing cardiovascular and metabolic diseases”.

