Article

Home-Delivery-Oriented Agri-Food Supply Chain Alliance: Framework, Management Strategies, and Cooperation Stability Control

1
School of Traffic and Transportation Engineering, Central South University, Changsha 410075, China
2
Faculty of Transportation Engineering, Kunming University of Science and Technology, Kunming 650500, China
3
School of Logistics Management and Engineering, Nanning Normal University, Nanning 530001, China
*
Author to whom correspondence should be addressed.
Sustainability 2020, 12(16), 6547; https://doi.org/10.3390/su12166547
Submission received: 17 July 2020 / Revised: 7 August 2020 / Accepted: 10 August 2020 / Published: 13 August 2020

Abstract

:
The high cost of operation and severe competition in the agri-food e-commerce market make it hard for the small and medium agri-food enterprises (A-SMEs) to operate cost-efficiently and in a sustainable manner. This paper seeks to organize A-SMEs to develop a cooperative organization via collaborative strategies and alliance structures, named as the home-delivery-oriented agri-food supply chain (HASC) alliance, to form a substantive relationship to gain a stable foothold in the emerging e-commerce market. A theoretical framework of the HASC alliance is built with its organizational structure and schematics of the process of implementation strategies that cover the aspects of last-mile chain extension, food transportation, and production/distribution control. Furthermore, a three-step analytical method is proposed to analyze the performance of the alliance with the aim to provide appropriate strategies to hedge against the potential risks of cooperation instability. A hypothetical case is conducted, and the results show that: (1) the performance of the hypothetical HASC alliance with time shows significant variation in the beginning, but it gains stability with the application of stability control strategies; (2) the cooperation stability of HASC alliance is very sensitive to the performance of the strategies that control the customer and environment variations; (3) the factors of trust and market fluctuation have higher effects on membership and environmental stability, respectively; (4) the minimum and maximum cost ranges of control strategies at which the alliance can maintain its stability and performance are 5% and 29%, respectively, of the total operation cost.

1. Introduction

In recent years, consumers have increasingly demanded high-quality, healthy/green, readily available, and widely varied agri-food products, resulting in the rapid growth of the agri-food e-commerce (AE) market. Consequently, small and medium agri-food enterprises (A-SMEs) have begun to promote their agri-food products through online shops. However, the high cost of operation and severe competition in the AE market make it hard for A-SMEs to operate cost-efficiently and in a sustainable manner [1,2,3]. To avoid severe losses, many A-SMEs have resorted to outsource their AE business partly or entirely [4,5,6]. However, by transferring the vital functions to a third party, the companies can suffer high uncertainty and instability, since the partners unilaterally focus on their own benefits [6,7,8,9,10]. At the same time, a small number of firms with strong financial strength have chosen to perform an in-house agri-food home delivery service to achieve high autonomy. Such a positive but inefficient strategy is unsuitable for A-SMEs, especially for those that are facing a severe financial burden. The unsuitability of these two business modes for A-SMEs will be illustrated with a series of empirical studies in the next section.
Over the decades, a type of inter-organizational cooperative arrangement via collaborative strategies and alliance structures among firms—known as a “strategic alliance”—has become an increasingly attractive means of improving competitiveness. A strategic alliance is a purposive, substantive, and sustainable relationship between independent organizations [11,12,13,14,15]. The partners are involved in the exchange, sharing, and co-development of resources and capabilities (e.g., technical, financial, and strategic advantages) to achieve mutually relevant benefits [15,16,17]. The strategic alliance has gradually become a significant component of supply chain management [18,19,20]. As an emerging market, AE is undergoing a period of uncertainty, instability, and high competition. The A-SMEs that set foot in the AE market face various challenges to their survival. In this context, the A-SMEs should engage in a deep and sustainable partnership type of supply chain relationships to form a “community of shared interests” for generating collaborative advantages. Organizing the relevant entities (A-SMEs) to form an alliance with a strategic perspective could be one of the best options. In this manner, partners (e.g., suppliers, manufacturers, logistic companies, and e-commerce companies) with different competencies in the supply chain are allowed to focus on their core activities, such as providing quality products and services [20,21,22]. This will help the A-SMEs to enter such new business quickly and further steadily expand market share.
Numerous supply chain alliances have been established in the retail and service industries [23,24], such as the co-branded shopping alliance, built by Walt Disney and eBay in 2000, and the consumer service alliance comprising Amazon, Borders Group, Toys ’R’ and Target. However, there is no fully-fledged supply chain alliance that can be taken as a successful example in the current AE market. Theoretically, most existing studies set their sights on investigating the supply chain alliance under the traditional buyer-supplier relationships rather than the multi-dimensional relationships that arise and become increasingly prevalent in the current AE market, such as the buyer-servicer-supplier relationship. In addition, to the best of our knowledge, there are limited studies that have attempted to explore how the A-SMEs can gain advantages through a collaborative relationship in the emerging AE market. To fill this research gap and give insight into practice, this study seeks to develop an agri-food supply chain based on the alliance structure and collaborative strategies, which organizes the A-SMEs with various competencies in the AE market (such as production, transportation, processing, delivery, service, and recycling) together and strives to deliver better service to satisfy customers’ daily demands for agri-food in the last mile (home delivery) in the AE environment, named as “home-delivery-oriented agri-food supply chain (HASC) alliance”. In particular, with the aim of showing at the macro-level how the HASC alliance can be established between A-SMEs and how each strategy works, i.e., a theoretical framework of the HASC alliance is built with its organizational structure and a schematic of the process of each implementation strategy. In addition, this study proposes a three-step method based on the systems thinking theory to analyze the performance of alliances and provide appropriate strategies to hedge against the potential risks faced by most of the alliances—cooperation instability. A case study for which the data are collected from 36 agri-food supply chain-related firms from the largest agricultural city in China—Kunming—is conducted to illustrate the proposed method. Moreover, the study also provides both theoretical and practical implications for the A-SMEs.
The rest of the paper is structured as follows. In the next section, the literature related to the key topics of this study is briefly reviewed, and the research gap is specifically identified. Then, the conceptual framework of the agri-food supply chain alliance is built. This section is followed by the development of the system dynamics model, aiming to investigate the cooperation stability of the HASC alliance with a case study where a hypothetical alliance is built by agri-food-related enterprises in Kunming. Furthermore, the implications of the findings of this study are illustrated with a hypothetical example. Finally, conclusions are drawn, and further research suggestions are discussed.

2. Literature Review

2.1. AE Market: Opportunities and Challenges

In the past decade, e-commerce has found how to blend in with the agricultural market. In China, the magnitude of the AE market has grown from USD 1.9 billion to USD 21.3 billion between 2013 and 2017 (increased 1025%), accounting for 7.9% of the total trade volume of the whole agricultural market (284.1 billion dollars) in 2017 [25]. The penetration rate is expected to reach 21.7% in 2020. The AE market offers an important opportunity to A-SMEs for business expansion, cost reduction, and demand enhancement [26,27,28,29].
However, although e-business results in many boons for the agri-market, A-SMEs face a few serious problems regarding efficient strategies and reliable standards when entering the AE market. The first problem relates to the selection of suitable models or tactics for operating an AE business. Outsourcing the business to a third party is how A-SMEs commonly adapt to access the AE market. Cost reduction is the most distinct advantage of an outsourcing strategy over a traditional self-managed operation [4,5,6,30]. Moreover, the enterprises can improve the quality of service by relying on third-party technologies and tightening their focus on core competencies [31]. However, Dean et al. [7] investigated 620 organizations and found that management of an outsourced business results in critical issues, such as quality control and chain coordination. They also found that more than one-half of these companies underestimated the cost of managing the outsourced business. Moreover, outsourcing usually reduces a company’s control over how certain services are delivered [8,9]. Therefore, outsourcing arrangements seem unable to sustain an organized cultivation of value and thus are not recommended as a long-term strategy for surviving in the AE market [6,10].
At the same time, a small number of firms with strong financial strength choose to perform an in-house agri-food home delivery service. They develop their own distribution structure based on an expansion of the existing supply chain, aiming to build and maintain competitive advantages. For example, as one of the most successful companies in China’s AE market, Jindong (JD) builds its own cold-chain system, including storage, transportation, and distribution. As of May 2017, JD had already established 11 self-support cold hubs covering more than 100 residential districts in China. However, the cost of delivery is nearly CNY 35 (USD 5.21) per order, excluding essential construction costs such as warehouses [32]. Thus, self-managing is unsuitable for A-SMEs, especially for those that are facing serious financial problems. It would be more burdensome for them to compete as autonomous entities.
The second problem is the concern of cold supply chain management. Developing the AE business is primarily aimed at providing quick, direct, and quality service to the end customer (termed home delivery or “last-mile” delivery service) [33,34,35]. Firms must, therefore, extend their supply chains directly to the end customer. Moreover, due to the perishable nature of agri-foods, the entire supply chain faces unique challenges, such as food safety, food quality, and environmental issues [36,37,38]. Van and Vorst [39] suggested in their earlier study that a reliable system with the ability to track products and with quality certification is essential for A-SMEs to sustain in the AE business. Many current studies [40,41,42] also emphasize that the physical operations involved in any delivering or transporting activity need an acceptable standard with high regulation and a traceable physical (container) system that is capable of maintaining an optimum temperature.
However, a review of the whole current AE market offers a depressing picture. For example, China’s cold storage capacity reached a total of 107 million cubic meters at the end of 2016, while the per capita cold storage share was only 0.143 cubic meters, which fails to meet the increasing daily demand of agri-food. Consequently, on average, 10% of the fresh agri-food was damaged in transportation, and 30% of that damage happened in the last-mile portion [43]. Managing this part of the supply chain has been an important challenge for supply chain managers. Lim et al. [29] examined the research on the last-mile logistics problem and concluded that managers face two critical problems: (1) what strategy should be applied to provide cost-efficient order fulfillment while satisfying the consumers, and (2) efficiently linking the last mile with an existing supply chain, especially from a logistics infrastructure standpoint.
The aforementioned two concerns lead to the tough task of cost control. Because of the establishment of an extended supply chain (with a reliable physical delivery system) plus many complexities present in the delivery process (e.g., traffic control, customer diversity, reverse logistics, and political uncertainty), the last-mile is regarded as the most expensive section of distribution [1,2,3,44]. The data show that last-mile delivery accounts for 13% to 75% of the total cold supply chain costs, and only 1% of more than four thousand AE enterprises in China are profitable, while 88% are suffering from different extents of loss [43]. Cost efficiency—how to effectively balance the cost and the performance of the cold supply chain—is a significant challenge for the managers.

2.2. Strategic Supply Chain Alliance and Cooperation Instability

In a connected and globalized economy, it is increasingly important to have the ability to engage in collaborative value undertakings. The strategic alliance provides a chance for companies, especially A-SMEs, to engage in an effective collaboration to pursue joint innovation, a competitive edge, quality services, and a supply/value chain [45,46]. Researchers have explored a wide range of strategic alliance themes from diverse theoretical and methodological backgrounds. Many studies have focused on the pre-agreement phase, in which activities are crucial for alliance shaping and strategy designing. A range of conceptual definitions and frameworks of a strategic alliance has been theoretically recognized from different perspectives, such as total quality management [18,19,47], supply chain expansion [48], and alliance structure and network relationship [49,50,51,52]. These frameworks have also been explicitly proposed for various market sectors, such as manufacturing [53,54,55], retailing [56], and small businesses [57,58,59,60].
On the other hand, the activities in the post-agreement phase have also drawn the attention of researchers towards different attributes, including strategic aspects such as influential factors [61,62], strategic partner selection [46,63], and alliance rationale [64]. Such activities also include aspects of alliance management, such as managing communication [65,66,67,68], risk control and opportunistic behavior prevention [69,70,71], trust and confidence [72,73,74,75,76], and commitment and cultural issues [77,78,79,80]. Overall, these works that focused on the post-agreement phase can be regarded as an attempt to ensure the cooperation stability of the alliance.
Cooperation stability is vital for alliance survival and provides a necessary condition and a good proxy for alliance success [64,81,82]. However, behavior involving betraying cooperation promises can easily occur in an alliance, especially when there is no power control mechanism over the union members [61,83]. American Mckinsey & Company’s reports pointed out that more than two-thirds of strategic alliances encounter serious cooperation problems in the first two years, and only 40 percent of alliances can be maintained for more than four years [64,84]. The issue of alliance management to promote robust cooperation has become highly relevant for both academia and practitioners.
A supply chain is a synthesis in which many components and functions are integrated to manage the flow of goods, information, and finances from the source to end customers efficiently [85,86,87,88,89]. Furthermore, a supply chain is built within the marketing environment, where many uncertain factors exist [90,91,92,93]. This uncertainty leads to many adverse impacts on cooperation stability. Thus, the supply chain is a complex system composed of several dynamic components, built with specific objectives, operated on a certain life-cycle, and established in an uncertain market. Managing coordination activities in such a complex system is difficult. Understanding the interdependencies and complex causal relationships in a supply chain is critical to successfully manage all of the cooperative activities rather than regarding the firms as a single entity.
The systems thinking introduced by Holmberg [90] to supply chain management provides us with a holistic view and has been widely used in research and management practice [87,89,94,95,96]. Systems thinking is a framework for seeing the connections between components rather than each component only for seeing properties that are the properties of the whole rather than the properties of its components [90]. System analysis could help us depict real-world systems by using a structured approach to building models and thus is suitable for describing and analyzing the cooperation activities in the supply chain system. The system dynamic (SD) model is one of the simulation tools that was proposed on the basis of systems thinking. In the last two decades, system dynamics have been applied to different sectors, such as global dynamics, energy, business, economics, and the product-service sustainable business model. In this study, the cooperation activities of the HASC alliance will be simulated from a system perspective by using the SD model, to analyze the cooperation stability of the HASC alliance and of further proposing corresponding strategies for the stability control.

2.3. Summary

The current AE market is not only rich with opportunities but also full of challenges. One of the best approaches for agri-food companies, especially A-SMEs, to grow rapidly in the AE market is to create a sustainable cooperative relationship with the aim to gain competitive advantages and enhance investment efficiency while designing a series of cooperative strategies from the perspective of supply chain management for pursuing long-term development. However, looking around the current AE market, there is no well-run strategic alliance that can be taken as a successful example. In the review of the literature, no study was found that provides insight into the framework of alliance structure, management strategy of alliance implementation, or stability control of alliance’s cooperation, considering both the characteristics of the AE market and the nature of the agri-food business. More specifically, supply chain managers face two extremely critical problems: planning a reliable organizational structure in a pre-agreement phase for constructing a competitive alliance and designing robust strategies for business management and cooperation stability control in post-agreement for the long-term development of an alliance. To address these problems, this paper provides a basis by building a theoretical framework of a HASC alliance with a series of robust strategies for business operation and cooperation stability control.

3. Conceptual Development of the HASC Alliance: Organizational Structure and Implementation Strategies

As we have mentioned in the previous section, five questions arise to the managers when building the HASC alliance:
  • Which organizational structure can maximize the competence of each entity of the HASC alliance?
  • How can the existing supply chain to the end customer be physically extended in the real-world?
  • How can a physical distribution system ensure that food quality and safety be established?
  • How can the existing supply chain be effectively connected with the extended portion at the management level?
  • How can the cooperation stability of the HASC alliance be controlled?
This section mainly focuses on discussing proposed strategies for the first four problems, with explicit frameworks. The strategy for the last issue will be discussed in the next section with empirical analysis.

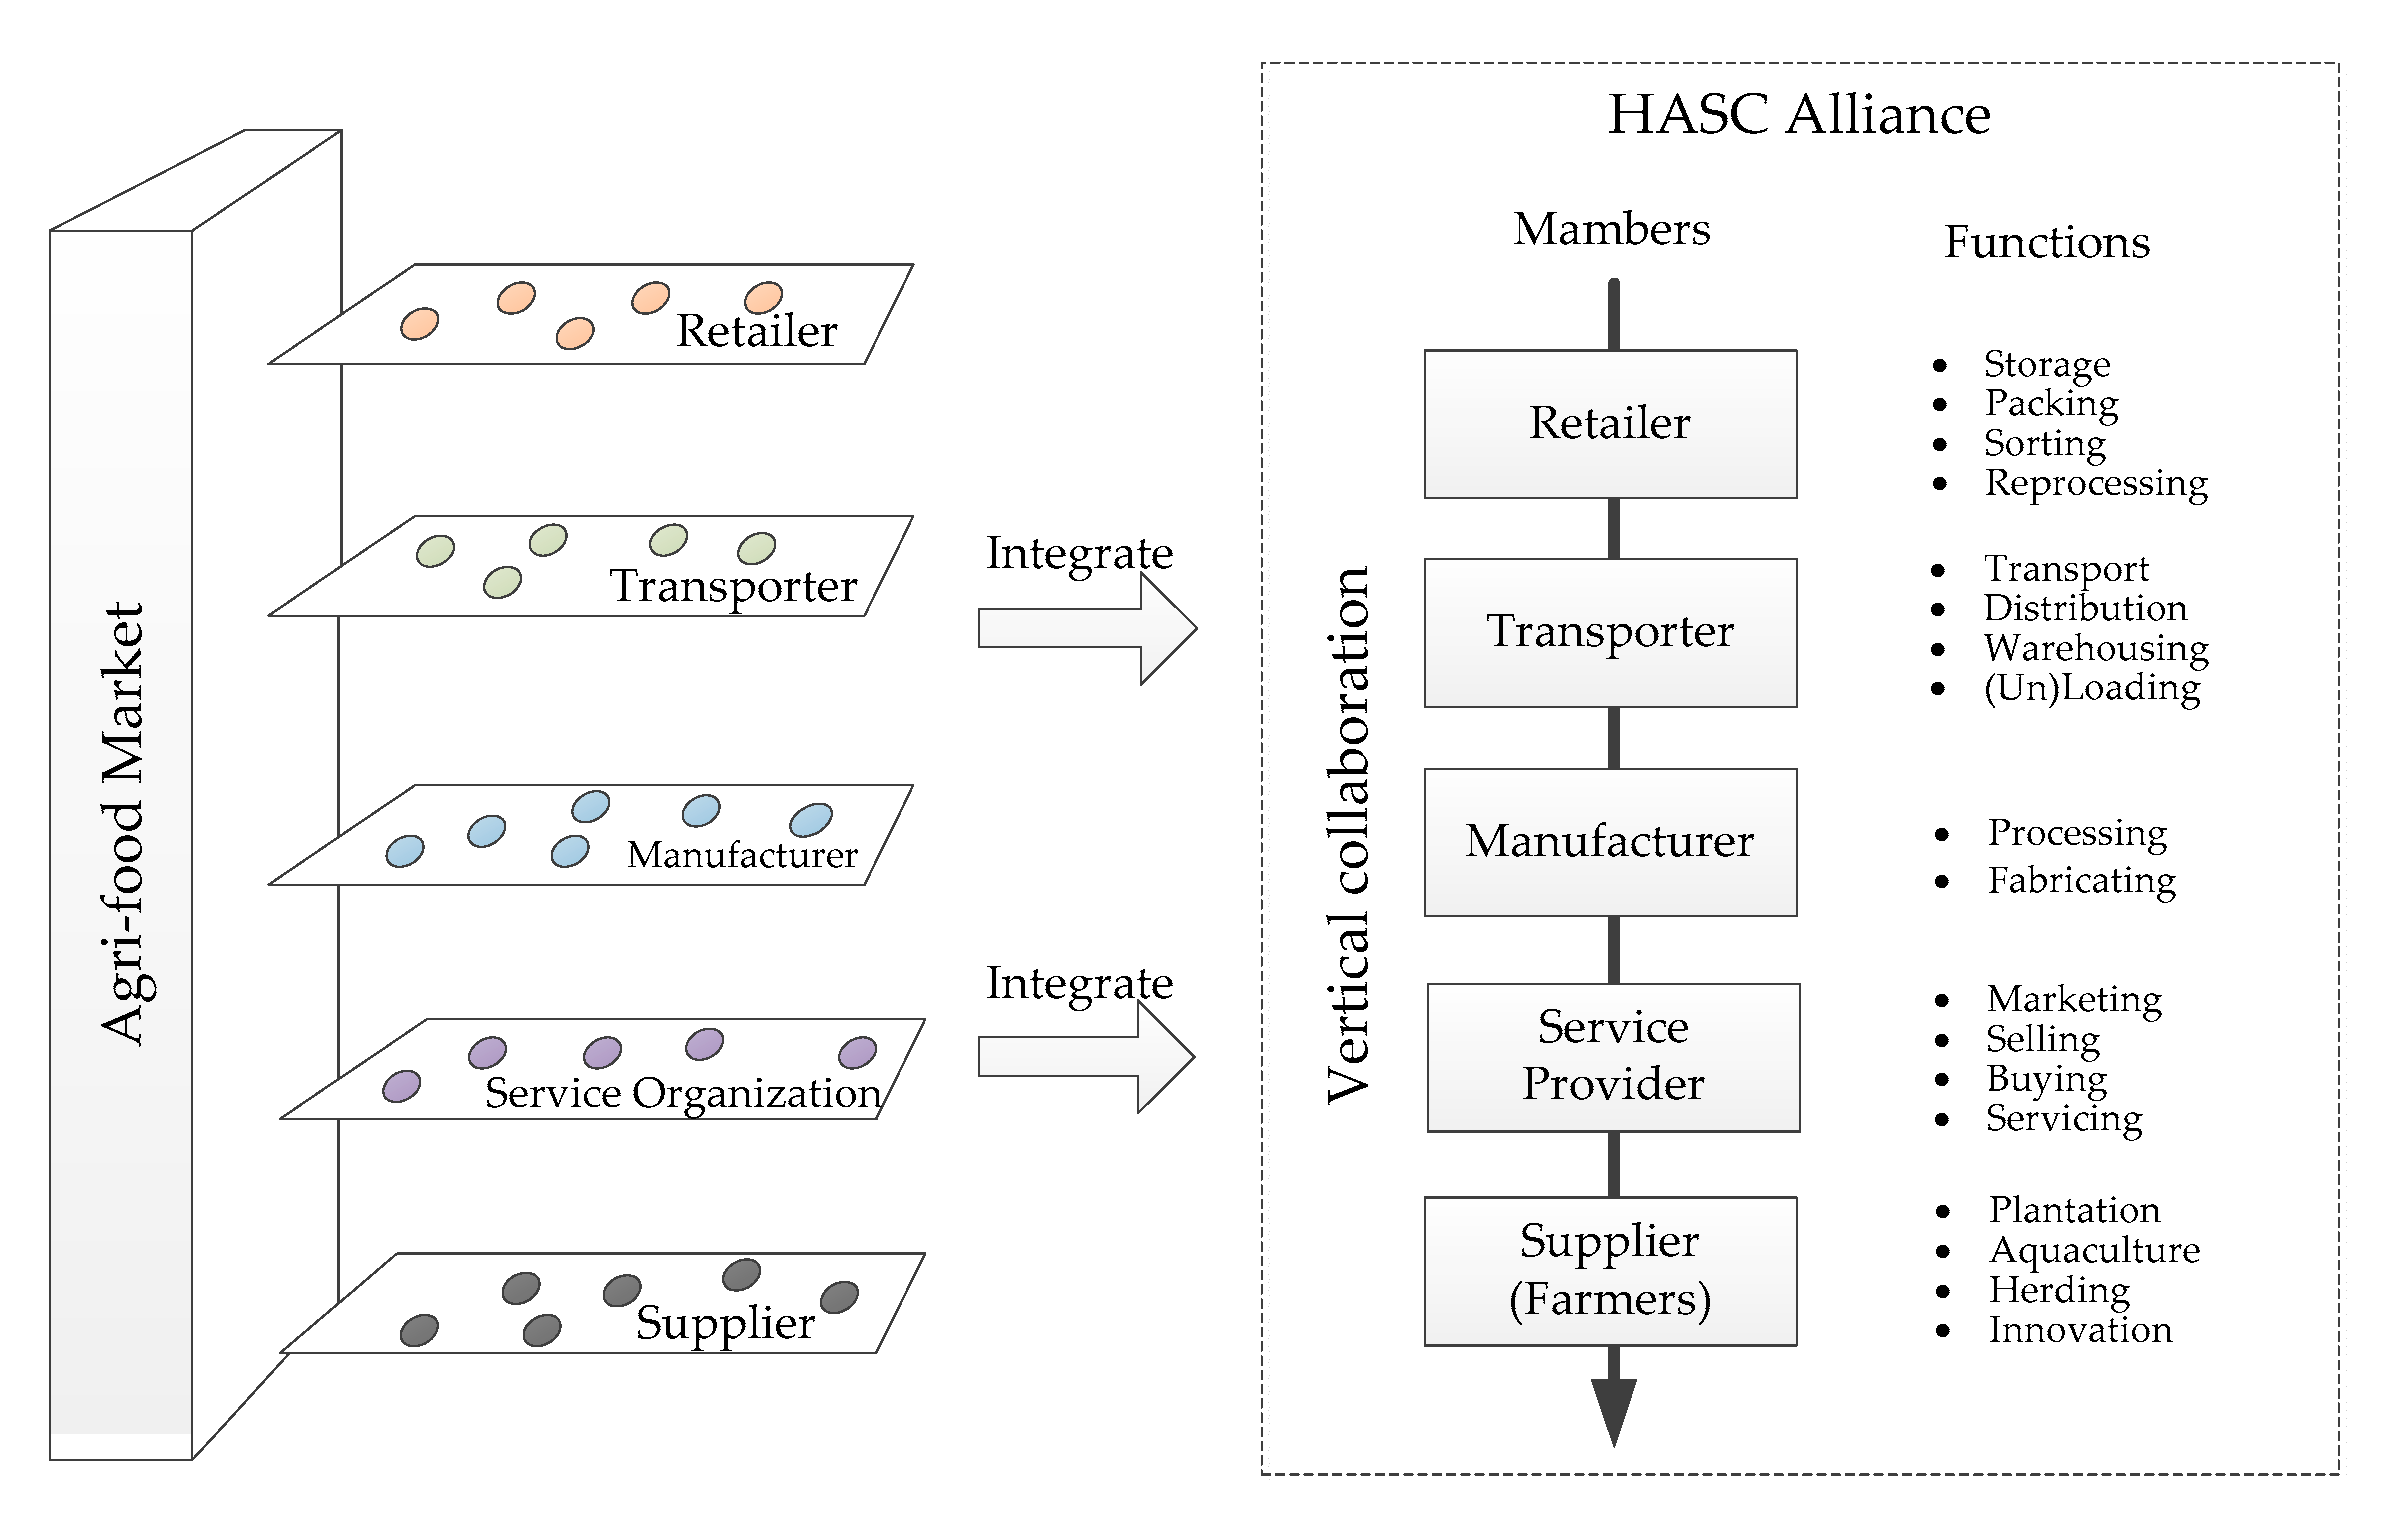
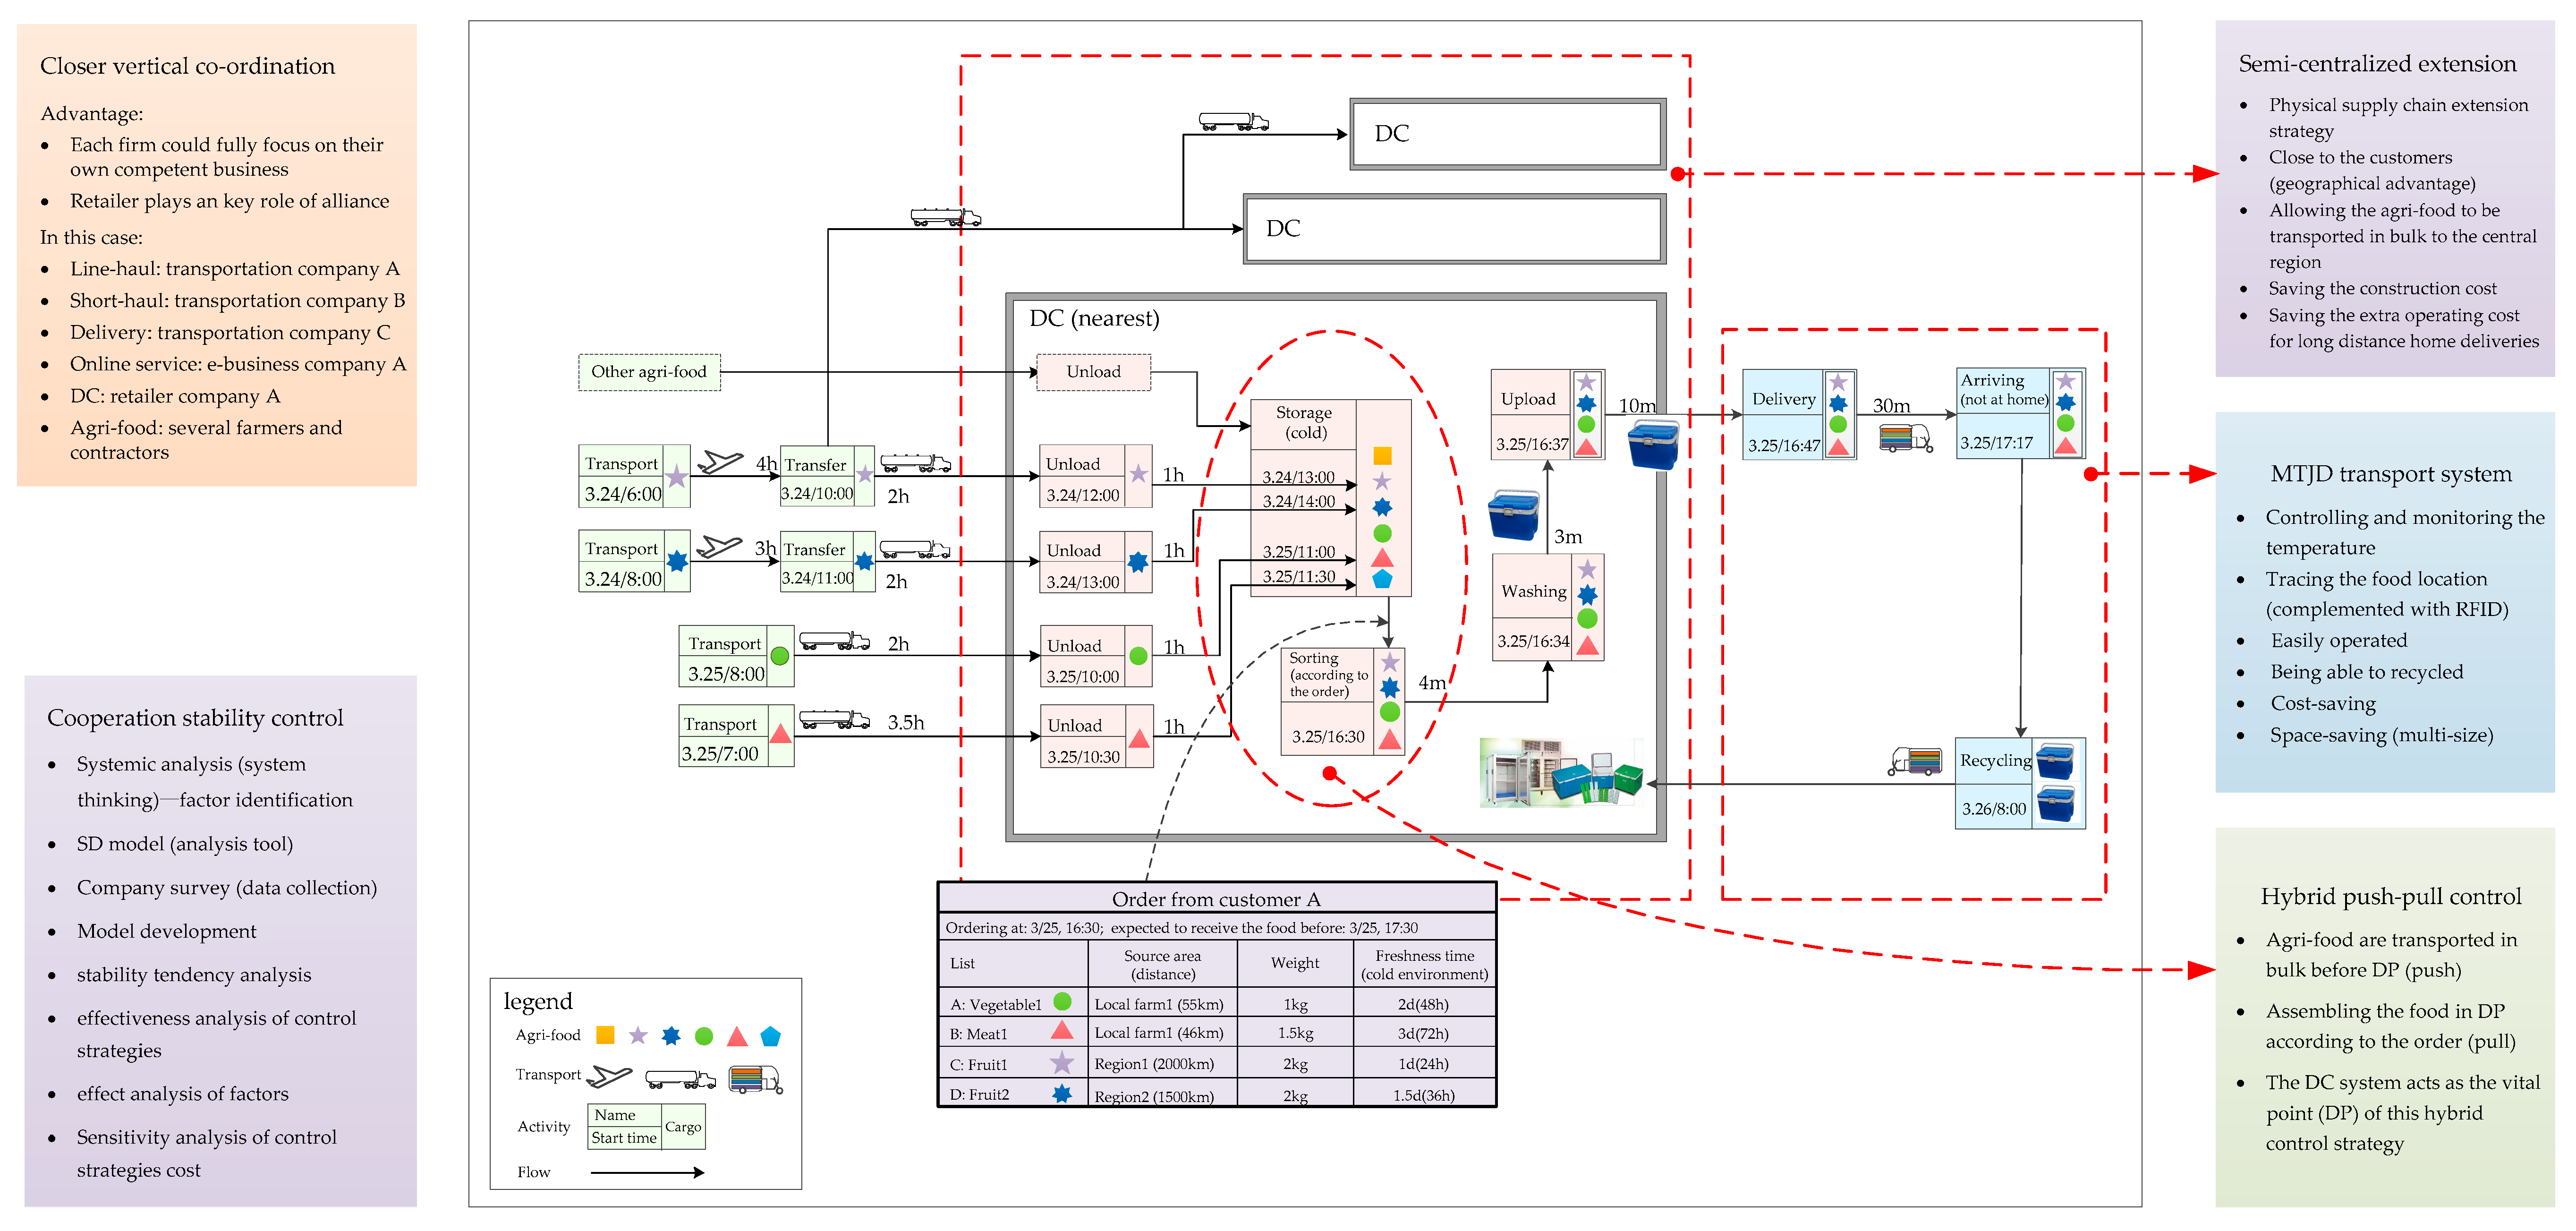
3.1. Organization Structure: Closer Vertical Co-Ordination

• Which organizational structure can maximize the competence of each entity of the HASC alliance?
Organizational form is the internal structure of an alliance (organization), which largely determines how the organization functions and how the participants carry out their functions [97,98]. The agri-food supply chain includes the suppliers (farmers), service providers, manufacturers, transporters, retailers, and consumers. A generic supply chain at the organization level with different functional layers is presented in Figure 1 (left side) [99]. Each firm is positioned in a layer with its own supply chain-related functions (e.g., producing, manufacturing, and transporting) (Figure 1, right side). As shown in Figure 1, the HASC alliance proposed in this study involves closer co-ordination that vertically integrates one or more firm(s) from each functional layer of the supply chain. Such an alliance arrangement breaks the boundary between the firms at different layers and thus allows various functions to be integrated as a streamlined supply chain with the total function of agri-food home delivery. Each firm in the chain can entirely focus on fulfilling its own business (function). For example, the e-commerce company would oversee the trade-related activities, such as marketing, selling, buying, and servicing of the agri-food products.
The function of the retailers in the proposed HASC alliance is of key importance. The business process of the HASC alliance is shown in Figure 2. To fulfill the online orders, the traditional supply chain must be extended directly to the end customers. The retailer plays a critical role in this process. Retailers are proposed as members of the alliance due to their unique geographical advantage in urban areas—adjacent to the customers. The retailers serve the function of product (food) aggregation and reprocessing at the distribution centers (DCs). As the key hubs in the chain, DCs not only bridge the existing parts of the supply chain with the last-mile part (customers), but also increase the transport efficiency of the entire chain. This sophisticated arrangement is also the core of the management and implementation of the HASC alliance. In this study, three strategies are proposed revolving around this centralized arrangement for the guidance of supply chain management and implementation of the HASC alliance. In the following subsections, each strategy will be described in detail, along with its advantages.

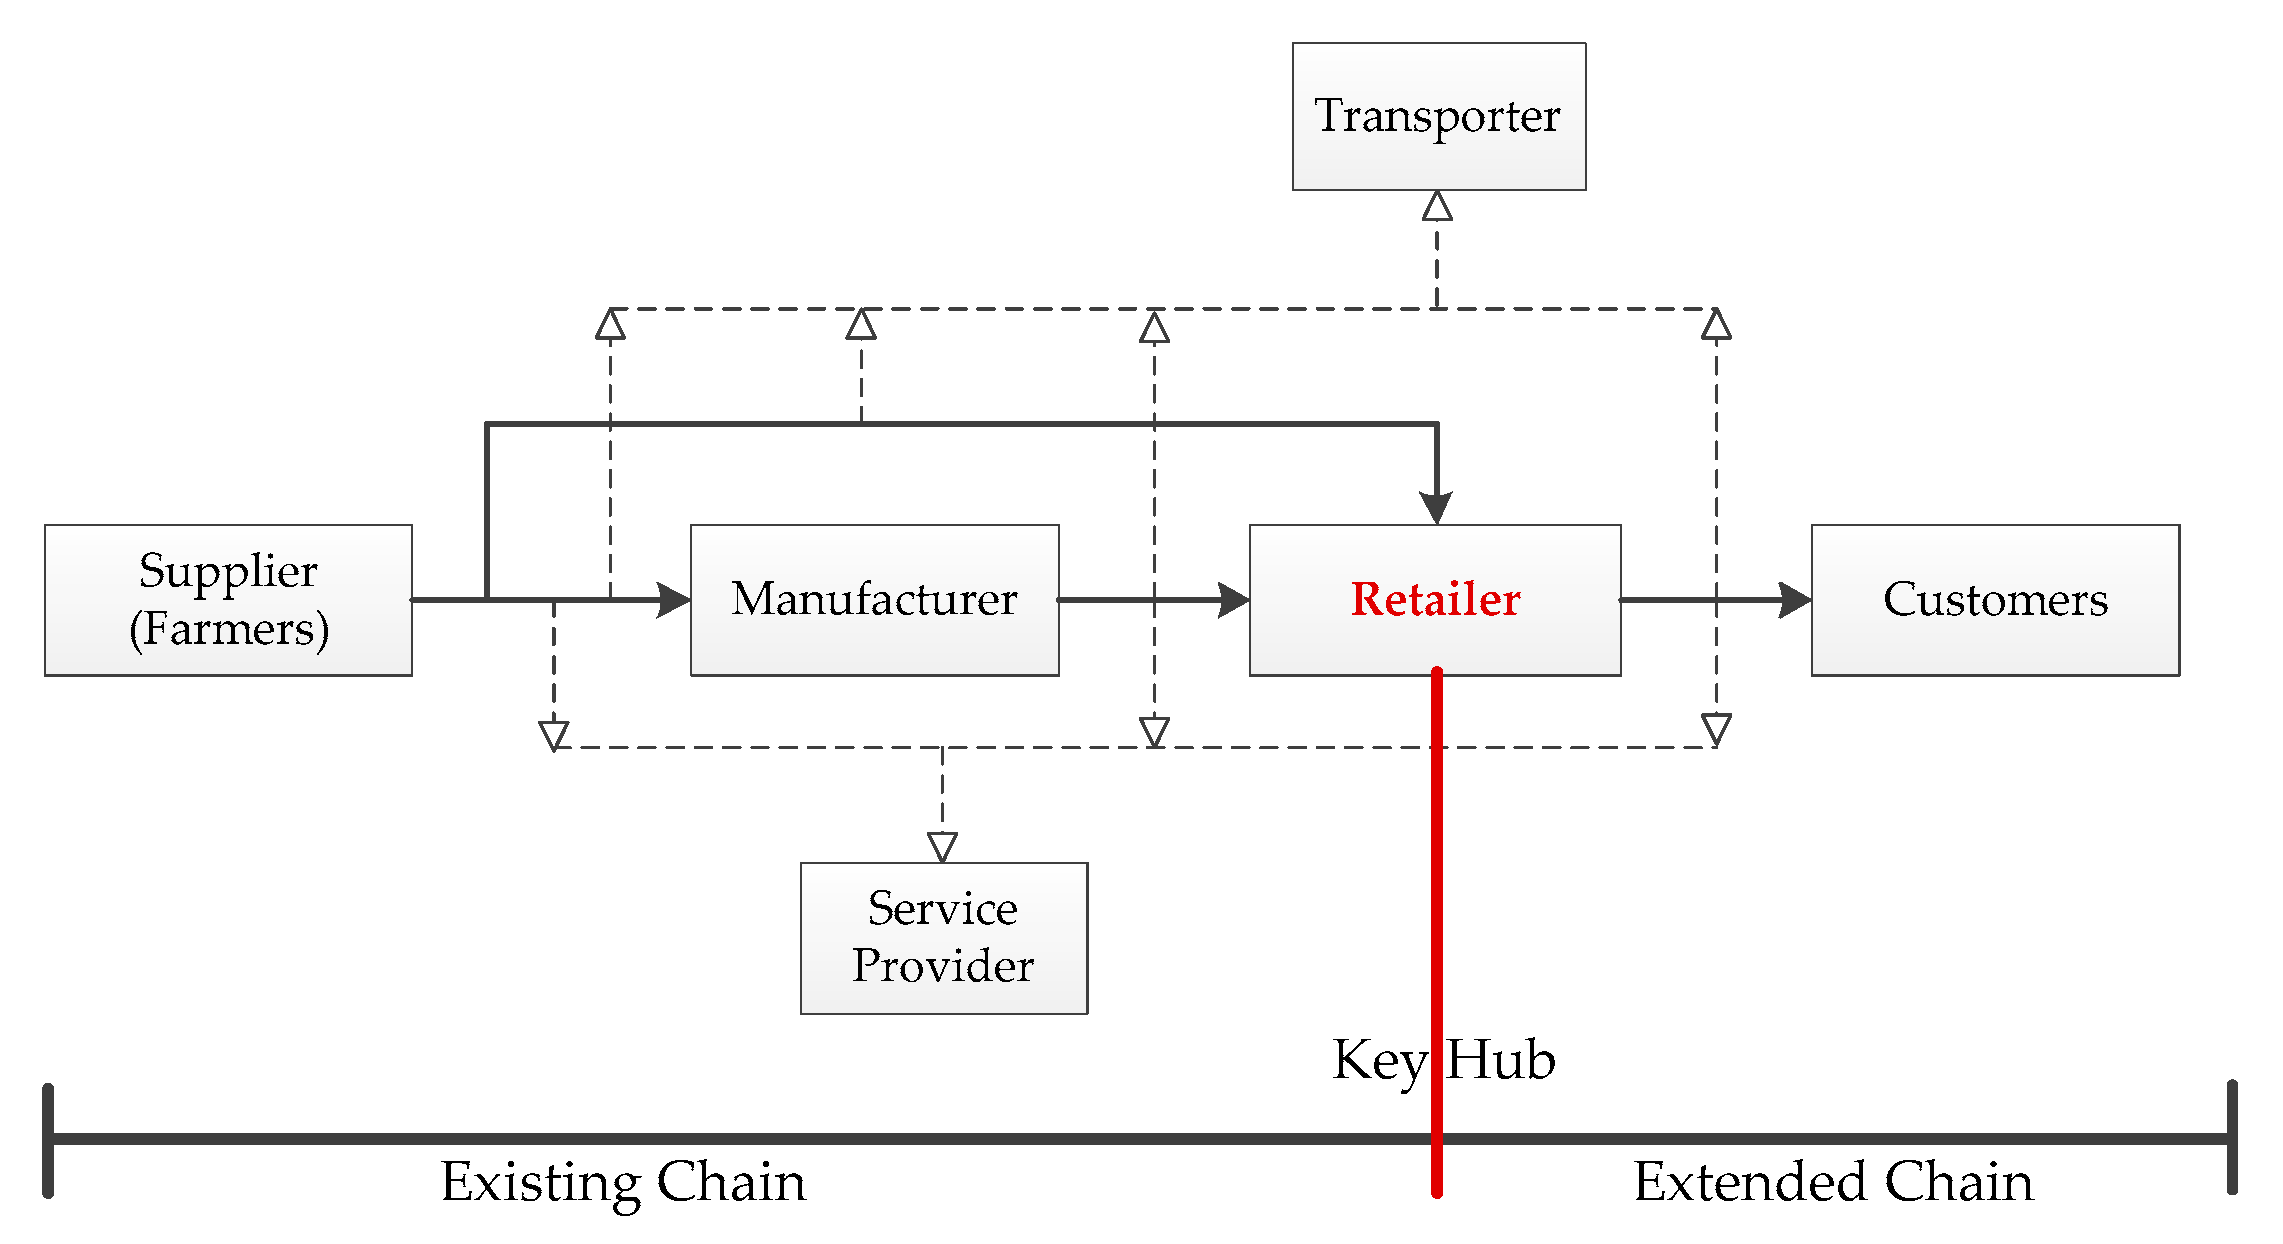
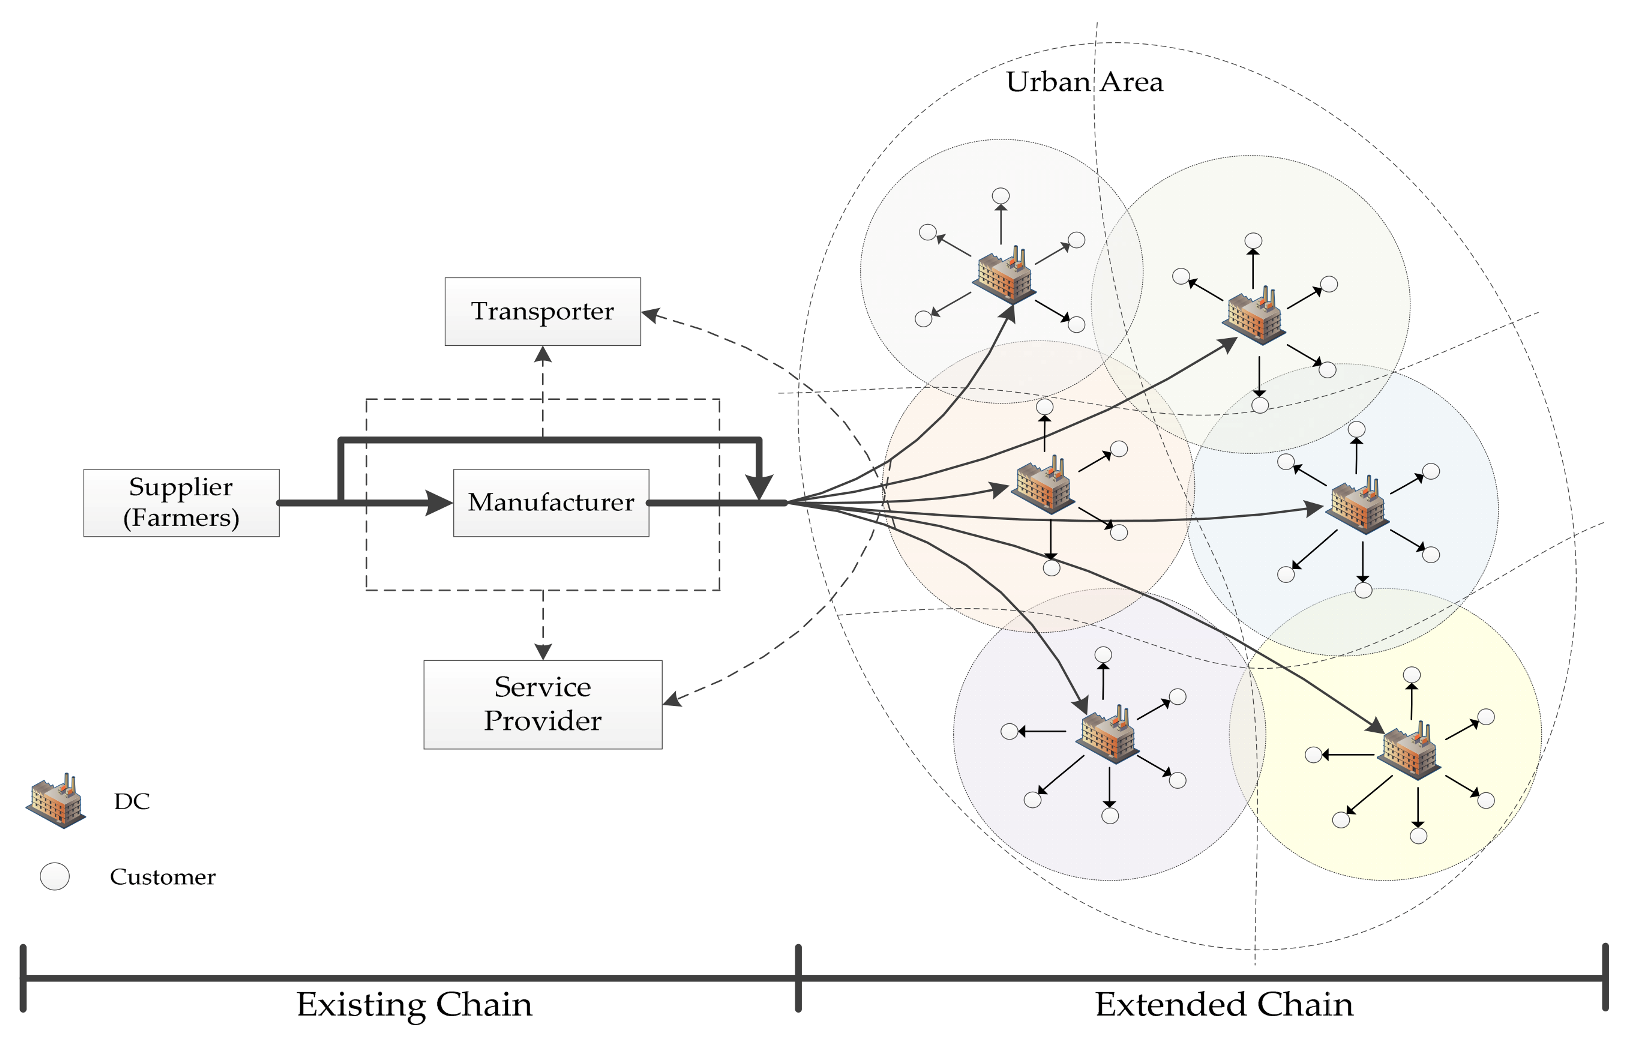
3.2. Last-Mile Chain Extension Strategy: Semi-Centralized Extension

• How can the existing supply chain to the end customer be physically extended in the real-world?
The centralized extension strategy has been widely applied for bridging and managing the last-mile chain in other e-commerce industries, such as daily necessities (e.g., Ocado, a British online supermarket) and office equipment (e.g., Office Depot) [100]. This strategy aims to centrally manage a series of activities at the last segment of a delivery process, based on the centralized transit point (e.g., DCs), to directly dispense the products to the final drop point (customers’ home) of the delivery chain [29]. Typically, the centralized extension strategy has three major advantages, especially in extending the agri-food supply chain. First, the centralized DC design makes it possible to establish a well-organized plan for providing quick and direct distribution to the customers. Using this advantage, the alliance can adequately balance customer convenience with the delivery cost. Second, working from a DC allows aggregated inventory, which would simultaneously allow holding less inventory while having both an extended range of products and greater in-stock availability. This inventory aggregation advantage has a substantial benefit for agri-food industries, where freshness counts. Third, with the help of DCs, the reprocessing of agri-food products (sorting, washing, or packaging) is more effective and efficient, which allows the inventory to be turned more quickly. This feature is valuable for agri-food products, especially for those with a short life-cycle or that perish quickly. However, the centralized extended supply chain strategy also comes with substantial challenges, such as the high costs of investment in DCs and long-distance delivery, which may press the newly-built alliance with an additional financial burden.
In the urban areas, large retail companies (e.g., Walmart and Carrefour) usually occupy the core position in the commercial districts. This dominance gives them the geographical advantage of being adjacent to the customers, which helps them to quickly infiltrate customers’ daily lives. Moreover, for better management of the agri-food business, most of these retailers have built their own refrigerated warehouses. To avoid the disadvantages of the centralized extension strategy, it is necessary to invite such retail companies as an indispensable component of the HASC alliance. They can bring the alliance a huge advantage in regional dominance and save construction costs. Aggregate inventory support achieved by reconstructing the existing refrigerated warehouses would allow the agri-food to be transported in bulk to the central region. This approach would significantly cut the investment costs of DC construction and would also save the extra operating costs for long-distance home deliveries. Such a proposed extended supply chain highly relies on the network, which is composed of many regional DCs, rather than on specialized DCs, which usually serve the whole urban range. We call this approach a semi-centralized extended supply chain.
Figure 3 shows an example of a semi-centralized extended supply chain. Several physical stores belonging to the participant retail companies are selected from different regions in the urban area to form a DC network. Each store will serve the customers living in its range of operation. Thus, the whole urban area could be covered by the DC network. Based on this DC network, the agri-food can be simultaneously transported in bulk to each DC point through multiple trucks. Then, after an efficient, professional, and standardized reprocessing process (sorting, packing, and encasing), the fresh agri-food can be directly delivered to the end customers to finally fulfill the orders. This semi-centralized extension strategy not only has the aforementioned three advantages of the centralized extension strategy, but also alleviates the impact of high costs caused by the DC construction and distant distribution, and hence provides a stable base for the alliance development.

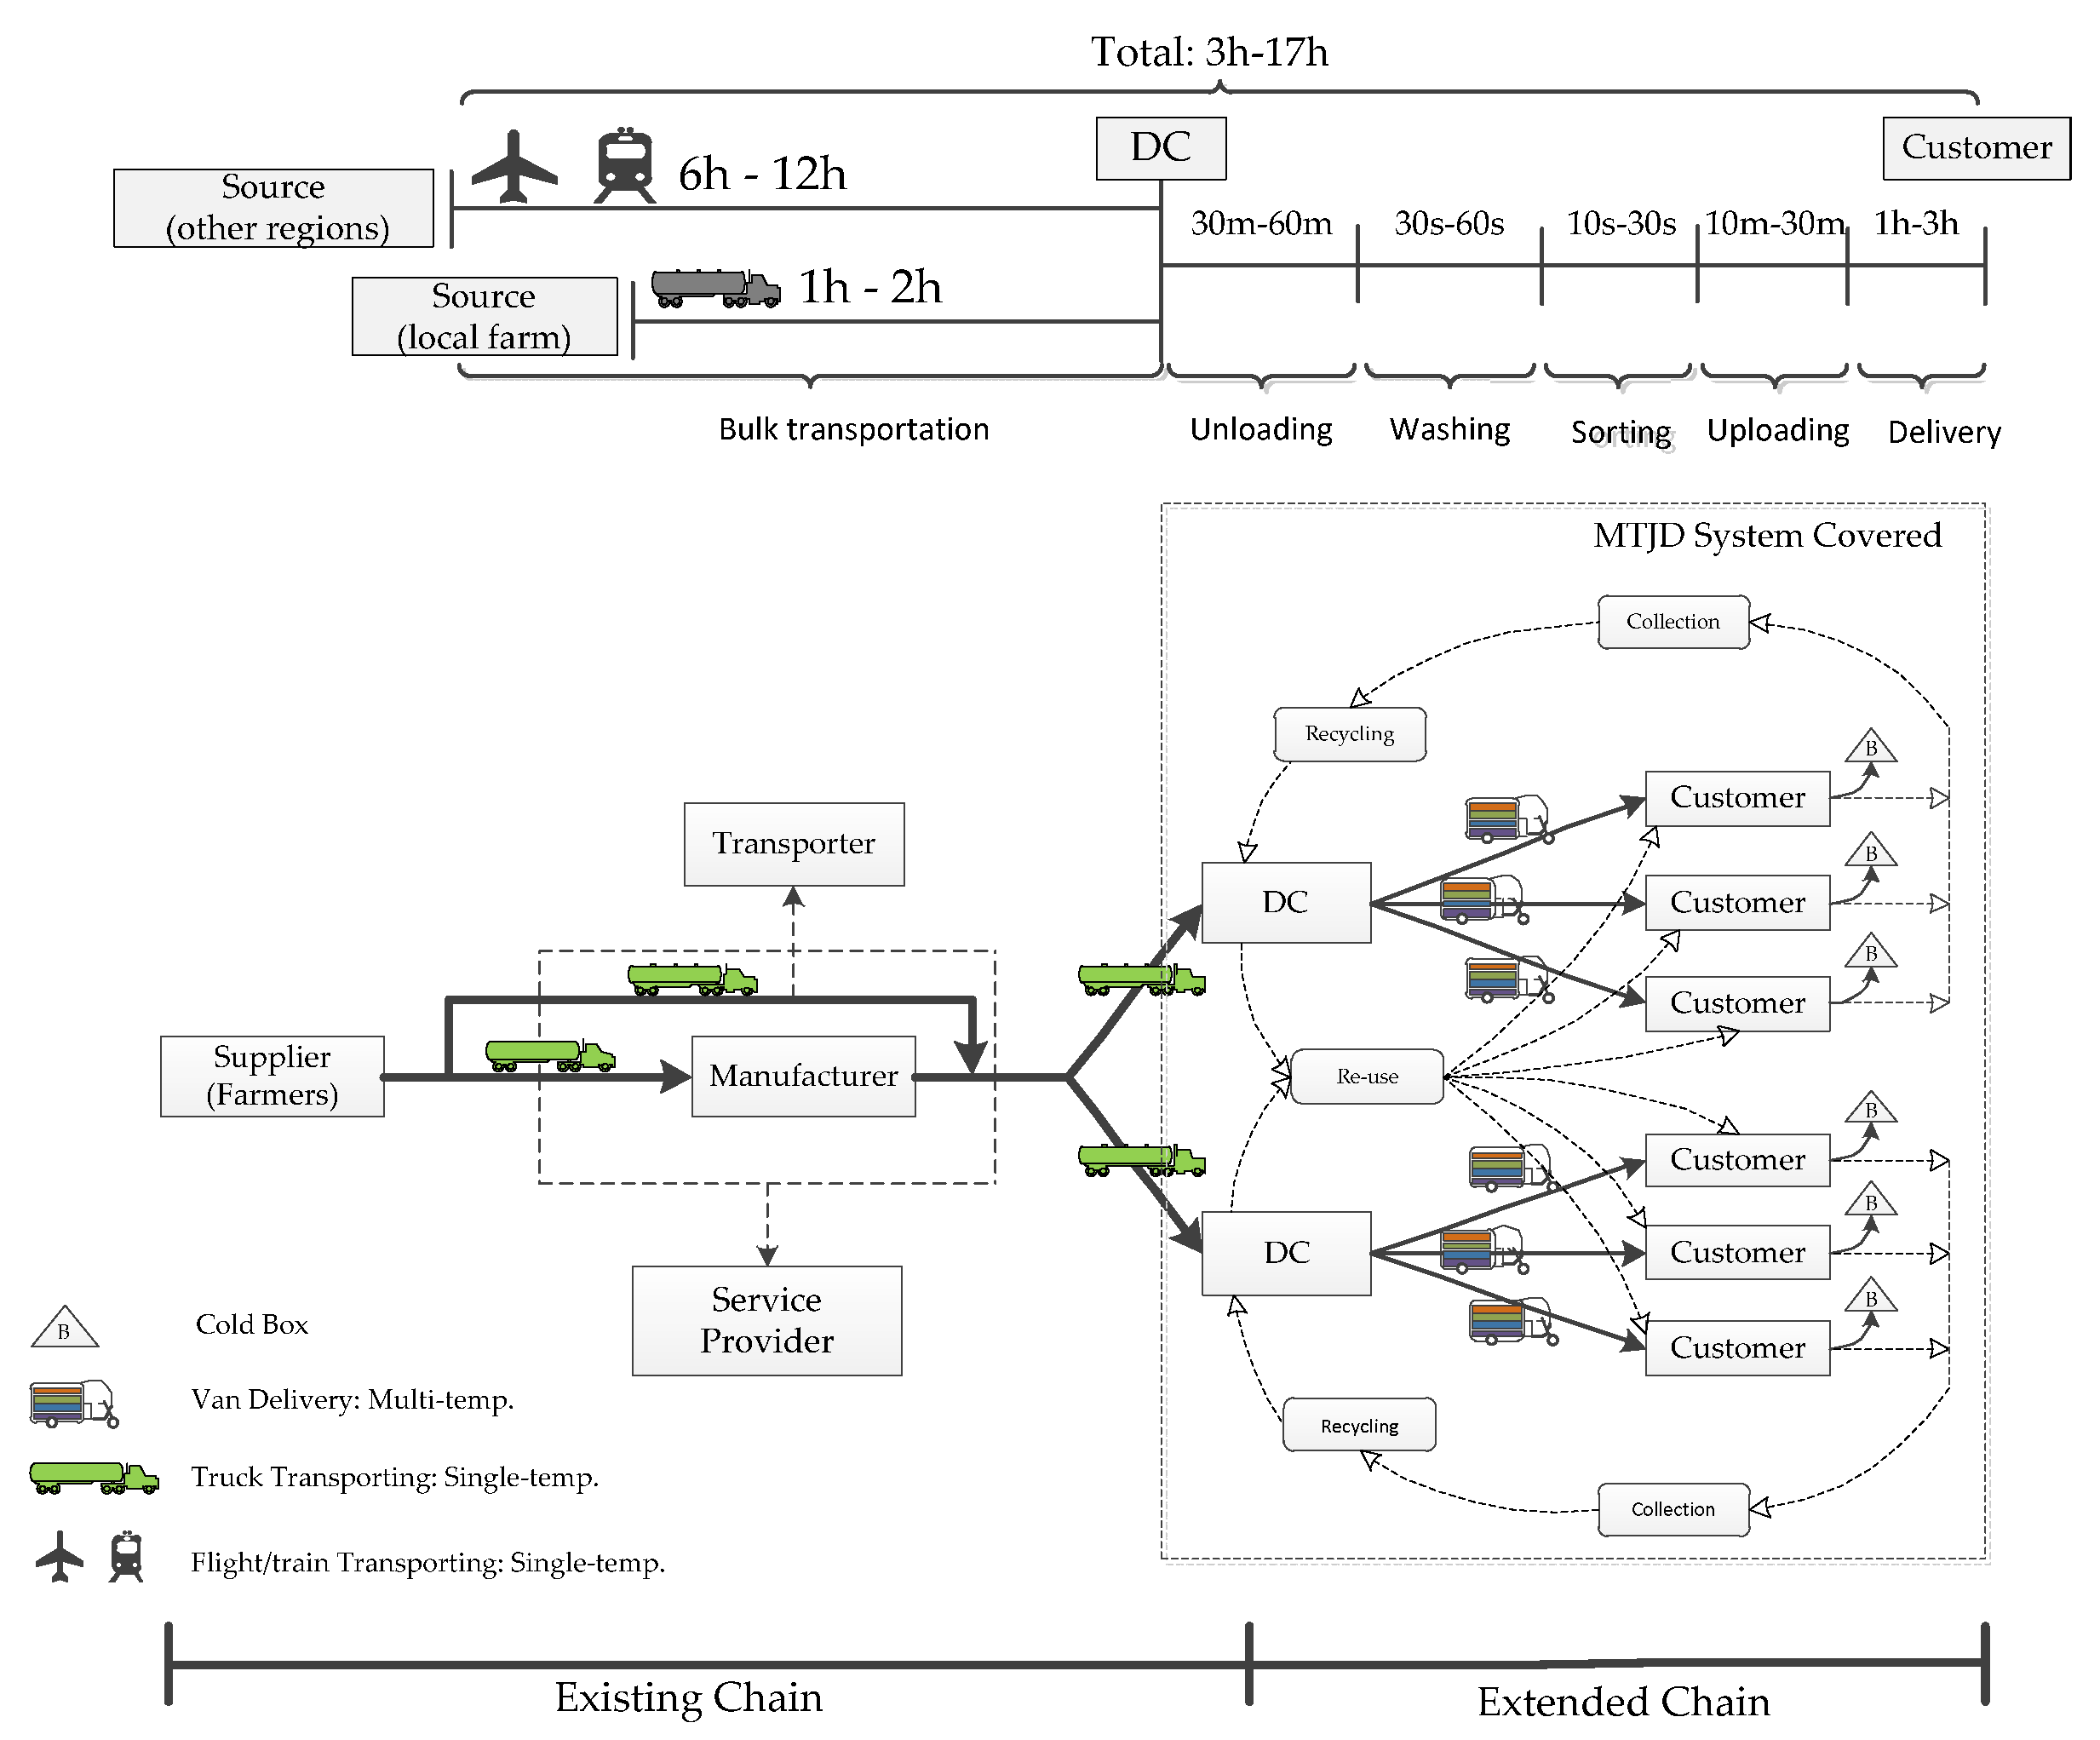
3.3. Food Transport Strategy: MTJD Transport System

• How can a physical distribution system ensure that food quality and safety be established?
Due to the perishable, vulnerable, and diversified nature of fresh agri-food and the widely dispersed terminal consumers in urban areas, it is important to provide a robust physical system that can: (1) control and monitor the temperature; (2) trace the food location; (3) be easily operated; (4) support recycling; (5) save costs; and (6) save space. The multi-temperature joint distribution (MTJD) system has the potential to fulfill the discussed needs.
The MTJD technique was developed by the Energy and Resource Laboratory, Industrial Technology Research Institute in Taiwan [101]. As shown in Figure 4, the MTJD system is equipped with multiple-size insulated containers (boxes) and replaceable and reusable eutectic plates (a type of cold accumulator). Eutectic plates of different temperatures and sizes are utilized in standardized cold insulated boxes and cabinets to maintain precise temperatures. The eutectic plates accumulate cold through freezers installed at terminals (DCs). The containers with cold accumulators are then used in regular vehicles, which enhance flexibility. Additionally, the whole system is complemented with advanced radio frequency identification (RFID) technology, which can help in food tracking, identification, and device recall [102]. Due to the reusability and flexibility of such cold devices, the MTJD system has a great potential to minimize the investment in food storage and the cost of transportation in the logistics system while maximizing compartment utilization and logistics performance (long service-life); additionally, it is environmental friendly.
As shown in Figure 5, the MTJD system is primarily applied in the last-mile delivery process, covering the extended part of the supply chain. In each regional DC, the primary commodity (raw or processed agri-food) will go through a series of reprocessing steps, such as sorting, washing, and packing. Thereafter, the reprocessed food will be encased in an insulated box with pre-refrigerated eutectic plates to meet the multiple temperature requirements of different types of agri-food. Next, the van will be loaded with preordered agri-food and will deliver each order to the corresponding location (customer’s home or workplace). The food will be handed over to the customer at the appointed place; thus, the order will finally be fulfilled. The empty box will be brought back to the DC by the van to be reused in the next cycle. In contrast, if the customer cannot reach the appointed place on time (they may have a temporary emergency), the box can be placed in that place for the customer. Specific couriers will be assigned to collect empty boxes that may not be brought back on time. During this whole process, no matter whether it is the in-time-taking or the delayed-taking, the freshness of the agri-food can be preserved entirely by using the insulated containers and eutectic plates. The whole MTJD system is modeled in such a way that the material flows between regional DCs and their customers, forming a partial closed-loop chain. Moreover, the top of Figure 5 also shows the time that is possibly taken at each stage of processing. If it promises an effective handover between two connected stages, the duration of the entire transporting process from the source area to customers would be within 17 h (excluding the tasks at the source area, e.g., picking). This time is much less than the minimum time that an agri-food holds its freshness in a cold environment—24 h.
In summary, the MTJD system is introduced in the HASC alliance because of the advantages of its techniques in temperature control, food package tracing, flexibility, circulation, and environment protection. Moreover, the unified insulated box and eutectic plates, which are standardized in structure and size, allow managers to efficiently meet the corresponding criteria specified for the handling processes. This approach can help to decrease the time that food is exposed in the processing stage and thus reduce the impacts of excessive processing on food quality.

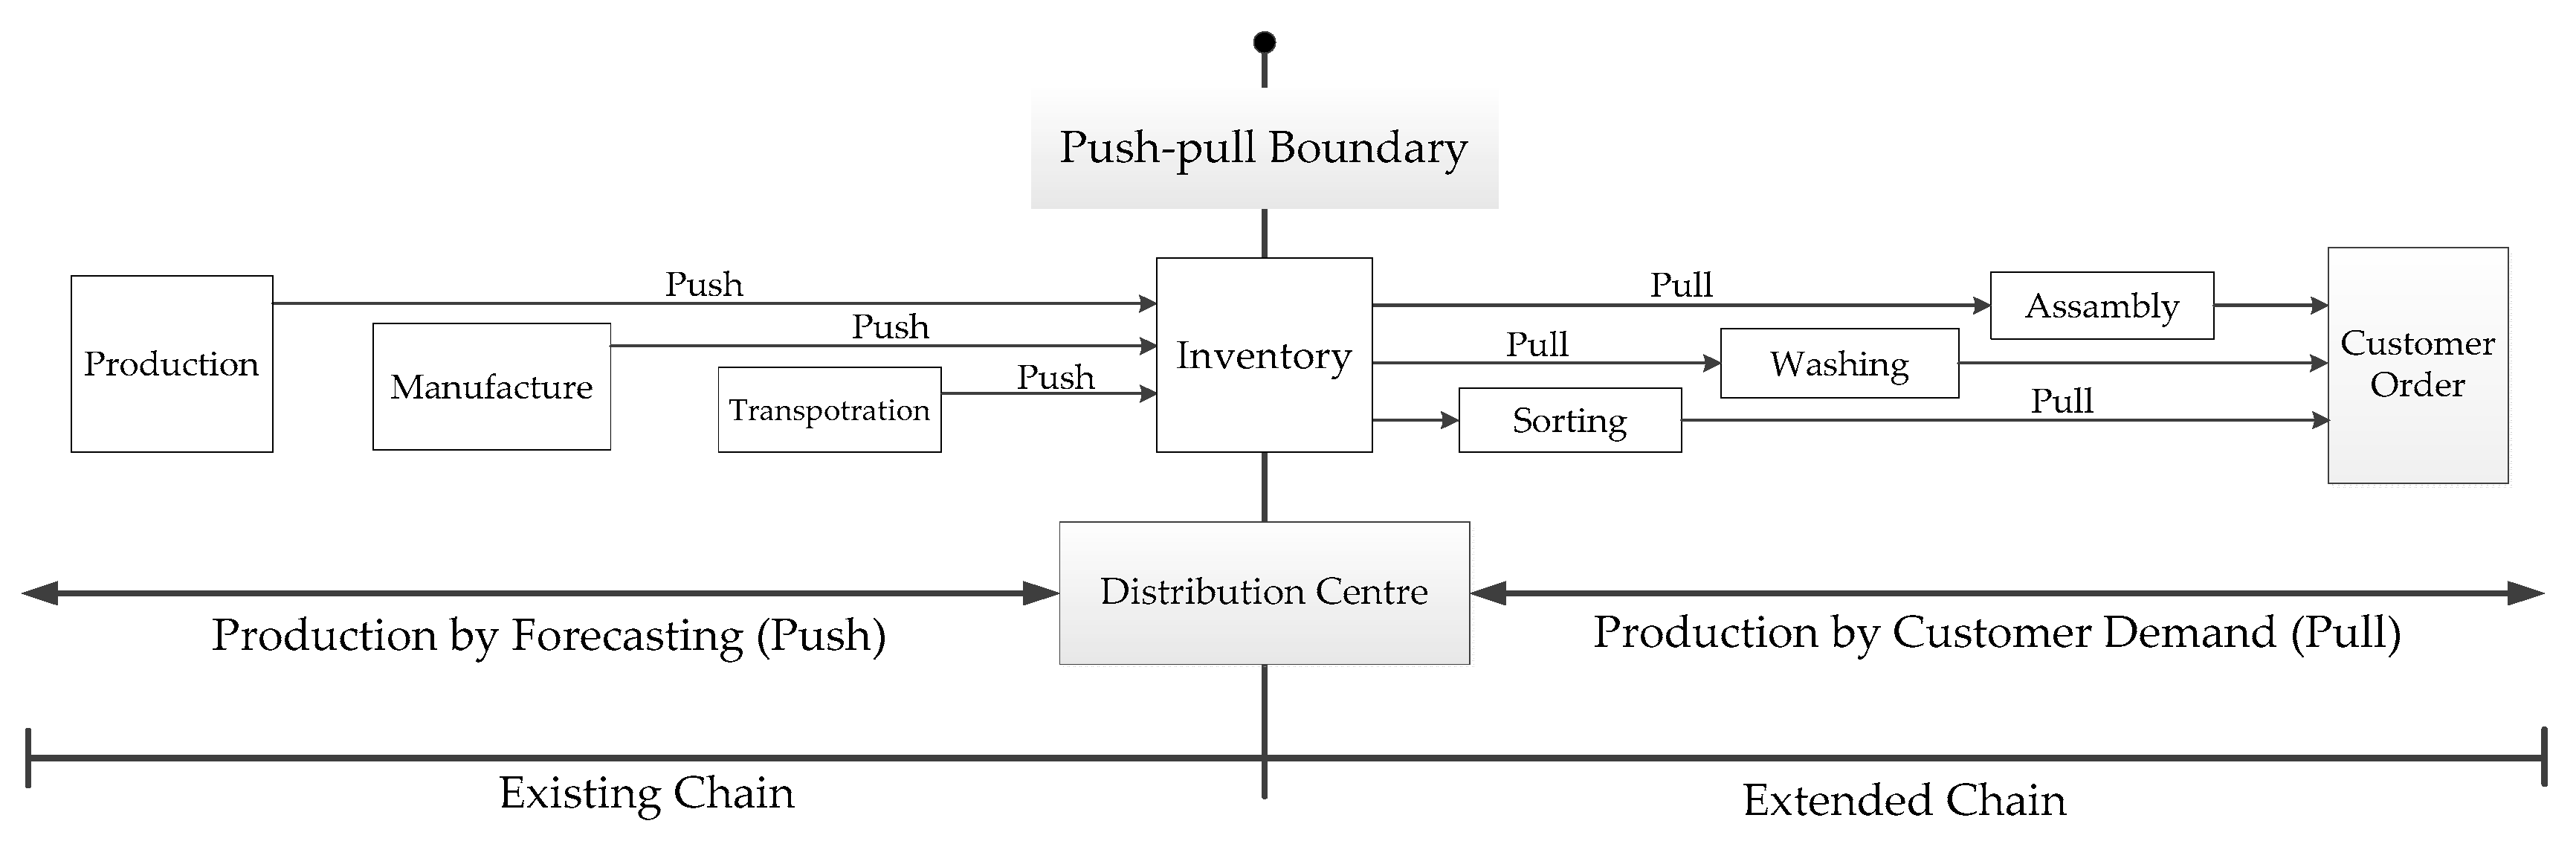
3.4. Production/Distribution Control Strategy: Hybrid Push-Pull Control

• How can the existing supply chain be effectively connected with the extended portion at the management level?
The hybrid push-pull strategy is one of the supply-chain production/distribution strategies that has been widely used in practice with the growing popularity of ‘make-to-order’ (or customized) production [103,104]. Combining the various merits of the push and pull control strategy, the hybrid strategy has great potential to drive down the costs of inventory while maintaining a high level of customer satisfaction [105,106]. Under such a hybrid push-pull control strategy, according to the forecast demand, semi-finished products (or components) are pushed to an intermediate inventory station called the decoupling point (DP) (also called push-pull boundary) [107,108]. Once the orders are placed, the products are then pulled from the DP to complete the remaining customization processes and delivered to the customer. This DP is of vital importance to properly control the balance between push and pull in the manufacturing process.
The home-oriented agri-food that is related to the customer’s daily life is one type of highly customized commodity. Various agri-foods must be ‘assembled’ according to the customer’s order. Moreover, due to the uncertainty rises from emerging AE markets, the demands for agri-food with a home-delivery service may fluctuate with time. Seeking to ensure that the HASC alliance has higher flexibility and robustness, we introduce the hybrid push-pull strategy in designing the supply chain of the HASC alliance. Specifically, since there are many distribution segments (branches) in the extended chain (after the DC stage), it is impossible to forecast the demand in each segment. The assembly process should be based on actual orders. Thus, pull control is more suitable for this stage. On the other hand, before ‘assembling’ the food into a ‘product’ in the DC, the total demand quantity of each kind of agri-food must be forecast according to the historical order quantity. Thus, push control is effective for the prior DC stages. Figure 6 shows a schematic diagram of the proposed hybrid control mechanism for the supply chain of the HASC alliance.
In such a case, the DC system acts as a vital point of this hybrid control strategy. The ‘primary’ agri-food can be transported in bulk to and stored in each regional DC based on the forecast demand; then, ‘assembly’ (or packaging) work can also be finished in the DC according to the customers’ daily orders. The customization of agri-food products can be postponed until order receipt, which makes the entire chain flexible enough that it can cope with increasingly customized demand. In addition, the stable inventory ensures that the alliance is robust enough to absorb unpredicted demand fluctuation.

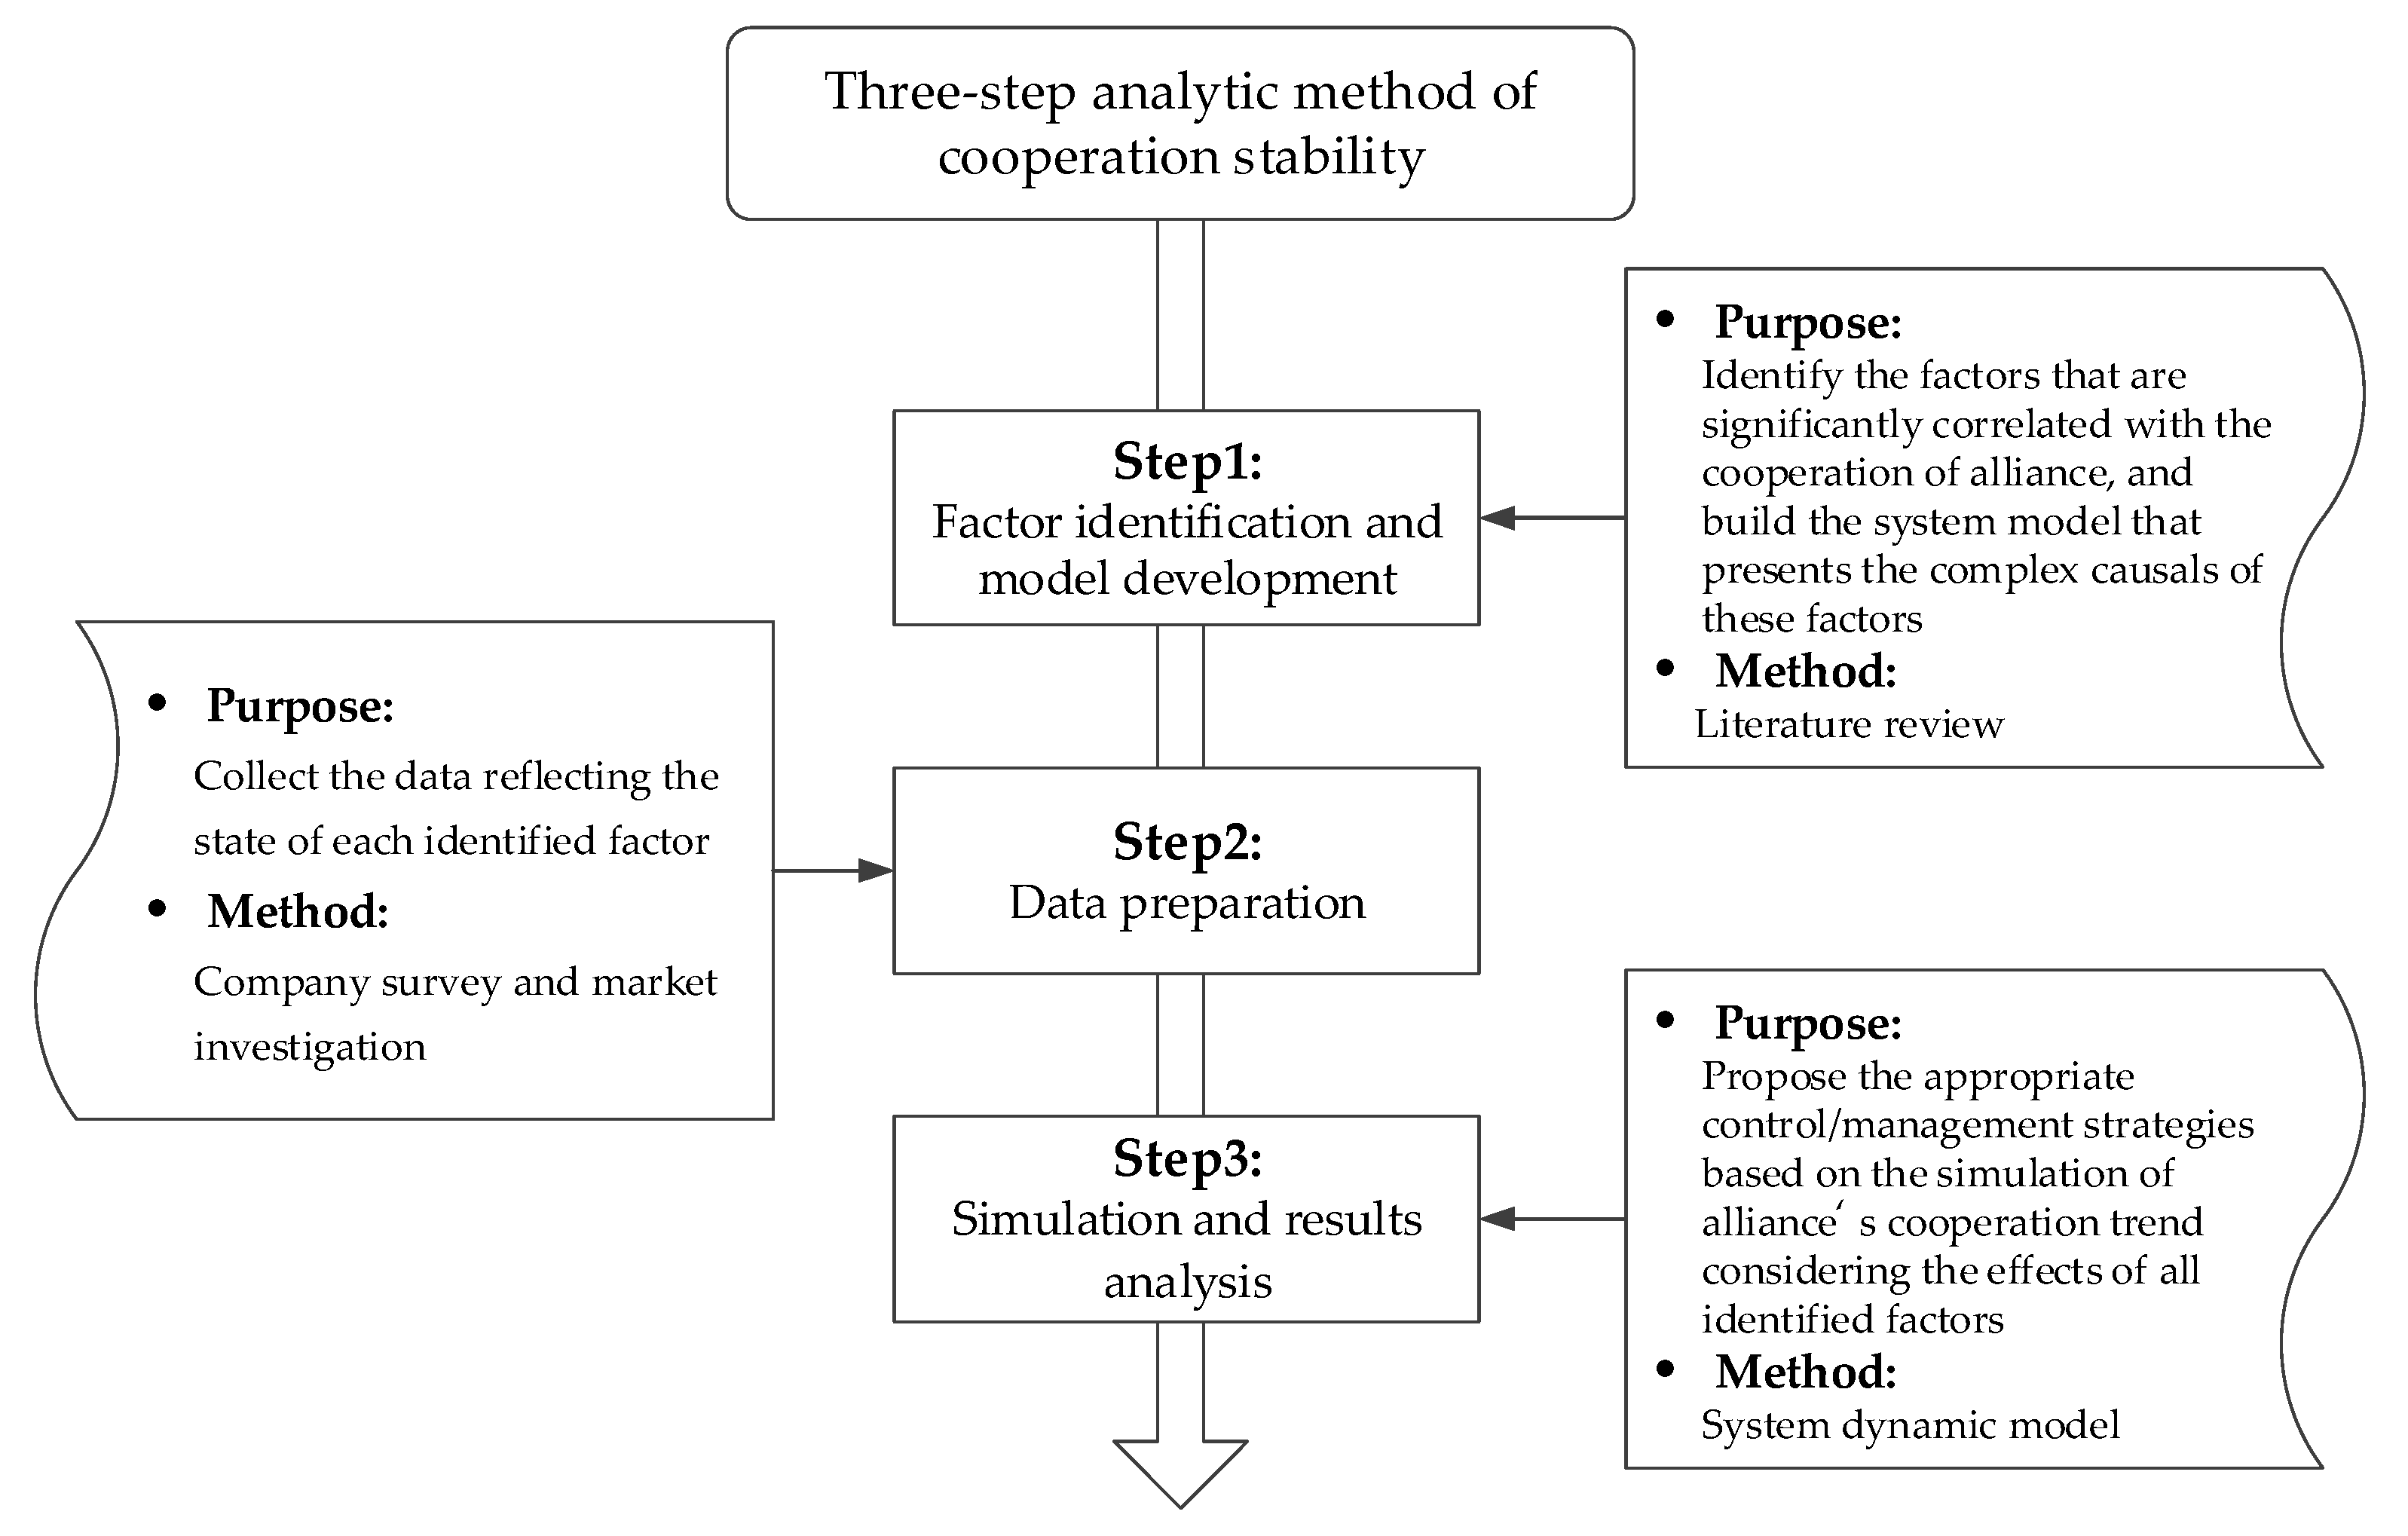
4. Cooperation Stability: Model of the HASC Alliance

In the above section, a conceptual framework of the HASC alliance from a theoretical perspective is built up, along with its organizational structure, supply chain management strategies, and food transport technologies. However, a more important question that arises in each manager’s mind is—how such a cooperative structure would survive in the long term. The cooperation of the HASC alliance is based on a dynamic system which is associated with many complex activities. Therefore, it is essential to understand the different variables (influential factors and control strategies) that will influence the stability and performance of the proposed HASC alliance under different conditions. For this purpose, the following section provides a detailed investigation of the different parameters and their relationship with the stability and performance of the HASC alliance.
In this section, the study attempts to propose a three-step analytical method based on the systems thinking theory. The framework of this method is shown in Figure 7. As shown in the figure, the three steps include: (1) factor identification and model development, which is intended to identify the factors that are significantly correlated with the cooperation stability of alliance, and build the system model that presents the complex causals of these factors; (2) data preparation, which aims to collect the data that reflect the state of each identified factor through the implementation of survey and market investigation; (3) simulation and result analysis, which is expected to propose the proper control/management strategies based on the simulation of alliance‘s cooperation trend considering the effects of all identified factors.
An empirical study, where a hypothetical HASC alliance is built in Kunming, was conducted to specify the proposed three-step analytical method. The system dynamics model (SD) was applied as the tool for the model development and cooperation trend simulation. The initial data of each factor were collected by investigating the local agri-food market and surveying the relevant companies. We first introduce the fundamentals of the SD model. Then, the implementation of each step of the proposed method is explained explicitly by analyzing the cooperation stability of the hypothetical alliance.

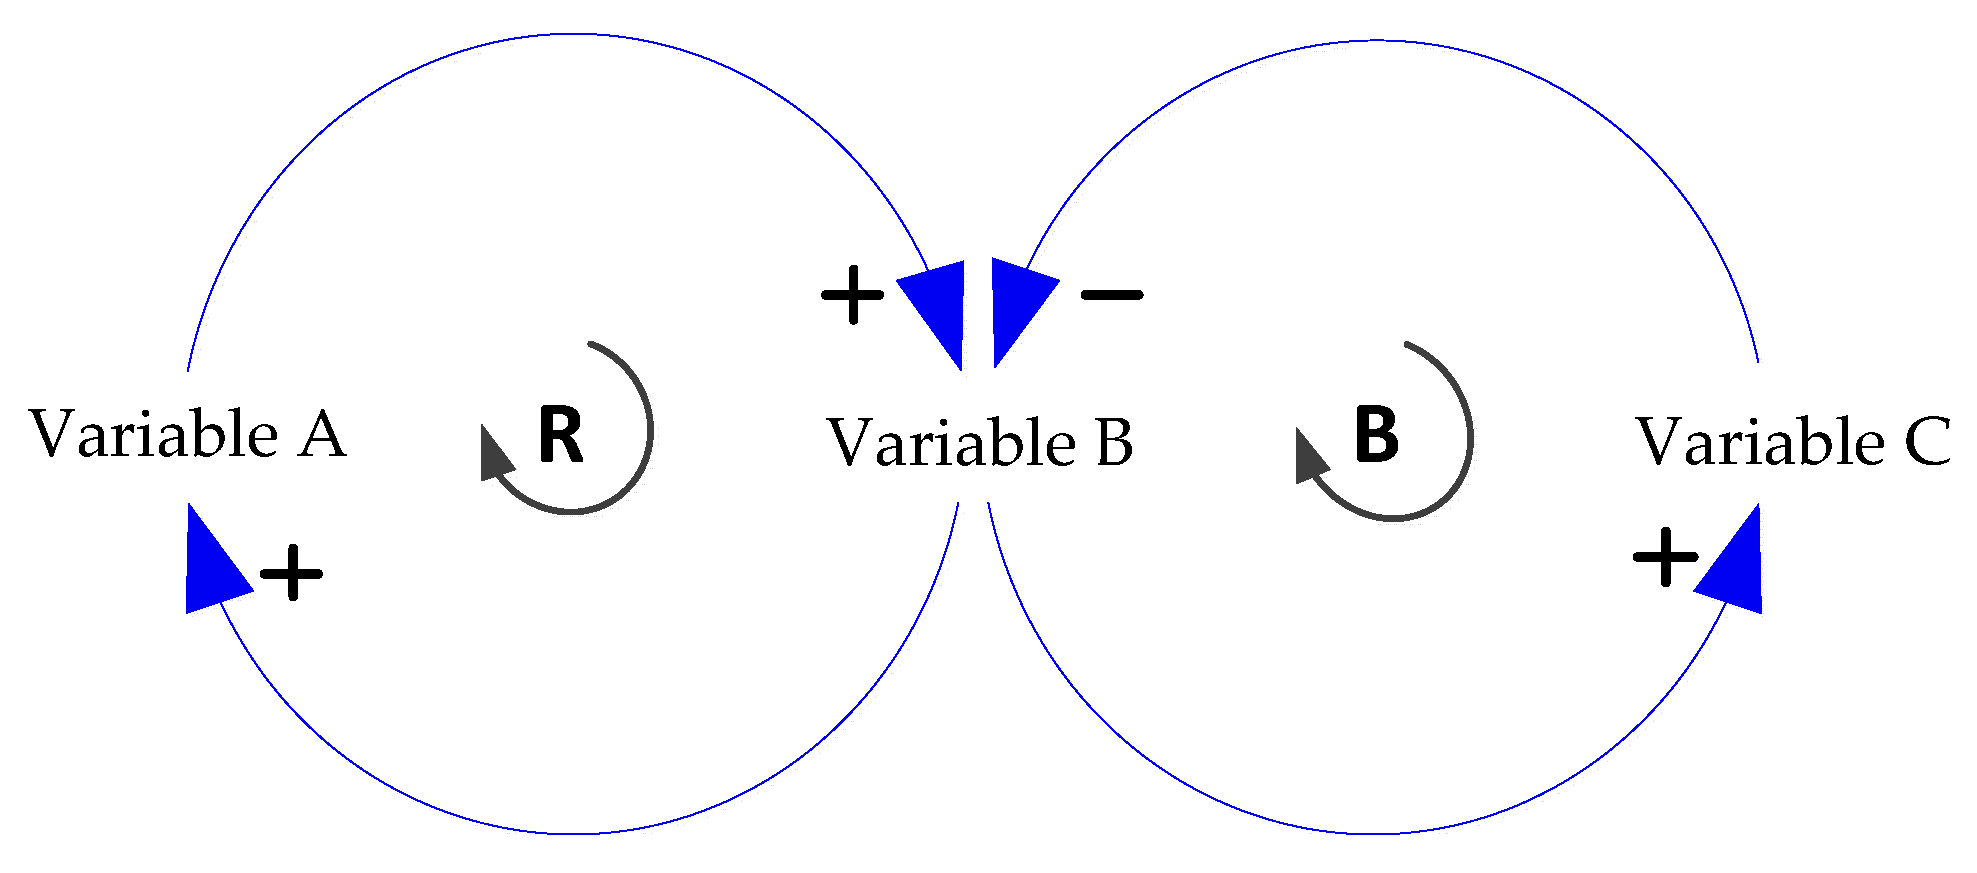
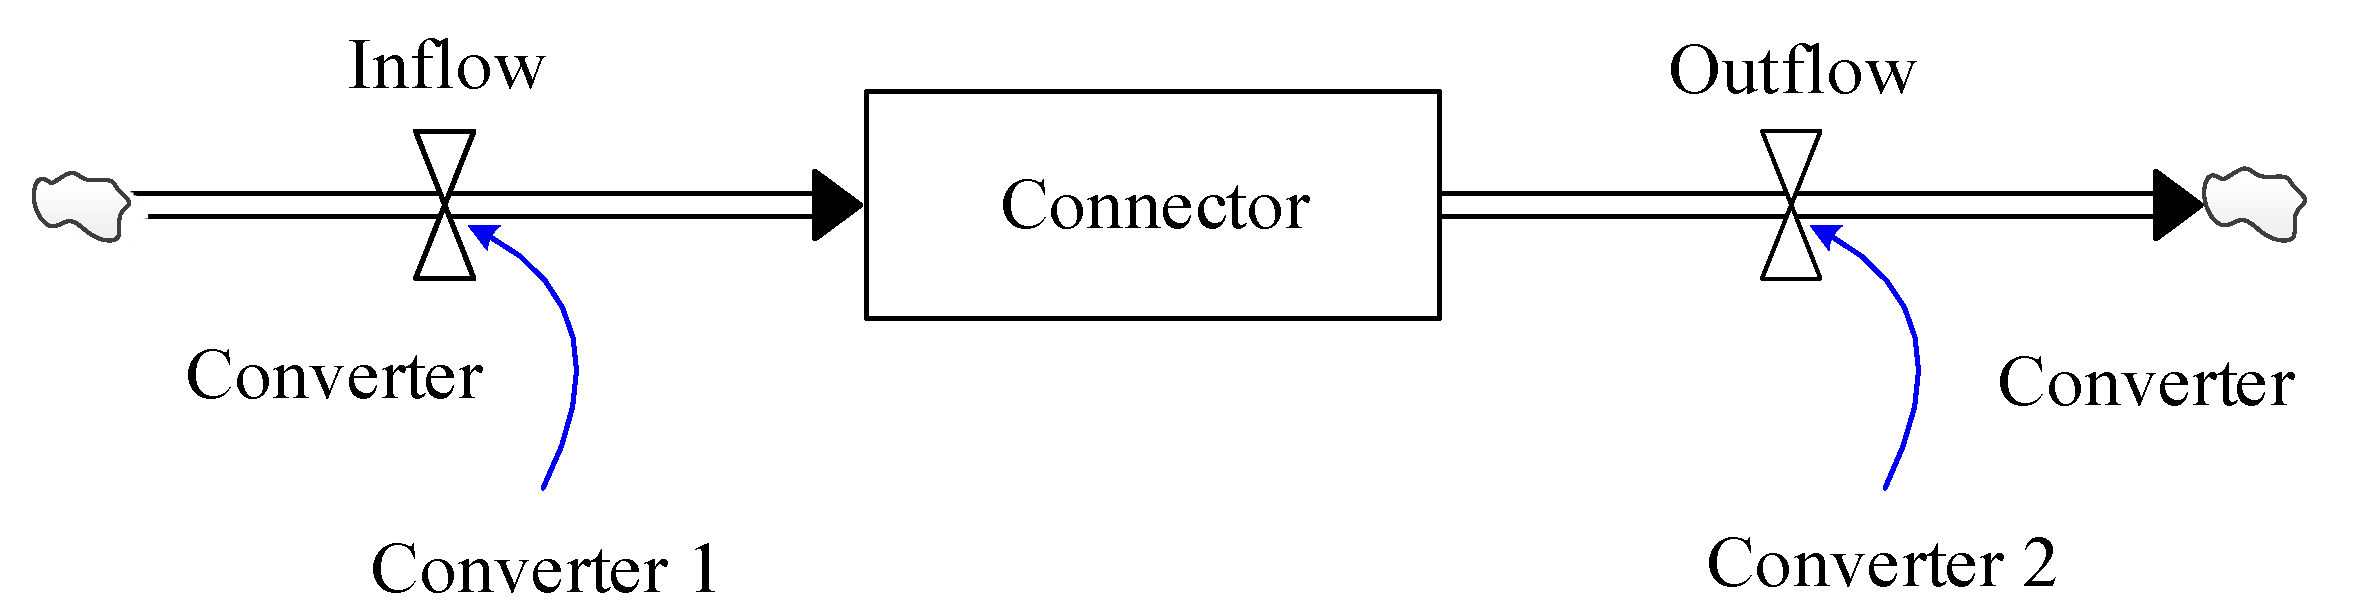
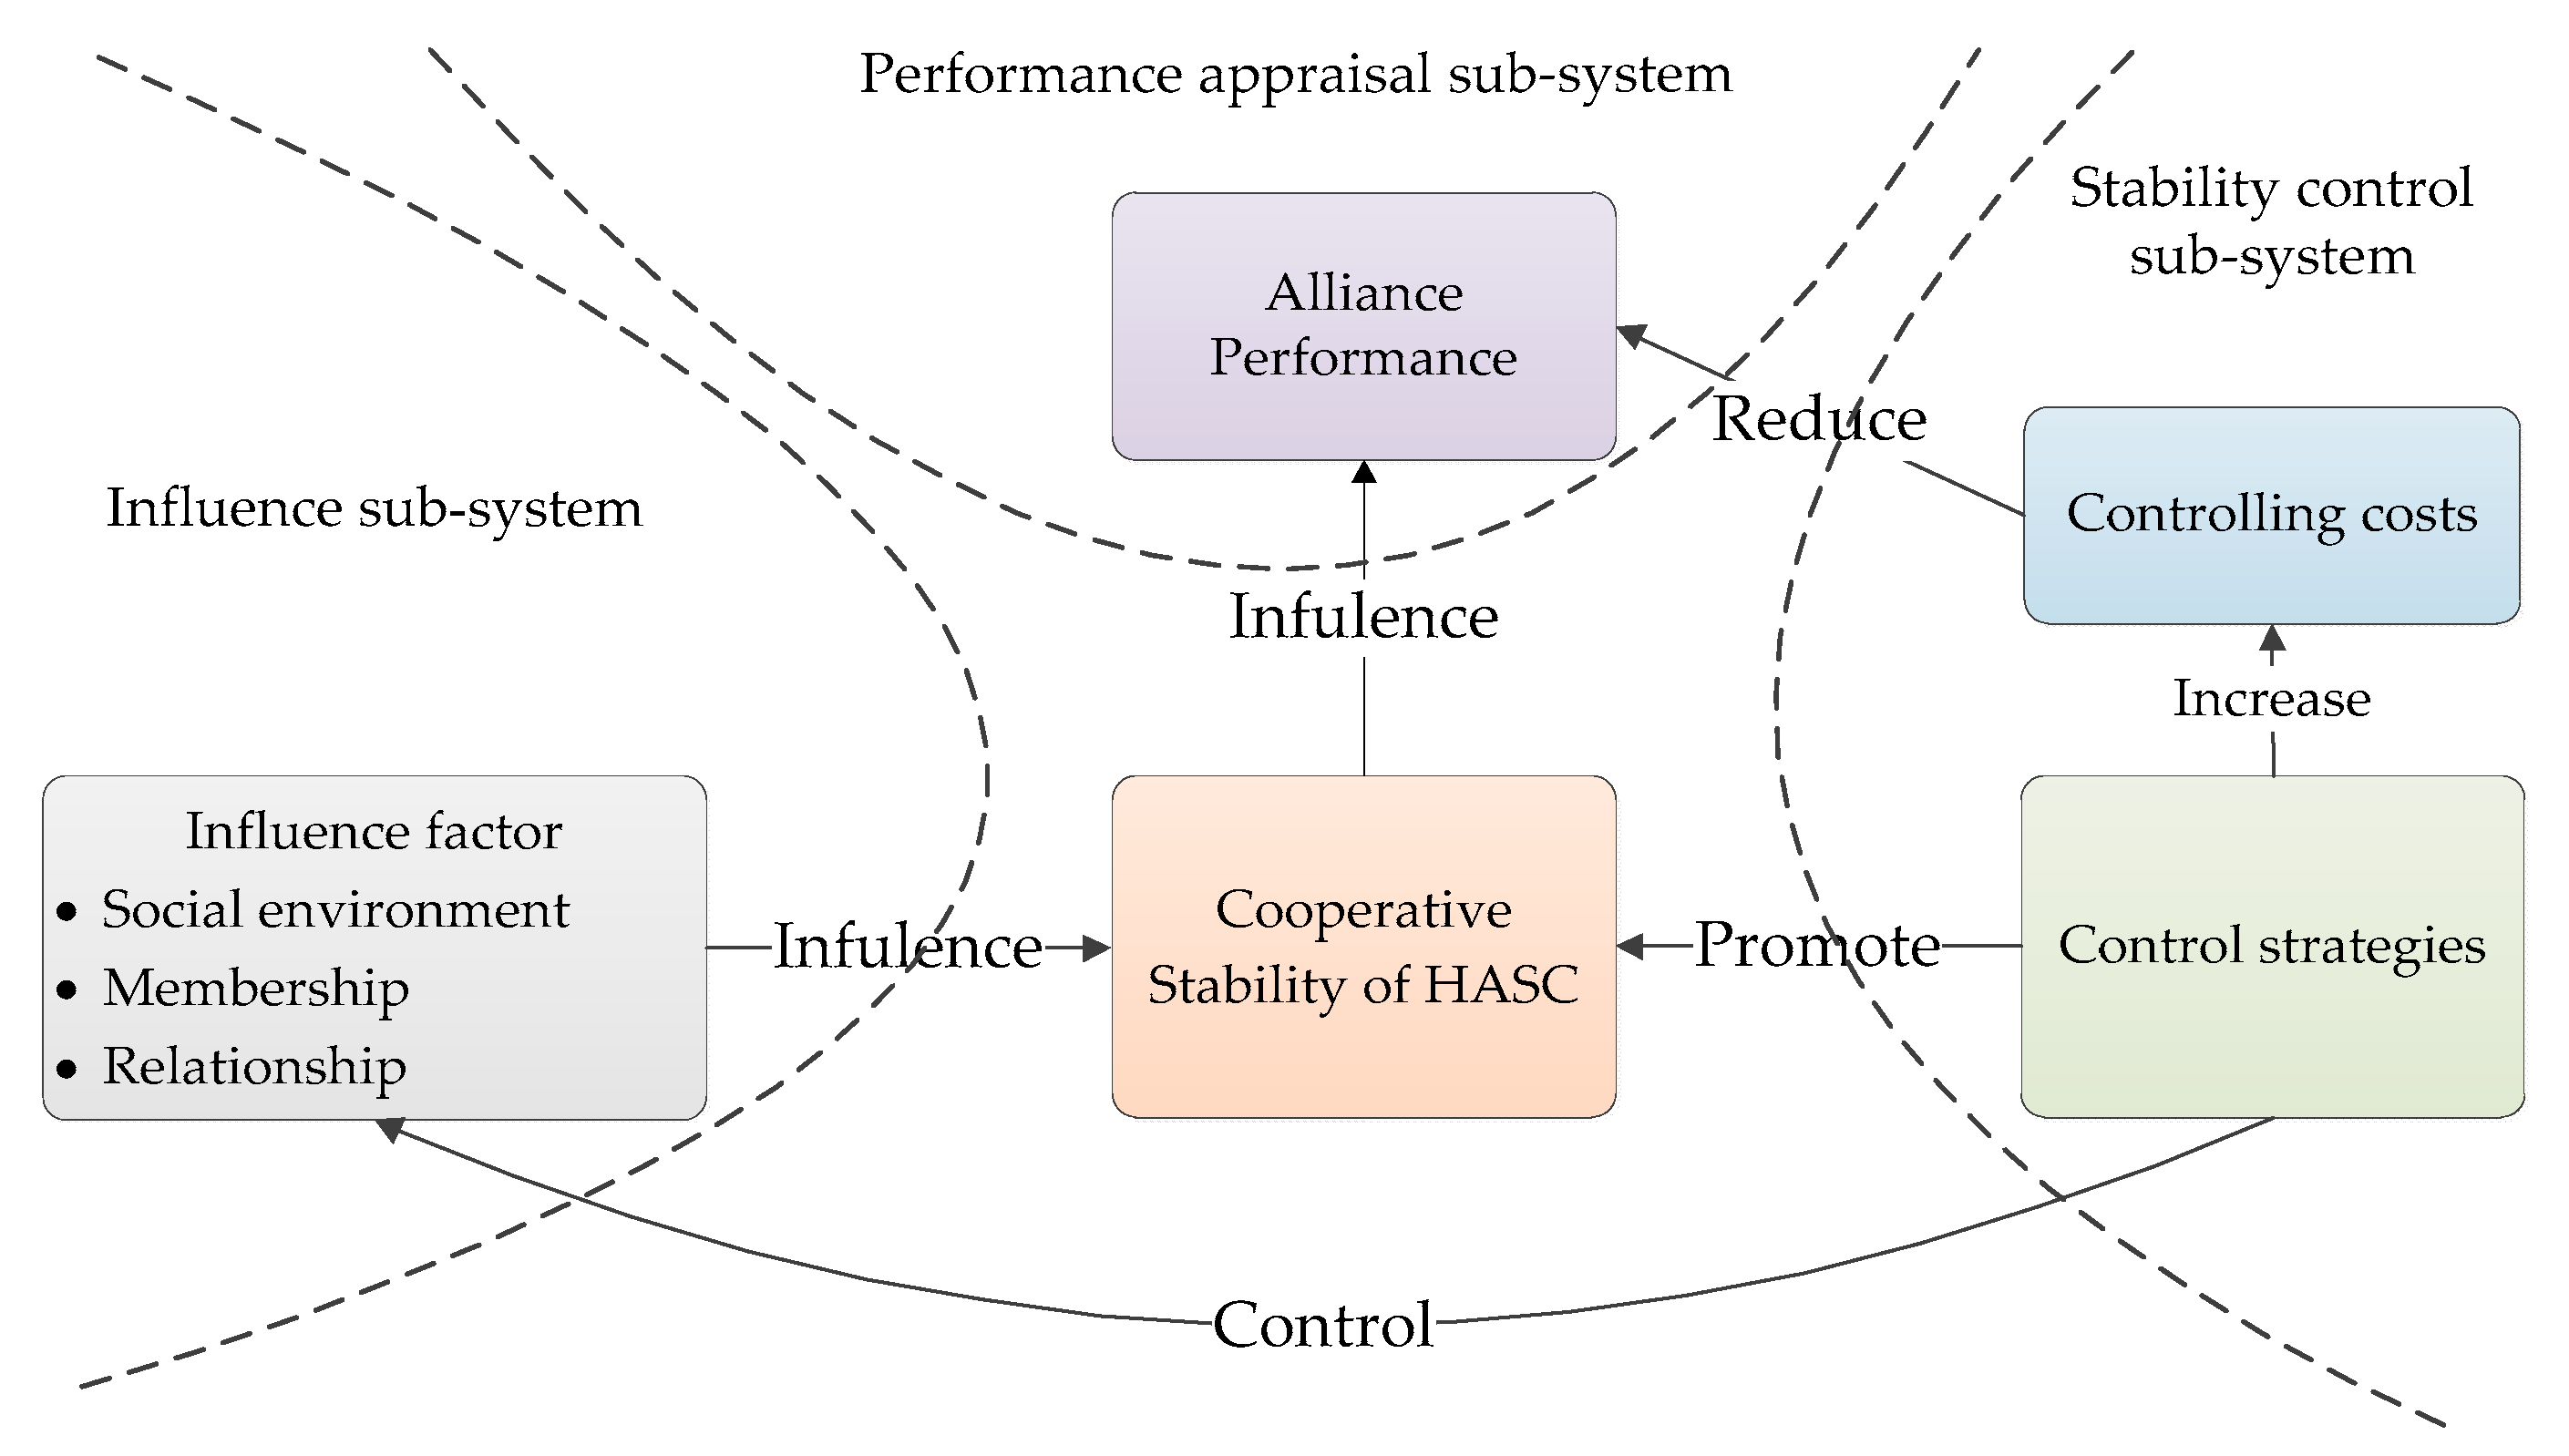
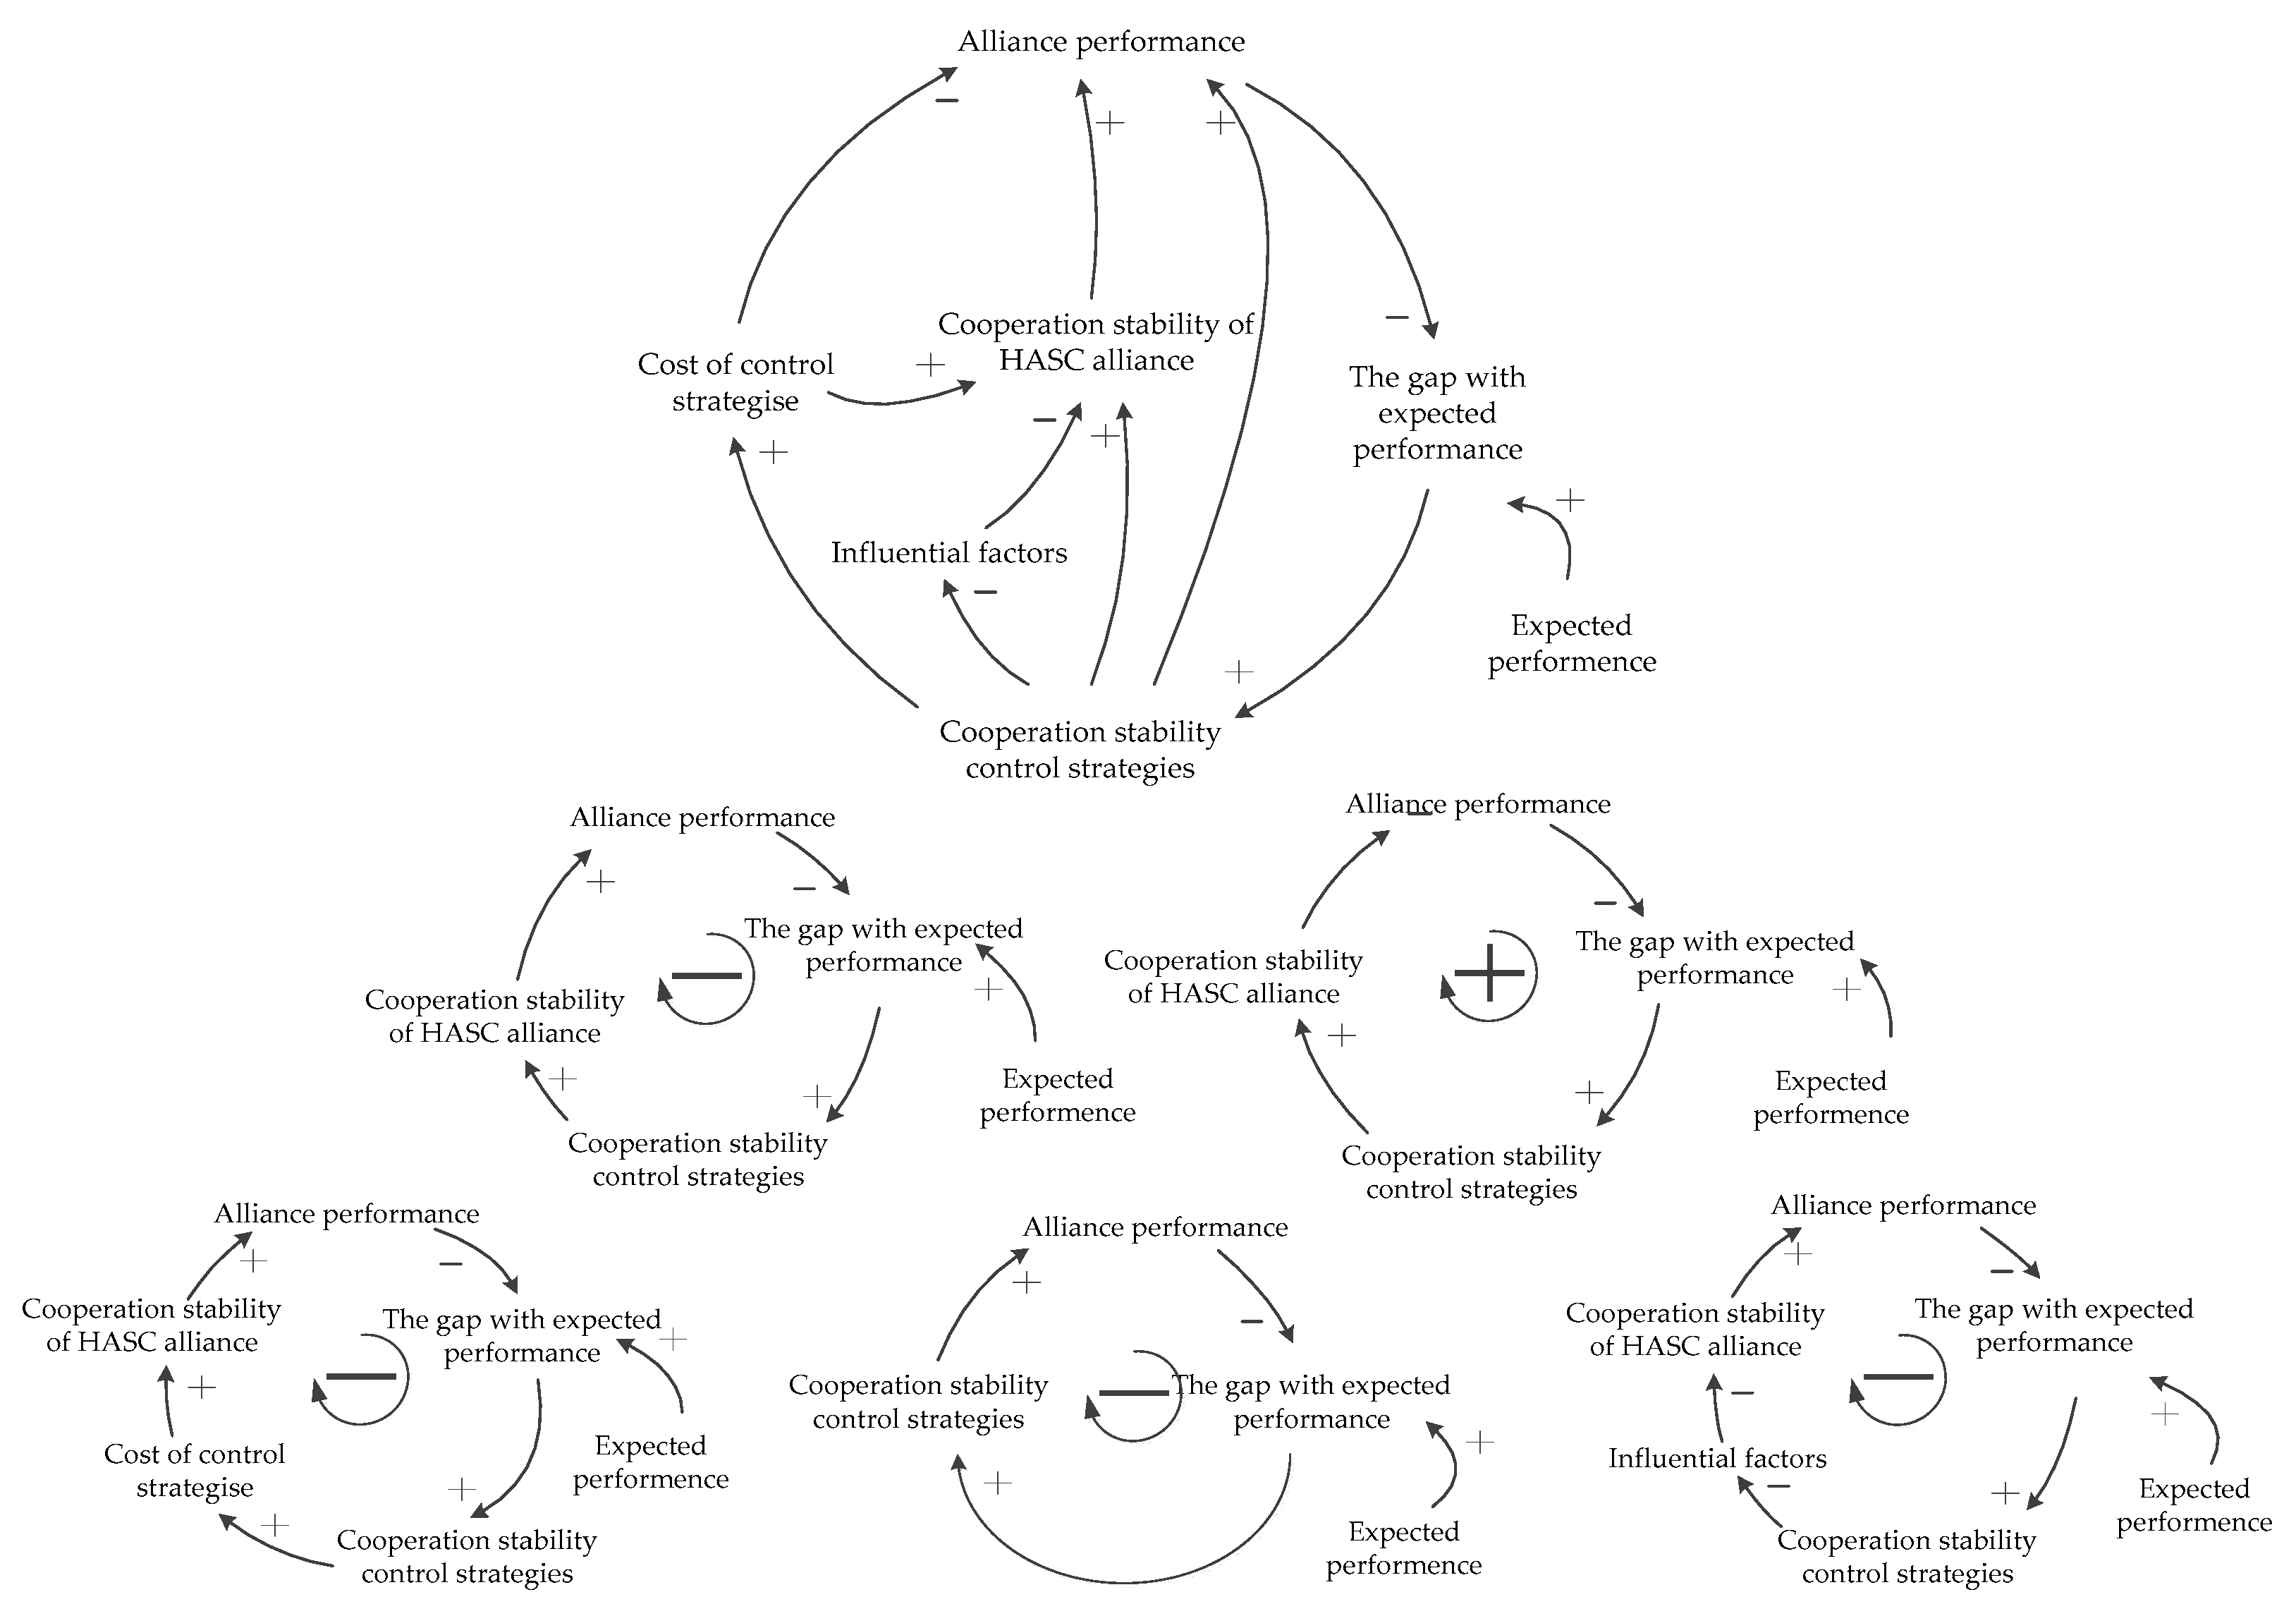
4.1. System Dynamics Model

System dynamics (SD) is an influential technique developed to dynamically describe, model, simulate, and analyze the behavior of a variety of complex systems [109]. SD is a top-down information feedback method that was proposed by Professor Forrester [110]. The essence of this method is the high order, multiloop, and nonlinear feedback structures.
Typically, SD models are interpreted through diagramming tools, such as causal loop diagrams (CLDs) and stock-flow diagrams (SFDs) [111]. CLDs are able to map how the system is dynamically influenced by the interactions of all the variables. A CLD links system variable by arrows. These arrows denote the direction of influences among the variables. Each causal link is assigned a polarity, either positive (+) or negative (–), to indicate how the dependent variables are influenced by the independent variables—positive for direct and negative for an inverse influence. An illustrative CLD is depicted in Figure 8. The CLDs can successfully describe the basic logical structures; however, to conduct a quantitative analysis, a mathematical stock and flow diagram (SFD) should be employed. SFDs can distinguish the nature of different variables and use integral or differential equations to represent the described information. As shown in Figure 9, four building blocks are used to develop a quantitative SFD from a qualitative CLD: stock, flow, converter, and connector [112]. Stocks create delays by accumulating the difference between the inflow and the outflow. By decoupling the rates of flow, stocks are the source of disequilibrium dynamics. Flows are the functions of the stock and other state variables and parameters [111]. The value of a flow can be positive or negative. A positive flow is an inflow that will fill in the stock, while a negative flow is an outflow draining from the stock. A convertor has a utilitarian role in selecting the proper values and functions of the parameters in the model, and a connector is an information transmitter connecting elements [113]. The study selected the SD approach as a base to simulate the cooperation stability of the proposed alliance, as it has several merits over other modeling approaches.

4.1.1. Model Development

This study divided the cooperation stability system of the HASC alliance into three subsystems, influence, performance appraisal, and stability control, to more deeply investigate and design the cooperation stability. As shown in Figure 10, there are several factors (influence subsystem) that affect (positively and negatively) the cooperation stability at the alliance establishment and operation stage. This effect results in fluctuations in cooperation stability that cause an unsatisfactory performance of the alliance. This deficient performance further forces the alliance to implement strict control strategies (stability control subsystem). However, the control process will affect the cost, which in turn impacts the performance of the alliance (performance appraisal subsystem). Therefore, the enforcement of control strategies must be set in an appropriate range to match the strength of the alliance. The three subsystems are explained in the following sections. The causal loop diagram of the HASC alliance is shown in Figure 11, which has been used to derive the detailed model, as explained in the next section.

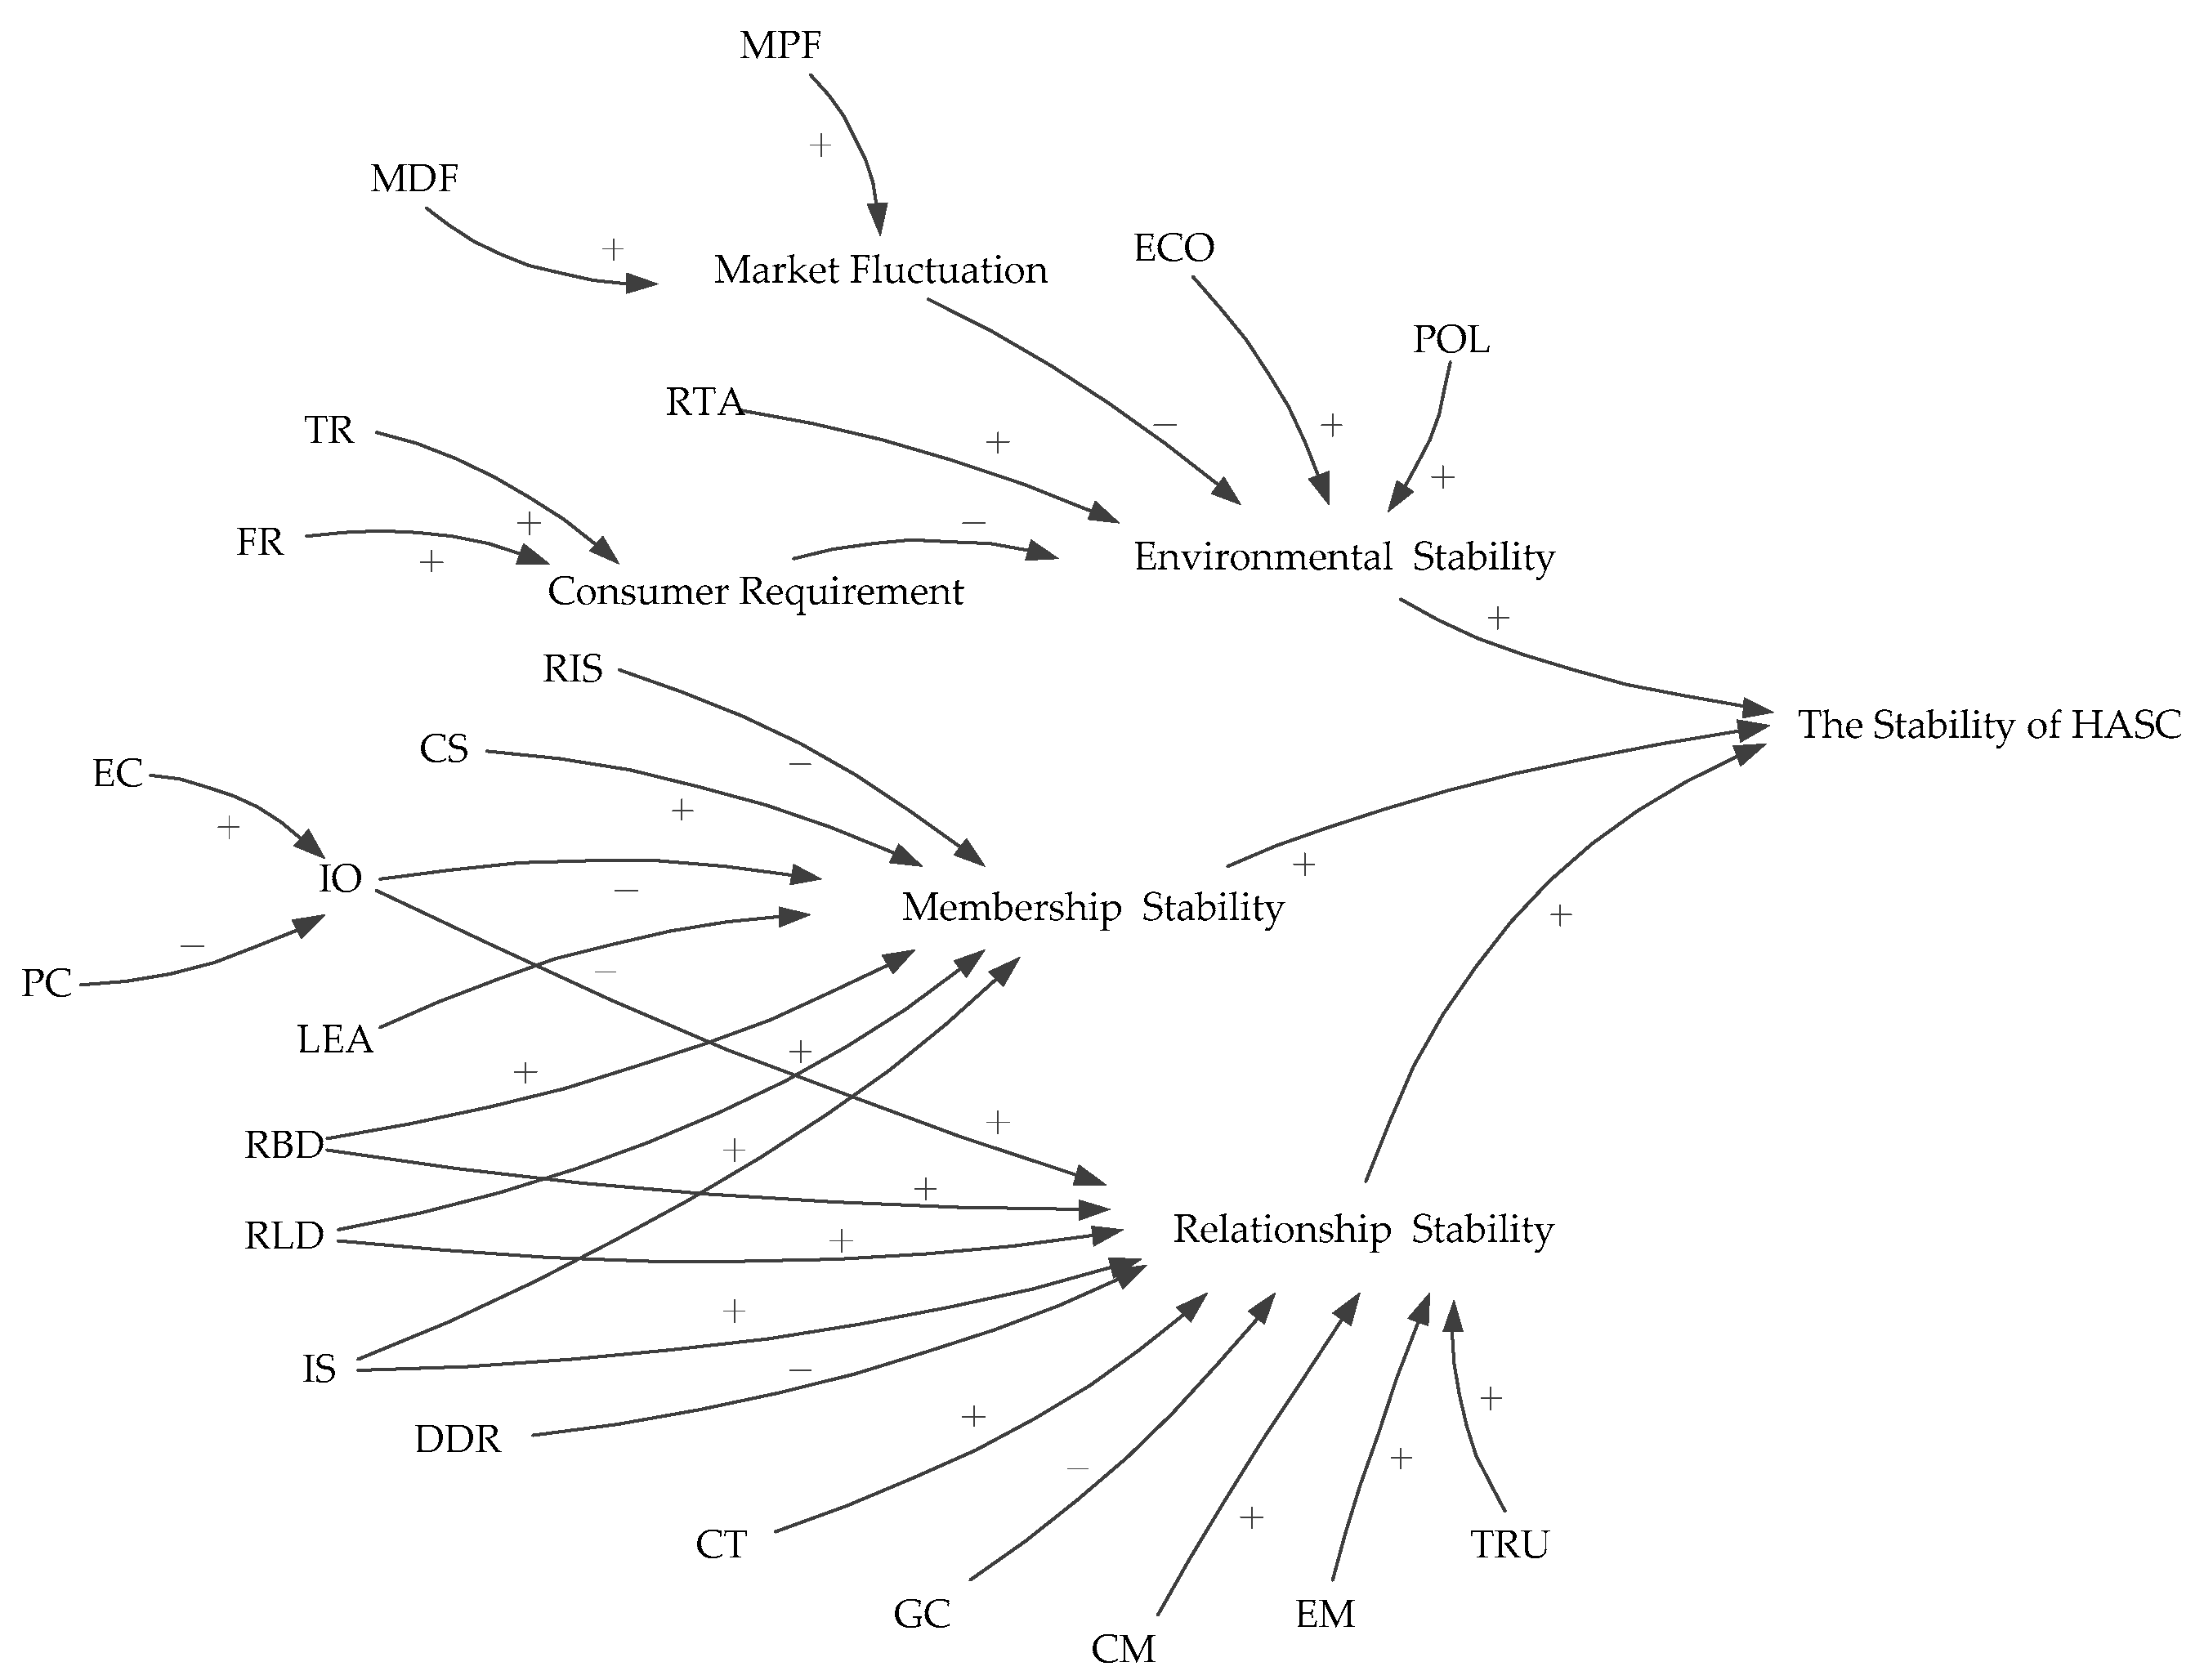
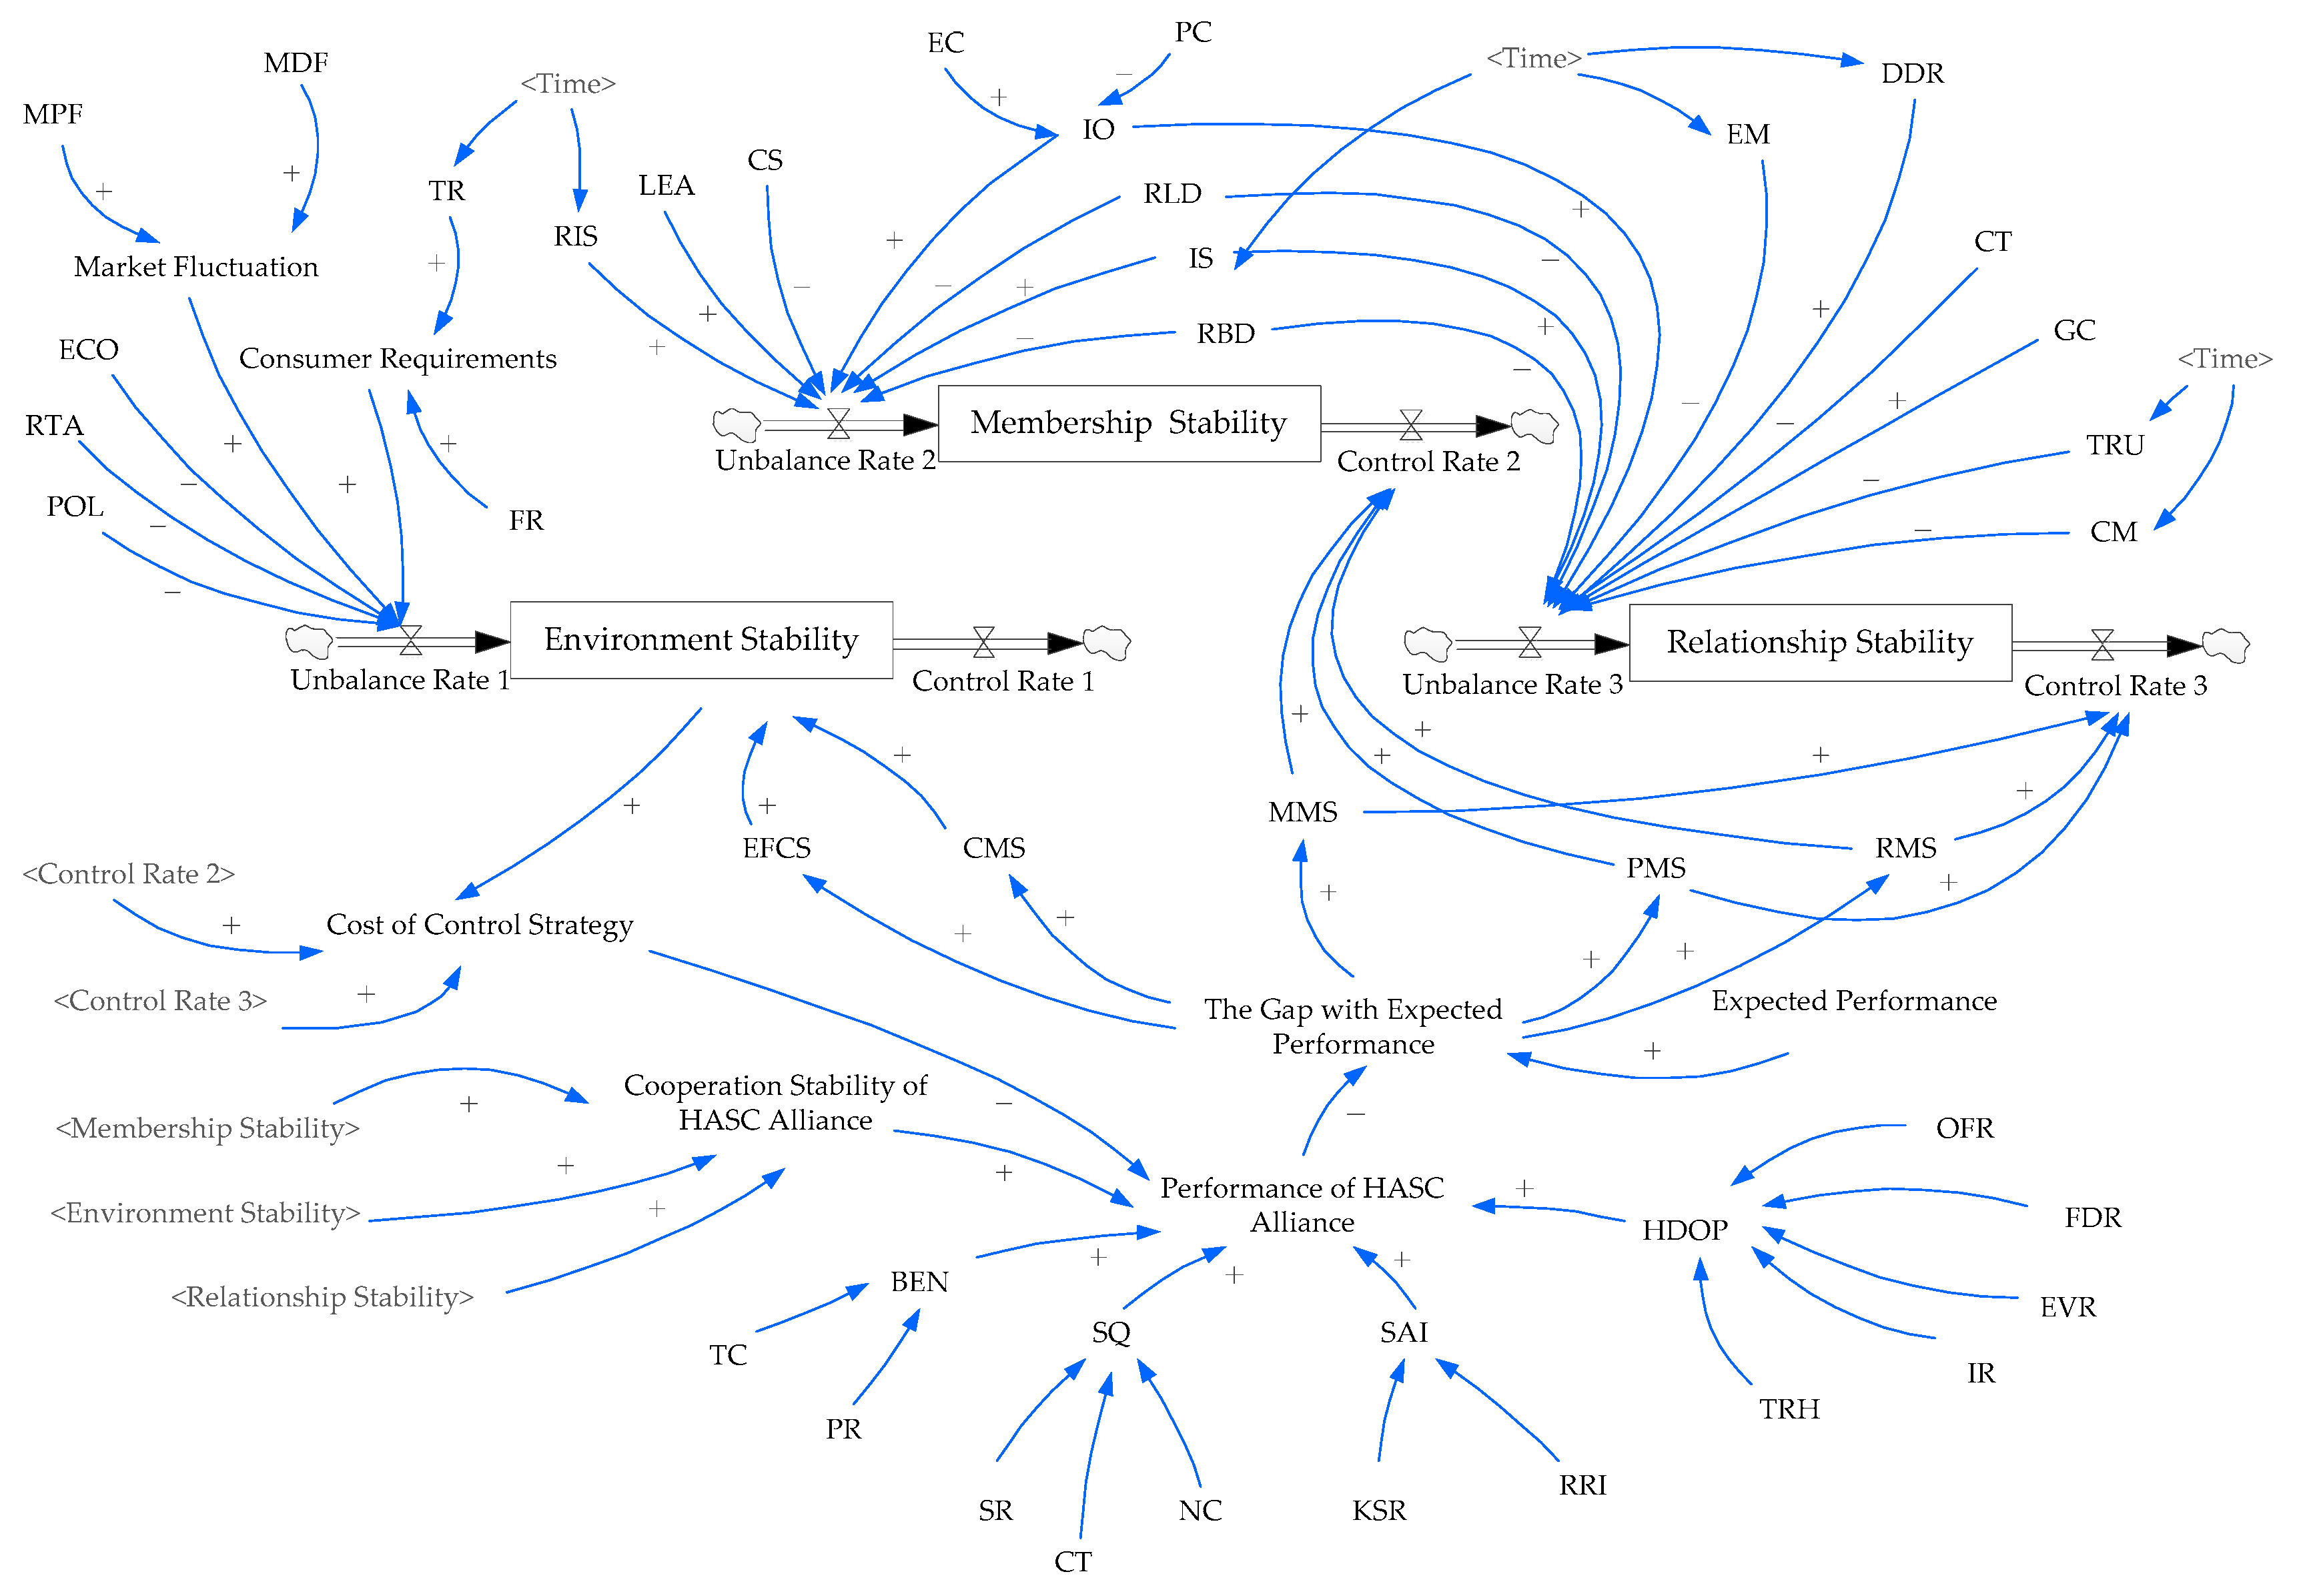
4.1.2. Influence Subsystem

There are many endogenous and exogenous factors that influence HASC alliance stability. This study divided these influencing factors into three main categories: environment, membership, and relationship.
  • Environment. Any change in the natural and social environment affects the cooperation stability of the alliance. The natural factors are those that are not intentionally created by humans but can directly or indirectly influence human life, such as natural disasters. Due to the difficulty in data collection, we did not consider natural factors in this paper. We considered the environmental factors that are related to human economic activity and society because these factors are closely related to the development of the HASC alliance and are thus deemed internal factors of the HASC cooperation system. Based on previous studies [114,115,116,117,118,119,120,121,122,123], we selected the following factors: public policy (POL), economic situation (ECO), market fluctuations, including market demand fluctuation (MDF) and market price fluctuation (MPF), regional traffic accessibility (RTA), and consumer requirement, including timeliness requirement (TR) and freshness requirement (FR).
  • Membership. Zineldin and Dodourova [124] found that cooperation motivation can significantly influence the stability of membership at the early stage of cooperation. Such motivation is associated with the resistance of internal staff (RIS), leadership (LEA), and capacity structure of the company (CS) [125,126]. Moreover, the design of the cooperation contract would also affect the stability of membership among the entities of the HASC alliance. The partners may be especially concerned about rationality and equity [75,127]. Therefore, the following factors were selected: rationality of labor distribution (RLD), rationality of benefit distribution (RBD), information symmetry (IS), and individual opportunism (IO). The study also considered the previous connection (PC) and expected cost for cooperation (EC), as they significantly influence individual opportunism.
  • Relationship. In an alliance, many relationships exist among different participant companies, divisions, and members with respect to information, finance, and other exchange levels [128]. The interface management approach has been put forward to analyze such complex relationships. Three principle interfaces, i.e., material interface, information interface, and management interface, were investigated [14]. According to the literature, delivery delay rate (DDR) is the most important factor that affects the stability of the material interface [129]; trust (TRU), coordinating mechanism (CM), and exchange mechanism (EM) are the main influencing factors of information interface stability [73,130]; cultural tolerance (CT) and goal congruence (GC) are the key factors of management interface stability [131,132,133]. Additionally, information symmetry (IS), rationality of labor distribution (RLD), rationality of benefit distribution (RBD), and individual opportunism (IO) all have a significant impact on the relationship stability.
In conclusion, a stable operating environment of the HASC alliance, a stable membership and a stable relationship among members jointly promote the stable development of an alliance. Figure 12 shows the influence subsystem.

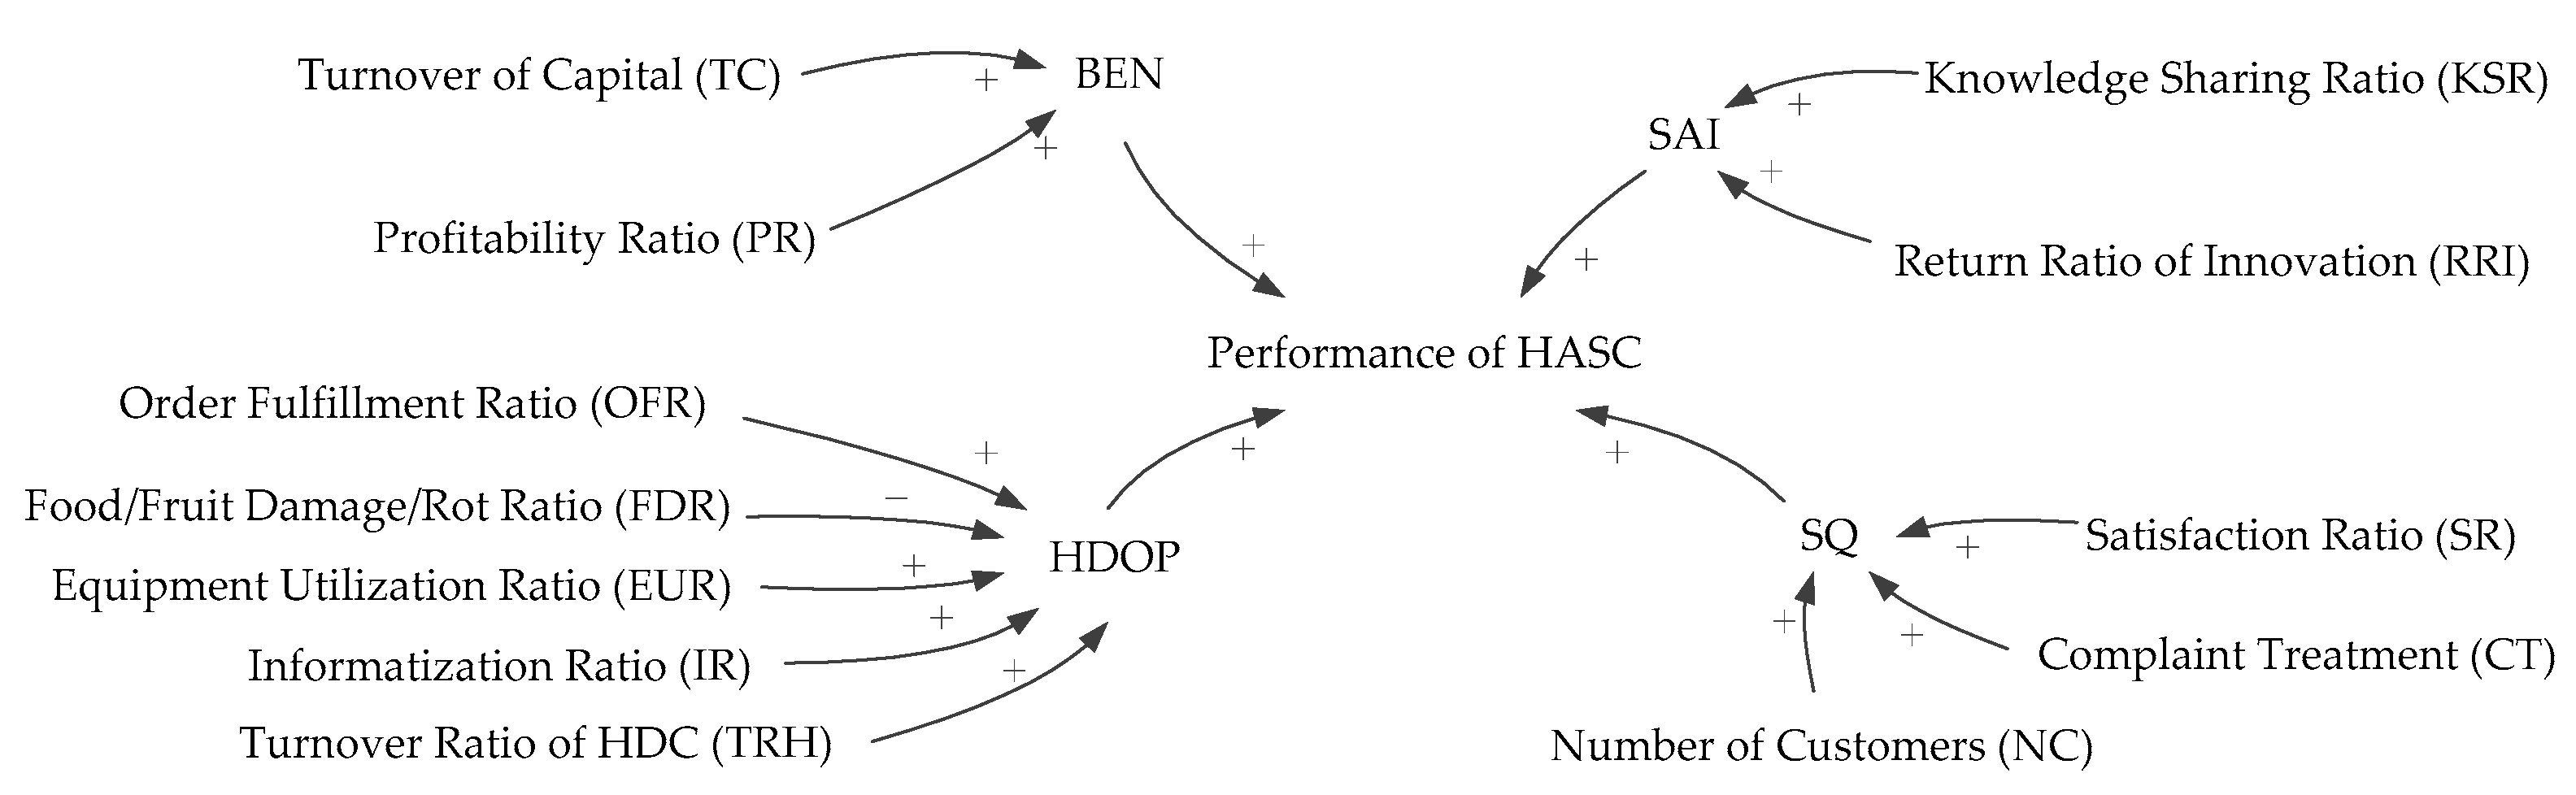
4.1.3. Performance Appraisal Subsystem

As a strategic alliance, the economic benefit is the most direct indicator to assess the performance and stability of the alliance [134]. Moreover, as a home-delivery-oriented supply chain, the operation efficiency and service quality decide the competitiveness, market size, and development of the alliance [135]. On the other hand, to follow the trend of social development, the new emerging industry must continuously research to promote the development of the alliance. Therefore, this paper selected benefit (BEN), home-delivery operation process (HDOP), service quality (SQ), study and innovation (SAI) [136,137,138,139,140,141] as four main indicators to build the performance appraisal subsystem of the HASC alliance (Figure 13).

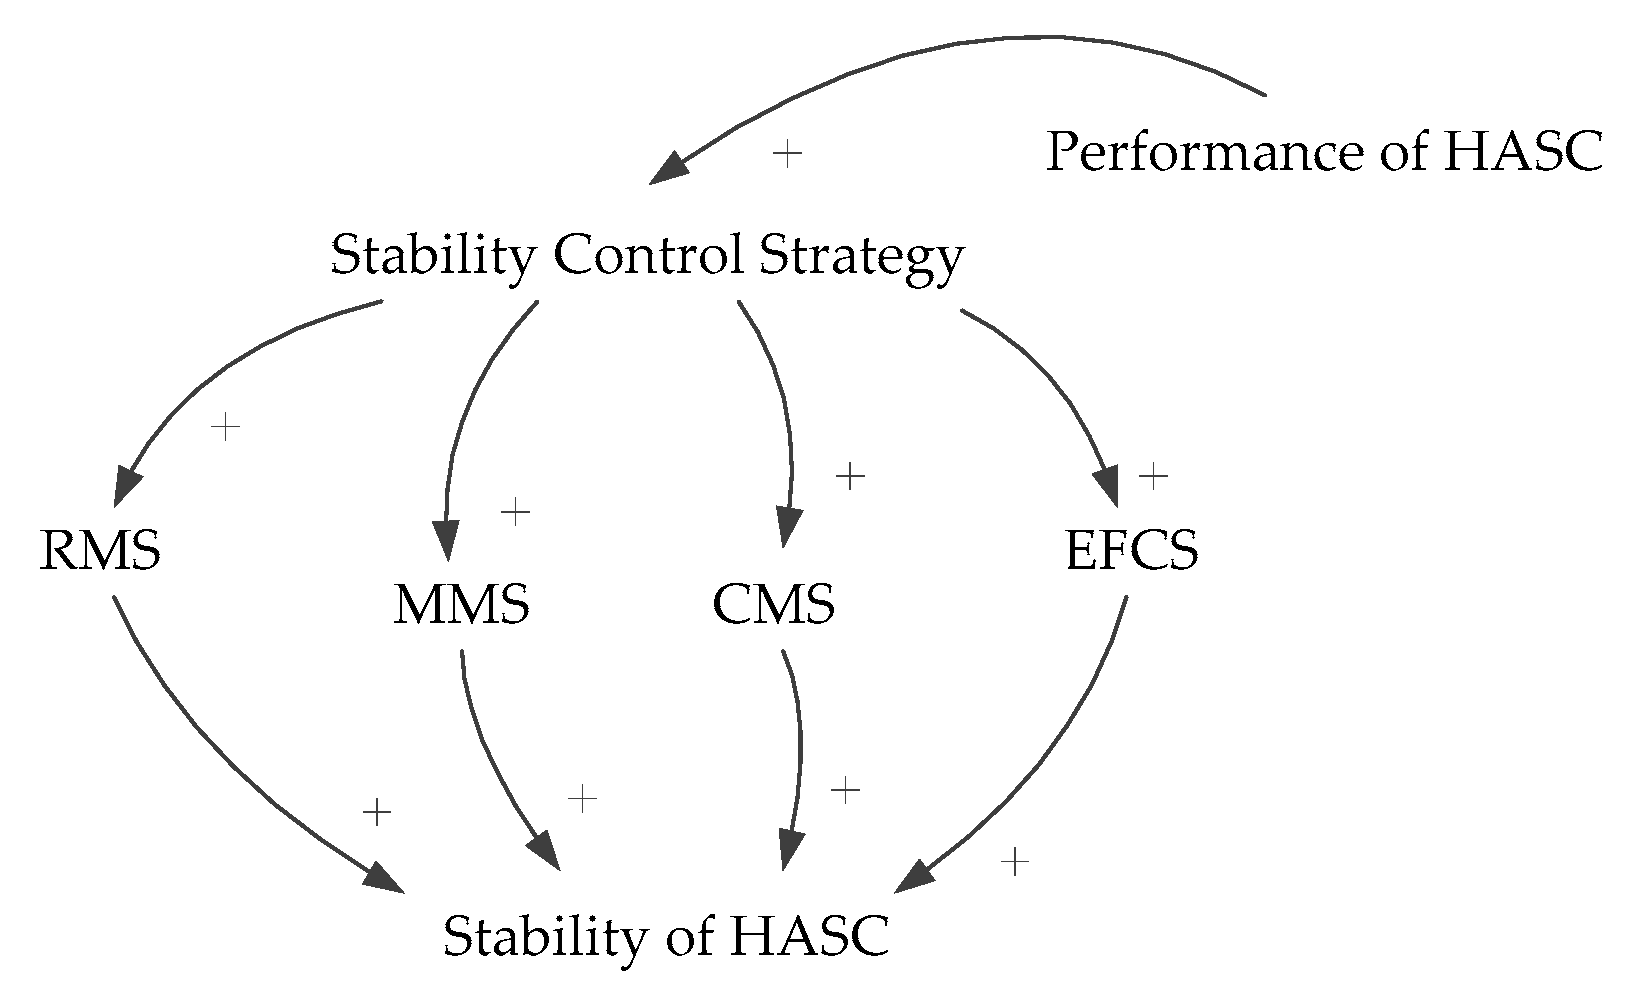
4.1.4. Stability Control Subsystem (Strategies)

Effective control measures (strategies) must be adopted to adjust the unbalance risk points through assessment and subsequent feedback on the performance of the HASC alliance. This paper mainly aimed to address three vulnerabilities of the HASC alliance and propose corresponding control strategies, including environmental fluctuation coping strategies (EFCS), customer management strategies (CMS), member management strategies (MMS), and relationship management strategies (RMS). The EFCS and CMS will prevent any fluctuation resulting from the market, social economy, policy, and other internal environmental factors. The MMS aim to control the stability of members via supervision and motivation. The RMS are used to enhance the communication and information exchange among members, thereby creating a trustful cooperation environment. The RMS help to monitor the condition of the alliance in real-time, enabling the alliance to locate loopholes by itself and take action to control them. Figure 14 shows the stability control subsystem.

4.1.5. Total System Model

A complete system dynamics model of the cooperation stability of the HASC alliance based on the above three subsystems is shown in Figure 15.
The dynamic behavior of the HASC cooperation system is implemented by a set of mathematical equations. The dynamic behavior of the level variables, including Environmental Stability (ES), Membership Stability (MS), and Relationship Stability (RS), is given by a time integral of the net inflows (Unbalance Rate (UR)) minus the net outflows (Control Rate (CR)):
E S t = E S t 0 0 t ( U R 2 t C R 2 t ) d t ,
M S t = M S t 0 0 t ( U R 2 t C R 2 t ) d t ,
R S t = R S t 0 0 t ( U R 3 t C R 3 t ) d t .
The details of each mathematical equation are included in Table A1, Appendix A.

4.2. Data Preparation

The data used in this study were collected from Kunming city, China. It is worth noting that before simulation, identifying the weight and initial values of each factor (explained in the model development section) was necessary. Therefore, to calibrate the initial values, the data were collected from 36 enterprises (food and logistic) through interviews (22 enterprises were interviewed face-to-face and the remaining through the online interview), and 298 local customers by questionnaire (a total of 310 questionnaires were sent, and 298 were validated after screening). Table 1 shows the characteristics of the investigated local costumers. Such data will help to understand the cooperation habits and customer demand for homestead services (distribution timeliness and food quality) that were mainly required in this study. The initial values of economic, traffic and other environmental factors were obtained from Yunnan Statistics Yearbook on the National Bureau of Statistics’ website (http://www.stats.gov.cn/). In the model, the factors in the performance subsystem are inserted to balance the whole system. According to the scale of other factors, we set the initial value of each factor in the performance appraisal subsystem as 0.8.
To obtain the weight value of each factor, this paper adopted the Delphi method, which is widely used in social science studies (see [142,143] for the overviews). The 22 factors (environmental, membership, and relationship factors) were rated by 58 experts (including 20 logistics specialists and 38 senior management of logistics and food enterprises) through the questionnaire, as shown in Appendix B. We used several questions (3–7) to capture experts’ attitudes on the importance of each variable (all the questions in the questionnaire are constructed as five-point Likert-type scales with responses ranging from strongly disagree to strongly agree) and then calculated the average score of each factor. Table A2, Appendix A, shows the weight value results for each factor.

4.3. Simulation Results

Vensim PLE software was used to simulate the evolution mechanism and trend of the cooperation stability using monthly units in the five years (60 months). To deeply understand the development of cooperation stability of alliance, the results were split into four sections for analysis: stability tendency of cooperation system, effectiveness analysis of control strategies, impact of change in factors on cooperation stability, and sensitivity analysis of the control strategies costs.

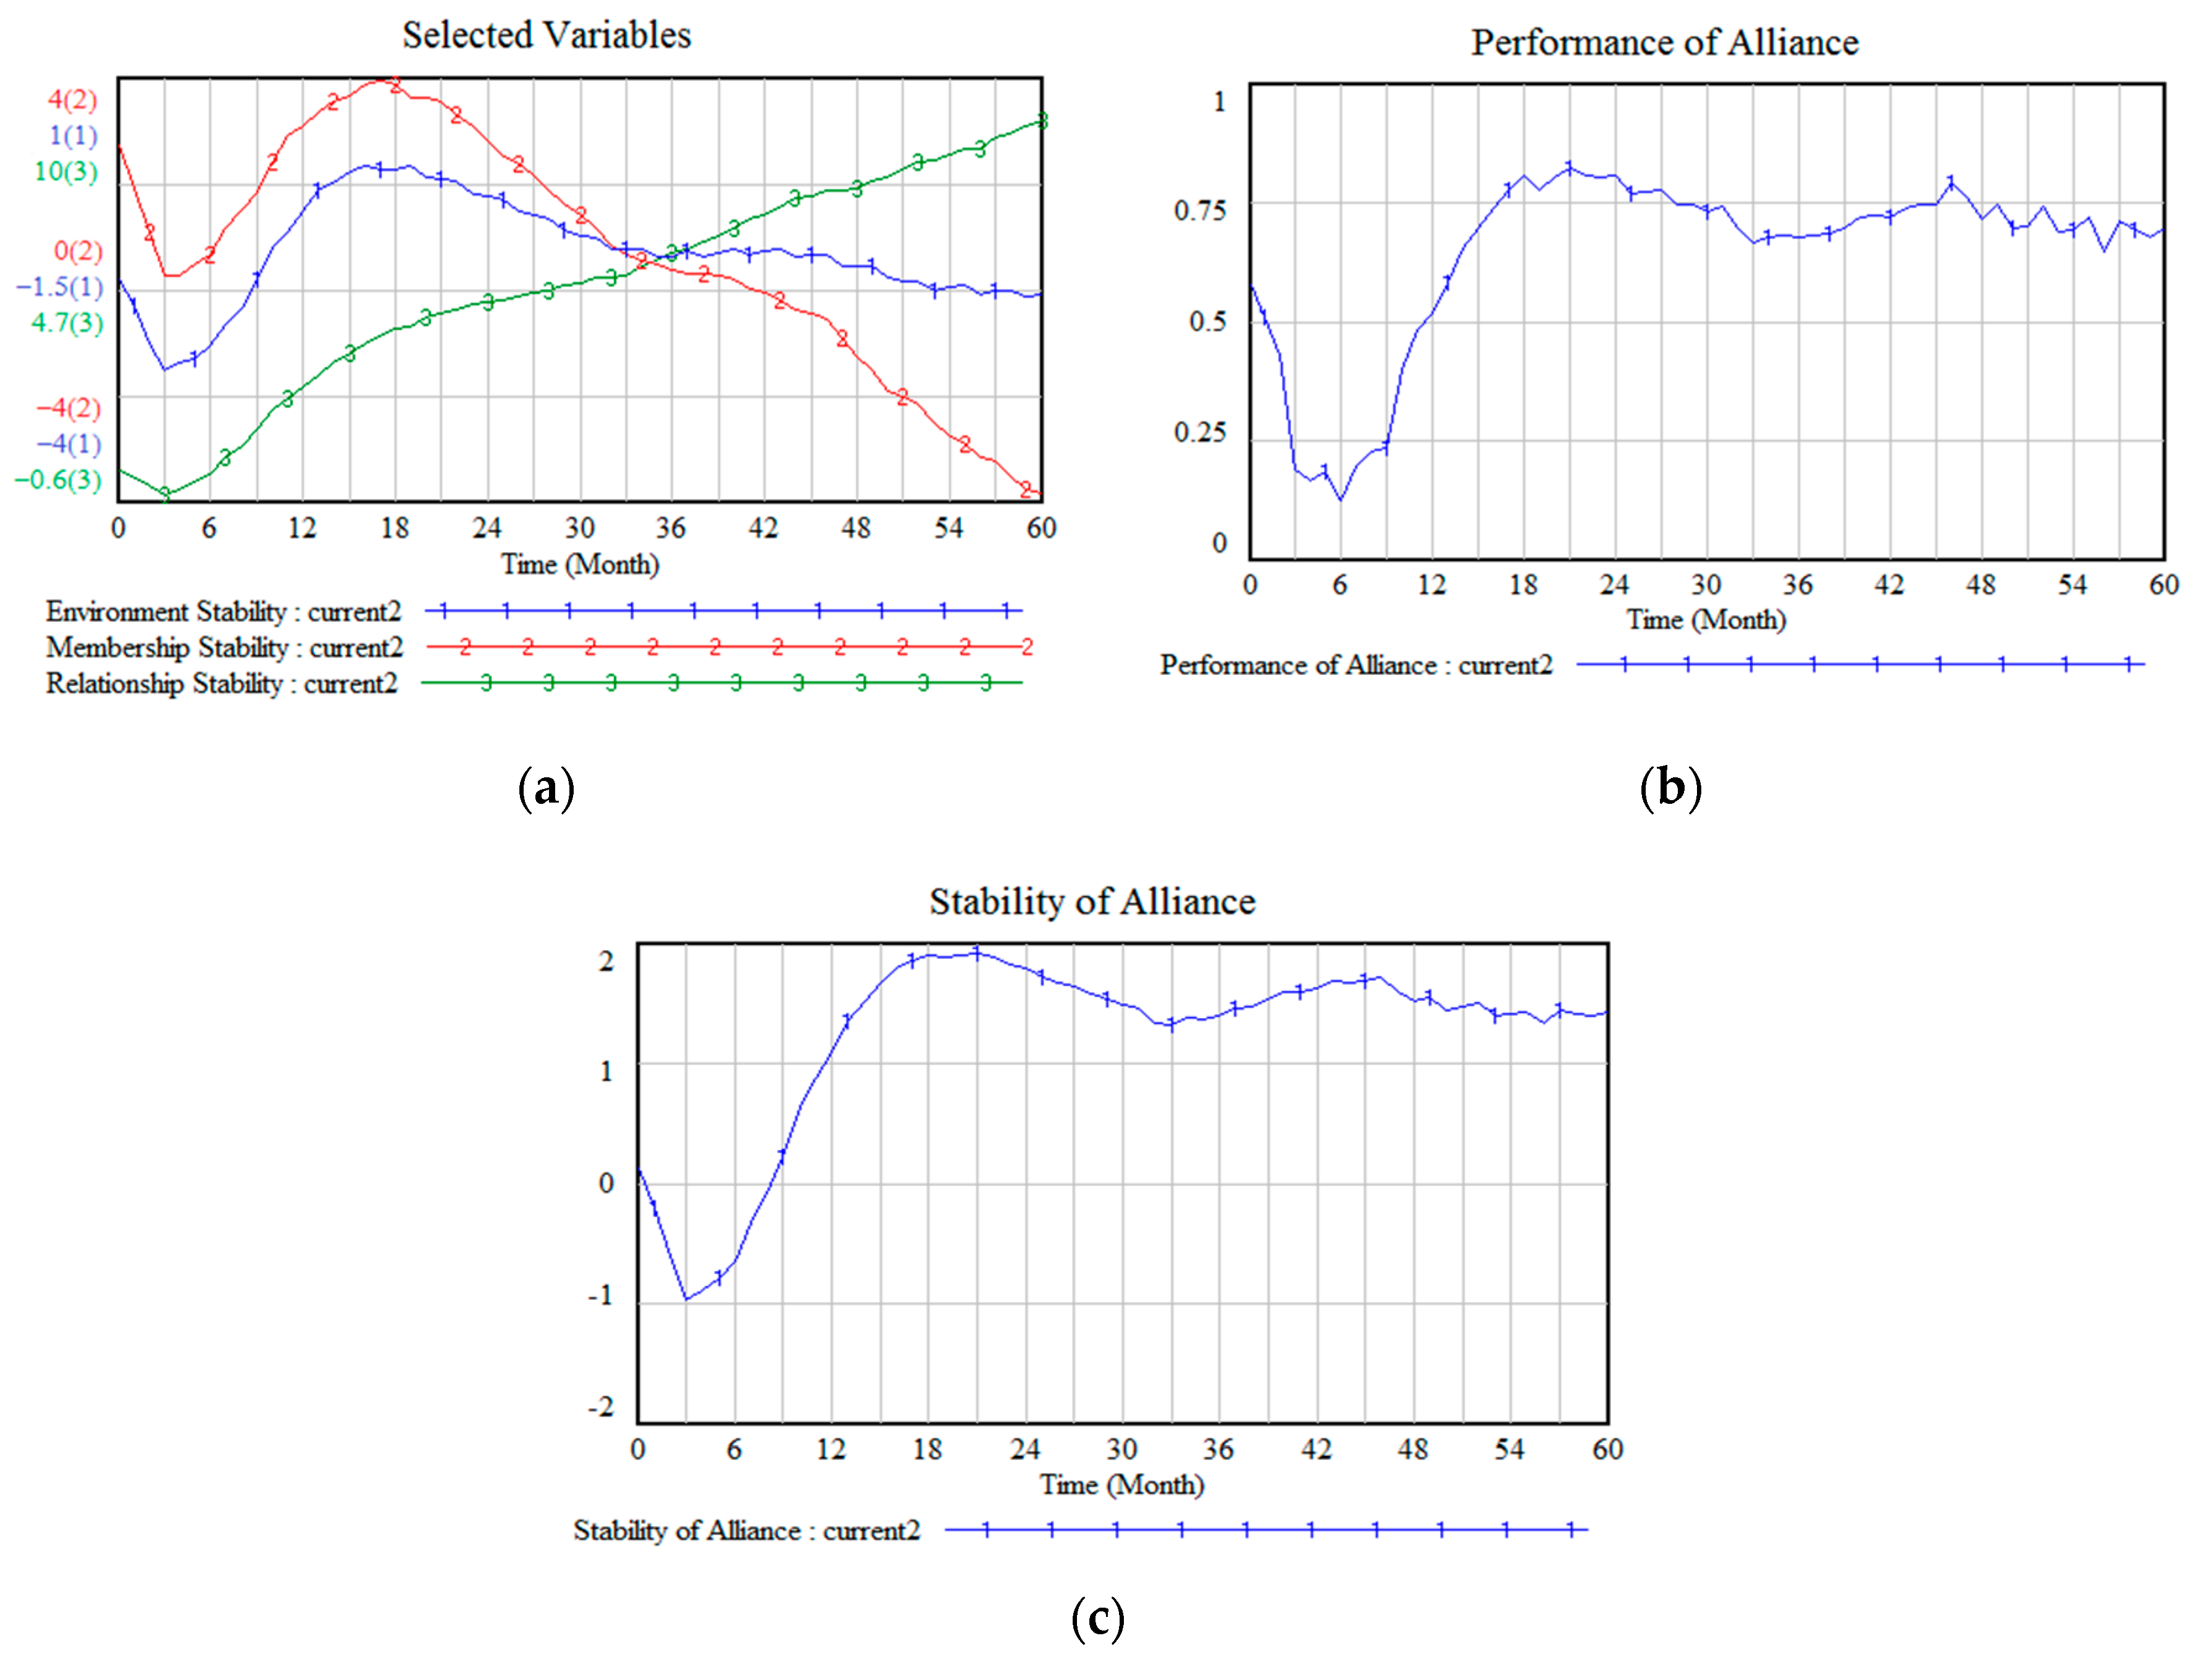
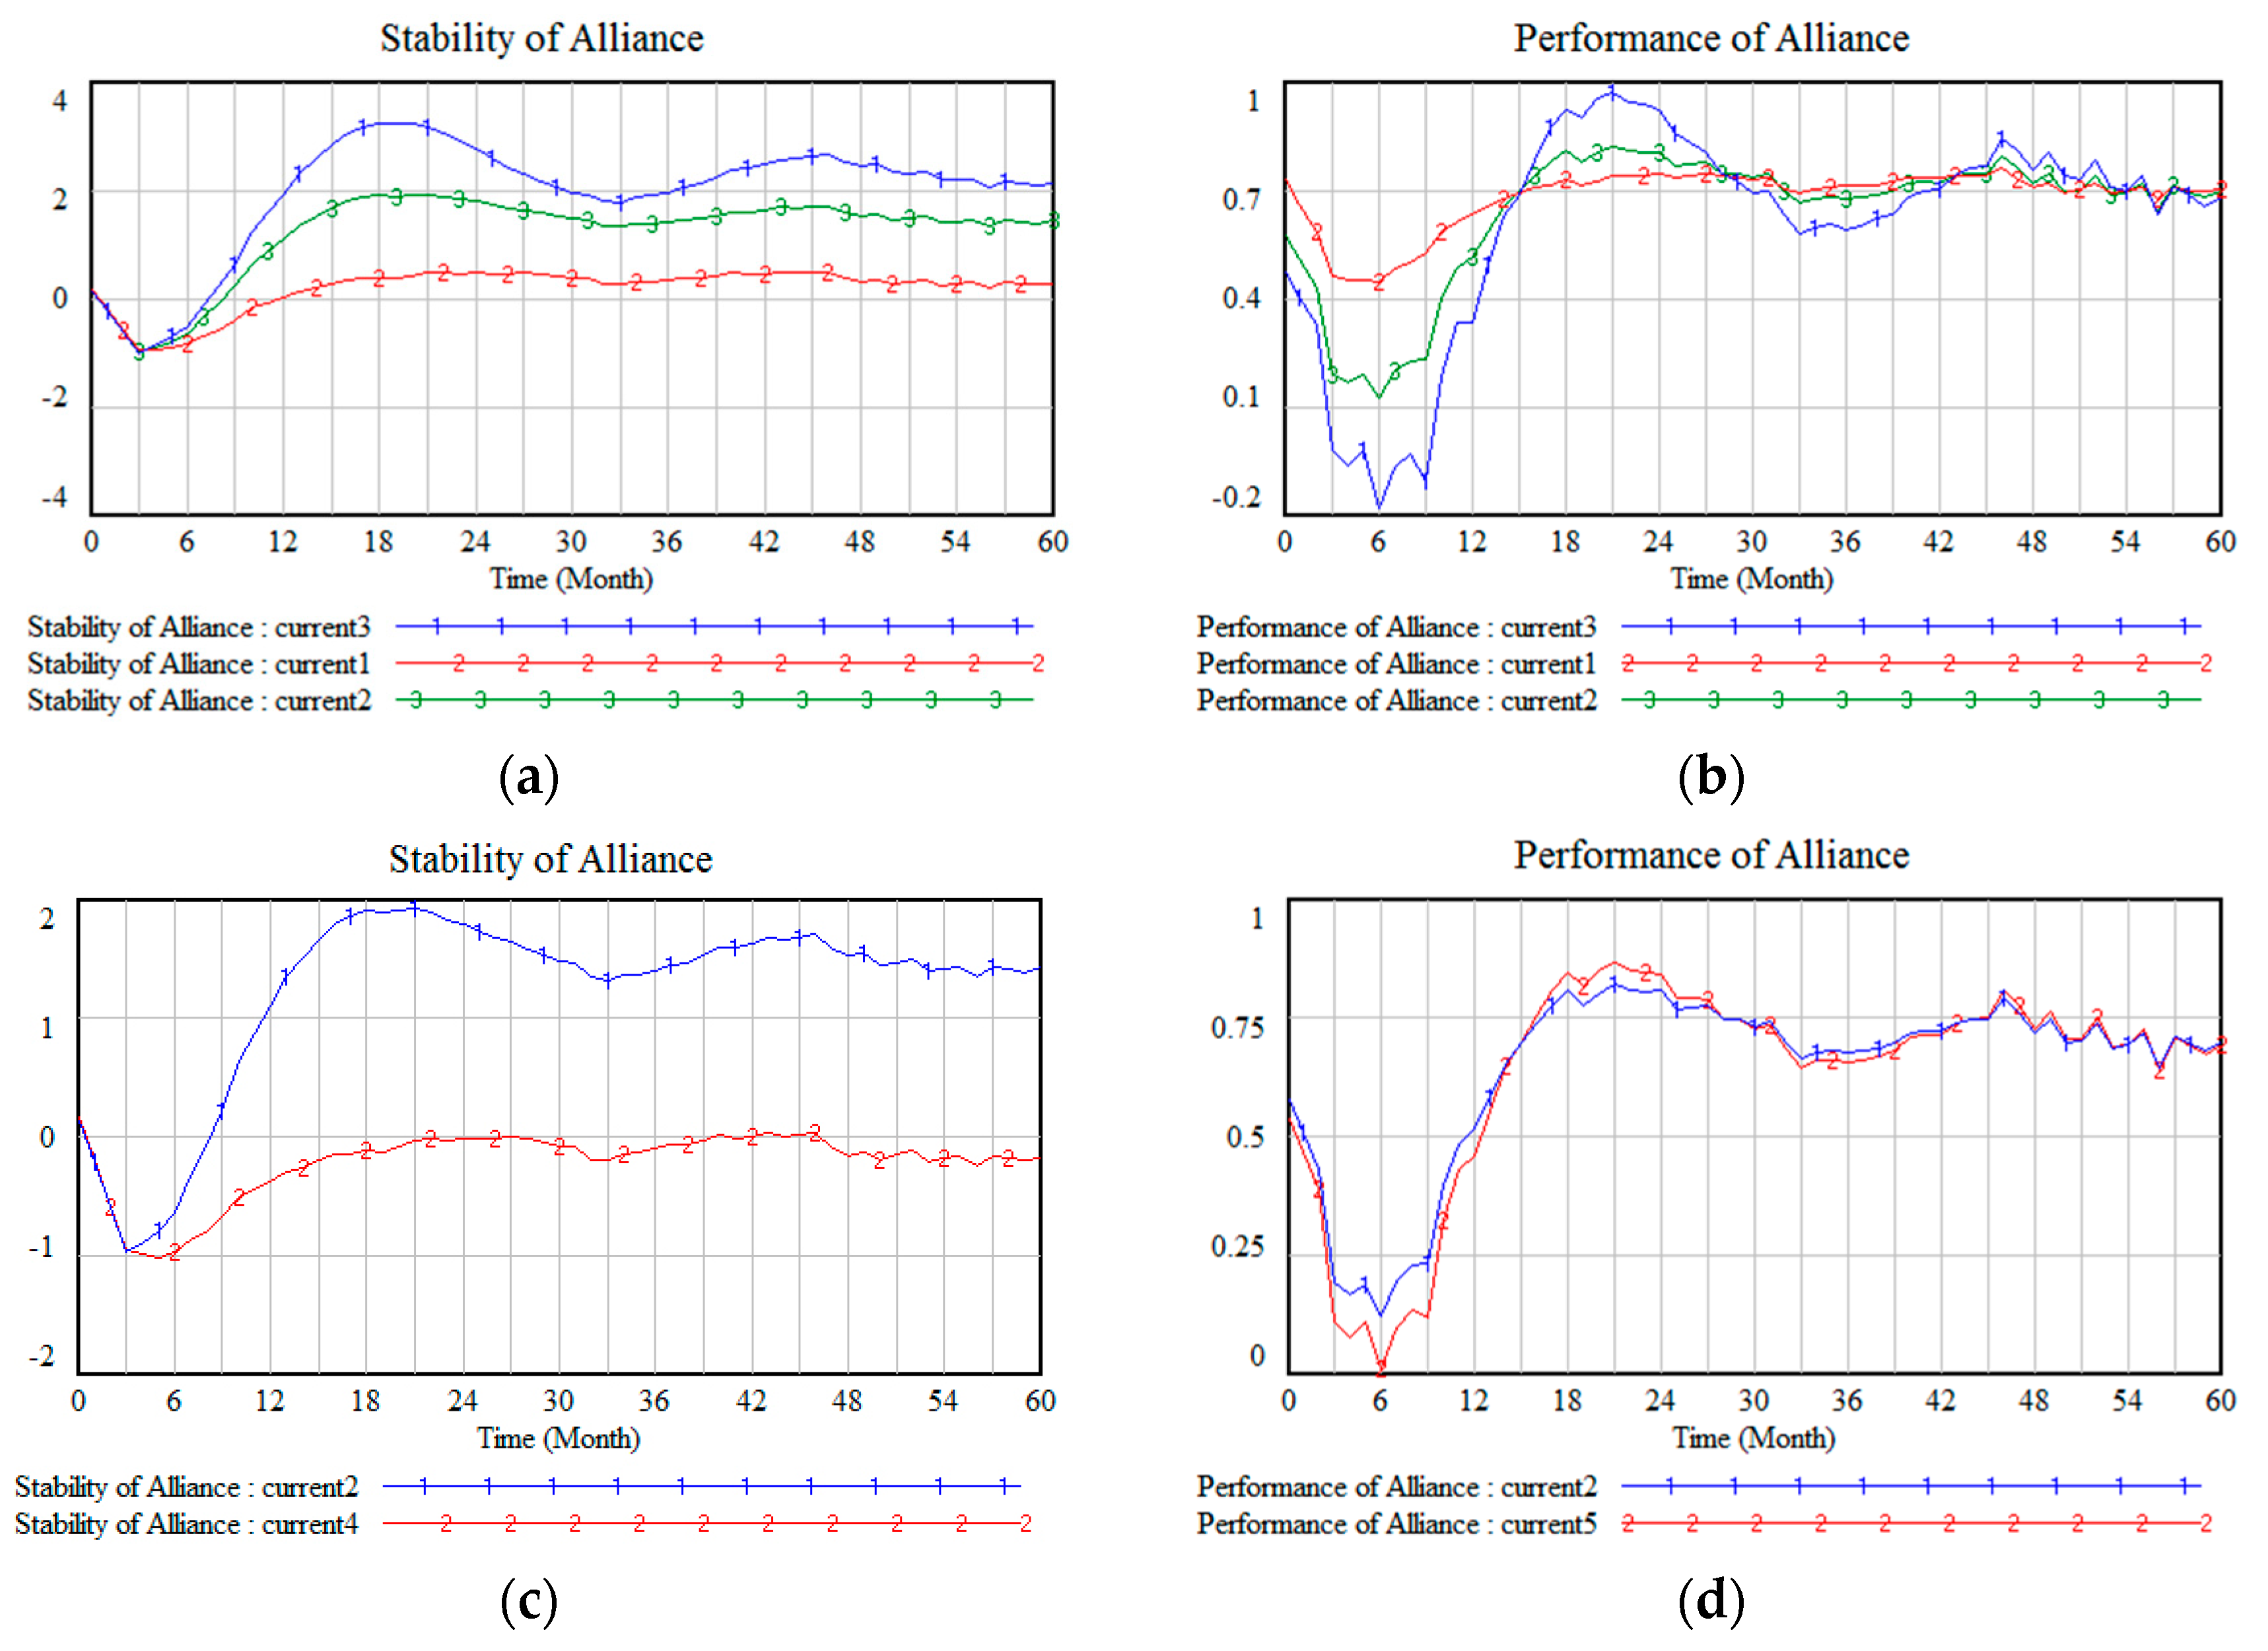
4.3.1. Stability Tendency of Cooperation System

Figure 16a shows the effect of each subsystem on cooperation stability. From the figure, one can observe that all the curves continue to decline during the early stage (first three months). The results in the abatement of the performance and cooperation stability of the entire system are shown in Figure 16b,c. Eventually, with the implementation of control strategies, the negative trend can be controlled, and all the curves continue to rise gradually. Consequently, the performance and cooperation stability curves also rise. The relationship stability curve shows a continuous upward trend during the whole cycle, but the stability curves of membership and environment continue to rise only until the 18th month and then start to decline. An important fact that should be noted here is that the membership stability curve declines relatively more obviously, even falling to a negative value in the 42nd month (3rd year). The declines in the stability of these two subsystems incur a slight reduction in the stability and performance of the alliance. However, the stability control strategies keep the fluctuations of the system in a small range over the succeeding months.
The abatement of the stability of alliance in the early stage is due to the running-in process between the members and because of the adaptation process of the alliance system to its internal environment, including the customer, traffic conditions, and other factors. With control strategies, the stability of the three subsystems increases. However, in the second year, as the policy, economic, market, and other environmental factors constantly show degradation and the cooperation fatigue (cooperation fatigue refers to opportunistic behaviors of cooperative members, such as avoiding alliance control, escaping the supervision of other members, and grasping the regulations of the alliance) of each member continues to accumulate over time, the implementation effects of the environment control strategy and membership control strategy are restricted. This restriction slows the growth of the stability of the alliance in the 12th month, which subsequently starts to decrease in the 18th month. Once out of control, the membership will rapidly lose stability.

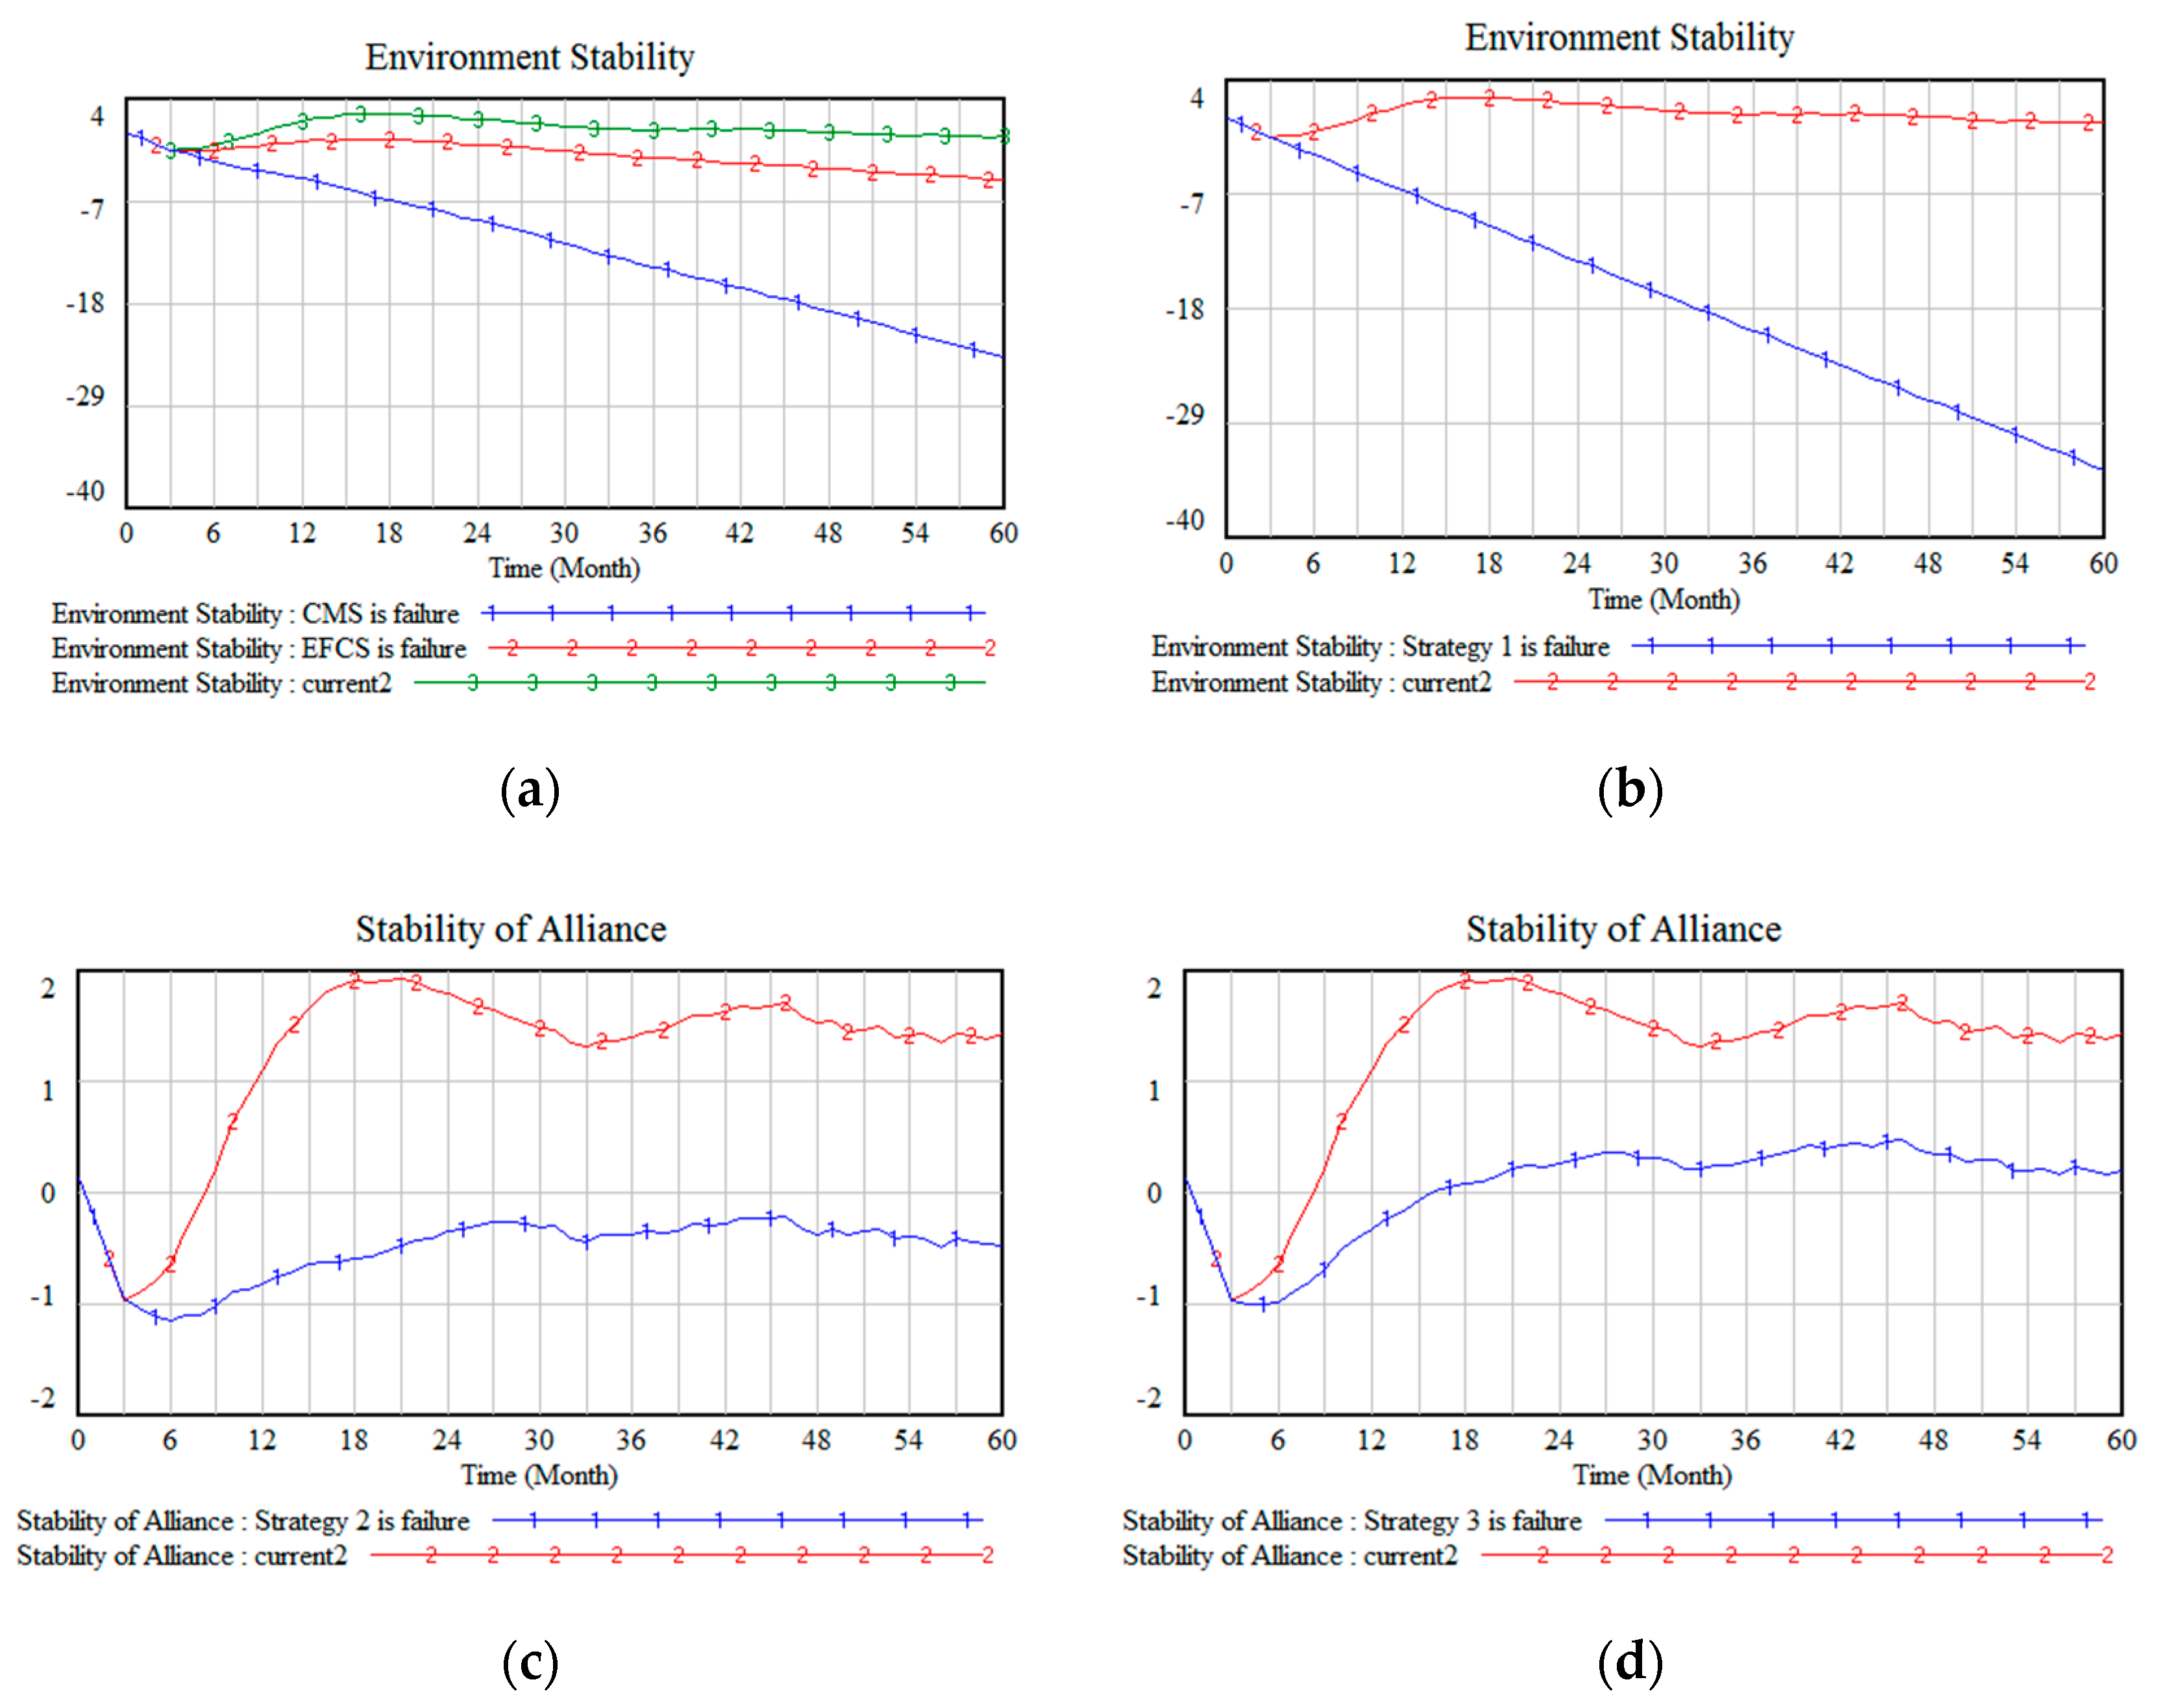
4.3.2. Effectiveness Analysis of Control Strategies

This paper adopted the control variate method to analyze the influence of a failure of control strategies on the stability of the alliance. Figure 17a shows the effect of the failure of CMS and EFCS on environmental stability. Curves 1 and 2 refer to the environmental stability when the CMS and EFCS fail, respectively, while curve 3 shows the environmental stability before the application of any control strategies. From the figure, curve 2 drops faster, which indicates that the failure of CMS has a strong influence on environmental stability. On the other hand, the EFCS has a relatively weak influence on environmental stability, which suggests that the EFCS contributes little to control the stability. The study tried to investigate the influence of the simultaneous failure of EFCS and CMS (referred to strategy 1) on environmental stability. Figure 17b shows the variation in the environmental stability trend when EFCS and CMS fail at the same time (strategy 1). It is evident that without applying appropriate control strategies, environment stability will decline significantly, which will, in turn, influence the stability of the alliance. The study further explored the influence of the failure of control strategies on the stability of the alliance. As shown in the Figure 17c,d, the failure of control strategies seriously influences the stability of the alliance.

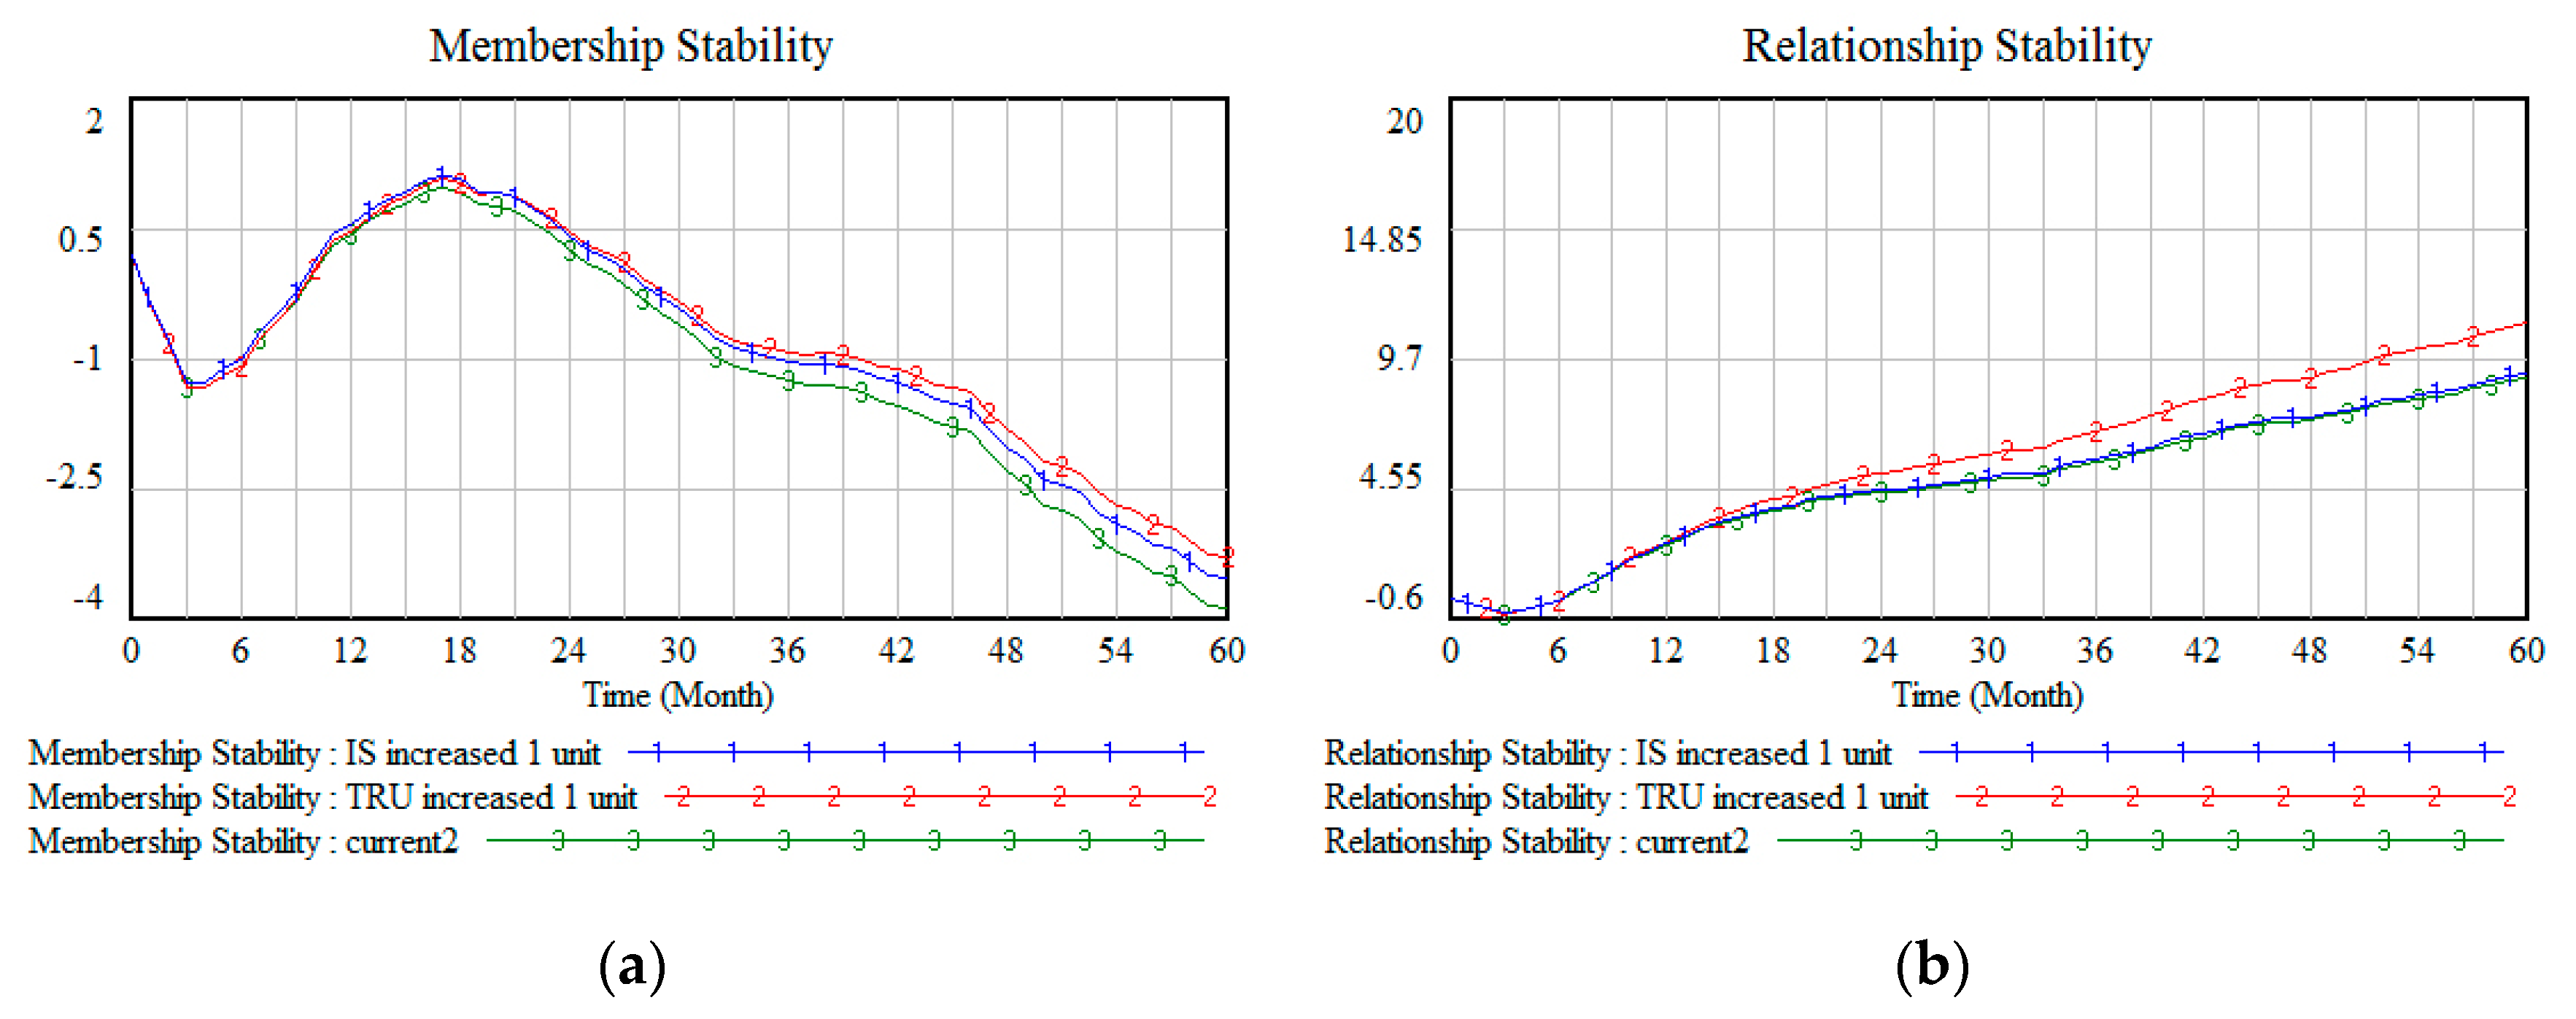
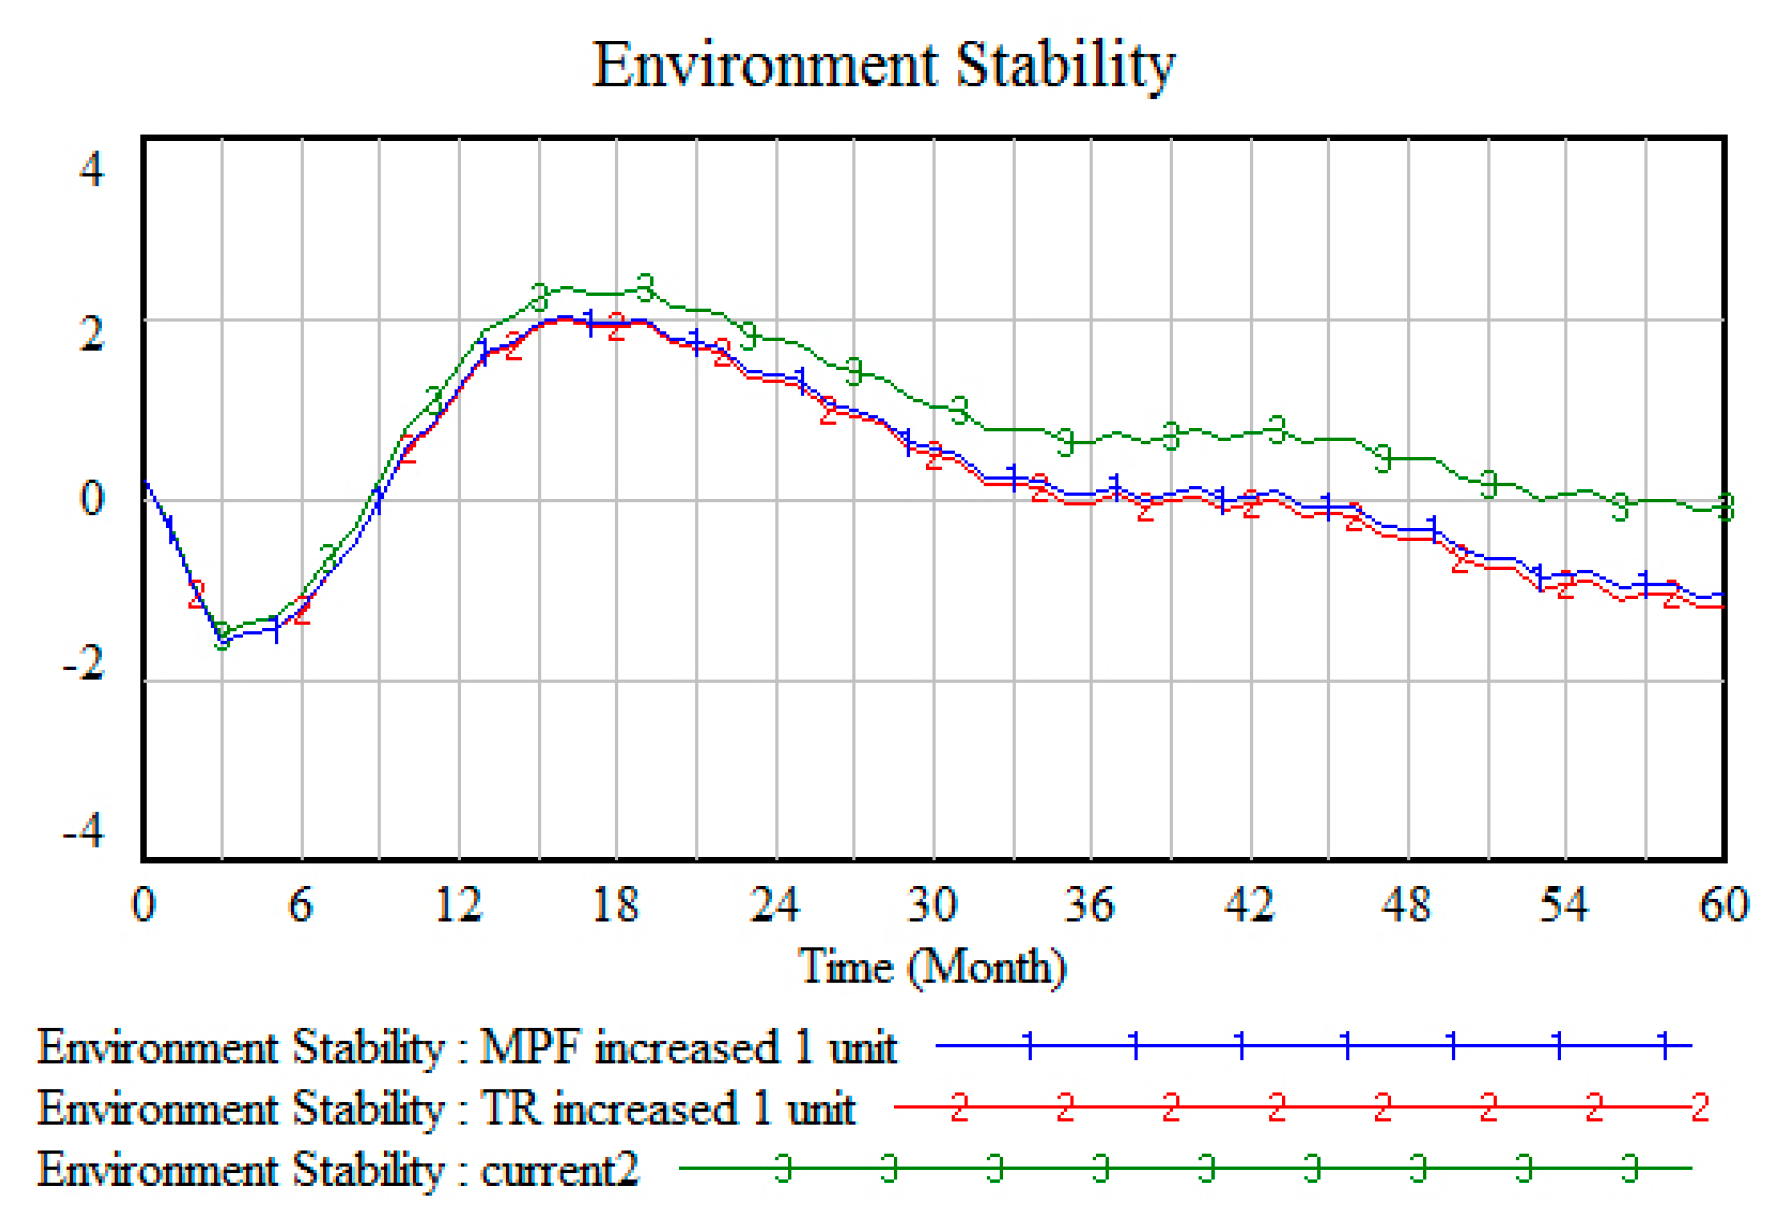
4.3.3. Impact of Change in Factors on Cooperation Stability

The study investigated the influence of change in internal factors (IS and TRU) on membership and relationship stability. For this purpose, the control variate method was adopted to observe the changes in the membership and relationship stability with an increment of one unit in the initial unit of IS and TRU. Figure 18a,b show the impact of an increase of one unit in IS (curve 1) and TRU (curve 2) on membership and relationship stability, respectively. The figures show that an increase in both IS and TRU can increase the stability of members and their relationships. Additionally, high TRU is associated with greater stability of the two subsystems. Thus, under the same conditions, the impact of TRU on membership and relationship stability is stronger than that of IS. Therefore, if the alliance aims to improve the stability of the members and their relationship, more attention should be focused on improving the mutual trust between the members.
The influence of an increase of one unit in MPF and TR on the environmental stability was also analyzed. The change in environmental stability with an increase of one unit in the MPF and TR is shown in Figure 19 (curves 1 and 2 refer to MPF and TR, respectively). The figure shows that an increment of one unit in MPF and TR will reduce the environmental stability, because an increase in MPF and TR will increase the risk of local markets and the rigor of local customers. Moreover, the influence of change in MPF on environmental stability is stronger than that of TR; therefore, it should be controlled on a priority basis.

4.3.4. Sensitivity Analysis of Control Strategies Cost

Typically, higher-cost inputs result in higher stability. However, these higher costs cause a higher operational cost for HASC alliance and thus increase burden on the alliance. This study investigated the relationship between the cost of the stability control strategies, alliance performance, and alliance stability. In the figures, curves 1, 2, and 3 show the stability (Figure 20a) and performance (Figure 20b) of the alliance under conditions when the cost of control strategies accounts for 10%, 20%, and 35% of the total operation cost, respectively. Figure 20a shows that increasing the cost of control strategies can improve the stability of the alliance. However, Figure 20b shows that as the cost of control strategies increases, the performance of the alliance starts to show serious fluctuations. When the cost of the control strategies is 35%, the alliance performance curve shows significant variation and even drops to negative values. Thus, for HASC alliance, a higher cost of control strategies does not ensure higher stability of the alliance. Therefore, it is necessary to control the cost within a certain range that will help the HASC alliance to maintain stability and performance.
This study also tried to investigate the minimum and maximum cost range of control strategies within which the alliance can maintain its stability and performance. In Figure 20c, current 4 shows the stability of the alliance when the cost of control strategies accounts for 5% of total operational cost. At this cost, the lowest value of the alliance stability curve is almost zero. Thus, if the cost of control strategies is kept below 5%, the stability value will drop to negative values. In Figure 20d, the current 5 shows the change in performance when the percentage of the cost of the control strategies is 29%. The figure shows that at this cost, the lowest value of performance is zero, showing that if the cost of the control strategies is greater than 29%, the alliance performance curve will tend to drop to negative values. Therefore, it can be concluded that the basic requirement for the alliance enterprises to operate stably and maintain a good performance is to maintain a control strategy cost higher than 5% and lower than 29% of the total operation cost.

5. Implications and Discussion

In the above sections, the conceptual framework of the HASC alliance is completed. This study also proposed several implementation strategies and a systematic analysis method of cooperation stability. This section provides an example to illustrate the workflow of an order fulfillment, to show the role and advantages of different proposed strategies in the alliance.
As shown in Figure 21, three transportation companies control the transport of all agri-food on sale, and one retailer involves providing the food storages (DC), and a series of handling works related to the storages. Let us say customer A orders four kinds of agri-foods from an online store, which is operated by e-commerce company A (alliance member) on Sunday afternoon (posted at 16:30) and expects to receive the foods in the next one hour (before 17:30). The detailed information of the order is shown at the bottom of Figure 21. Due to the long-distance transportation, the inventory replenishments of fruit 1 and fruit 2 that the customer A ordered are applied on a two-days-cycle schedule and are usually finished at 13:00 and 14:00, respectively. The inventory of vegetable 1 and meat 1 are replenished once every day and are finished at 11:00 and 11:30, respectively. All inventories of foods are replenished in accordance with the usual forecast demand. When the order is generated, all the requested foods are available in the stock. This allows the sorters to start the preparatory work while receiving the order list quickly. The preparatory works include sorting the food according to the list from the cold storage, washing and packing with a suitable box and appropriate eutectic plates, and loading the delivery vehicle. The entire preparatory work requires about 10 to 15 min (refer to Figure 21 for detail). Finally, the agri-foods are transported to the customer in 20–40 min. Nevertheless, in a situation in which the customer is not available upon the deliverer’s arrival at their home (as shown in the present case), the deliverer will put the box in a designated place for the consumer to take it later. The next day, the empty box will be brought back to DC by the van to be reused in the next cycle. Thus, this way, all the orders will be fulfilled.
This seemingly simple workflow highlights the advantage of each proposed strategy. First, the closer vertical co-ordination strategy provides a robust organizational structure for the HASC alliance and allows each member to perform its own business competently. For example, in this hypothetical case, each transportation company only needs to focus on its specialty to ensure high efficiency for the entire transport cycle. Second, the semi-centralized extension strategy takes full advantage of available infrastructures that provide several optimal sites in the region. This approach not only effectively connects the traditional supply chain with the last-mile portion, but also spreads the chain across the whole target region to approach more customers. At the same time, based on the hybrid push-pull distribution control strategy, the alliance can decide the proper amount and frequency of inventory replenishment, which ensures an adequate supply of foods for customers’ daily needs. In this case, the implementations of these two strategies make it possible to respond to the orders efficiently. In addition, the process of last-mile delivery is fully supported by the MTJD system, which ensures the freshness and safety of the agri-food. Moreover, in this case, the design of the closed-loop chain in the last-mile portion is based on the recyclable MTJD material making the delayed-taking of agri-food possible, which significantly mitigates the impact of the not-at-home phenomenon on the alliance.
More importantly, for all the activities to work well, the alliance must be running based on stable cooperation. This study proposes a three-step analytical method to show how to properly make specific control strategies via the company surveys and a series of systematic analyses. Unlike the other methods in cooperation analysis, for example, the game theory (game theory is one of the most widely used methods in the analysis of cooperation stability. It is fundamentally built on the assumptions of single agents’ behavioral strategies in a multi-agent environment. Each firm on the supply chain is regarded as an independent agent with a series of decision-making abilities. For further discussions of the concepts of supply chain see, e.g., Peters [144], Mesterton-Gibbons [145], and its applications in supply chain management, e.g., Parkhe [146], Beimborn [146], Cachon and Netessine [147] and Arthanari et al. [148]), which regards the participant as a single agent to take strategies [64,144], the proposed method deems that the cooperation of an alliance is a complex system which synthesizes many organisms and functions. A system analysis (step 1) is conducted for the identification of influential factors and causalities among them, which is prepared for the development of the cooperation system model. The company survey (step 2) aims to collect real-world data and makes a fact-based model. Based on a system simulation tool—SD model, the trend of the cooperation stability of the HASC alliance can be presented, and the effect of some important factors (including the pre-proposed control strategies) can be adequately investigated. The proposed method is characterized by being holistic and systematic, efficient and effective, process-based (deductive) focused, strategy aligned, and provides fact-based feedback. It is intended to be integrated, dynamic, and continue to allow for better management, and thus improvement of the overall stability of the alliance.

6. Conclusions

When reviewing the literature on the agri-food supply chain, one central problem for A-SMEs in urban areas is how to provide high quality and a wide variety of food to the customers while keeping themselves economic and sustainable. In this regard, the high cost of operation, severe competition within the agri-food e-commerce (AE) market, and the perishability of the agri-foods worsen the situation. This study found a solution to the above problems of A-SMEs in the form of an alliance named a “home-delivery-oriented agri-food supply chain (HASC) alliance”.
The alliance focuses on how to organize agri-food supply chain-related enterprises, especially A-SMEs, to develop a cooperative organization via collaborative strategies and alliance structures to form a substantive relationship to gain a stable foothold in the emerging AE market. For this purpose, a theoretical framework with a series of implementation strategies is proposed in this study. The framework consists of a semi-centralized extension strategy (applied as a base strategy in “last-mile” supply chain extension), a multi-temperature joint distribution system (MTJD) (introduced in the food transport to maintain food safety and quality), and a hybrid push-pull strategy (proposed in designing the supply chain of HASC alliance). Moreover, to analyze the performance of the alliance and provide appropriate strategies for alliance stability, a three-step method is proposed, based on the systems thinking theory. A case study for which the data were collected from 36 agri-food supply chain-related firms in one of the largest agricultural cities in China—Kunming—was conducted to illustrate the proposed method. The results show that: (1) the performance of the hypothetical HASC alliance with time shows significant variation in the beginning, but it gains stability with the application of stability control strategies; (2) the cooperation stability of HASC alliance is very sensitive to the performance of the strategies that control the customer and environment variations; (3) the factors of trust and market fluctuation have higher effects on membership and environmental stability, respectively; (4) the minimum and maximum cost ranges of control strategies at which the alliance can maintain its stability and performance are 5% and 29%, respectively, of the total operation cost. This study attempted to guide the A-SMEs to gain advantages by seeking to form a collaborative relationship.
The implications of this study for practice, policy, and theory include: (1) giving new insight into how the A-SMEs can develop their own AE business in a sustainable cooperative way in the current AE market—seeking to form the “HASC alliance”; (2) which policies, strategies, and methods should be used for the supply chain management and cooperation stability control of the HASC alliance, to cope with the problems that may hamper development; (3) the proposed theories, conceptual framework, and strategies in this study provide an excellent starting point for follow-up research. The problems such as the optimizing allocations of the centralized transit facilities, the dynamic food delivery scheduling method to cope with the uncertain food demand, and the maximization of the utilization rates of the MTJD transport system are major directions that need to be further investigated.
The present study has a few limitations. The conceptual framework presented in this study should be followed by empirical validation, which is crucial to convert this conceptual framework into a successful managerial tool. This may require large-scale data and engaging a wide range of functional specialties and process integration experts to capture the uncertainties of the HASC alliance. Moreover, policy and market conditions and customers’ behaviors may vary over regions (e.g., different countries). A series of processes involving policy study, customer investigation, feasibility analysis, and market assessment are critical to the success of the proposed alliance and corresponding implementation strategies. Therefore, further research is required to perfect the proposed framework with a reliable, proactive investigation scheme, which helps to improve the transportability of the proposed conceptual framework and strategies implantation issues.

Author Contributions

Conceptualization, C.H. and A.P.; methodology, C.H. and J.W.; software, C.H.; validation, X.S.; resources, A.P., X.S. and D.Z.; data curation, C.H.; writing—original draft preparation, C.H. and A.P.; writing—review and editing, A.P.; visualization, A.P.; supervision, J.W.; funding acquisition, X.S. and D.Z.; All authors have read and agreed to the published version of the manuscript.

Funding

This research received no external funding.

Conflicts of Interest

The authors declare no conflict of interest.

Appendix A

Table A1. The mathematical equations for the HASC cooperation stability model.
No.Equations
1Environmental stability = INTEG (Control Rate1-Unblance Rate1, 0)
2Unbalance Rate1 = RTA × 0.1424 + Costumer Requirement × 0.2848 + Market Fluctuation × 0.2992 + ECO × 0.1344 + POL × 0.1392
3Control Rate1 = DELAY3I (CMS × 0.6 + EFCS × 0.4, 3, 0)
4Market Fluctuation = MPF × 0.4 + MDF × 0.6
5Costumer Requirement = (TR + FR)/2
6MDF = PULSE TRAIN (0, 0.3, 1.5, 60)
7TR = WITH LOOKUP (Time, [(0, 0) − (60, 1)], (0, 0.8), (3, 0.79), (6, 0.78), (12, 0.76), (18, 0.73), (30, 0.7), (60, 0.7))
8Membership Stability = INTEG (Control Rate2-Unblance Rate2, 0)
9Unbalance Rate2 = RIS × 0.1064 + IO × 0.2482 + CS × 0.1182 + LEA × 0.1359 + RBD × 0.1477 + IS × 0.1211 + RLD × 0.1226
10Control Rate2 = DELAY3I (MMS × 0.5 + PMS × 0.3333 + RMS × 0.1667, 3, 0)
11IO = 0.3333 × PC × (0.5 − RAMP (0.008, 0, 60)) + EC × 0.6667 × (RAMP (0.008, 0, 60))
12RIS = WITH LOOKUP (Time, ([(0, 0) − (60, 1)], (0, 0.5), (3, 0.495), (6, 0.48), (9, 0.45), (12, 0.41), (15, 0.4), (18, 0.39), (21, 0.385), (24, 0.38), (60, 0.35))
13IS = WITH LOOKUP (Time, ([(0, 0) − (60, 1)], (0, 0.15), (7, 0.17), (15, 0.2), (23, 0.25), (30, 0.34), (37, 0.46), (45, 0.55), (52, 0.6), (60, 0.63))
14Relationship Stability = INTEG (Control Rate3-Unblance Rate3, 0)
15Unbalance Rate3 = TRU × 0.0902 + CT × 0.0708 + CM × 0.1247 + GC × 0.0892 + RLD × 0.0789 + DDR × 0.0844 + IO × 0.1629 + IS × 0.0795 + RBD × 0.096 + EM × 0.1236
16Control Rate3 = DELAY3I (MMS × 0.1667 + PMS × 0.3333 + RMS × 0.5, 3, 0)
17EM = WITH LOOKUP(Time, ([(0, 0.4) − (60, 1)], (0, 0.5), (3, 0.45), (6, 0.43), (9, 0.46), (12, 0.482), (15, 0.5), (18, 0.482), (21, 0.478), (24, 0.48), (27, 0.53), (30, 0.561), (33, 0.583), (36, 0.574), (39, 0.587), (42, 0.579), (45, 0.592), (48, 0.618), (51, 0.61), (54, 0.632), (57, 0.661), (60, 0.682))
18DDR = WITH LOOKUP (Time, ([(0, 0) − (60, 1)], (0, 0.5), (1, 0.49), (2, 0.485), (3, 0.47), (6, 0.45), (9, 0.42), (13, 0.4), (18, 0.39), (24, 0.38), (31, 0.37), (60, 0.35))
19TRU = WITH LOOKUP (Time, ([(0, 0) − (60, 1)], (0, 0.2), (6, 0.21), (12, 0.23), (18, 0.26), (24, 0.29), (30, 0.33), (36, 0.36), (42, 0.38), (60, 0.45))
20CM = WITH LOOKUP (Time, ([(0, 0.4) − (60, 1)], (0, 0.5), (3, 0.45), (6, 0.43), (9, 0.461), (12, 0.482), (15, 0.5), (18, 0.482), (21, 0.478), (24, 0.48), (27, 0.531), (30, 0.561), (33, 0.583), (36, 0.575), (39, 0.587), (42, 0.579), (45, 0.592), (48, 0.618), (51, 0.611), (54, 0.632), (57, 0.661), (60, 0.682))
21EFCS = RANDOM NORMAL (0.3, 1, 1, 1, 1) × The Gap with Expected Performance
22CMS = RANDOM NORMAL (0.9, 1, 1) × (The Gap with Expected Performance ^ (0.8) + 0.4)
23MMS = RANDOM NORMAL (0.8, 1.2, 4) × (The Gap with Expected Performance ^ (0.7) + 0.3)
24PMS = RANDOM NORMAL (0, 0.8, 0.4, 1, 0) × The Gap with Expected Performance
25RMS = RANDOM NORMAL (0.2, 0.8, 1) × (The Gap with Expected Performance ^ (0.7) + 0.3)
26The Gap with Expected Performance = Expected Performance–Performance of HASC Alliance
27Performance of HASC Alliance = ((BEN + SQ + SAI + HDOP)/4) + Cooperation Stability of HASC Alliance × 0.2 − Cost of Control Strategies
28Cost of Control Strategies = (EXP ((Control Rate1 + Control Rate2 + Control Rate3)/3)) × 0.36
29Cooperation Stability of HASC Alliance = (Environmental stability × 0.25 + Membership Stability × 0.3 + Relationship Stability × 0.3) − Cost of Control Strategies × 0.15
30BEN = (TC + PR)/2
31SQ = (SR + CT + NC)/3
32SAI = (KSR + PPI)/2
33HDOP = (TRH + IR + EVR + FDR + OFR)/5
Table A2. The weight of each factor in different subsystems.
SubsystemFactorDescriptionWeightInitial Value
Cooperative
environment
POLPublic Policy0.1390.6
ECOEconomic Situation0.1340.3
MFMarket Fluctuation0.299-
MDFMarket Demand Fluctuation0.60.79
MPFMarket Price Fluctuation0.40.3
RTARegional Traffic Accessibility0.1420.9
CRConsumer Requirements0.285-
TRTimeliness Requirement0.5-
FRFreshness Requirement0.50.9
Membership factorIOIndividual Opportunism0.248-
ECExpected Cost0.6670.85
PCPrevious Contraction0.3330.85
RLDRationality of Labor Distribution0.1230.78
ISInformation Symmetry0.121-
RBDRationality of Benefit Distribution0.1480.84
CSCapacity Structure 0.1180.67
LEALeadership0.1360.75
Relationship factorRISResistance of Internal Staff0.106-
IOIndividual Opportunism0.163-
ECExpected Cost0.6670.85
PCPrevious Contraction0.3330.85
RLDRationality of Labor Distribution0.0790.78
ISInformation Symmetry0.08-
RBDRationality of Benefit Distribution0.0960.84
DDRDelivery Delay Rate0.084-
CTCultural Tolerance0.0710.79
GCGoal Congruence0.0890.85
TRUTrust0.09-
CMCoordinating Mechanism0.125-
EMExchange Mechanism0.124-

Appendix B

The following questionnaire was used to collect the weight values of the factors.
Dear Expert:
This questionnaire is to investigate the cooperation stability of the agri-food supply chain alliance with the aim of fully understanding the level of the effect of related factors on cooperation stability. Here, we list the factors that may have a significant effect on the cooperation stability of the alliance. Please rate the magnitude of the influence level of each factor based on your rich work and research experience. Different magnitudes of effect and the corresponding scores are shown in the table below. For example, if you think the factor of “policy” has a “very slight” effect on environmental stability, please check in the box below level “1”, and if its effect is slight, you can tick the box below 2, and so forth.
Thank you for providing your time to help us in our work.
Score12345
MagnitudeVery slightSlightAverageHeavyVery important
FactorsMeaningCategoryLevel
12345
PolicyThe policies promulgated by the government for promoting the development of agri-food e-commerce and supporting the business of related enterprises.Environment
EconomyLocal macroeconomic conditions and average household economic state.
AccessibilityThe accessibility of local traffic network (including spatial and temporal accessibility).
MarketThe conditions of the whole agri-food market, including price, demand, competition, and so on.
CustomerThe customer’s demand and acceptance of the services that are provided by e-business.
Price fluctuationThe fluctuation of agri-food price.Environment (Market)
Demand fluctuationThe fluctuation of agri-food demand.
Timeliness requirementCustomer’s requirement for timeliness.Environment (Customer)
Freshness requirementCustomer’s requirement for food freshness.
Resistance from internal staffWhether the internal staff of a company has opposite opinions on the decision to join the alliance.Membership
Capacity structure (structure of ability)The elements that constitute the capability of the company and how they are related to each other.
LeadershipThe abilities or qualities the leaders of each member company have, especially in the aspect of making decisions related to alliance business.
Individual (company’s) opportunismThe behaviors of a company that takes advantage of any situation, often with no regard for principles or consequencesMembership/Relationship
Rationality of benefit distributionWhether the alliance fairly distributes benefits to each member company in accordance with its contribution.
Rationality of labor distributionWhether the alliance reasonably assigns the work to each member company according to its competence.
Information symmetryWhether the companies are able to obtain the same information about any activities of the alliance and market.
Delivery delay rateThe rate at which the downstream companies in the chain unsuccessfully deliver the goods in time (schedule) to their upstream partners.Relationship
Cultural toleranceHow much the participant companies are willing to accept or tolerate each other, especially when encountering opinions or behaviors that may not be shared by the others.
Goal congruenceWhether the goals of companies in the alliance are similar or fit together well.
Coordinating mechanismGiven the complex relationship between members of an alliance, a series of regulations, rules, and provisions are made to coordinate the relations of member companies.
Exchange mechanismTo ensure the unhindered communication within the alliance, a series of regulations, rules, and provisions are made.
TrustHow much do the member companies trust each other?
Expected costThe cost that the company expected for joining the alliance.Membership/Relationship
(Individual opportunism)
Previous connectionThe degree to which partners know each other before forming a cooperative alliance.

References

  1. Agatz, N.; Campbell, A.; Savelsbergh, M.; Savelsbergh, M. Time slot management in attended home delivery. Transp. Sci. 2008, 45, 435–449. [Google Scholar] [CrossRef] [Green Version]
  2. Duin, J.H.; Goffau, W.D.; Wiegmans, B.; Tavasszy, L.A.; Saes, M. Improving home delivery efficiency by using principles of address intelligence for b2c deliveries. Transp. Res. Procedia 2016, 12, 14–25. [Google Scholar] [CrossRef] [Green Version]
  3. Riccardo, M.; Gino, M.; Sara, P.; Angela, T. A review of the environmental implications of B2C e-commerce: A logistics perspective. Int. J. Phys. Distrib. Logist. Manag. 2015, 45, 565–591. [Google Scholar]
  4. Patricia, J.D.; Cornelia, D. Organizational structure in divisional manufacturers: The potential for outsourcing logistical services. Int. J. Phys. Distrib. Logist. Manag. 1997, 21, 22–29. [Google Scholar]
  5. Rotem-Mindali, O.; Weltevreden, J.W. Transport effects of e-commerce: What can be learned after years of research? Transportation 2013, 40, 867–885. [Google Scholar] [CrossRef]
  6. Lu, Q.; Meng, F.W.; Goh, M. Choice of supply chain governance: Self-managing or outsourcing? Int. J. Prod. Econ. 2014, 154, 32–38. [Google Scholar] [CrossRef]
  7. Dean, E.; Yunus, K. The effects of global outsourcing strategies on participants’ attitudes and organizational effectiveness. Int. J. Manpow. 2000, 21, 112–128. [Google Scholar]
  8. Kremic, T.; Oya, I.T.l.; Walter, O. Outsourcing decision support: A survey of benefits, risks, and decision factors. Supply Chain Manag. Int. J. 2006, 11, 467–482. [Google Scholar] [CrossRef] [Green Version]
  9. Gandhi, S.J.; Gorod, A.; Sauser, B. Prioritization of outsourcing risks from a systemic perspective. Strateg. Outsourc. 2012, 5, 39–71. [Google Scholar] [CrossRef]
  10. Shahani, R. Good outsourcing requires good governance. Supply Chain Manag. Rev. 2007, 11, 15–16. [Google Scholar]
  11. Das, T.K.; Teng, B.S. Trust, control, and risk in strategic alliances: An integrated framework. Organ. Stud. 2001, 22, 251–283. [Google Scholar] [CrossRef] [Green Version]
  12. Christoffersen, J.; Plenborg, T.; Robson, M.J. Measures of strategic alliance performance classified and assessed. Int. Bus. Rev. 2014, 23, 479–489. [Google Scholar] [CrossRef]
  13. Gomes, E.; Barnes, B.R.; Mahmood, T. A 22-year review of strategic alliance research in the leading management journals. Int. Bus. Rev. 2014, 25, 15–27. [Google Scholar] [CrossRef]
  14. Albers, S.; Wohlgezogen, F.; Zajac, E.J. Strategic alliance structures: An organization design perspective. J. Manag. 2016, 42, 582–614. [Google Scholar] [CrossRef]
  15. Angelo, C.; Evi, H.; Matthias, S.F. Intra-industry strategic alliances for managing sustainability-related supplier risks: Motivation and outcome. Int. J. Phys. Distrib. Logist. Manag. 2017, 47, 387–409. [Google Scholar]
  16. Kim, D.; John, S.; Eric, D. An organization-level framework for the NZ food industry—Its development and application. Int. J. Phys. Distrib. Logist. Manag. 2005, 35, 728–743. [Google Scholar]
  17. Zhang, J.; Frazier, G.V. Strategic alliance via co-opetition: Supply chain partnership with a competitor. Decis. Support Syst. 2011, 51, 853–863. [Google Scholar] [CrossRef]
  18. Lo, V.H.Y.; Yeung, A.H.W. Practical framework for strategic alliance in pearl river delta manufacturing supply chain: A total quality approach. Int. J. Prod. Econ. 2004, 87, 231–240. [Google Scholar] [CrossRef]
  19. Mellat-Parast, M.; Digman, L.A. A framework for quality management practices in strategic alliances. Manag. Decis. 2007, 45, 802–818. [Google Scholar] [CrossRef] [Green Version]
  20. Sambasivan, M.; Siew, L.; Mohamed, Z.A.; Leong, Y.C. Factors influencing strategic alliance outcomes in a manufacturing supply chain: Role of alliance motives, interdependence, asset specificity and relational capital. Int. J. Phys. Distrib. Logist. Manag. 2013, 141, 339–351. [Google Scholar] [CrossRef]
  21. Sambasivan, M.; Siew, L.; Mohamed, Z.A.; Leong, Y.C. Impact of interdependence between supply chain partners on strategic alliance outcomes. Manag. Decis. 2011, 54, 548–569. [Google Scholar] [CrossRef]
  22. Fynes, B.; Búrca, S.; Mangan, J. The effect of relationship characteristics on relationship quality and performance. Int. J. Prod. Econ. 2008, 111, 56–69. [Google Scholar] [CrossRef]
  23. Patel, T. The role of dynamic cultural theories in explaining the viability of international strategic alliances: A focus on Indo-French alliances. Manag. Rev. 2007, 45, 1532–1559. [Google Scholar] [CrossRef]
  24. Sambasivan, M.; Nget, Y.C. Strategic alliances in a manufacturing supply chain: Influence of organizational culture from the manufacturer’s perspective. Int. J. Phys. Distrib. Logist. Manag. 2010, 40, 456–474. [Google Scholar] [CrossRef]
  25. China e-Business Research Center. China Fresh E-Commerce Report; China e-Business Research Center: Hangzhou, China, 2015; Available online: http://www.100ec.cn/detail--6292936.html. (accessed on 12 August 2020).
  26. Chaffey, D. E-Business and E-Commerce Management: Strategy, Implementation and Practice; FT Prentice Hall: Harlow, UK, 2009. [Google Scholar]
  27. Zhuang, Y.; Lederer, A.L. An instrument for measuring the business benefits of e-commerce retailing. Int. J. Electron. Commun. 2003, 7, 65–99. [Google Scholar]
  28. Karagozoglu, N.; Lindell, M. Electronic commerce strategy, operations, and performance in small and medium-sized enterprises. J. Small Bus. Enterp. Dev. 2004, 11, 290–301. [Google Scholar] [CrossRef]
  29. Lim, S.; Jin, X.; Srai, J. Consumer-driven e-commerce: A literature review, design framework, and research agenda on last-mile logistics models. Int. J. Phys. Distrib. Logist. Manag. 2018, 48, 308–332. [Google Scholar] [CrossRef] [Green Version]
  30. Dabhilkar, M.; Bengtsson, L.; Haartman, R.V.; Ahlstrom, P. Supplier selection or collaboration? Determining factors of performance improvement when outsourcing manufacturing. J. Purch. Supply Manag. 2009, 15, 143–153. [Google Scholar] [CrossRef] [Green Version]
  31. Monica, B. Outsourcing the benefits and the risks. Hum. Resour. Manag. Rev. 2009, 16, 269–279. [Google Scholar]
  32. Mao, S.Y.; Shi, Q.; He, Q.Y.; Gao, Z.H.; Bi, Y. Research on the mode optimization of home delivery of fresh products. Logist. Eng. Manag. 2015, 37, 50–52. [Google Scholar]
  33. Cox, J.; Dale, B.G. Service quality and, e-commerce: An exploratory analysis. Manag. Serv. Qual. Int. J. 2001, 11, 121–131. [Google Scholar] [CrossRef]
  34. Julia, B.E.; Alan, C.M.; Sharon, L.C. Comparative analysis of the carbon footprints of conventional and online retailing: A “last mile” perspective. Int. J. Phys. Distrib. Logist. Manag. 2010, 40, 103–123. [Google Scholar]
  35. Park, H.; Park, D.; Jeong, I.J. An effects analysis of logistics collaboration in last-mile networks for CEP delivery services. Transp. Policy 2016, 50, 115–125. [Google Scholar] [CrossRef]
  36. David, H.T. Problems of Food Supply Logistics in Russia and the CIS. Int. J. Phys. Distrib. Logist. Manag. 1994, 24, 15–22. [Google Scholar]
  37. Bodini, A.; Zanoli, R. Competitive factors of the agri-food e-commerce. J. Food Prod. Mark. 2011, 17, 241–260. [Google Scholar] [CrossRef]
  38. Rikka, K.; Iskra, D.; Lauri, L. Creating sustainable fresh food supply chains through waste reduction. Int. J. Phys. Distrib. Logist. Manag. 2013, 43, 262–276. [Google Scholar]
  39. Van der Vorst, G.; Van Dongen, S.; Nouguier, S.; Hilhorst, R. E-business initiatives in food supply chains; definition and typology of electronic business models. Int. J. Logist. Res. Appl. 2002, 5, 119–138. [Google Scholar] [CrossRef]
  40. Kuo, J.C.; Chen, M.C. Developing an advanced multi-temperature joint distribution system for the food cold chain. Food Control 2010, 21, 559–566. [Google Scholar] [CrossRef]
  41. Has, C.I.; Liu, K.P. A model for facilities planning for multi-temperature joint distribution system. Food Control 2011, 22, 1873–1882. [Google Scholar]
  42. Has, C.I.; Chen, W.T.; Wu, W.J. Optimal delivery cycles for joint distribution of multi-temperature food. Food Control 2013, 34, 106–114. [Google Scholar]
  43. Sun, N. Research Report on the Current Situation and Development Trend of Fresh Food E-Commerce Market in China (2016–2022); Zhiyan Consulting Group: Beijing, China, 2015; pp. 206–208. [Google Scholar]
  44. Bjørgen, A.; Bjerkan, K.Y.; Hjelkrem, O.A. E-groceries: Sustainable last mile distribution in city planning. Res. Transp. Econ. 2019, 100805. [Google Scholar] [CrossRef]
  45. Gevaers, R.; Van de Voorde, E.; Vanelslander, T. Cost modelling and simulation of last-mile characteristics in an innovative B2C supply chain environment with implications on urban areas and cities. Procedia Soc. Behav. Sci. 2014, 125, 398–411. [Google Scholar] [CrossRef] [Green Version]
  46. Ehrler, V.C.; Schöder, D.; Seidel, S. Challenges and perspectives for the use of electric vehicles for last mile logistics of grocery e-commerce—Findings from case studies in Germany. Res. Transp. Econ. 2019, 100757. [Google Scholar] [CrossRef]
  47. Beverland, M. Can cooperatives brand? Exploring the interplay between cooperative structure and sustained brand marketing success. Food Policy 2007, 32, 480–495. [Google Scholar] [CrossRef]
  48. Wachsmuth, D. Infrastructure alliances: Supply-chain expansion and multi-city growth coalitions. Econ. Geogr. 2017, 93, 44–65. [Google Scholar] [CrossRef]
  49. Gulati, R.; Nohria, N.; Zaheer, A. Strategic networks. Strateg. Manag. J. 2000, 21, 203–215. [Google Scholar] [CrossRef]
  50. Koka, B.R.; Prescott, J.E. Designing alliance networks: The influence of network position, environmental change, and strategy on firm performance. Strateg. Manag. J. 2008, 29, 639–661. [Google Scholar] [CrossRef]
  51. Street, C.T.; Cameron, A.F. External relationships and the small business: A review of small business alliance and network research. J. Small Bus. Manag. 2007, 45, 239–266. [Google Scholar] [CrossRef]
  52. Dubois, A.; Fredriksson, P. Cooperating and competing in supply networks: Making sense of a triadic sourcing strategy. J. Purch. Supply Manag. 2008, 14, 170–179. [Google Scholar] [CrossRef]
  53. Siew-Phaik, L.G.; Downe, A.; Sambasivan, M. Strategic alliances with suppliers and customers in a manufacturing supply chain. Asia Pac. J. Bus. Adm. 2013, 5, 192–214. [Google Scholar] [CrossRef]
  54. Choi, J.; Yeniyurt, S. Contingency distance factors and international research and development (r&d), marketing, and manufacturing alliance formations. Int. Bus. Rev. 2015, 24, 1061–1071. [Google Scholar]
  55. Ukko, J.; Saunila, M. Understanding the practice of performance measurement in industrial collaboration: From design to implementation. J. Purch. Supply Manag. 2020, 26, 100529. [Google Scholar] [CrossRef]
  56. David, M.; Muange, R.; Maru, L.C. Strategic alliances on performance of retail firms in nairobi county, Kenya. TQM 2015, 27, 732–740. [Google Scholar]
  57. Arend, R.J. SME—Supplier alliance activity in manufacturing: Contingent benefits and perceptions. Strateg. Manag. J. 2006, 27, 741–763. [Google Scholar] [CrossRef]
  58. Min, J.; Mitsuhashi, H. Dynamics of unclosed triangles in alliance networks: Disappearance of brokerage positions and performance consequences. J. Manag. Stud. 2012, 49, 1078–1108. [Google Scholar] [CrossRef]
  59. Lee, J.W.; Abosag, I.; Kwak, J. The role of networking and commitment in foreign market entry process: Multinational corporations in the Chinese automobile industry. Int. Bus. Rev. 2012, 21, 27–39. [Google Scholar] [CrossRef]
  60. Blind, K.; Mangelsdorf, A. Alliance formation of SMEs: Empirical evidence from standardization committees. IEEE Trans. Eng. Manag. 2013, 60, 148–156. [Google Scholar] [CrossRef]
  61. Jiang, X.; Li, Y.; Gao, S. The stability of strategic alliances: Characteristics, factors and stages. J. Int. Manag. 2008, 14, 173–189. [Google Scholar] [CrossRef]
  62. Tang, M.; Lan, H. An empirical research on factors influencing the stability of the storage alliance based on contract. In LISS; Springer: Berlin/Heidelberg, Germany, 2015. [Google Scholar]
  63. Nielsen, B.B.; Gudergan, S. Exploration and exploitation fit and performance in international strategic alliances. Int. Bus. Rev. 2012, 21, 558–574. [Google Scholar] [CrossRef]
  64. Parkhe, A. Strategic alliance structuring: A game theoretic and transaction cost examination of inter-firm cooperation. Acad. Manag. J. 1993, 36, 794–829. [Google Scholar]
  65. Lloyd, H.L.E.; Varey, R.J. Factors affecting internal communication in a strategic alliance project. Corp. Commun. Int. J. 2003, 8, 197–207. [Google Scholar] [CrossRef]
  66. Agarwal, R.; Croson, R.; Mahoney, J.T. The role of incentives and communication in strategic alliances: An experimental investigation. Strateg. Manag. J. 2010, 31, 413–437. [Google Scholar] [CrossRef] [Green Version]
  67. Swoboda, B.; Meierer, M.; Foscht, T.; Morschett, D. International SME alliances: The impact of alliance building and configurational fit on success. Long Range Plan. 2011, 44, 271–288. [Google Scholar] [CrossRef]
  68. Jiang, X.; Yang, Y.; Pei, Y.L.; Wang, G. Entrepreneurial orientation, strategic alliances, and firm performance: Inside the black box. Long Range Plan. 2014, 49, 103–116. [Google Scholar] [CrossRef]
  69. Liu, C. An investigation of relationship learning in cross-border buyer—Supplier relationships: The role of trust. Int. Bus. Rev. 2012, 21, 311–327. [Google Scholar] [CrossRef]
  70. Silva, S.C.; Bradley, F.; Sousa, C. Empirical test of the trust—Performance link in an international alliances’ context. Int. Bus. Rev. 2012, 21, 293–306. [Google Scholar] [CrossRef]
  71. Grudinschi, D.; Sintonen, S.; Hallikas, J. Relationship risk perception and determinants of the collaboration fluency of buyer—Supplier relationships in public service procurement. J. Purch. Supply Manag. 2014, 20, 82–91. [Google Scholar] [CrossRef]
  72. Sartorious, K.; Kirsten, J. A framework to facilitate institutional arrangements for smallholder supply in developing countries: An agribusiness perspective. Food Policy 2007, 32, 640–655. [Google Scholar] [CrossRef] [Green Version]
  73. Yang, J.; Wang, J.; Wong, C.; Lai, K.H. Relational stability and alliance performance in supply chain. Omega 2008, 36, 600–608. [Google Scholar] [CrossRef]
  74. Lee, S.M.; Parast, M.M. The formation of initial trust in the strategic supply chain partnership. Int. J. Manag. Enterp. Dev. 2009, 7, 28–43. [Google Scholar] [CrossRef]
  75. Zybell, U. Partner management managing service partnerships in the supply chain a systemic perspective. Int. J. Phys. Distrib. Logist. Manag. 2013, 43, 231–261. [Google Scholar] [CrossRef] [Green Version]
  76. Liu, R.; Gao, Z.; Nayga, R.M.; Snell, H.A.; Ma, H. Consumers’ valuation for food traceability in china: Does trust matter? Food Policy 2019, 88, 101768. [Google Scholar] [CrossRef]
  77. Cullen, J.B.; Johnson, J.L.; Sakano, T. Success through commitment and trust: The soft side of strategic alliance management. J. World Bus. 2000, 35, 223–240. [Google Scholar] [CrossRef]
  78. Grant, S.B. The impact of market group culture on the appearance of post contractual opportunism in supply chain ‘partnerships’. Int. J. Serv. Oper. Manag. 2009, 5, 94–119. [Google Scholar] [CrossRef]
  79. Slater, S. Social capital in Japanese-Western Alliances: Understanding cultural effects. Int. Mark. Rev. 2012, 29, 6–23. [Google Scholar] [CrossRef]
  80. Kemper, N.P.; Popp, J.S.; Nayga, R.M.; Kerr, J.B. Cultural worldview and genetically modified food policy preferences. Food Policy 2018, 80, 68–83. [Google Scholar] [CrossRef]
  81. Bidault, F.; Salgado, M. Stability and complexity of inter-firm co-operation: The case of multi-point alliances. Eur. Manag. J. 2001, 19, 619–628. [Google Scholar] [CrossRef]
  82. Bidault, F. Managing Joint Innovation; Palgrave Macmillan: London, UK, 2012. [Google Scholar]
  83. Wittmann, C.M.; Hunt, S.D.; Arnett, D.B. Explaining alliance success: Competences, resources, relational factors, and resource-advantage theory. Ind. Mark. Manag. 2009, 38, 743–756. [Google Scholar] [CrossRef]
  84. Waheed, Z. Supply chain performance: Collaboration, alignment and coordination. Facilities 2018, 30, 177–178. [Google Scholar] [CrossRef]
  85. Graham, G.; Moon, S.; Kim, D. Systems thinking ability for supply chain management. Supply Chain Manag. Int. J. 2005, 10, 394–401. [Google Scholar]
  86. Hassan, M.M.D. Engineering supply chains as systems. Syst. Eng. 2006, 9, 73–89. [Google Scholar] [CrossRef]
  87. Ghadge, A.; Dani, S.; Chester, M.; Kalawsky, R. A systems approach for modelling supply chain risks. Supply Chain Manag. Int. J. 2013, 18, 523–538. [Google Scholar] [CrossRef] [Green Version]
  88. Gandolfo, D. Systems thinking and sustainability in organisations. J. Organ. Transform. Soc. Chang. 2015, 12, 1–3. [Google Scholar]
  89. Shongwe, M.I. A systems thinking approach to investigating complex sugarcane supply and processing systems: Integrating rich pictures and Bayesian networks. Syst. Pract. Action Res. 2018, 31, 75–85. [Google Scholar] [CrossRef]
  90. Holmberg, S. A systems perspective on supply chain measurements. Int. J. Phys. Distrib. Logist. Manag. 2000, 30, 847–868. [Google Scholar] [CrossRef]
  91. Nagarajan, V.; Savitskie, K.; Ranganathan, S.; Sen, S.; Alexandrov, A. The effect of environmental uncertainty, information quality, and collaborative logistics on supply chain flexibility of small manufacturing firms in India. Asia Pac. J. Mark. Logist. 2013, 25, 784–802. [Google Scholar] [CrossRef]
  92. Prajogo, D.; Tang, A.K.Y.; Kee-Hung, L. The diffusion of environmental management system and its effect on environmental management practices. Int. J. Oper. Prod. Manag. 2014, 34, 565–585. [Google Scholar] [CrossRef]
  93. Jangga, R.; Ali, N.M.; Ismail, M.; Sahari, N. Effect of environmental uncertainty and supply chain flexibility towards supply chain innovation: An exploratory study. Procedia Econ. Financ. 2015, 31, 262–268. [Google Scholar] [CrossRef] [Green Version]
  94. Choy, K.L.; Chow, H.K.H.; Tan, K.H.; Chan, C.K.; Mok, E.C.M.; Wang, Q. Leveraging the supply chain flexibility of third-party logistics—Hybrid knowledge-based system approach. Expert Syst. Appl. 2008, 35, 1998–2016. [Google Scholar] [CrossRef]
  95. Bashiri, M.; Tabrizi, M.M. Supply chain design: A holistic approach. Expert Syst. Appl. 2010, 37, 688–693. [Google Scholar] [CrossRef]
  96. Galli, F.; Prosperi, P.; Favilli, E.; Amico, S.; Bartolini, F.; Brunori, G. How can policy processes remove barriers to sustainable food systems in Europe? Contributing to a policy framework for agri-food transitions. Food Policy 2020, 101871. [Google Scholar] [CrossRef]
  97. Hobbs, J.E.; Young, L.M. Closer vertical coordination in agri-food supply chains: A conceptual framework and some preliminary evidence. Supply Chain Manag. 2000, 5, 131–143. [Google Scholar] [CrossRef]
  98. Lin, H.; Darnall, N.J. Strategic alliance formation and structural configuration. J. Bus. Ethics 2015, 127, 549–564. [Google Scholar] [CrossRef]
  99. Cozzarin, B.P.; Barry, P.J. Organizational structure in agricultural production alliances. Int. Food Agribus. Manag. Rev. 1998, 1, 149–165. [Google Scholar] [CrossRef]
  100. Saban, K.; Mawhinney, J.; Drake, M. An integrated approach to managing extended supply chain networks. Bus. Horiz. 2017, 60, 689–697. [Google Scholar] [CrossRef]
  101. Kuo, J.C.; Chung, J.C.; Lin, C.C. Feasible Study for Healthy Logistics Service System; Technical Report; Industrial Technology and Research Institute: Hsinchu, Taiwan, 2003. [Google Scholar]
  102. Tajima, M. Strategic value of RFID in supply chain management. J. Purch. Supply Manag. 2007, 13, 261–273. [Google Scholar] [CrossRef]
  103. Takahashi, K.; Nakamura, N. Push, pull, or hybrid control in supply chain management. Int. J. Phys. Distrib. Logist. Manag. 2004, 17, 126–140. [Google Scholar] [CrossRef]
  104. Riccardo, M.; Guang, S.; Alessandro, P. Distribution network design: A literature review and a research agenda. Int. J. Phys. Distrib. Logist. Manag. 2015, 45, 506–531. [Google Scholar]
  105. Benita, M.B.; Jose, M.B. A hybrid push/pull control algorithm for multi-stage, multi-line production systems. Prod. Plan. Control 2000, 11, 349–356. [Google Scholar]
  106. Fu, H.; Ma, Y.; Ni, D.; Cai, X. Coordinating a decentralized hybrid push–pull assembly system with unreliable supply and uncertain demand. Ann. Opera Res. 2017, 257, 537–557. [Google Scholar] [CrossRef]
  107. Naylor, J.B.; Naim, M.M.; Berry, D. Legality: Integrating the lean and agile manufacturing paradigms in the total supply chain. Int. J. Prod. Econ. 1999, 62, 107–118. [Google Scholar] [CrossRef]
  108. Rudberg, M.; Wikner, J. Mass customization in terms of the customer order decoupling point. production systems. Prod. Plan. Control 2004, 15, 445–458. [Google Scholar] [CrossRef]
  109. Nasirzadeh, F.; Khanzadi, M.; Mir, M. A hybrid simulation framework for modelling construction projects using agent-based modelling and system dynamics: An application to model construction workers’ safety behavior. Int. J. Constr. Manag. 2018, 18, 132–143. [Google Scholar] [CrossRef]
  110. Forrester, J.W. System dynamics, systems thinking, and soft operation research. Syst. Dyn. Rev. 1994, 245–256. [Google Scholar] [CrossRef]
  111. Ahmad, S.; Tahar, R.M.; Muhammad-Sukki, F.; Munir, A.B.; Rahim, R.A. Application of system dynamics approach in electricity sector modelling: A review. Renew. Sustain. Energy Rev. 2016, 56, 29–37. [Google Scholar] [CrossRef]
  112. Ye, G.; Yuan, H.; Wang, H. Estimating the generation of construction and demolition waste by using system dynamics a proposed model. In Proceedings of the International Conference on Bioinformatics and Biomedicine Engineering, Chengdu, China, 18–20 June 2010; pp. 1–4. [Google Scholar]
  113. Ding, Z.; Zhu, M.; Tam, V.W.Y.; Yi, G.; Tran, C.N.N. A system dynamics-based environmental benefit assessment model of construction waste reduction management at the design and construction stages. J. Clean. Prod. 2018, 176, 676–692. [Google Scholar] [CrossRef]
  114. Ciobanu, C.; Bejou, D. Forging new global alliances: Emerging markets and advanced economies. J. Relatsh. Mark. 2009, 8, 280–298. [Google Scholar] [CrossRef]
  115. Kumar, A.; Shinoj, P.; Joshi, P.K. Global economic crisis and Indian agriculture: Impacts and perspectives. Ind. J. Agric. Econ. 2010, 65, 508–519. [Google Scholar]
  116. Ellinger, P.N.; Tirupattur, V. An overview of the linkages of the global financial crisis to production agriculture. Am. J. Agric. Econ. 2009, 91, 1399–1405. [Google Scholar] [CrossRef]
  117. Lynch, M.D.F. Public policy and global supply chain capabilities and performance: A resource-based view. J. Int. Mark. 2002, 10, 25–51. [Google Scholar]
  118. Mintcheva, V. Indicators for environmental policy integration in the food supply chain (the case of the tomato ketchup supply chain and the integrated product policy. J. Clean. Prod. 2005, 13, 717–731. [Google Scholar] [CrossRef]
  119. Greys, S. Impact of demand uncertainty on stability of supplier alliances in assembly models. Prod. Oper. Manag. 2011, 20, 905–920. [Google Scholar]
  120. Peter, K.; Andy, C.; Edwin, T.C. Supplier alliances and environmental uncertainty: An empirical study. Int. J. Prod. Econ. 2009, 120, 190–204. [Google Scholar]
  121. Chen, C.; Chiu, H.; Chi, Y.; Wu, S. Does uncertain demand affect service quality? Int. J. Hosp. Manag. 2015, 46, 76–78. [Google Scholar] [CrossRef]
  122. Giri, B.; Bardhan, S. Coordinating a supply chain under uncertain demand and random yield in presence of supply disruption. Int. J. Prod. Res. 2015, 53, 5070–5084. [Google Scholar] [CrossRef]
  123. Dias, J.; Vítor, M. The impact of resource conditions and environmental uncertainty on inter-firm alliance strategies. Appl. Econ. 2009, 43, 757–765. [Google Scholar] [CrossRef] [Green Version]
  124. Zineldin, M.; Dodourova, M. Motivation, achievements and failure of strategic alliances. Eur. Bus. Rev. 2013, 17, 460–470. [Google Scholar] [CrossRef]
  125. Wendel, D.L. Modeling alliance membership in a three-dimensional space. Int. Interact. 2001, 27, 29–60. [Google Scholar] [CrossRef]
  126. Chang, W.; Chiu, C. Coopetition under alliance? applying awareness-motivation-capability competitive dynamics perspective. J. Bus. Econ. Manag. 2016, 17, 701–716. [Google Scholar] [CrossRef] [Green Version]
  127. Ma, X. Stability analysis of supply chain cooperation contract under asymmetric information. Appl. Mech. Mater. 2011, 44, 794–798. [Google Scholar] [CrossRef]
  128. Tage, S.; Christian, T.; Claus, A. Supply chain collaboration: Theoretical perspectives and empirical evidence. Int. J. Phys. Distrib. Logist. Manag. 2003, 33, 531–549. [Google Scholar]
  129. Paul, S.; Asian, S.; Goh, M.; Torabi, S. Managing sudden transportation disruptions in supply chains under delivery delay and quantity loss. Ann. Oper. Res. 2017, 3, 1–32. [Google Scholar] [CrossRef] [Green Version]
  130. Hueth, B.; Lawrence, J. Information transmission in cattle markets: A case study of the Chariton valley beef alliance. J. Agribus. 2006, 24, 93–107. [Google Scholar]
  131. Steensma, H.; Marino, L.; Weaver, K.M. Attitudes toward cooperative strategies: A cross-cultural analysis of entrepreneurs. J. Int. Bus. Stud. 2000, 31, 591–609. [Google Scholar] [CrossRef]
  132. Gill, J.; Butler, R.J. Managing instability in cross-cultural alliances. Long Range Plan. 2003, 36, 543–563. [Google Scholar] [CrossRef]
  133. Feng, H.; Cui, Y. Cross-cultural adaptation management among partnerships in supply chain alliance. In Proceedings of the 2008 IEEE International Conference on Service Operations and Logistics, and Informatics, Beijing, China, 12–15 October 2008. [Google Scholar]
  134. Faisal, M. Sustainability metrics for a supply chain: The case of small and medium enterprises. Int. Ser. Oper. Res. Manag. Sci. 2012, 13, 392–414. [Google Scholar] [CrossRef]
  135. Agatz, N.; Campbell, A.; Fleischmann, M.; Savels, M. Challenges and opportunities in attended home delivery. In The Vehicle Routing Problem: Latest Advances and New Challenges: Operations Research/Computer Science Interfaces; Springer: Boston, MA, USA, 2008; Volume 43, pp. 379–396. [Google Scholar]
  136. Lee, H.Y.; Yoo, D. The determinants of perceived SQ and its relationship with satisfaction. J. Serv. Mark. 2000, 14, 217–231. [Google Scholar] [CrossRef]
  137. Sureshchander, G.S.; Rajendran, C.; Anatharaman, R.N. The relationship between service quality and customer satisfaction—A factor specific approach. J. Serv. Mark. 2002, 16, 363–379. [Google Scholar] [CrossRef] [Green Version]
  138. Nitin, S.; Deshmukh, S.G.; Vrat, P. A conceptual model for quality of service in the supply chain. Int. J. Phys. Distrib. Logist. Manag. 2006, 36, 547–575. [Google Scholar]
  139. Prajogo, D.I.; Sohal, A.S. The relationship between organizational strategy, total quality, management and organizational performance, Mediating role of TQM. Eur. J. Oper. Res. 2006, 16, 35–50. [Google Scholar] [CrossRef]
  140. Kaliappen, N.; Hillman, H. Validity and reliability of the strategic factors and organizational performance scales. Middle East J. Sci. Res. 2013, 16, 1719–1724. [Google Scholar]
  141. Kamakoty, J.; Sohani, N. Measurement of service quality of upstream and downstream supply chain. Int. J. Serv. Oper. Manag. 2016, 25, 99–119. [Google Scholar] [CrossRef]
  142. Boulkedid, R.; Abdoul, H.; Loustau, M.; Sibony, O.; Alberti, C. Using and reporting the Delphi method for selecting healthcare quality indicators: A systematic review. PLoS ONE 2011, 6, e20476. [Google Scholar] [CrossRef] [PubMed]
  143. Sourani, A.; Sohail, M. The Delphi method: Review and use in construction management research. Int. J. Constr. Educ. Res. 2015, 11, 54–76. [Google Scholar] [CrossRef]
  144. Peters, H. Game Theory: A Multi—Leveled Approach; Springer: Berlin, Germany, 2008. [Google Scholar]
  145. Mesterton-Gibbons, M. An Introduction to Game—Theoretic Modelling, 2nd ed.; American Mathematical Society: Providence, RI, USA, 2004. [Google Scholar]
  146. Beimborn, D. The stability of cooperative sourcing coalitions—Game theoretical analysis and experiment. Electr. Mark. 2014, 24, 19–36. [Google Scholar] [CrossRef]
  147. Cachon, G.P.; Netessine, S. Game theory in supply chain analysis. In Handbook of Quantitative Supply Chain Analysis; International Series in Operations Research & Management Science; Springer: Boston, MA, USA, 2004; Volume 74. [Google Scholar]
  148. Arthanari, T.; Carfì, D.; Musolino, F. Game theoretic modeling of horizontal supply chain coopetition among growers. Int. Game Theory Rev. 2015, 17, 1540013. [Google Scholar] [CrossRef]
Figure 1. Organizational structure of the home-delivery-oriented agri-food supply chain (HASC) alliance.
Sustainability 12 06547 g001
Figure 2. Business process of the HASC alliance.
Sustainability 12 06547 g002
Figure 3. Semi-centralized extended supply chain.
Sustainability 12 06547 g003
Figure 4. Equipment of a multi-temperature joint distribution (MTJD) system.
Sustainability 12 06547 g004
Figure 5. Material flows of an MTJD system.
Sustainability 12 06547 g005
Figure 6. Schematic diagram of the proposed hybrid push-pull control mechanism.
Sustainability 12 06547 g006
Figure 7. Framework of the proposed three-step analytic method.
Sustainability 12 06547 g007
Figure 8. An illustrative causal loop diagram (CLD).
Sustainability 12 06547 g008
Figure 9. An illustrative stock-flow diagram (SFD).
Sustainability 12 06547 g009
Figure 10. Stability system of the HASC alliance.
Sustainability 12 06547 g010
Figure 11. Causal loop diagram of the HASC alliance.
Sustainability 12 06547 g011
Figure 12. Influence subsystem.
Sustainability 12 06547 g012
Figure 13. Performance appraisal subsystem.
Sustainability 12 06547 g013
Figure 14. Stability control subsystem.
Sustainability 12 06547 g014
Figure 15. System dynamic model of cooperation stability of HASC alliance.
Sustainability 12 06547 g015
Figure 16. (a) Stability of each subsystem. (b) Performance of the alliance. (c) Stability of the alliance.
Sustainability 12 06547 g016
Figure 17. (a) Effect of the failure of environmental fluctuation coping strategies (EFCS) and customer management strategies (CMS) on environmental stability. (b) Effect of the failure of strategy 1 on environmental stability. (c) Effect of the failure of strategy 2 on alliance stability. (d) Effect of the failure of strategy 3 on alliance stability.
Sustainability 12 06547 g017
Figure 18. (a) Impact of change in trust (TRU) and information symmetry (IS) on membership stability. (b) Impact of change in TRU and IS on relationship stability.
Sustainability 12 06547 g018
Figure 19. Impact of change in market price fluctuation (MPF) and timeliness requirement (TR) on environmental stability.
Sustainability 12 06547 g019
Figure 20. (a) Relationship between stability control cost and alliance stability. (b) Relationship between stability control cost and performance. (c) Critical value of cost of control strategies for alliance stability. (d) Critical value of cost of control strategies for alliance performance.
Sustainability 12 06547 g020
Figure 21. Logistic workflow of the HASC alliance.
Sustainability 12 06547 g021
Table 1. Detailed information about investigated local costumers.
VariableDescriptionFrequencyPercentage
GenderMale15552.01%
Female14347.99%
Age18–3016154.03%
30–39 4214.09%
40–494214.09%
50–593812.75%
≥60155.03%
EducationBelow high school degree5418.12%
High school degree3913.09%
Bachelor’s degree11337.92%
Graduate degree3812.75%
Post-graduate degree5418.12%
EmploymentWorkers10836.24%
Students9130.54%
Part-time206.71%
Self-employed3411.41%
Retired 3311.07%
Other124.03%
Family statusLive alone11036.91%
Couple without children7324.50%
Couple with children8127.18%
Other3411.41%
Income (RMB per month) Low (<3000)13946.64%
Low to mid (3000–6000)10735.91%
Mid (6000–9000)3210.74%
Mid to high (9000–12,000)155.03%
High (>12,000)51.68%

