2. Methods
The European Commission strongly recommends that European towns and cities of all sizes should embrace its concept of Sustainable Urban Mobility Plans. The urban population is rapidly increasing and this is accompanied by rises in air pollution, traffic congestion, and vehicle fleet. Due to the inevitability and intractability of such effects, much scholarly attention has been directed towards identifying the influencing factors behind urban transport.
Having noticed the dynamic increase in sustainable perception of urban transport represented by a growing number of research and publications on the subject and identifying the EU priorities that require moving towards cities with sustainable and more environmentally friendly transport, the authors came with the following research questions:
What are key priorities and sources of financing for the development of sustainable urban transport?
What are the students’ preferences regarding the use of public transport in the context of sustainable development?
To answer these questions, the authors decided to structure the methodology into the following stages:
- (a)
Literature analysis on the research subject;
- (b)
Analysis of EU documents and national policies with respect to financing for the development of sustainable transport and key priorities in Poland and Norway;
- (c)
Development of a questionnaire on sustainable urban transport in Oslo and Poznan;
- (d)
Collecting and analyzing respondents’ answers;
- (e)
Defining recommendation concerning future sustainable urban activities in the surveyed cities.
The first stage of the work was the review of the literature and documentation referring to sustainable urban transport, sustainable city transport, and green mobility as well as European Union regulations in terms of sustainable urban mobility plans.
The next stage of the research was a survey among inhabitants of Poznan and Oslo targeted to students, as this is the group that often uses public transport in both cities. The survey was conducted by a CAWI (Computer-Assisted Web Interview—website assisted) method. The questionnaire developed by the authors consisted of 64 questions (In this article, the authors will present selected questions from the survey and discuss the results obtained.). The main section comprised questions on means of transportation, available public transport options in a given city, and assessment of time, cost, and distance of public transport. The other sections were dedicated to particular means of transportation such as urban bikes, public transport (buses/trams etc.), carsharing, electric kick scooters, small urban buses, urban scooters, and other means of transportation. Most of the answers available use a Likert scale—a five-point scale used to measure respondents’ agreement with a variety of statements by means of unipolar scales.
Hence, the authors provide a review of the actual sustainable urban mobility situation in Oslo and Poznan, compare government support and sources of funding, identify gaps in terms of EU requirements, and try to compare residents’ expectations with the city’s activities in the field of sustainable transport development based on the research group.
Considering the current and planned actions taken by the authorities of European cities in the field of shaping the urban transport system, it seems particularly important to carry out research on the expectations of users of this system. In conducting urban transport policy, not only should the priorities and guidelines defined at the European and national level be taken into account, but also—and perhaps, above all—the preferences of city dwellers.
This research topic seems to be crucial for the next decades. On the one hand, this subject has been raised for years by researchers and scientists; on the other hand, this subject requires constant changes due to the development of modern technologies. We are witnessing profound changes in the way mobility is evolving, enforced by progresses in Information and Communication Technologies, Big Data, technological advancements in transport, and new concepts of operation of transport systems.
3. Literature Review
The term “sustainable development” was introduced in 1980 and was popularized in 1987 in the Brundtland Report—a report of the World Commission on Environment and Development. The Brundtland Commission defined sustainable development as “development that meets the needs of the present without compromising the ability of future generations to meet their own needs” [
10].
Another definition was suggested by Paul Hawken: “The word sustainability can be defined in terms of carrying capacity of the ecosystem, and described with input-output models of energy and resource consumption. Sustainability is an economic state where the demands placed on the environment by people and commerce can be met without reducing the capacity of the environment to provide for future generations. It can also be expressed in the simple terms of an economic golden rule for the restorative economy: Leave the world better than you found it, take no more than you need, try not to harm life or the environment, make amends if you do” [
11].
Contemporary use of the term sustainability is broad and difficult to define precisely [
12]. An extensive literature review can be found in Mensah’s paper [
13]. The paper contributes to the discourse on sustainable development (SD) by clarifying further this concept and/or paradigm, and its implications for human thinking and actions in the quest for sustainable human development
The four pillars of sustainability are cultural vibrancy, environmental responsibility, economic prosperity, and social justice. Unfortunately, limiting environmental resources results is limiting human, financial, and cultural capital [
14].
As the concept of sustainability moves to the forefront of global culture, businesses and governments alike are striving to incorporate economic, environmental, and social considerations into their decision making. Depending on how developed a country is, sustainable land development can take form in a variety of ways. Without sustainable development, it is becoming a widely accepted fact that natural resources will be irreversibly depleted, leading to the planet’s failure to sustain life [
15].
Hák, Janoušková, and Moldan [
16] have argued that transforming global society, environment, and economy to a sustainable one is one of the most difficult tasks confronting man today, since it is to be done within the context of the planet’s carrying capacity.
Based on the foregoing, contemporary theories of sustainability seek to prioritize and integrate social, environmental, and economic models in addressing human challenges in a manner that will continually be beneficial to humans [
17,
18].
Therefore, it can be stated that a sustainable development aims at achieving social progress, environmental equilibrium, and economic growth [
19,
20].
It is argued that the sustainable development goals entail complementarities or synergies as well as trade-offs or tensions which have implications for global and national contexts.
Sustainable transport is one of the very important aspects of sustainable development. Almost one in three European cities will see their population increase by more than 10% in the next 30 years. This is likely to result in more road traffic and greater use of underground and rail services, the capacity of which could reach its limits [
21].
There are many definitions of sustainable transport and of the related terms sustainable transportation and sustainable mobility [
22].
Mobility can be seen as a complex socio-technical system [
23] that stays at the intersection between infrastructural design and human behavior. Mobility is first an engineering challenge related to urban infrastructure improvement [
24]. Complex infrastructures providing transport and communications have indeed been classified under the so-called ‘engineering systems’ [
25].
Mobility is a key aspect of sustainable urban development. Sustainable urban mobility is constantly challenged by urban dynamics that influence mobility (changes in transportation infrastructure, means of transport, mobility needs, density of people and activities, etc.). Sustainable urban mobility is defined as “sustainable movement of people and goods within an urban geography”, where sustainability “contributes to cities being able to function in a way that minimises air and noise pollution, contributes toward targets to reduce CO2 emissions, promotes economic development of the city, enables good levels of mobility for people and goods, and is affordable to users and taxpayers” [
26].
Urban mobility of the future faces many changes that are taking place: new vehicles, changes in vehicle ownership and use models; mobile technologies that equip and empower individuals, etc. [
27].
The sustainable mobility approach requires actions to reduce the need to travel (less trips), to encourage modal shift, to reduce trip lengths, and to encourage greater efficiency in the transport system [
28]. Although it is debatable, even some authors think that some European cities have shown that it is possible to decouple urban traffic growth from economic growth [
29]. Several research areas can provide theoretical, methodological, and applied insight into the development of sustainable mobility. In the last ten years, the mobility problem has been analyzed from different perspectives relating to policy and vision [
3,
4,
5], conceptual frameworks [
28,
30,
31,
32], social change and learning [
33,
34], and socio-technical experimentation [
35,
36].
At the UNCED (United Nations Conference on Environment and Development) in 1992, national governments endorsed Agenda 21, which states that various sectors of human activity should develop in a sustainable manner. Sustainable transportation is the expression of sustainable development within the transportation sector (sustainable mobility is a synonym used by the European Commission) [
37]. The conference entitled Towards Sustainable Transportation was held in Vancouver during the period 24–27 March 1996. It was organized in response to the concerns of governments that transportation poses severe challenges for sustainable development.
The United Nation Sustainable Development Goals (UNSDGs) were introduced in September 2015 to describe a distinctive management approach of managing global challenges in multiple spheres of human and natural capital for sustainable development globally [
38].
The Sustainable Development Goals (SDGs) are the United Nations General Assembly’s current harmonized set of seventeen future international development targets. The Official Agenda for Sustainable Development adopted on 25 September 2015 has 92 paragraphs, with the main paragraph (51) outlining the 17 Sustainable Development Goals and its associated 169 targets. Among these goals are: Infrastructure—Build resilient infrastructure, promote inclusive and sustainable industrialization, and foster innovation; Habitation—Make cities and human settlements inclusive, safe, resilient, and sustainable; Climate—Take urgent action to combat climate change and its impacts, ensuring that both mitigation and adaptation strategies are in place [
39]. As Awan noted, the aim of the United Nations Sustainable Development Goals focuses on achieving a common future for all [
40].
Traffic is one of the major development problems of any major city of the developing world and a major contributor to greenhouse gas emissions. The growth of transport activity raises concerns for its environmental sustainability. In 2017, 27% of total EU-28 greenhouse gas emissions came from the transport sector (22% if international aviation and maritime emissions are excluded). CO2 emissions from transport increased by 2.2% compared with 2016 [
41].
The trends of urban development are exogenous trends that have exacerbated the challenges of the urban freight system. To respond to these challenges, urban logistics providers have devoted efforts to finding appropriate endogenous solutions to promote sustainability, effectiveness, and security [
42].
According to Sustainable Urbanization Strategy [
43], the lack of an integrated and efficient public transport system meanwhile, severely hampers mobility and accessibility to social and economic activities (particularly for those unable to afford private cars), while also increasing pollution, traffic hazards, and costs to deliver public services.
Recently, in the most developed economies of the European Union, a clear increase in the number of trips by means of public transport has been observed, which is a consequence of continued deterioration of road traffic conditions despite investing huge amounts of money in road infrastructure. Insufficient capacity of roads, streets, and intersections in particular, relative to very big traffic flows, downgrades the quality of travel and causes more and more congestions on an increasing portion of road networks, not only at rush hours [
44]. Moreover, it results in increased expenses on infrastructure maintenance [
45].
In 2007, the Commission presented the Green Paper “Towards a New Culture for Urban Mobility” [
46]. This Green Paper marked the starting point for a broad consultation with all relevant stakeholders on possible EU action. The consultation confirmed the added value of EU-level intervention in a number of urban transport-related areas. As a consequence, the European Commission published in 2009 an Action Plan on Urban Mobility [
47] with 20 concrete EU-level actions to be implemented by 2012. Subsequently, several initiatives were announced on urban transport in the 2011 Transport White Paper “
Towards a single European Transport Area” [
48].
The main source of EU funding for urban mobility is the European Structural and Investment Fund (ESIF), at 16.3 billion EUR in 2014–2020. In addition, the Connecting Europe Facility (CEF) for transport has provided over 200 million EUR to a number of larger EU cities [
49].
Urban mobility studies have been conducted in Brazilian cities [
50], in the Boston area [
19], in Asiatic countries [
51], and in European cities [
52,
53,
54,
55].
Several cities do not have yet clear visions of what their mobility systems will look like in the future and clear strategies for getting there, with an exception of some cities/countries that already have prepared long-term strategies for transport planning [
55].
The acceleration of technology evolution is changing urban mobility at a much faster pace than we have seen in previous decades, leading to an increasingly uncertain future [
55].
According to Guidelines on SUMP [
56], the Sustainable Urban Mobility Plan should be developed based on the following phases: phase 1—preparation and analysis; phase 2—strategy development; phase 3—measure planning; phase 4—implementation and monitoring. The first version of these Guidelines for Sustainable Urban Mobility Planning was published in late 2013. Many cities in Europe and around the world have developed SUMPs, while numerous European Union-funded projects and programs have contributed valuable knowledge that has helped cities to develop this new generation of mobility plans.
SUMP defines “A Sustainable Urban Mobility Plan is a strategic plan designed to satisfy the mobility needs of people and businesses in cities and their surroundings for a better quality of life. It builds on existing planning practices and takes due consideration of integration, participation, and evaluation principles” [
56].
Nowadays, we must remember that the development of transport is not only a sustainable trend but also the implementation of intelligent solutions. In the era of the fourth industrial revolution (i.e., Industry 4.0), innovation is transforming manufacturing plants, logistics processes, and also transportation systems and networks. Deloitte predicts that by 2040, up to 80 percent of urban passenger miles could be in shared autonomous vehicles [
57]. The World Economic Forum (WEF) recently released a community paper,
Transforming Infrastructure: Frameworks for Bringing the Fourth Industrial Revolution to Infrastructure that outlined how transport leaders could reinvent their industry [
58]. Technology touches every aspect of a smart city and integrates all stakeholders. An intelligent transportation monitoring system uses big data analytics to determine traffic patterns and ensure smooth flow of traffic by adjusting traffic lights and signals. Sustained multi-stakeholder partnership is crucial for advancing the technological transformation of infrastructure, ensuring that the fourth industrial revolution’s benefits in life are as ubiquitous as the infrastructure people use every day [
58].
Satisfying mobility for both people and goods is essential for the vitality of cities, and a proper functioning transport system is vital for a good life in each city.
A large number of scientific articles and other studies prove that the subject of sustainable transport is an extremely current and constantly developing subject. It is undoubtedly a topic that should be explored from different perspectives, such as urban and government plans as well as residents’ expectations.
4. State of Research
4.1. Urban Policy—Strategic Documents in Poland and Norway
European cities are increasingly contributing to the development of a more sustainable urban system. This system is able to cope with ecological challenges as well as social inequalities in various national countries and regions throughout Europe. According to United Nations forecasts, 83% of the European population (nearly 557 million) are expected to live in cities by 2050 [
59]. This change will bring a new set of challenges for city authorities, namely: how to provide the urban population with sufficient water, energy, and waste services, as well as how to manage transport infrastructure sustainably. For successful urban mobility, all transport modes have to be considered equally.
The development of sustainable transport in cities is part of the so-called urban policy. In the next part of this section, the most important urban transport strategic documents in Poland and Norway will be discussed.
In Poland, there are three main documents: the Strategy for Responsible Development until 2020 (with a perspective to 2030) (SRD) [
60], the National Strategy for Regional Development 2030 (NSRD) [
61], and the National Urban Policy (NUP) [
62]. These documents set out the main lines of action and define the main challenges that face cities. On the other hand, a national strategic document related to transport issues is the Strategy for Sustainable Development of Transport until 2030 [
63].
One of the areas described in the Strategy for Responsible Development is transport. According to this document, the number of passenger cars in Poland is persistently growing (more than a twofold increase since 2000). An unfavorable factor is the fact that the average age of cars used in Poland is higher than the EU average, causing a negative impact on the natural environment. It is influenced by the progressing suburbanization of large urban centers, where transport problems are one of the development barriers. They also restrict the range of labor markets and possibility to meet the urban labor market needs by rural residents. It should be noted that this situation is partly due to the suboptimal functioning of public transport systems in cities and their insufficient accessibility for residents (mainly urban-rural and rural areas).
The situation presented above is caused, among others, by the lack of integrated spatial and functional public transport on offer in cities, low use of the so-called Intelligent Transport Systems (ITS) (Intelligent Transport Systems—systems using information and communication technologies in the field of road transport, including infrastructure, vehicles and its users, as well as in the areas of traffic management and mobility management or for interfaces with other types of transport), insufficiently developed infrastructure, and a lack of modern, low-emission rolling stock. In addition to the noticeable dysfunctions in the transport system, rolling stock is worn out and significantly increases emissions in cities. Moreover, existing public transport systems do not sufficiently address the demographic challenges of an aging society and variable preferences of older people—abandoning the use of passenger cars for public transport. Attention is drawn to the fact that rail transport and their integration with urban public transport systems are of particular importance for improving public transport in cities.
According to the provisions of the SRD, integrated public transport systems are to be developed in cities using low emission means of transport, especially rail vehicles and electric buses. Eco-mobility chains are also to be created to improve cycling and walking conditions. Cities shall be better connected with functional areas, whereas individual car transport will be limited, especially in city centers. The above activities are also part of the European Union’s transport policy, as set out in the White Paper of the European Commission [
64]. The authors want to highlight selected goals from this policy:
- (1)
Ensuring growth in the transport sector and supporting mobility while achieving the 60% reduction target;
- (2)
Creating an effective network of multimodal travel and transport between cities;
- (3)
Development of clean urban transport and commuting opportunities.
The directions of actions specified in the National Strategy for Regional Development 2030 (NSRD) [
61] are consistent with the SRD provisions. Strategic goals regarding urban transport are included in challenge 5—
“Development of infrastructure increasing competitiveness, investment attractiveness and living conditions in regions”. The document notes that existing public transport systems do not encourage the abandonment of passenger cars and do not sufficiently reflect the demographic needs of peripheral areas (low population density and an aging population). The most common problem is the lack of integrated spatial and functional public transport services, including a pricing policy encouraging changing of urban transport habits. In many cities, the scarcity of convenient connections as well as the shortfall of modern, low-emission rolling stock is still noticeable.
Therefore, the strategic directions of urban transport development are the expansion and integration of traffic management systems and passenger information systems, the gradual replacement of the rolling stock used to provide public transport services with ecological, low-emission, and adapted for the elderly and people with disabilities, as well as creating conditions for the development of mobility using drives and alternative fuels, including electromobility and low-emission collective transport [
61].
The National Urban Policy 2023 (NUP) is a tool dedicated to the implementation of strategic goals for cities. Its strategic goal is to strengthen the ability of cities and urban functional areas as well as to create sustainable development, jobs, and improve inhabitants’ quality of life. The document defines ten main areas, among which transport and urban mobility can be found [
62]. In accordance with the provisions of this document, the goal of the local government’s activities should be to achieve a sustainable mobility in the functional area of the city, i.e., traveling in such an amount and of such a length as results from satisfying the life needs of travelers traveling rationally using individual urban transport subsystems. The rational use of subsystems means that such choices are made by travelers that do not cause undue time losses and excessive costs in the overall balance. Attention is drawn to the fact that efforts to change commuting behavior should be a key priority. The objective is to reverse the trend of increasing dependence on daily use of a passenger car. In the case of coordination of whole activities affecting the residents’ lifestyle changes, it is possible to achieve the aforementioned goal. These activities should build and offer alternative transport options which assist in changing urban mobility. One of such methods is so-called speed zoning using engineering and organizational solutions. City councils should definitely switch to a new approach in this area and solutions based on slowing down car traffic, preferring bicycle traffic, and encouraging walking. The NUP also notes that investments in the public transport system should be prioritized. However, due to the fact that the implementation of investments in the area of public transport generates future expenditures on system performance, in this context, the basis of investment decisions on a reliable economic calculation is of particular importance.
The public transport activities comprise, among others: solutions for privileged transport (e.g., bus lanes, separate bus routes, priorities for tram traffic at intersections, etc.), preparation and organization of operational interchanges, providing convenient access routes to stops and stations, rational location of park and ride or bike and ride points, construction of bike infrastructure, i.e., elements significantly broadening the impact of public transport, as well as launching comprehensive and interactive passenger information. At the same time, actions should be taken to encourage residents to use public transport by connecting it with the main public spaces and services in the city. The crucial component of city transport development is the creation and evolution of innovative traffic management and monitoring systems—ITS—where the possibility of using cheaper solutions (e.g., bus lanes, priority for public transport, limiting the transit function for cars) cannot be applied.
ITS should support the change of mobility through the development of dynamic passenger information, facilitating the use of public transport, especially in the event of disturbances. The wide availability of mobile communication systems will also allow current traffic information, parking spaces availability, optimal transport connections, etc. The aforementioned solutions will increase the efficiency of the communication system and improve traveling conditions.
According to the provisions of NUP, an extremely important element of an urban transport policy must be the planning and conducting of comprehensive actions in order to change a mobility model towards green and sustainable mobility. Actions taken at all levels of central and local government must be aimed at reducing the role of a passenger car in favor of other modes of transport. The demand for alternative transport means can be carried out through mobility management tools for planning, coordinating, organizing, and controlling the movement of people within the framework of Sustainable Urban Mobility Plans prepared by the European Commission and prepared by the city authorities.
The main method to achieve the above goal is to ensure an efficient service of urban areas by the public transport system, which reduces the need to use a passenger car or even limits the sense of having it. Legal, technical, and organizational activities, reinforced by economic factors included in the system determining the amount of fees, ticket tariffs, and tax solutions implemented consistently and comprehensively will contribute to better commuting behavior of inhabitants. The introduction of solutions promoting public transport should be supported by actions, leading to the perception of the bicycle as an independent means of transport. It should be implemented by creating an urban bicycle infrastructure ensuring 100% availability of bicycles by potential sources and destinations.
Public bike systems should be developed and integrated in parallel with other transport modes, followed by a public car system (e.g., with electric drive). This last solution, as well as others, known from Western European countries, operating on the principle of car sharing, can become a real mechanism for limiting the use of the car by residents only to the situation when it is actually necessary. These solutions should be developed by local governments and where direct public action is not justified, at least widely promoted, and supported.
The last of the strategic documents that should be mentioned in the context of sustainable urban transport in Poland is the Strategy for Sustainable Transport Development until 2030 (2019). The main goal of the national transport policy presented in the strategy is to increase the country’s transport accessibility and to improve the safety of traffic participants and the efficiency of the transport sector. From the point of view of the subject of this article, attention should be paid to the following actions:
- (1)
Change in individual and collective mobility (promotion of collective transport);
- (2)
Improvement in the safety of traffic participants;
- (3)
Reduction in the negative environmental impact of the transport.
It is worth noting that the implemented urban transport activities are in line with the European Union’s priorities in the field of urban transport, i.e., urban mobility plans, the use of public transport on a wider scale, the promotion of alternative forms of urban movement [
46,
65].
In Norway, at the national and local level, we can distinguish a few documents, strategies, and plans, managing directions of investments and changes implemented in the scope of urban transport. Furthermore, the authors present the most important of them.
The 2018 White Paper on Rural and Regional Policy [
66] is the latest regional policy framework in Norway, in which comprehensive plans for land use, housing, and transportation have been proposed for the whole Oslo area.
In Norway, in 1998, the government directed four transport agencies to prepare a joint proposal for the first long-term national transport plan. The official steering documents comprise: National Transport Plan, Action Programme, Annual National Budget, Appropriation, Projects.
The current government has made transportation one of its main priorities. A key objective is to implement the highly ambitious National Transportation Plan 2018–2029 [
67] and to develop a transportation system emphasizing value creation, safety enhancement, and development of a low-carbon society. The National Transport Plan is published by the Ministry of Transport and Communications, but the main actors in preparation are the state transport agencies and the state-owned company—Avinor. The National Transport Plan is submitted to the Storting (the Parliament) in the form of a White Paper every four years. The National Transport Plan 2018–2029 was presented to the public and submitted to the Storting in April 2017. This is the fifth plan under the current planning system. NTP point out that in the largest urban areas, public transport must be strengthened to the extent necessary to ensure that the growth of passenger transport in urban areas can be absorbed by public transport, cycling, and walking [
67].
The Climate Agreement means that passenger growth in large cities will be absorbed by public transport, cycling, and walking. To follow up this objective, a new way of organizing transport policy in Oslo’s urban areas is already introduced and furthermore, will be developed. The new urban environment agreements entail a more comprehensive approach in urban policy, whereby the government, county authorities, and municipalities unite in negotiations and undertake to pursue joint objectives enshrined in the urban environment agreement. Such mutual urban environment agreements are a new way of organizing the collaboration between central and local authorities. The urban environment agreements will include targets and measures for increasing public transport use, cycling, and walking, and measures to reduce the use of cars and land to support environmentally friendly transport. In the long term, this will enable most people to use public transport for city travel [
68].
In Norway, the report “One year closer 2019. Norway’s progress towards the implementation of the 2030 Agenda for sustainable development” was elaborated. It comprises 17 goals and some issues connected with urban transport are covered by Goal 9—Build resilient infrastructure, promote inclusive and sustainable industrialization, and foster innovation and Goal 11—make cities and human settlements inclusive, safe, resilient, and sustainable. Ensuring sustainable urban development while accommodating population growth in the future will be challenging. The government is working continuously to develop more efficient and effective frameworks and tools, in partnership with cities and local government authorities.
Sustainable, inclusive, livable, and attractive cities and other urban areas are important priorities for the Norwegian Government. The goal for major urban areas is zero growth in climate gas emissions. To achieve this “zero growth goal”, growth in passenger traffic should be achieved by public transport, cycling, and walking. Four urban areas have committed to the goal by signing urban growth agreements. The agreements between municipalities, counties, and the state include a reward scheme for public transport. The government will begin negotiations for five more urban areas. The purpose of these agreements is to focus on transport and land use as means to reduce car emissions and congestion.
Norway supports the global BreatheLife campaign, which mobilizes communities around the world to take action to reduce air pollution and limit climate change [
69].
According to OECD Economic Surveys, Norway will need to substantially reduce transport-related greenhouse gas emissions to achieve targets. Norway has long been encouraging zero-emission vehicles. In addition to further development of public transport, innovative new approaches to transport should be considered. One option is massed ride sharing, in which most individual private car rides are replaced by rides in shared taxis or shared minibuses and facilitated by digital platforms. Furthermore, ride sharing intensifies car use, which means the comparatively high purchase prices of electric vehicles is more strongly offset by the gains from low marginal running cost [
70]. Policy actions to achieve massed ride sharing could include support for digital platforms, adaptations to metropolitan infrastructure, for example, access routes for shared rides to rail stations, alongside demand-side measures to encourage and/or enforce shared rides to replace individual car rides [
71].
Oslo strategies for achieving zero-growth or reduction comprise among others: improving conditions for walking and bicycling and improving public transport services. In Oslo, sustainable modes become relatively more competitive than the private car (faster, more comfortable, etc.) It can be observed in the city improved accessibility by bike and foot.
The Transport 2025 programme [
72] addresses a major societal challenge, and is part of the Research Council’s follow up of the objectives set out in the Strategy for the Research Council of Norway 2015–2020: Research for Innovation and Sustainability; the Research Council of Norway’s Strategy for Sustainability, 2017–2020: Research for Sustainable Societal and Industrial Development; the Strategy for the Research Council of Norway for an innovative business sector, 2016–2020; and the Research Council’s strategy for innovation in the public sector, 2018.
Among challenges of above program is urbanization and urban and regional development. According to the Transport 2025 programme, the design and implementation of transport policy instruments is currently divided between the central, county, and municipal levels which are jointly responsible for developing adequate mobility solutions. There is a great need for new knowledge, new innovations, and new working methods that provide more integrated urban mobility solutions [
72].
“Nordic Sustainable Cities” is one of six flagship projects within Nordic Solutions to Global Challenges, an initiative launched by the Nordic prime ministers. Nordic Sustainable Cities directly links to the United Nations’ Sustainable Development Goal (SDG) 11: Make cities inclusive, safe, resilient, and sustainable.
The project “Attractive towns: Green redevelopment and competitiveness in Nordic urban regions. Towns that provide a good life for all” was launched in 2017. The overall goal of this project is to find ways to create attractive and sustainable towns. One of the spatial dimension strategies is developing of a sustainable mobility system. It assumes that promoting slow traffic conditions and car sharing can be ways to develop a more sustainable urban mobility system without reducing accessibility for certain areas, social groups, or demographical changes (i.e., aging population) [
73].
According to The Norwegian Government’s strategy for cooperation with the EU 2018–2021, the government will seek to ensure that the transport sector makes its share of emission reductions, so that they can fulfil our obligations under the Paris Agreement and Norway’s 2030 climate commitment. Norway would like to see more stringent European emission requirements for cars, vans, and heavy vehicles, as this would encourage the development of more energy-efficient vehicles, increased use of new technology, and greater emission reductions in the transport sector [
74].
4.2. Sources of Funding for Urban Transport in Poland and Norway—The Actual State
The sources of financing investments in the field of sustainable transport development in cities are funds from the European Union budget and national public funds.
In the 2014–2020 programming period, urban transport is supported from the national level by the Infrastructure and Environment Operational Program and the Eastern Poland Operational Program, as well as from the regional level by the Regional Operational Programs. The decision regarding the allocation of significant funds for the development of transport in cities resulted from the previous diagnosis. Despite the existing public transport support, the main problems are likewise a congestion of urban infrastructure with individual road traffic and an insufficiently developed public transport system. The increasing congestion of streets with individual traffic leads to an increase in the cost of transporting goods and people, and the progressive degradation of urban road infrastructure. Moreover, it negatively affects environmental status, health of inhabitants, and comfort of living in cities. Therefore, a necessary condition to improve the quality of urban space and reduce traffic nuisances will be to reduce automotive congestion in cities by creating an attractive alternative to individual car communication.
In the Operational Program Infrastructure and Environment 2014–2020 (OPI&E-pl. POIiS) [
75], actions for sustainable mobility were included, among others, under objective 4—Supporting the transition to a low-carbon economy in all sectors. These activities are complementary to driving traffic out of cities (construction of bypasses or exit routes). Combining these types of interventions has the chance to bring the effect of improving the quality of urban space and reviving city centers. Implementation of transport investments will be accompanied by activities to increase safety, including ITS implementation, retrofitting of rescue and traffic control services, and institutions involved in conducting campaigns and trainings on traffic safety.
Under objective 4, some activities related to shaping mobility (including sustainable multimodal urban mobility) may also be supported. Investments contributing to the development of sustainable urban transport are part of the following priority axes of OPI&E:
Support under priority axis IV is, among others, envisaged for investments that will result in the removal of traffic from cities and improvement of road safety. The objective of priority axis VI is a greater use of low-carbon urban transport through the development and integration of public collective transport systems in cities. The purpose of priority axis VI is greater use of low-carbon urban transport through the development and integration of public collective transport systems in cities. It is assumed that the actions will reduce the congestion in cities, improve traffic flow, and reduce the negative impact of transport on the natural environment in cities and their functional areas. The support is granted for investments in the development of public transport, designed to increase its safety, quality, attractiveness, and comfort.
The expected projects include aspects reducing/minimizing the impact of noise/vibration/air pollution and elements promoting sustainable development of the urban layout. In cities with rail transport (trams), the development herein of a branch of public transport is preferred, primarily through investments in rail infrastructure.
Purchases of vehicles with alternative propulsion systems (electric, hybrid, biofuels, hydrogen, etc.) will be prioritized. The investments can be both infrastructural (construction, reconstruction, expansion of the network, interchange centers, and elements of road and street equipment with infrastructure serving public transport and passengers) as well as rolling stock. There are also projects with other elements complementary to the basic linear infrastructure, including ITS, improving the functioning of the entire transport system. Projects cannot cover repair works and maintenance of the infrastructure.
The allocation of funds for 2014–2020 in the Operational Program Infrastructure and Environment in priorities IV and VI are presented in
Table 1.
The RPO envisages investments to improve safety and traffic capacity on regional roads, among other things, in cities. The implemented urban transport activities are in line with the EU priorities for urban transport, i.e., urban mobility plans, the use of public transport on a larger scale, promotion of alternative forms of urban mobility.
The Eastern Poland Program is a separate financing instrument for investments in sustainable transport in cities. It is an additional financial support instrument for five voivodships of Eastern Poland: Lubelskie, Podlasie, Podkarpackie, Świętokrzyskie, and Warmian-Masurian, which is a supplement and strengthening of activities carried out under regional and national programs for 2014–2020. Activities in the field of sustainable transport are envisaged under priority axis II—Modern transport infrastructure.
Under priority axis II, investments in creating new or expanding existing ecological integrated urban transport networks and improving the transport systems of five voivodship cities, i.e., Białystok, Kielce, Lublin, Olsztyn, and Rzeszów, together with their functional areas or ITI implementation areas, can be implemented. In provincial cities, these activities are covered by the 4th thematic objective and there are 506,012,230 EUR planned for their implementation, of which 430,110,395 EUR are from the EU budget and 75,751,835 EUR are from national funds from the state budget [
76].
Meanwhile, in Norway, the most important source of funding is public support. Important funding solutions in the current Norwegian model include public transfers in the form of state and county grants, user fees, and government grant schemes such as the Ministry’s incentive scheme to improve public transport and reduce the use of cars in urban areas. In sum, these elements constitute a framework of formal and legal procedures for financing. The Transport programme provides funding for research, innovation, and pilot projects in the transport field.
The total national framework for transport is NOK 933 bn, based on the information presented in the National Transport Plan 2018–2029 [
66]. There is a strong increase in government funds for urban areas—in total, NOK 66.4 bn for the period covered by NTP.
The government intends to allocate 66.4 billion NOK during the plan period to urban areas through urban environment agreements, urban growth agreements, and the reward scheme for public transport. The government also intends to allocate 24 billion NOK to measures for public transport, cycling, and walking. Furthermore, the government will set aside 17.2 billion NOK to the reward scheme for public transport and will allow for the use of funds to be spent entirely on the public transport operation. A significant part of the transport growth can be covered by cycling and walking if suitable conditions are put in place. An important aspect of this transport plan is to target efforts to increase the numbers of pedestrians and cyclists through urban environment agreements and urban growth agreements. In some urban areas, the building of cycle superhighways may be introduced.
The Reward Scheme rewards urban areas that implement measurable steps to improve the competitiveness of public transport at the expense of private vehicle traffic. Increased cycling provides better traffic flow, a cleaner environment, and other social benefits, particularly in terms of better health. The government aims to increase the cycling share from the current 4 per cent to 8 per cent by the end of the plan period and will set aside NOK 8.2 billion (EUR 1 billion) for measures for cyclists and pedestrians.
On May 15 2019, the Oslo Package 3 report, Action Plan 2020–2023, was issued, specifying the amount of funds allocated to the development of various elements of urban transport [
77].
4.3. Sustainable Development in Poznan and Oslo—Plans and Perspectives
4.3.1. Poznan City
The Ministry of Infrastructure, based on the Sustainable Transport Development Strategy, promotes implementation in the cities of Sustainable Urban Mobility Plans (SUMP). SUMP is a local strategic document, which holistically responds to the problems and challenges of transportation in cities. Those plans are not obligatory, but many Polish cities adopted SUMPs. Many initiatives on the national level promote and support wider implementation of those plans.
The Plan for Sustainable Development of Public Transport for the City of Poznan for 2014–2025 [
78] was adopted in its original version in 2014, and then, it was updated in 2019. One of the main strategic goals of the transport policy of Poznan is the expansion/development of public transport. It is noted that the area of Poznan city is an integral part of the entire Poznan metropolitan area as well as the Poznan district. It is also pointed out that it is necessary to use and integrate various means of transport, such as metropolitan railways, suburban bus lines, urban bus lines, and tram lines. The vision of public collective transport is not only the development of infrastructure, but also a number of organizational, legal, and promotional activities shaping transport behavior of the inhabitants of the Poznan metropolitan area. Therefore, the integration of transport systems is a crucial. The passenger should not wonder whether to choose communal buses, marshal’s railways, or urban transport. The passenger should receive public collective transport as one system to ensure the best connections. It is, therefore, important to ensure that the passenger receives one coordinated timetable, one ticket, a common passenger information system, and even, where possible, the same marking of vehicles or stops. Achieving such integration is a very difficult task. The best solution would be to create a joint unit of individual self-governments dealing with the organization and management of transport. Actually, this is impossible (transport associations can only create local government units of the same level), but legislative work is being conducted to create such a possibility.
Another aspect raised in the document is the fact that no one should be excluded from the use of public transport. Transport must take into account the needs of the elderly and disabled people. Barriers to the use of transport must be removed, both in terms of access to the network and vehicles. Transport services should be relatively cheaper so that there is no risk of exclusion due to poverty.
Undoubtedly, the biggest competition for public transport is road transport. Pursuant to the provisions of the strategy, from the point of view of collective transport interest, road transport activities should go in three directions:
Integration of road transport, with public transport occurring mainly through the construction of P + R parking lots. Such car parks should be located at the main entrances to Poznan and in the Poznan metropolitan area at major railway stations. Access from the P + R car park to the city center by public transport should be fast and reliable.
Restrictions for car transport. With the constant increase in motorization and the deterioration of access to public transport resulting from the suburbanization process, there is a need to protect some areas of the Poznan metropolitan area against the effects of excessive car traffic. Bans (entry, parking) can be used, as well as charging to discourage making car trips (as is the case with the Paid Parking Zone). Regardless of the form of the restriction, the area of their application should grow.
Investments in transport. The main purpose of these investments cannot be to improve car traffic. The main goal should be to improve public transport. In this light, the construction of beltways makes sense when we improve the movement of public transport vehicles in the area inside these beltways. All major road investments should include improvement solutions for public transport, e.g., bus lanes, locks, and priorities.
A bike system shall also be developed. Its growth does not limit to the development of public transport and, if properly integrated, may even foster it. Bike rental networks and the construction of R&D car parks will be important elements. The development of the bike route network does not prevent the development of the public transport network; what is more, it is possible in justified cases to use bus lanes for cycling. However, this should not take place over long distances and in places where it is possible to separate or build bike pathways.
The generally presented vision of public urban transport is sustainable transport, allowing for the development of each branch, but taking into account the needs of others, environmentally friendly transport that reduces both gas and noise emissions, and prosocial transport, preventing the exclusion of the elderly, the disabled or the poor, transport accepted by residents of Poznan Metropolitan area, with which they identify and which they willingly use.
In 2015, the so-called intelligent traffic management system was launched under the project “ITS Poznan System”. The project will cover the west of Poznan (OZ). It is recommended to further develop ITS Poznan throughout the entire area of the City of Poznan (in particular, the system of bus stop boards). In connection with the progressing development of mobile telephony enabling Internet access, the possibility of using these devices for broad information on the public transport offered (timetables, travel planning, interchange points) should be taken into account.
Data showing directions of investment expenditures of Poznan city related to the development of sustainable transport in 2017–2020 are presented in
Table 2.
Investment outlay related to the implementation of the assumptions of sustainable urban transport in Poznan in the period 2017–2020 are showing the predominance of expenditure on the modernization and expansion of the tram network. In total, 839.4 million PLN was spent for this purpose in the entire analyzed period, which constituted almost 70% of the discussed group of expenses. Therefore, the city authorities focused on the development of urban transport, with particular emphasis on electrically powered tram lines. Investments in the development of the tram line network are accompanied by traffic restrictions in the city and related investments: reconstruction of transport hubs, construction of P&R car parks, and expansion of the limited parking zone in the city center. At the same time, the city’s network of pedestrian–bicycle paths and bicycle paths is being expanded—expenditure for these purposes in the period under analysis consumed almost 12% of all expenses discussed. In the years 2017–2019, 5.5 million PLN was allocated for the construction of a public bicycle system.
4.3.2. Oslo City
The Ministry Oslo and its sustainable actions are worldwide recognized, and the city is listed on different rankings. The Mobility in Cities Database [
83] highlights how Oslo is one of the global cities with the most promising changes in urban mobility patterns in the last 20 years. For instance, the number of trips made by public transport increased at a faster pace than the population in Oslo, and at a faster pace than in cities such as Vienna and Berlin, but at a slower pace than in Geneva and London.
The ambition of Oslo is to become the leading sustainable city in the world. By following the Oslo Urban Ecology Programme (“The Bykologisk Programme”), Oslo eventually drives to a sustainable environmental city. The transportation plan is another more obvious and main focus in the general development plan. The developments achieved so far are transit, traffic tolls, and auto free zones.
In 2019 and beyond, Oslo acts as an ambassador for sustainable urban development, sharing and promoting best practices that have been tried and tested in this Norwegian city to inspire others to make meaningful environment changes. A total of 56% of all public transport journeys are powered by renewably energy on zero-emissions trams, train, and metro, and public transport journeys have increased by 50% since 2007 [
84].
Oslo’s ‘Climate Budget’, an initiative consisting of 15 separate measures across five sectors, includes energy/building, heating, transport, and congestion from other mobile resources and the maritime sector. Oslo City Council aims to reduce greenhouse gas emissions in the city by 50 percent by 2020, 95 percent by 2030, and to achieve climate neutrality by 2050.
Ruter—the company that covers the greater Oslo region—has set a clear standard for environment-friendly public transport in the future. Ruter has stated that all the modes of transport it operates, including buses, boats, minibuses, and taxis, will become entirely emission free by 2028.
Following agreement with Oslo City Council and Oslo and Akershus County Council, Ruter is participating in a European Joint Hydrogen Vehicle Initiative, JIVE 2, which is part-funded by the EU research and innovation programme “Horizon 2020”. The project intends to promote the commercialization of fuel cell buses, and thus, speed up the timing for when this becomes a more cost-effective and reliable alternative. Ruter can replace the current fleet with a zero-emission fleet by 2027 [
85].
With the managing by Ruter, Oslo has the most extensive public transport system. It includes the six-line Oslo Metro, which runs underground through the city center and operates to the suburbs further away. In addition, there is the six-line Oslo Tramway, which operates the areas close to the city center and the Oslo Commuter Rail, which runs the railways through the country. The bus network also covers the city and it consists of 32 city lines and regional buses to the neighboring county of Akershus. The purpose is to increase rapid communication and consist with environmental concern as well as social communication. The urban structure of public transportation routes run through, connecting the city center, city districts, and transport nodes. The direction to the structure leads to the urban development.
The Norwegian Centre of Expertise (NCE) Maritime CleanTech is developing the high-speed, zero-emission Urban Water Shuttle. Entur company (Entur operates the national registry for all public transport in Norway, collecting data from 60 public transportation operators) works to increase the use of public transport in Norway, and runs a national registry containing data from all public transport operators in the country. These data are open and free for use by app and service developers. Entur also uses the data in a route planner for door-to-door journeys across Norway [
86].
According to the report “Sustainable urban mobility and public transport situation in ECE capitals”, for cities having provided data, the longest network of bicycle lanes is in Oslo. The main network of cycle tracks is to make the bicycles the most used and attractive mode of transport. The track is created with green corridors to follow and also a quick and easy connection between the city center, local urban centers, and transport nodes [
87].
With good planning processes, Oslo city center will become a more sustainable city center with less air and noise pollution, and it can become a city center by that will increasingly attract visitors and shoppers.
The public grants for the operation of public transport in Oslo mainly go through Routes. In addition, the state purchases passenger traffic services from NSB in metropolitan region. Ruter’s task is to develop, plan, order, and market a public transport service as the biggest possible degree and helps to achieve the goals that the municipality of Oslo County Council has set within the financial framework made available. In 2016, public transport was supported 350 million. This is an increase of 16 million compared to the previous year and represents an increase of 4.9 per cent.
The overall bases for the action program for 2017–2020 are Ruter’s long-term plans and strategies. Annual budget letters, organizational and financial frameworks, and decisions in the municipality of Oslo county municipality or the state are premises which are used in the work on the action program. This plan is Handlingsprogram 2020–2023. An annual new investment of NOK 2–4 billion provides increased reinvestment needs. It requires an escalation of the investment and reinvestment grants, such that by 2030/40, it is around NOK 2.5 billion a year for maintenance and reinvestment.
Planned transport expenses from 2017 according to the Handlingsprogram 2017–2020 are presented in
Table 3.
In Oslo, the main direction of development is investments aiming to enlarge and modernize the metro as well as to maintain adequate security for people using this mode of urban transport. Expenses for this purpose in the years 2017–2020 constitute almost 63% of all expenses in the given group. Over 15% are contributions related to the modernization and expansion of the tram network.
Table 4 refers to urban transport expenditures based on the Financial Planning Operational Program 2017–2021 and
Table 5—Revenue in Oslo Package 3 in the period 2020–23 in NOK millions. These tables present financial assumptions of Oslopakke 3 and Handlingsprogram.
Comparing financing contributions related to sustainable development of city transport in Poznan and Oslo, it can be stated that in both cities, completely different rules apply in this respect.
In the Polish public finance system, the expenditure presented (
Table 3) is financed directly from the city budget. It should be mentioned that—in accordance with the principle of material unity binding in Poland—the city’s budget revenues are not targeted. These revenues are mainly local taxes and the city’s shares in the income tax from natural and legal persons. They contribute to the city’s budget and are, then, divided into various spending directions, including expenditure on sustainable transport development. Therefore, a lot depends, in this situation, on the awareness and the will of municipal authorities, who make decisions on what to allocate specific funds to.
On the other hand, a different situation in this respect occurs in Oslo, where a program dedicated to the development of sustainable transport was adopted. This program sets out the objectives for which funds are to be spent, indicating priority actions, and points out the sources of financing for these expenses. The program has a multi-annual character, which means that sustainable development activities are consistent and more stable.
5. Survey Results
As a result of the survey, which was conducted at the turn of January and February 2020 (The results refer to the situation before COVID-19 and do not include restrictions related to the pandemic situation), 1737 responses were obtained from Poznan and Oslo. The respondents to whom the survey was addressed were young people studying at universities. About 25% of respondents also were employed. In terms of gender, 41% were women and 59% were men who took part in the survey.
Table 6 presents structure of the research sample.
The results of the collected student’s responses are presented below.
The first question of the survey asked the respondents what means of transport they use most often.
Figure 1 shows the distribution of respondents’ answers. It can be seen that young people from Poznan and Oslo most often choose public transport, i.e., trams, buses, as the main means of transport (Poznan—almost 95% of respondents; Oslo—73.7% of respondents).
Just over 10% of respondents from Poznan use city bikes. Only 4.5% of respondents use electric kick scooters available in Poznan; currently such means of transportis not available in Oslo. Oslo is not also equipped with urban scooters. On the other hand, in Poznan, only 0.5% of respondents use them. Therefore, the conclusion is that the use of city bicycles, electric kick scooters or urban scooters is poorly developed in the analyzed cities, and therefore, more attention should be given to them in the context of their development and promotion. On the contrary, data from secondary sources show that the city bike network in Oslo is very well developed, which makes it possible to conclude that respondents prefer other means of transport or their own bicycles instead of city bikes.
In Oslo, quite a big number of respondents (15.3%) use carsharing, whereas in Poznan, the level of using carsharing is around 2%. A fairly large group of respondents, as in Oslo and Poznan, prefer to travel by their own car (36.8% and 26.3%, respectively).
The second question concerned the recognition of which of these means of transportation are actually available in specific cities (
Figure 2). Respondents from Oslo indicated that all suggested types of transport are available in the city, but there are no urban scooters and electric kick scooters rental points. Most likely, respondents confused means of urban transport with privately owned means of transport.
The third and fourth question in the survey verified how many respondents spend time on commuting every day (
Figure 3a), as well as what average distance they travel each day (
Figure 3b).
Figure 3a shows that almost 63% of respondents from Poznan require up to 1 h for travel time every day, and about 32% of those surveyed spend 1 to 2 h on travel. In Oslo also, most of the respondents spend to transport up to 1 h—near to 69%.
In turn,
Figure 3b shows that just over 29% of students from Poznan travel daily up to 5 km, 33% from 5 to 10 km/day and 16.4% from 10 to 15 km/day. Quite a large group (13.4% of respondents from Poznan) travels over 20 km every day. In Oslo, the results obtained are very similar to the situation in Poznan, solely more people travel more than 20 km a day (26.3% of respondents).
It was analyzed what means of transport available in the city are used by the largest group of people, i.e., those for whom it takes up to 1 h to reach their destination. Almost 100% of people in both cities (Poznan—95.71%; Oslo—96.24%) use public transport in this case, i.e., trams, buses, etc. Much less (Poznan—10.17%; Oslo—14.12%) use city bikes. The share of using such means of transport as electric kick scooters, urban scooters, or carsharing is much smaller.
In the next and fifth question, the authors asked what is the average monthly amount of charges incurred for transport. In Poznan, students pay monthly near to 13.5 EUR (56 PLN) and in Oslo, 82.36 EUR (959 NOK). In Oslo, such fees are due to significantly higher costs in Norway than in Poznan.
Comparing the costs to average wages in individual countries, it should be noted that the costs dedicated to commuting in Poznan constitute 1.4% in relation to the net remuneration in Poland (average monthly salary in 2019—962 EUR). In Oslo, these costs amount to 2.72% compared to the net salary in Norway (average monthly salary in 2019—3033 EUR). Oslo ranks second in this respect because a smaller percentage of commuting costs in relation to average earnings is paid by respondents from Poznan.
The sixth question refers directly to public transport, and more precisely, the frequency of its use by respondents.
Figure 4 shows that 98.25% of people use Poznan trams and buses. In Oslo, public transport is mainly used by 84.21% of respondents.
A significant difference can be seen in the case of city bikes, which are used by 63.16% of respondents in Oslo and 32.13% of respondents in Poznan. In Poznan, 16.62% of students use electric kick scooters, while in Oslo, it is used by 10.53% of students. The obtained research results draw attention to the need to develop particular types of transportation, as it will directly contribute to the development of green mobility in the city. Less than 4% of respondents use urban scooters in Poznan and 9.15% carsharing. Such mode of transport is not popular because of its cost. On the other hand, 47.37% students from Oslo indicated that they use carsharing. It may also be dictated by the better financial standing of students in Norway.
Figure 5 is the answer to the seventh question—how often do people use public transport? An analysis of the answers obtained indicates that in Poznan, 66.41% of respondents use public transport every day and 22.51% use it at least several times a week. In Poznan, 1.34% of respondents ride a city bike every day and slightly more—2.68%—several times a week. In total, 59.07% of Poznan respondents have never used city bikes. Almost 95% of respondents from Poznan have never used urban scooters, less than 90% have never used carsharing, almost 77% have never used electric kick scooters, and almost 60% have never used city bikes.
In Oslo, similar to Poznan, near to 60% of respondents use public transport every day, almost 16% use it few times a week, and 21.05% several times a year. In total, 10.53% of Oslo respondents practice city cycling several times a month. Slightly more (almost 16% of respondents) use city bikes several times a year. However, the majority (almost 74%) do not use city bikes at all. Additionally, a fairly large percentage of respondents have never used city electric kick scooters (94.74%), scooters (84.21%), or carsharing (78.95%). These means of transport are used, at most, several times a month.
If the frequency of using appropriate means of transport is analyzed in terms of the respondents’ gender, it should be indicated that more women than men use public transport in Poznan every day (72.87% and 61.92%, respectively). When it comes to the daily or several times a week use of city bikes and electric kick scooters, men take the advantage here (city bikes: women—3.13%, men—4.65%; electric kick scooters: women—1.28%, men—2.08%).
In Oslo, women also use public transport more frequently than men (66.67% and 53.85%, respectively). In opposition to public transport, more men than women use city bikes several times a month in Oslo (city bikes: women—4.26%, men—5.75%). There is also a clear a clear advantage of men in using carsharing in both cities.
The eighth question was asked to indicate the level of satisfaction of respondents with the use of specific means of transport (
Figure 6). In total, 59.06% of respondents assess their level of satisfaction as very high or high for the use of public transport in Poznan. Almost 35% of respondents assess their level of satisfaction as average for the use of trams and buses. In turn, 52.88% of respondents are satisfied with the use of city bikes, and 38.12% are average satisfied with the use of a given means of transport. A total of 55.04% of respondents indicate that their level of satisfaction with the use of electric kick scooters is high or very high, while little above 32% of respondents define this level as average. For urban scooters, the figures are: 52.45%—satisfied and very satisfied; 29.37%—average satisfied. With regard to carsharing, almost 64% of respondents described their level of satisfaction as high/very high, and 26.32% as average. It should be noted here that for any means of commuting, the “very low level of satisfaction” option did not exceed even 5%, and the “low level of satisfaction” option 9%, except for city scooters, which received 13.29% of respondents’ answers in a given option. This means that travelers are generally satisfied with the available means of transport in the city of Poznan. It is also interesting that public transport received the smallest percentage of negative answers—6.14% (the sum of the answers “low level of satisfaction” and “very low level of satisfaction”).
In Oslo, the comparison obtained almost 50.15% satisfied answers indicating “very high” and “high” options. In total, 30.64% of respondents are also satisfied with using city bikes and 77.78% of respondents are satisfied with carsharing services. In both cases, the sum of “high” and “very high” answers is taken into account.
The goal of the ninth question was to identify the most important advantages of different modes of public transport (
Figure 7). In Poznan, the respondents indicated that public transport’s (i.e., trams and buses) biggest advantages are accessibility (18.17%), price (65.25%), and travel time (49.56%). As the fourth criterion, the respondents distinguished health and ecology (25.66%). Speaking about city bikes, the respondents consider health and ecology (44.43%), accessibility (31.55%), and price (25.95%) as the biggest advantages. In turn, the biggest advantages of electric scooters are accessibility (23.62%), comfort (18.72%), health and ecology (17.90%), and travel time (17.84%). Poznan respondents use scooters because of travel time (12.71%), comfort (11.37%), and accessibility (8.1%). Carsharing is chosen primarily for comfort (23.44%), privacy (19.94%), and travel time (12.01%).
In Oslo, most respondents selected price as the biggest advantage for public transport (almost 79% of respondents), despite the fact that in this city, prices for public transport are the most expensive. The other circumstances for above transport are availability (63.16% of respondents), health and ecology (almost 32% of respondents), travel time, and comfort (both about 21% of answers). The health and ecology for city bikes was chosen by a similar number of surveyed as in Poznan. Another advantage was price (26.31% of surveyed) and availability (15.79% of surveyed). More respondents than in other cities chose the advantage of comfort for carsharing (almost 32%).
In both cities, the most important advantages of public transport are, therefore, price, availability, and travel time; bicycles as a means of transport are chosen primarily for health and environmental reasons; and carsharing is enjoyed by people who value privacy and comfort.
When analyzing the results in terms of sustainable development, and more precisely, the health and ecology criterion, it is worth noting that a given criterion is more important for women as in Poznan, and also in Oslo. The importance of a given criterion in terms of the analysis of using public transport is perceived by 31.11% of female students from Poznan (22.16% of male students from Poznan), in terms of the analysis of the use of city bikes—52.98% of female students (38.48% of male students) and in terms of the use of electric kick scooters—22.44% female students (14.74% of male students).
In Oslo, the distribution of responses is slightly different. The importance of the health and ecology criterion in terms of the analysis of public transport is noticed by 33.3% of female students and 23.08% of male students from Oslo; in terms of the analysis of the use of city bikes, men have a slight advantage (43.68% of female students and 45.48% of male students).
Men in both cities see other aspects as more important, such as accessibility, comfort, and privacy.
Owing to the tenth question, it was possible to obtain information on how respondents assess the technical condition of individual means of commuting (
Figure 8). The condition of Poznan trams and buses is rated as good by 33.20% of respondents and as rather good by 51.08% of respondents, which in general, constitutes nearly over 84% positive answers. The condition of city bikes in Poznan is assessed as good by 19.79% of respondents and by 40.28% of respondents as rather good. The distribution of answers regarding the electric kick scooters indicated 27.41% of satisfied users and 42.07% of rather satisfied users, respectively. Subject to urban scooters (it should be mentioned that this is the mode of transport that is least often used by respondents in Poznan), the percentage of the highest indications is about 32.97% and the percentage of “rather good” answers is 34.41%. The technical condition of shared cars is evaluated as good by 46.13% of respondents and rather good by 32.87% of respondents. City bikes received the largest percentage of negative responses (16%). Therefore, one should pay attention to a given means of transportation, because the poor condition of bicycles may lead to a collision or accident of road users.
In Oslo, more than 50% of respondents recognized a technical condition of public transport as good and rather good, but also, more near to 36% evaluate this condition as bad and rather bad. This may be due to the varied technical condition of different vehicles in public transport. City bikes, according to the surveyed, are in a good condition (25% of respondents) and simultaneously, in a bad condition by the same number of respondents. The better situation is for carsharing, and 50% of respondents evaluate its technical condition as good and 33.33% as rather good.
In both cities, the technical condition of the available urban mobility modes should be analyzed and, if possible, dependent on technical resources, further improvements should be done.
The eleventh question that the authors will present under this article will be the assessment of the amount of fees for individual means of transportation (
Figure 9). In total, 35.2% of Poznan users determine that the prices of city buses and trams are high or very high. Prices are medium for more than half of users (51.23%). As for city bikes, in 17.47% of cases, fixed usage prices are perceived as high or very high, and in 41.45% of cases, as medium. Poznan respondents estimate the prices for renting scooters and scooters as definitely too high (81.53% and 68.38%, respectively of the indications “very high price” and “high price”). This confirms the previously presented information on the reasons for not using the means of transport. The fee for car renting is also considered as too high (67.90%).
In Oslo, almost 20% of respondents perceive fees for public transport as very high and high. A total of 42% of respondents believe that the level of fees is average, and for 31.58% of respondents, this level is low. Urban bikes’ fees by more than 60% of surveyed are assessed as high and medium (in each group 33% of answers). The level of fees was assessed as low and very low: for carsharing by 33% of respondents, urban scooters by 25% of respondents, and city bikes by 33% of respondents.
There are many aspects that can affect the assessment of the price level of various means of public transport in the cities analyzed. Therefore, detailed conclusions depend on the level of earnings, correlation between the frequency of journeys, and the distance to overcome. The above results show that in Norway, prices are generally perceived as lower compared to Poland, which may be conditioned by the social status of citizens.
In question twelve, the respondents were asked whether they use city bikes and how they assess the infrastructure of bicycle paths in their city (
Figure 10). In Poznan, about 70% of respondents recognized that infrastructure is in good or rather good condition. In Oslo, only about 30% of respondents consider the same. More respondents in Oslo rate cycling infrastructure as bad or rather bad (30%) than in Poznan (about 10%). This may be due to the recent investments of the city of Poznan in improving the bicycle path system and facilities for cyclists while moving around the city. On the other hand, Oslo is perceived as a city with the longest bike paths in the city. The opinions of the respondents may indicate that the city should take steps to modernize the existing infrastructure.
In the thirteenth question, the respondents were asked how they assess the actions of city authorities in the field of promoting and developing infrastructure for city bikes (
Figure 11). Almost 54% of respondents from Poznan indicated that they rated the activities of city authorities as good or rather good. In Oslo, the percentage of positive answers is 43%. In Oslo, there is a higher percentage of respondents compared to Poznan who believe that the city authorities are not involved enough in the promotion and development of infrastructure for city bikes (the sum of answers “bad” and “rather bad”—37%). In Poznan, the same answer was given by less than 14%.
The fourteenth question was to verify whether, according to the respondents, the number of bicycle rental points is sufficient in the analyzed cities. The obtained answers suggest a very similar distribution of answers in both cities. In total, 62.87% of respondents from Poznan believe that the number of bicycle rental points is sufficient, and 37.13% indicate that in their opinion, such points are missing. In Oslo, on the other hand, 60.00% of respondents declare that the number of bicycle rental points is adequate, while 40.00% contradict this claim.
Verifying the reasons for not using city bikes was the aim of the fifteenth question. This question was a multiple-choice question. Almost 71% of respondents from Poznan indicated that they prefer a different mode of transport. In Oslo, around 32% of respondents gave the answer. Apart from the above answer, we analyzed the other reasons for giving up city bike rides. In Poznan, the main reasons turned out to be: a complicated procedure for renting bicycles (26.07% of respondents), lack of comfort (20.30% of respondents), too much distance to travel due to high physical effort (19.55% of respondents), high price (18.16% of respondents), and too long travel time (14.99% of respondents). In Oslo, the respondents’ indications were ranked as follows: too long distance to travel (17.14% of respondents), lack of comfort and bad infrastructure of bicycle paths (11.43% of answers each), too long time of reaching the destination (8.57% of respondents), high price and no bikes nearby (5.71% of responses each)—
Figure 12.
In addition to the available answers, the respondents had the opportunity to indicate their own answer. Among the answers to the most common reasons for not using city bikes in Poznan was owning a bike. In second place was the answer indicating the lack of a bicycle rental point in the nearby area. At the same time, respondents indicated that a small number of bicycle rental points also causes a problem with parking the bike in a convenient place after reaching the final destination. In addition, there were answers regarding the small number of bicycles at the rental points and the inability to take large luggage with them when traveling by a given means of transport. Oslo respondents also pointed to the large distance in reaching bike rental points and the problem of taking the bike to the indicated (inconvenient) location.
It should be noted that in Poznan, city bikes are used by slightly more women (33.24%) than men (31.36), while in Oslo, the opposite (30.12% men and 28.03% women).
Among men from Poznan who declared no use of city bikes, the most important reasons (excluding the preference to use a different means of transport) were the complicated procedure of renting bicycles (23.53% of indications) and lack of comfort (21.46% of indications). The high price was only in third place (18.12% of responses). Among women from Poznan, the most important reasons were the complicated procedure of renting bicycles (29.66% of indications), too long distance to travel (24.72% of indications), and lack of comfort (18.88% of indications). The price was fourth in the ranking according to the opinion of female students from Poznan (18.20% of responses). Women also, compared to men, more often indicated the poor technical condition of bicycles and poor bicycle infrastructure in the city as the reasons for not using city bikes. The above results are presented in
Figure 13.
Figure 14 presents why inhabitants in Oslo do not use city bikes. Among the men from Oslo who declared no use of city bikes, the most important reasons (excluding the preference for using another means of transport) were too long a distance to travel (23.08% of indications) and lack of comfort (15.38% of indications). Furthermore, just like in Poznan, the high price was ranked third (15.22% of responses). Among women from Oslo, the most important reasons were too long a distance to travel (33.26% of indications) and lack of comfort (28.64% of indications). The price, just like in Poznan, was fourth in the ranking according to the opinion of female students from Oslo (17.94% of indications).
In question sixteen, the respondents were asked whether in the future, city bikes would have a development perspective in their city. The respondents’ opinions were quite similar in both cities (
Figure 15). In Poznan, almost 87% of respondents indicated that in their opinion in the future city bikes will have a development perspective in their city (the sum of “yes” and “rather yes” answers). Almost 63% of respondents confirmed the same thesis in Oslo. A small percentage of respondents from Poznan indicated that in their opinion, such development will not take place or rather will not take place—7.81% of respondents. In Oslo, 29.63% of respondents expressed the same opinion. Therefore, it can be concluded that the respondents positively perceive the future in the context of the development of cycling infrastructure in the analyzed cities, expecting simultaneously from the authorities-specific actions in this direction.
The last and seventeenth question examined whether, according to the respondents, the number of tram/bus lines in the city is sufficient. Just over 70.45% of respondents from Poznan indicated that in their opinion, the number of public transport lines is sufficient, while 29.55% did not agree with this statement. In Oslo, the situation is quite similar—66.67% of respondents believe that access to tram and bus lines is adequate, while 33.33% of respondents are not satisfied with the current number of these lines.
6. Discussion
A comprehensive policy for sustainable urban development in a long-term perspective is developed either in Poland or in Norway. The purpose of the Sustainable Urban Mobility Plans in both countries is to establish strategies for sustainable urban development that gather, develop, clarify, and concretize the traffic-related aims of the sustainable plans and other strategic documents. The Sustainable Urban Mobility Plans should be guiding in future planning and budgeting at administrations responsible for urban development and sustainable transport. Despite differences of sources of financing in Poland and Norway, it can be stated that both countries are developing their urban transport with respect to green mobility and sustainable goals. Sustainable urban transport is recognized as the key development priority.
Strategic documents in both countries focus on mobility and the fact that a growing population should be given possibilities to travel sustainably in everyday life. Inhabitants, visitors, businesses, organizations, and commuters must be given the possibility to travel more sustainably in their everyday lives.
Having analyzed strategic documents in Poznan and Oslo, the authors see that cities are aiming to enhance urban transport and the domain developing the most is public transport, such as trams in Poznan, and metro in Oslo. Improved mobility for citizens and businesses can make cities be more attractive and competitive. Oslo city is already famous due to its sustainable position.
The authors believe that all issues raised in the hereby paper are very important in terms of the ecological aspects sought by cities of Europe.
Evaluating the results of the survey, it should be stated that the most common means of transport used by respondents of the surveyed countries is public transport. Modern types of transportation such as bicycles, electric kick scooters, and scooters are just being developed, and therefore, it can be expected that in the future, their share in the overall statistics of using public transport will increase. It also should be noted that a large proportion of people prefer their own means of transport. Further research directions should include verifying the criteria encouraging owners of their own vehicles to switch to public transport, including bicycles or scooters.
Research also indicates that a significant proportion of respondents never use green transport such as bicycles or electric kick scooters. This is dictated by the lack of services in the city, or a weak marketing campaign encouraging potential users to use the given means of transport. Interestingly, one of the problems with using such services is, according to respondents, the complicated procedure for renting specific means of transport. The request is a signal to the city authorities to work on simplifying such procedures as well as explaining, on a larger scale, how to rent a specific means of transport. The research also reveals the need to improve public transport system in both of the surveyed cities, as respondents show average satisfaction with its use. Respondents distinguish the price as the main advantage of public transport in all countries.
Positive in both cities is the fact that respondents see opportunities for developing green mobility in their cities. This signals the awareness of the respondents about the impact of transport on the natural environment, so they expect for infrastructural and informational support from the authorities. Public transport showed the most minimal changes, with demand remaining constant over the study period. The main improvements were in technology, such as smartphone apps to buy tickets and check timetables.
Public and other transport services, timetables and ticketing, and interchanges are not always well connected. Innovation, a re-think of public-private sectors cooperation, and how to engage citizens more directly in new mobility systems and services is essential.
Table 7 presents a more detailed comparative analysis for both cities.
Activities undertaken by cities in the field of urban transport development are in line with the EU priorities referring to an urban transport, i.e., urban mobility plans. These activities are directed at the use on a wider scale of public transport, promoting alternative forms of urban mobility, development of green transport, in particular, electromobility. The European Union budget, both in (2014–2020) and the future (2021–2028) programming period, provides financial resources for the implementation of investments in this domain. The development of sustainable transport has been recognized as one of the development priorities at the level of EU Member States (including Poland), but also in countries that are not part of the European Union (including Norway).
Further research directions will include verifying the criteria encouraging owners of their own vehicles to switch to public transport, including bicycles or scooters, which is important in terms of eco-mobility. Moreover, the authors plan to evaluate sustainable transport from a point of view of smart solutions and how the fourth industrial revolution and its tools are affecting urban transport.


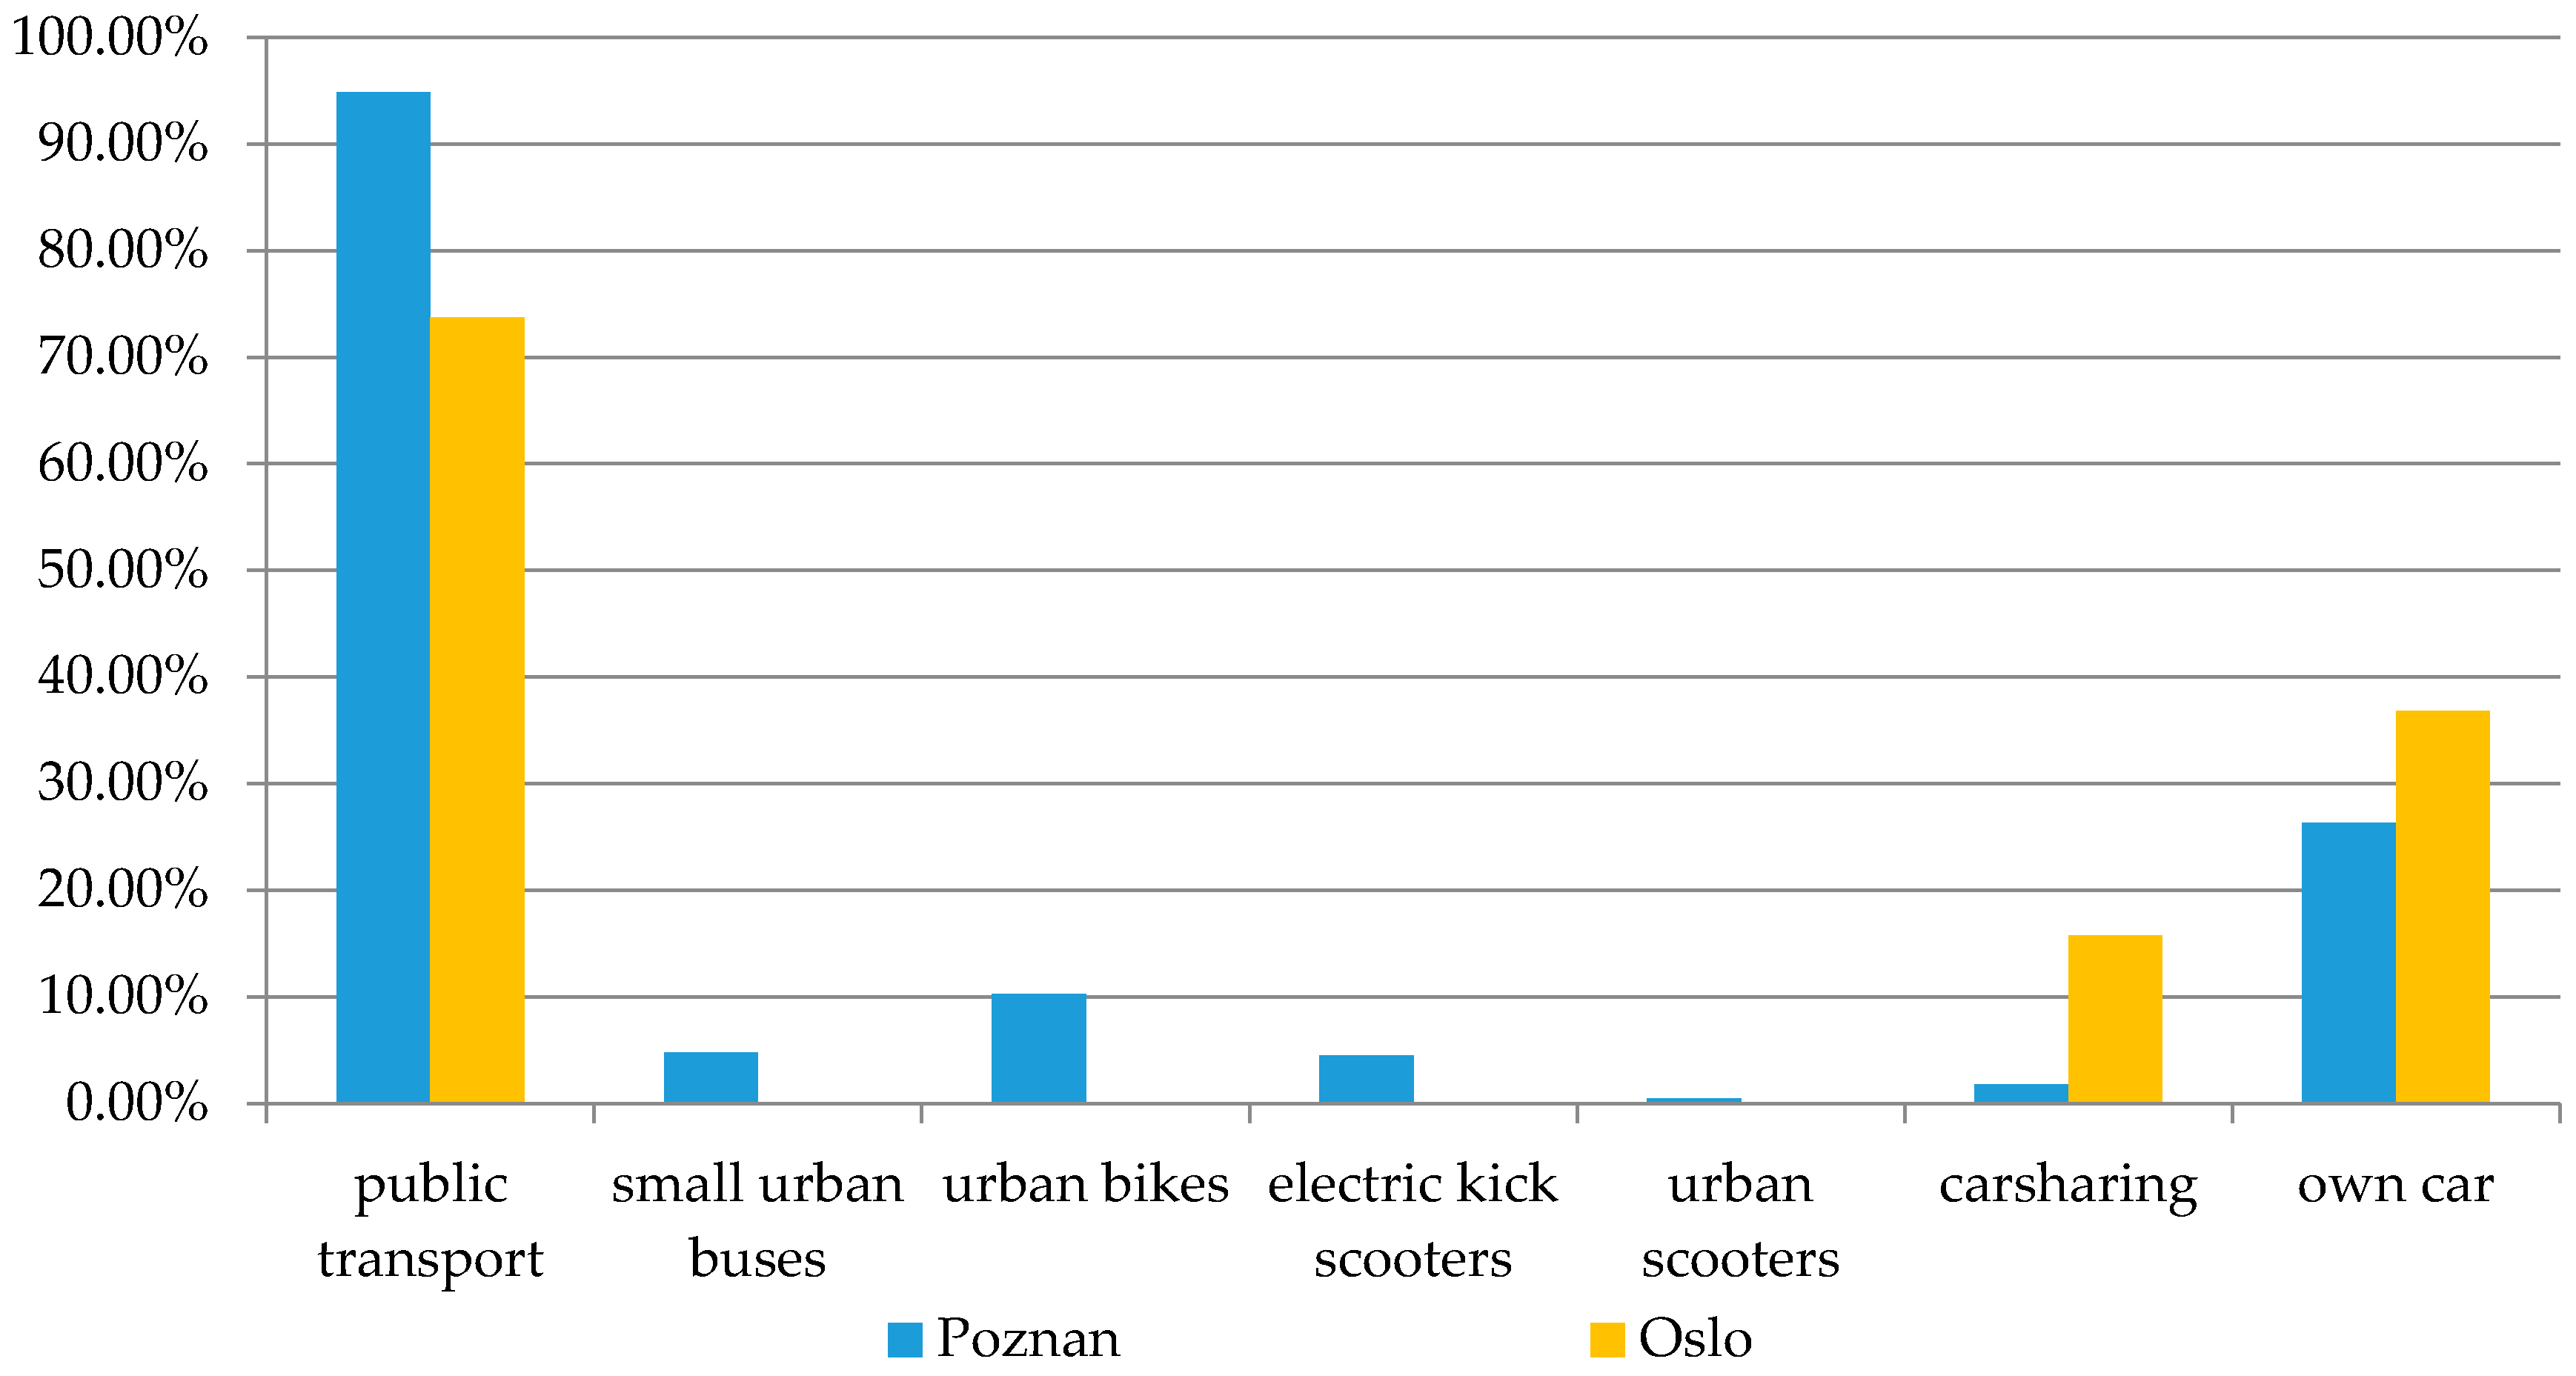
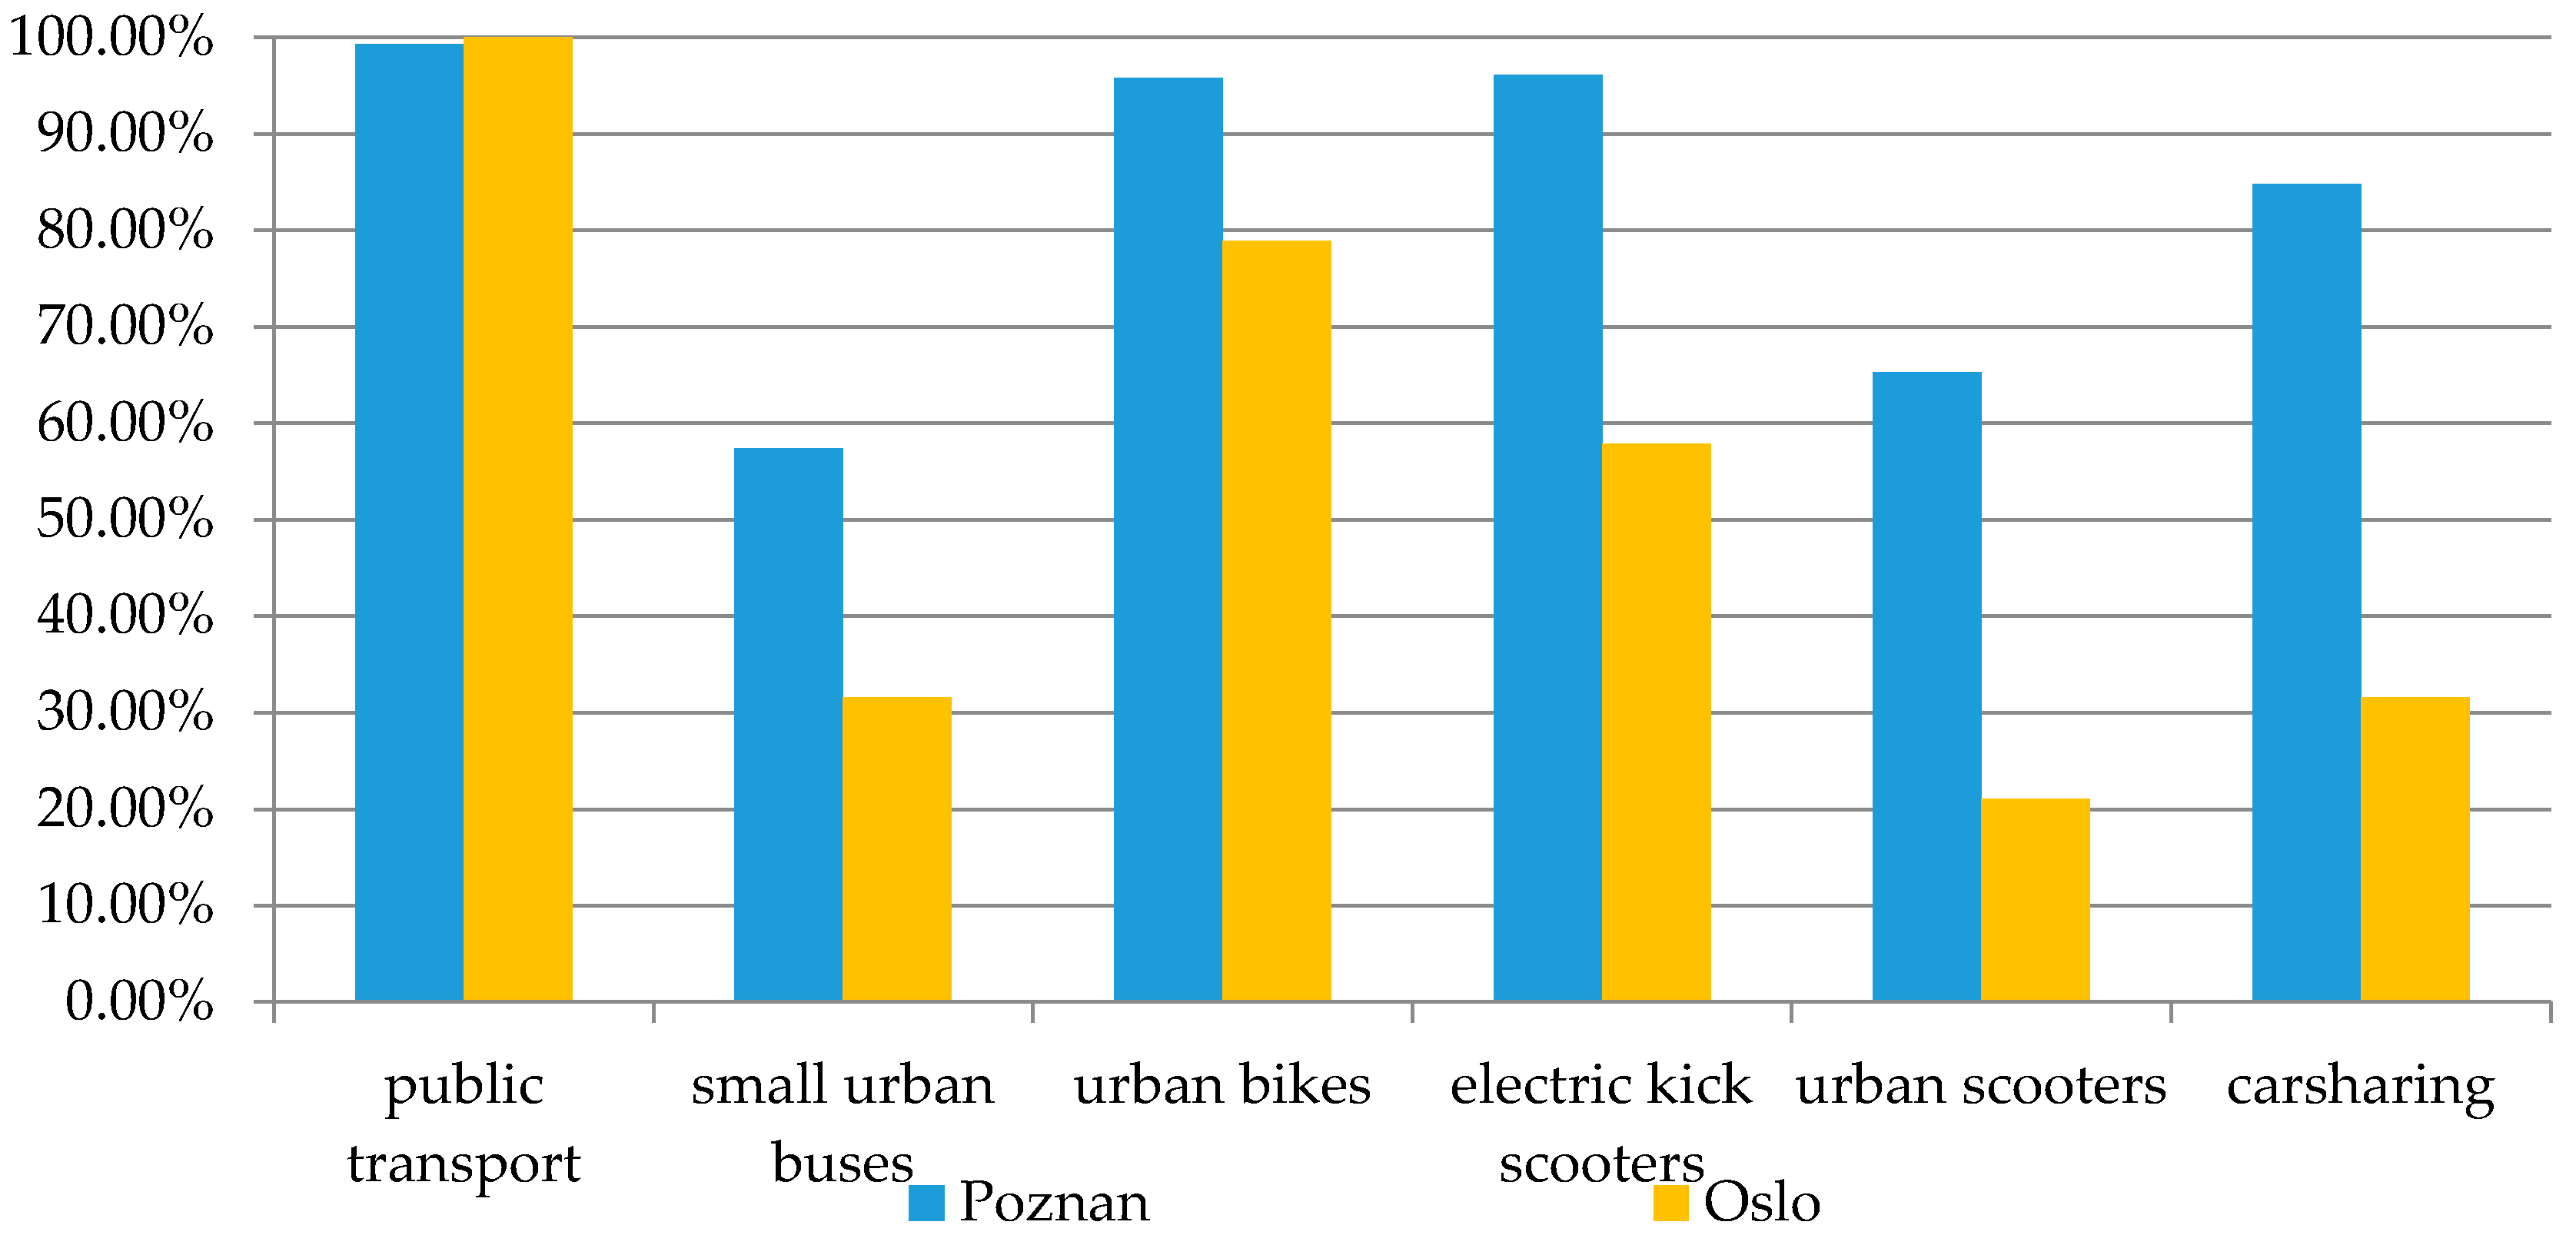
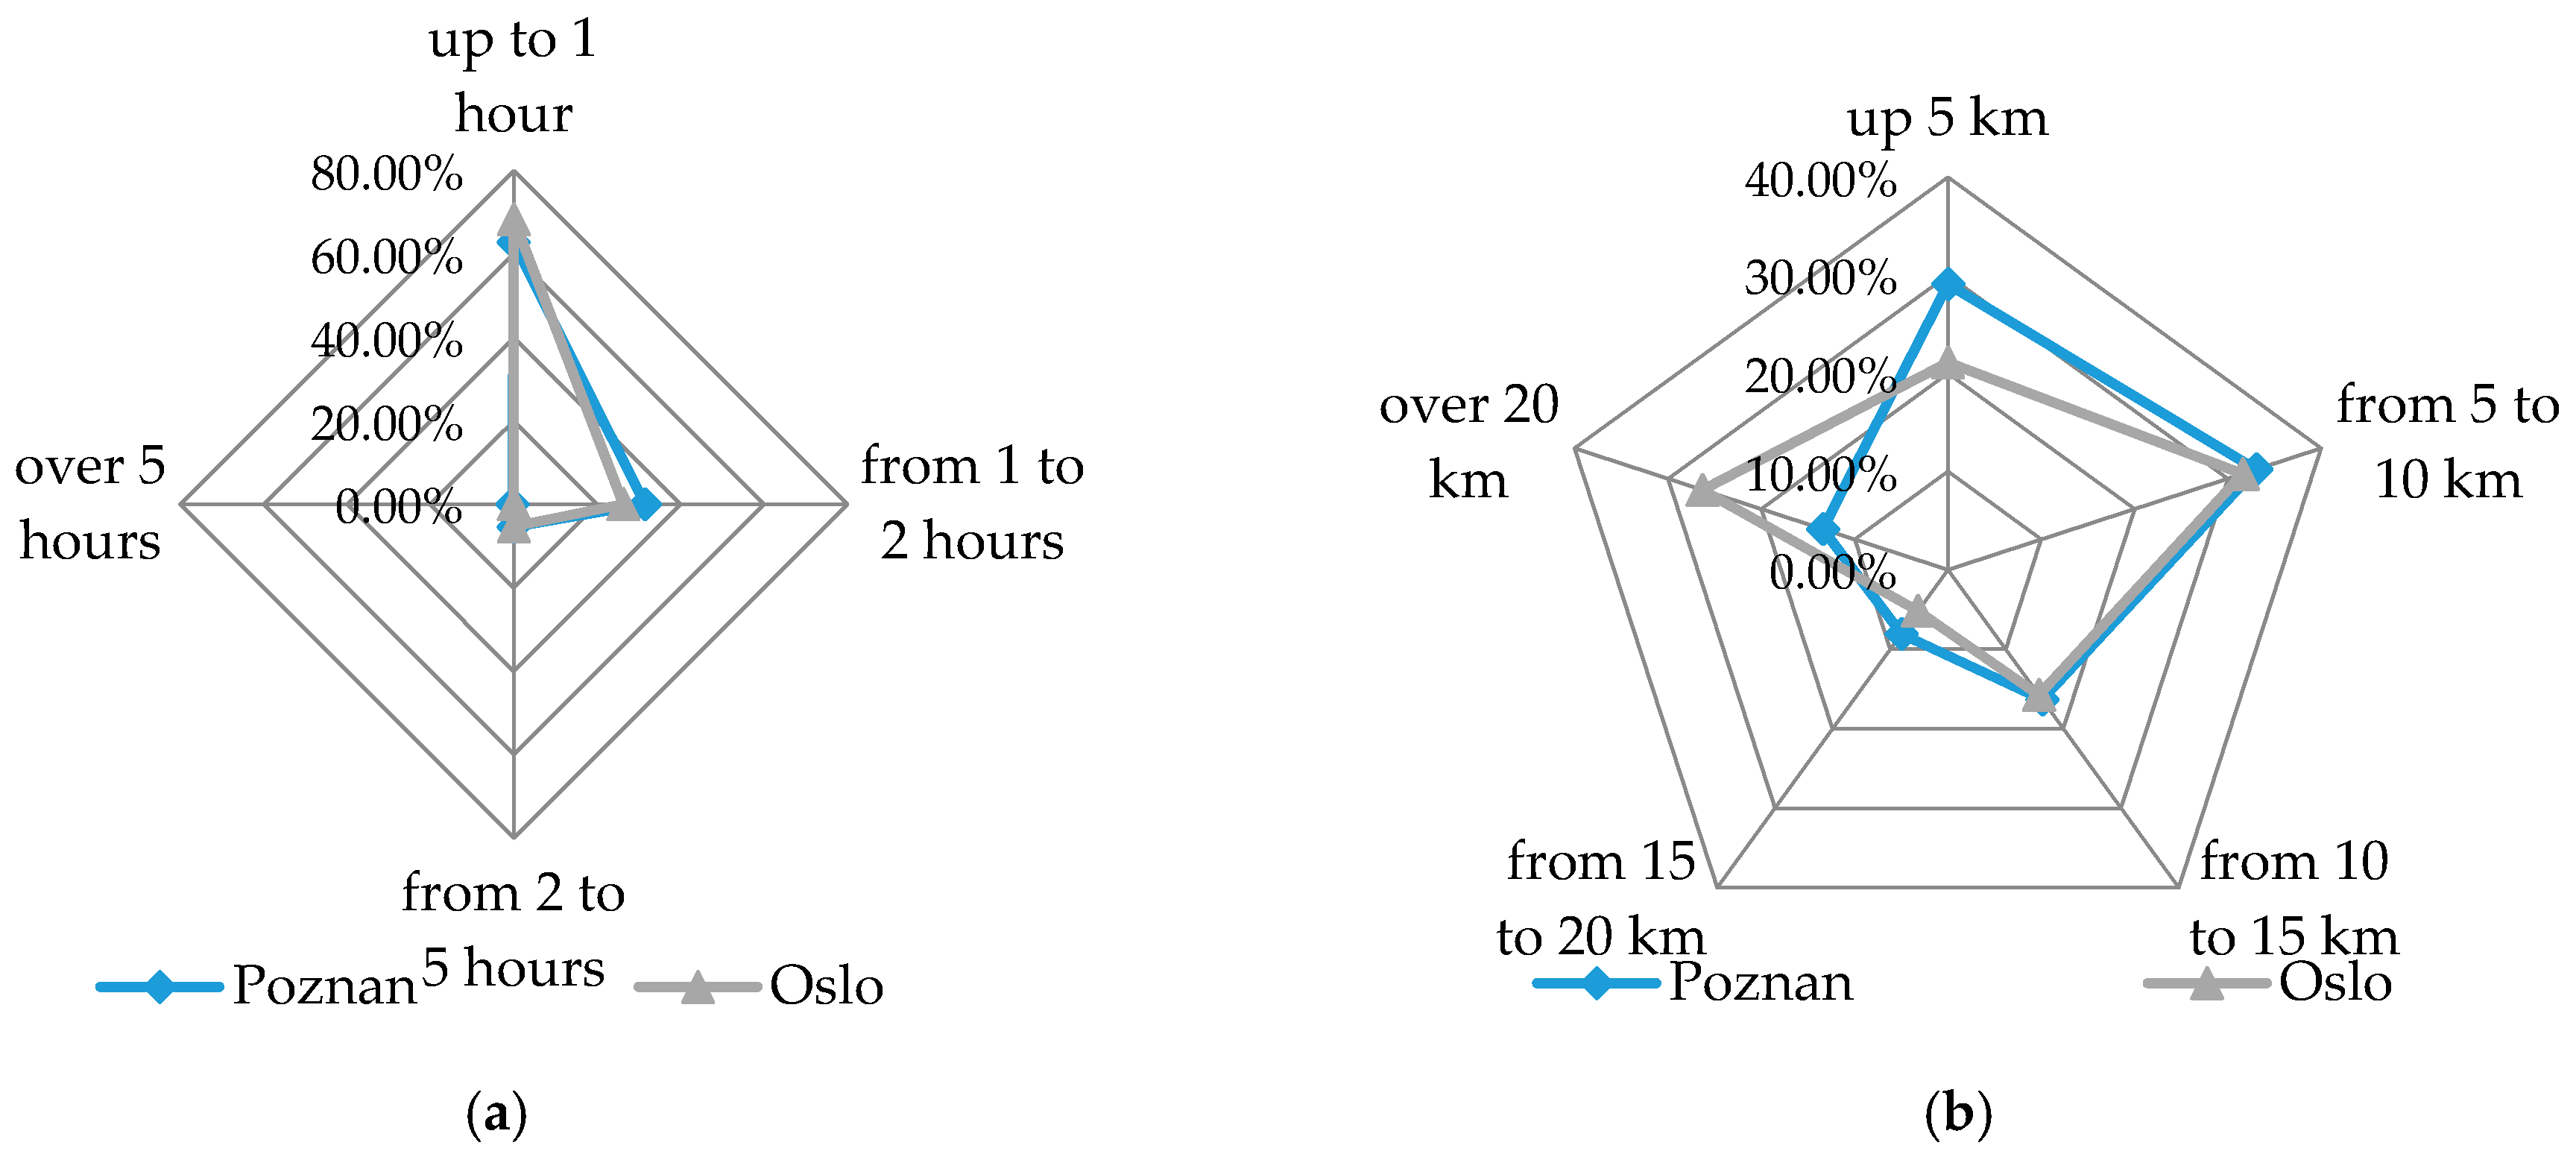
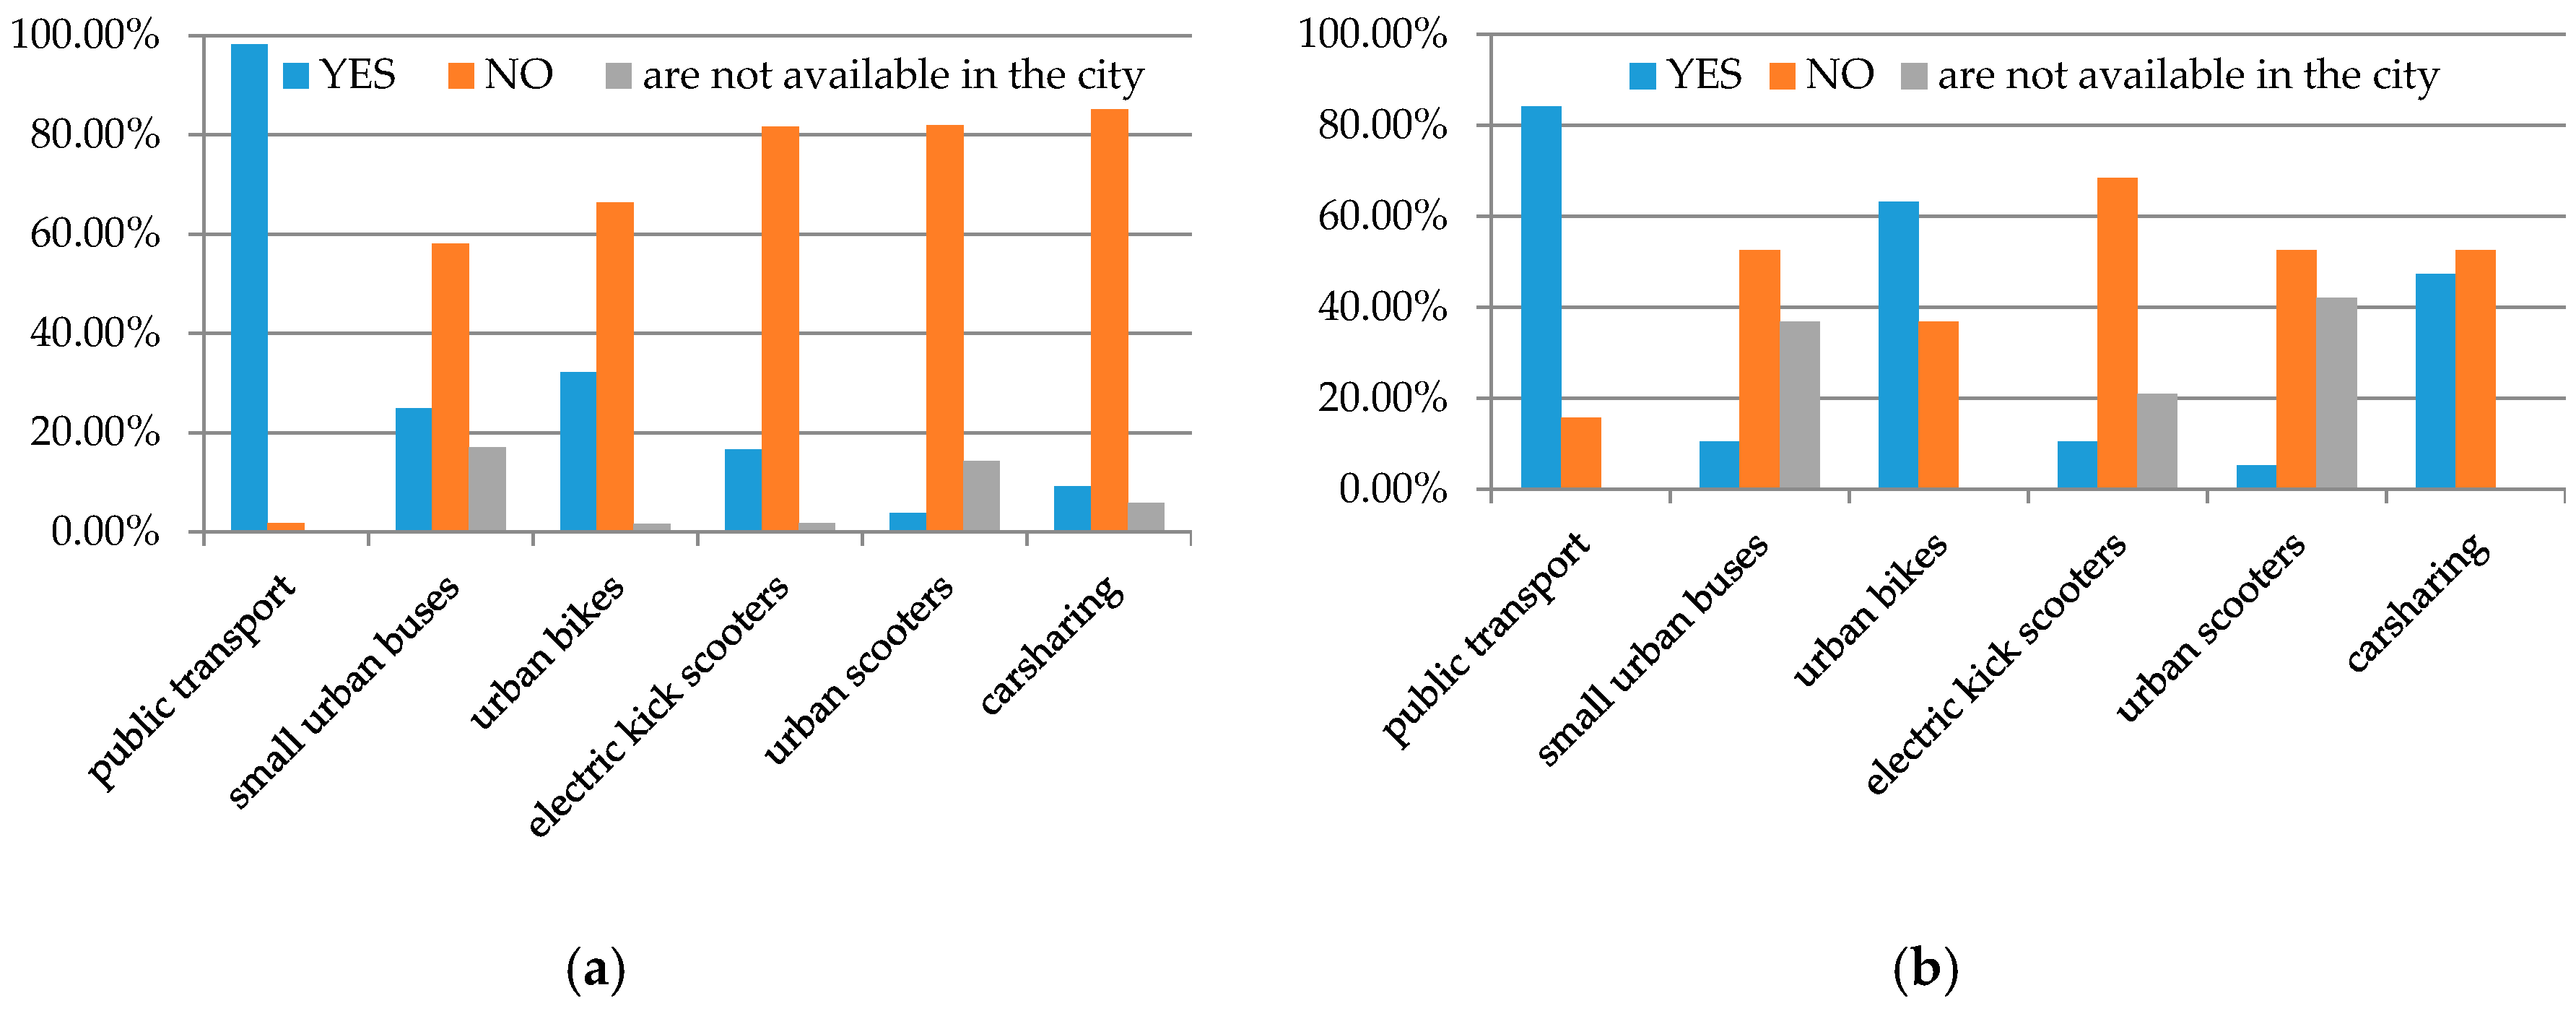
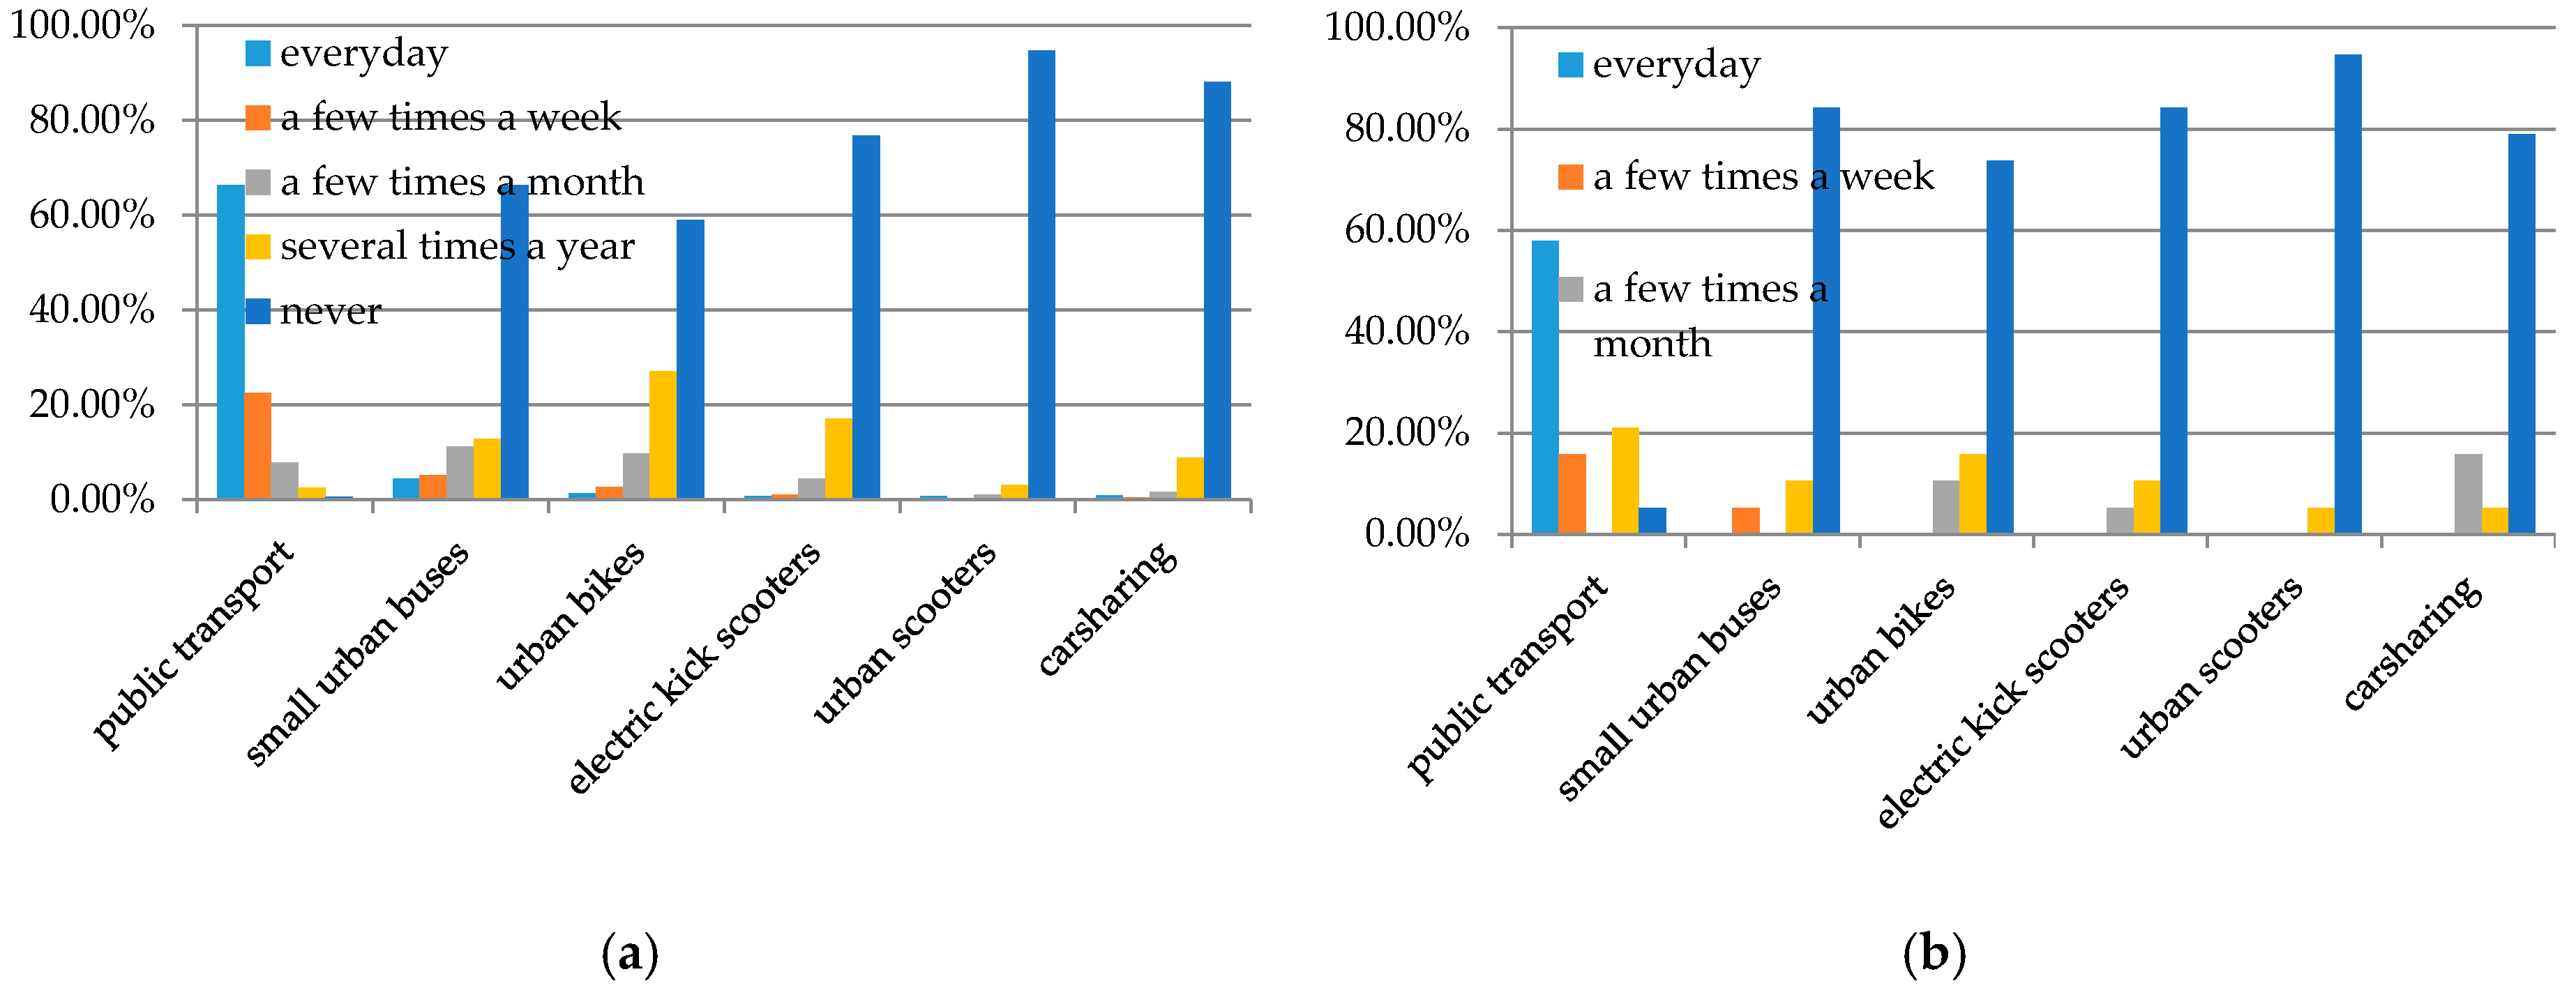
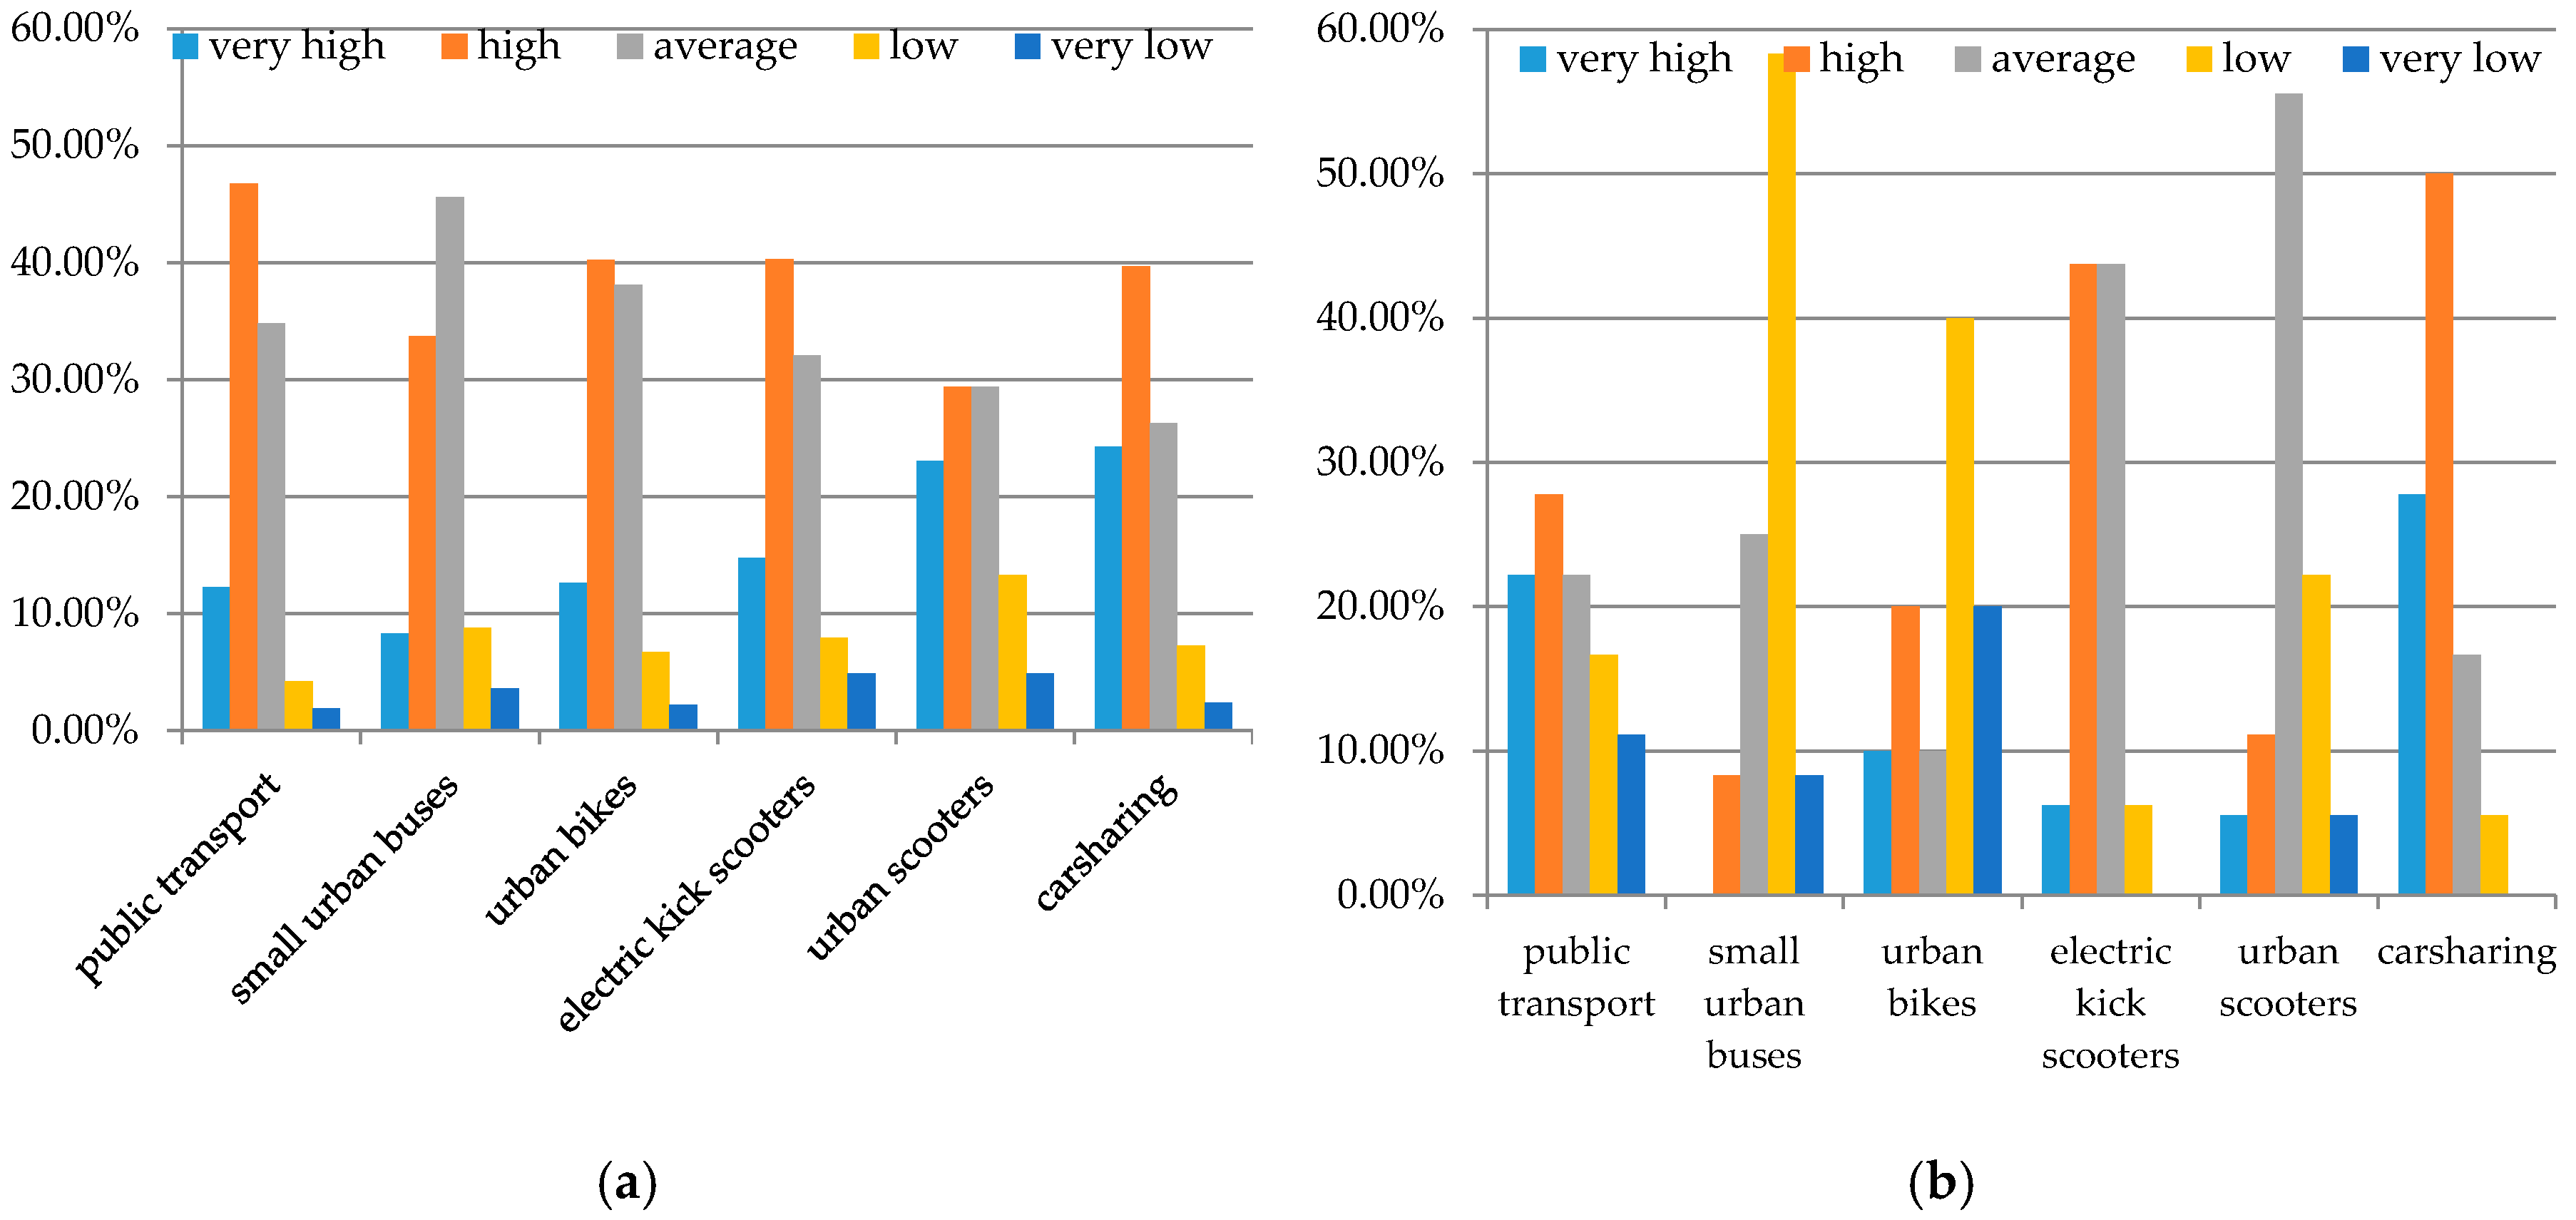
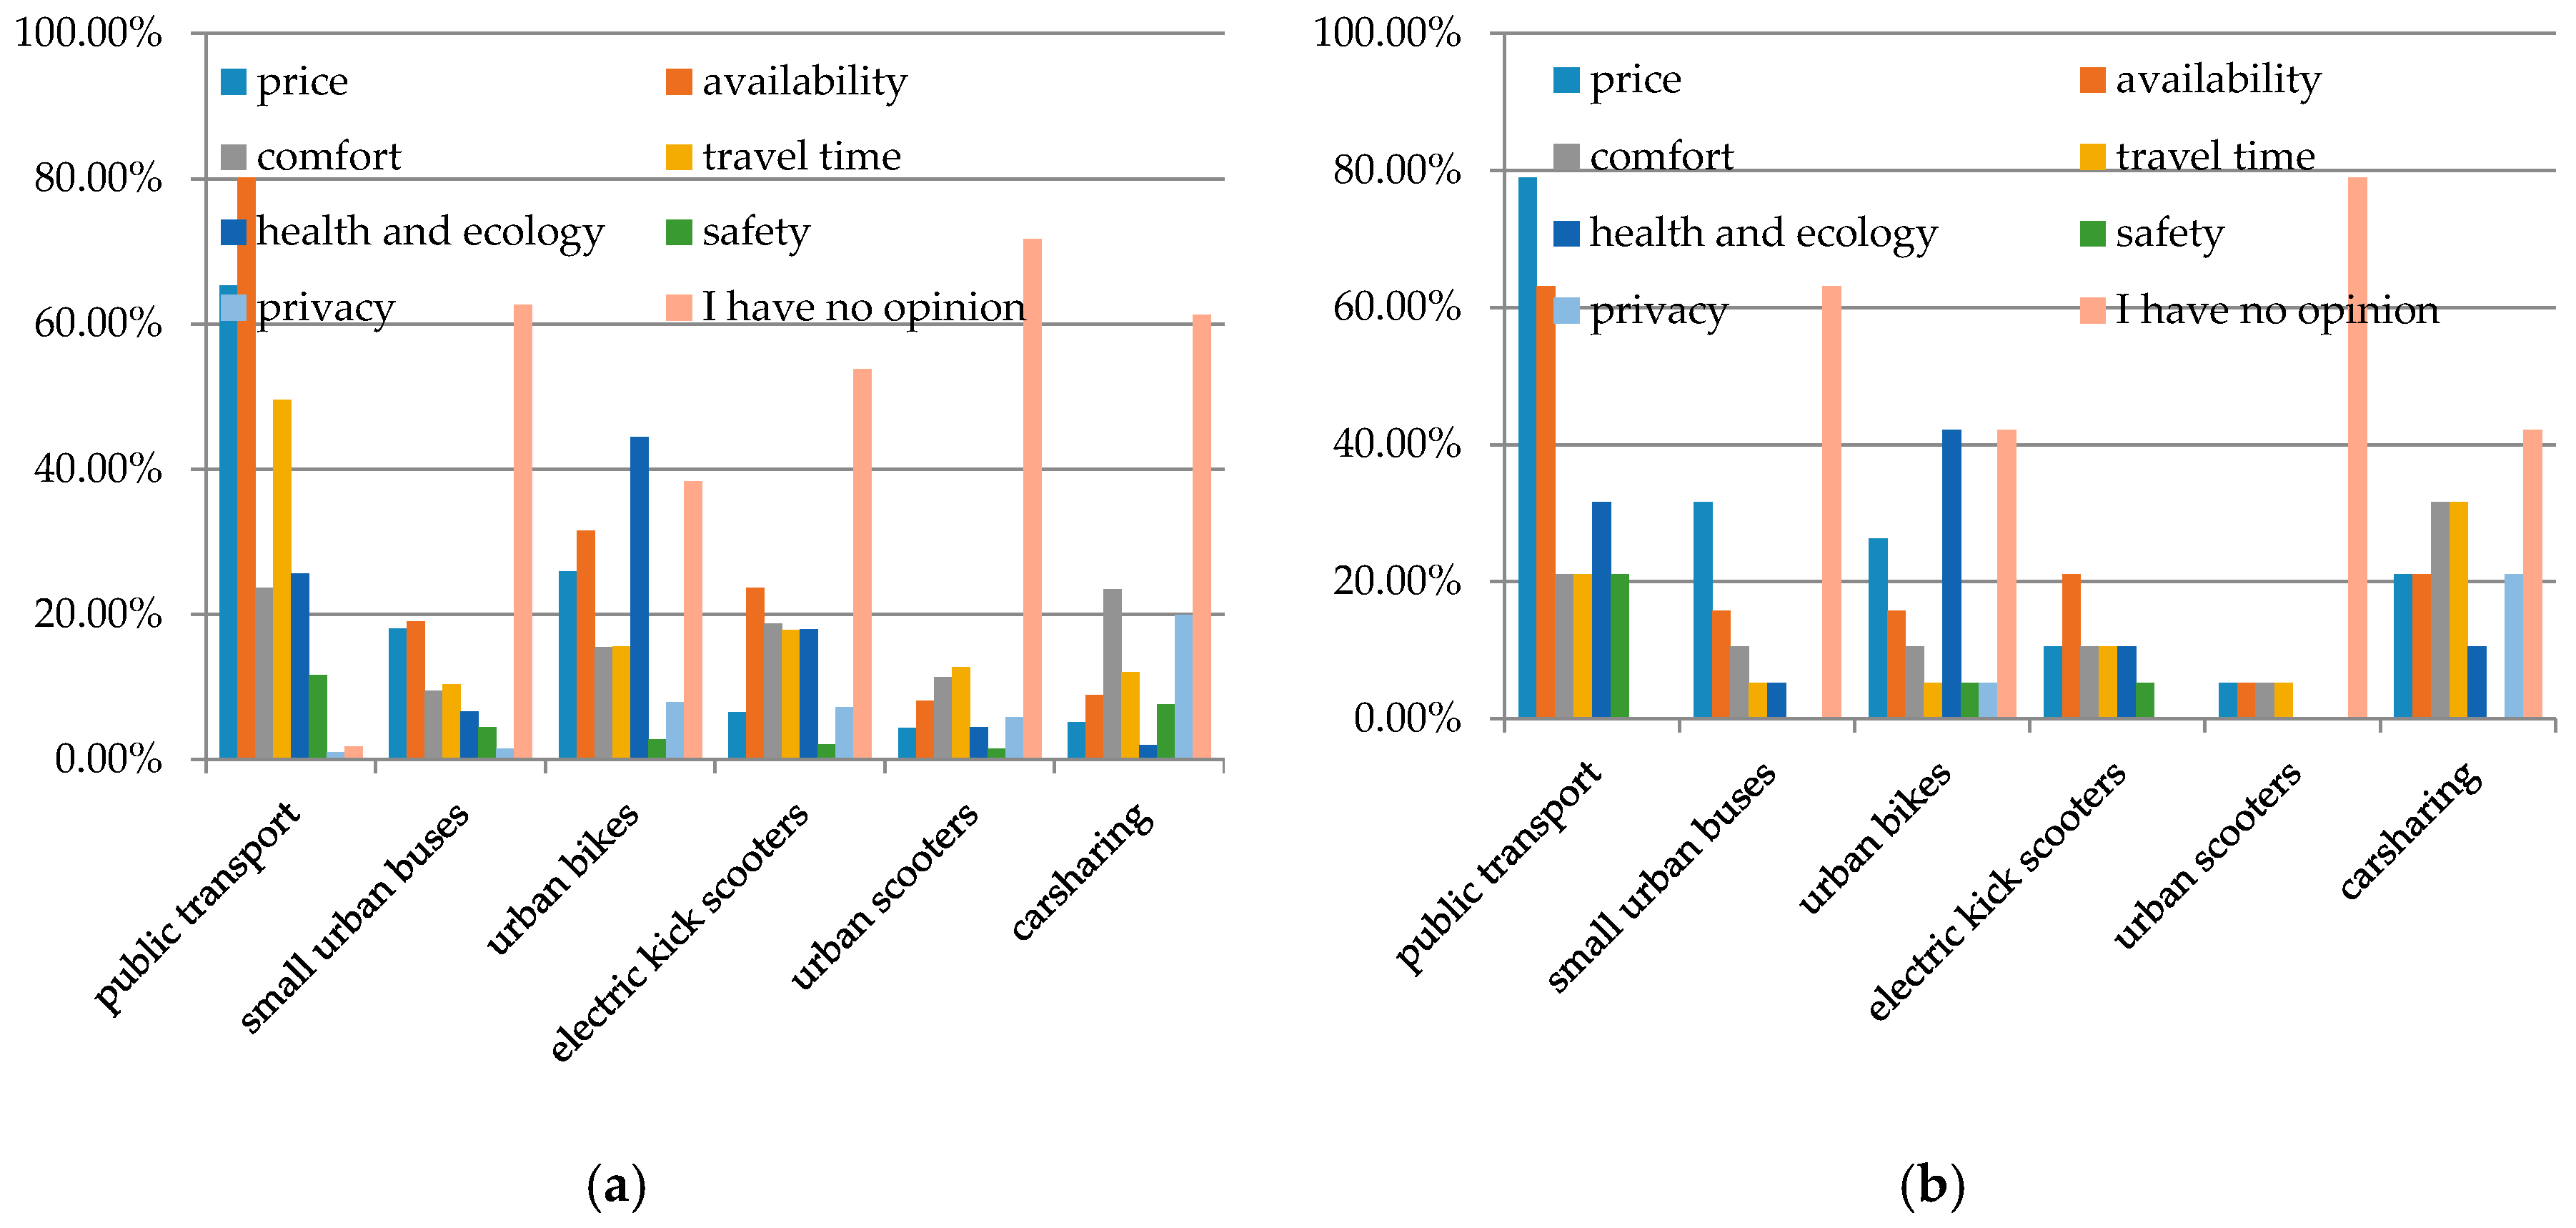
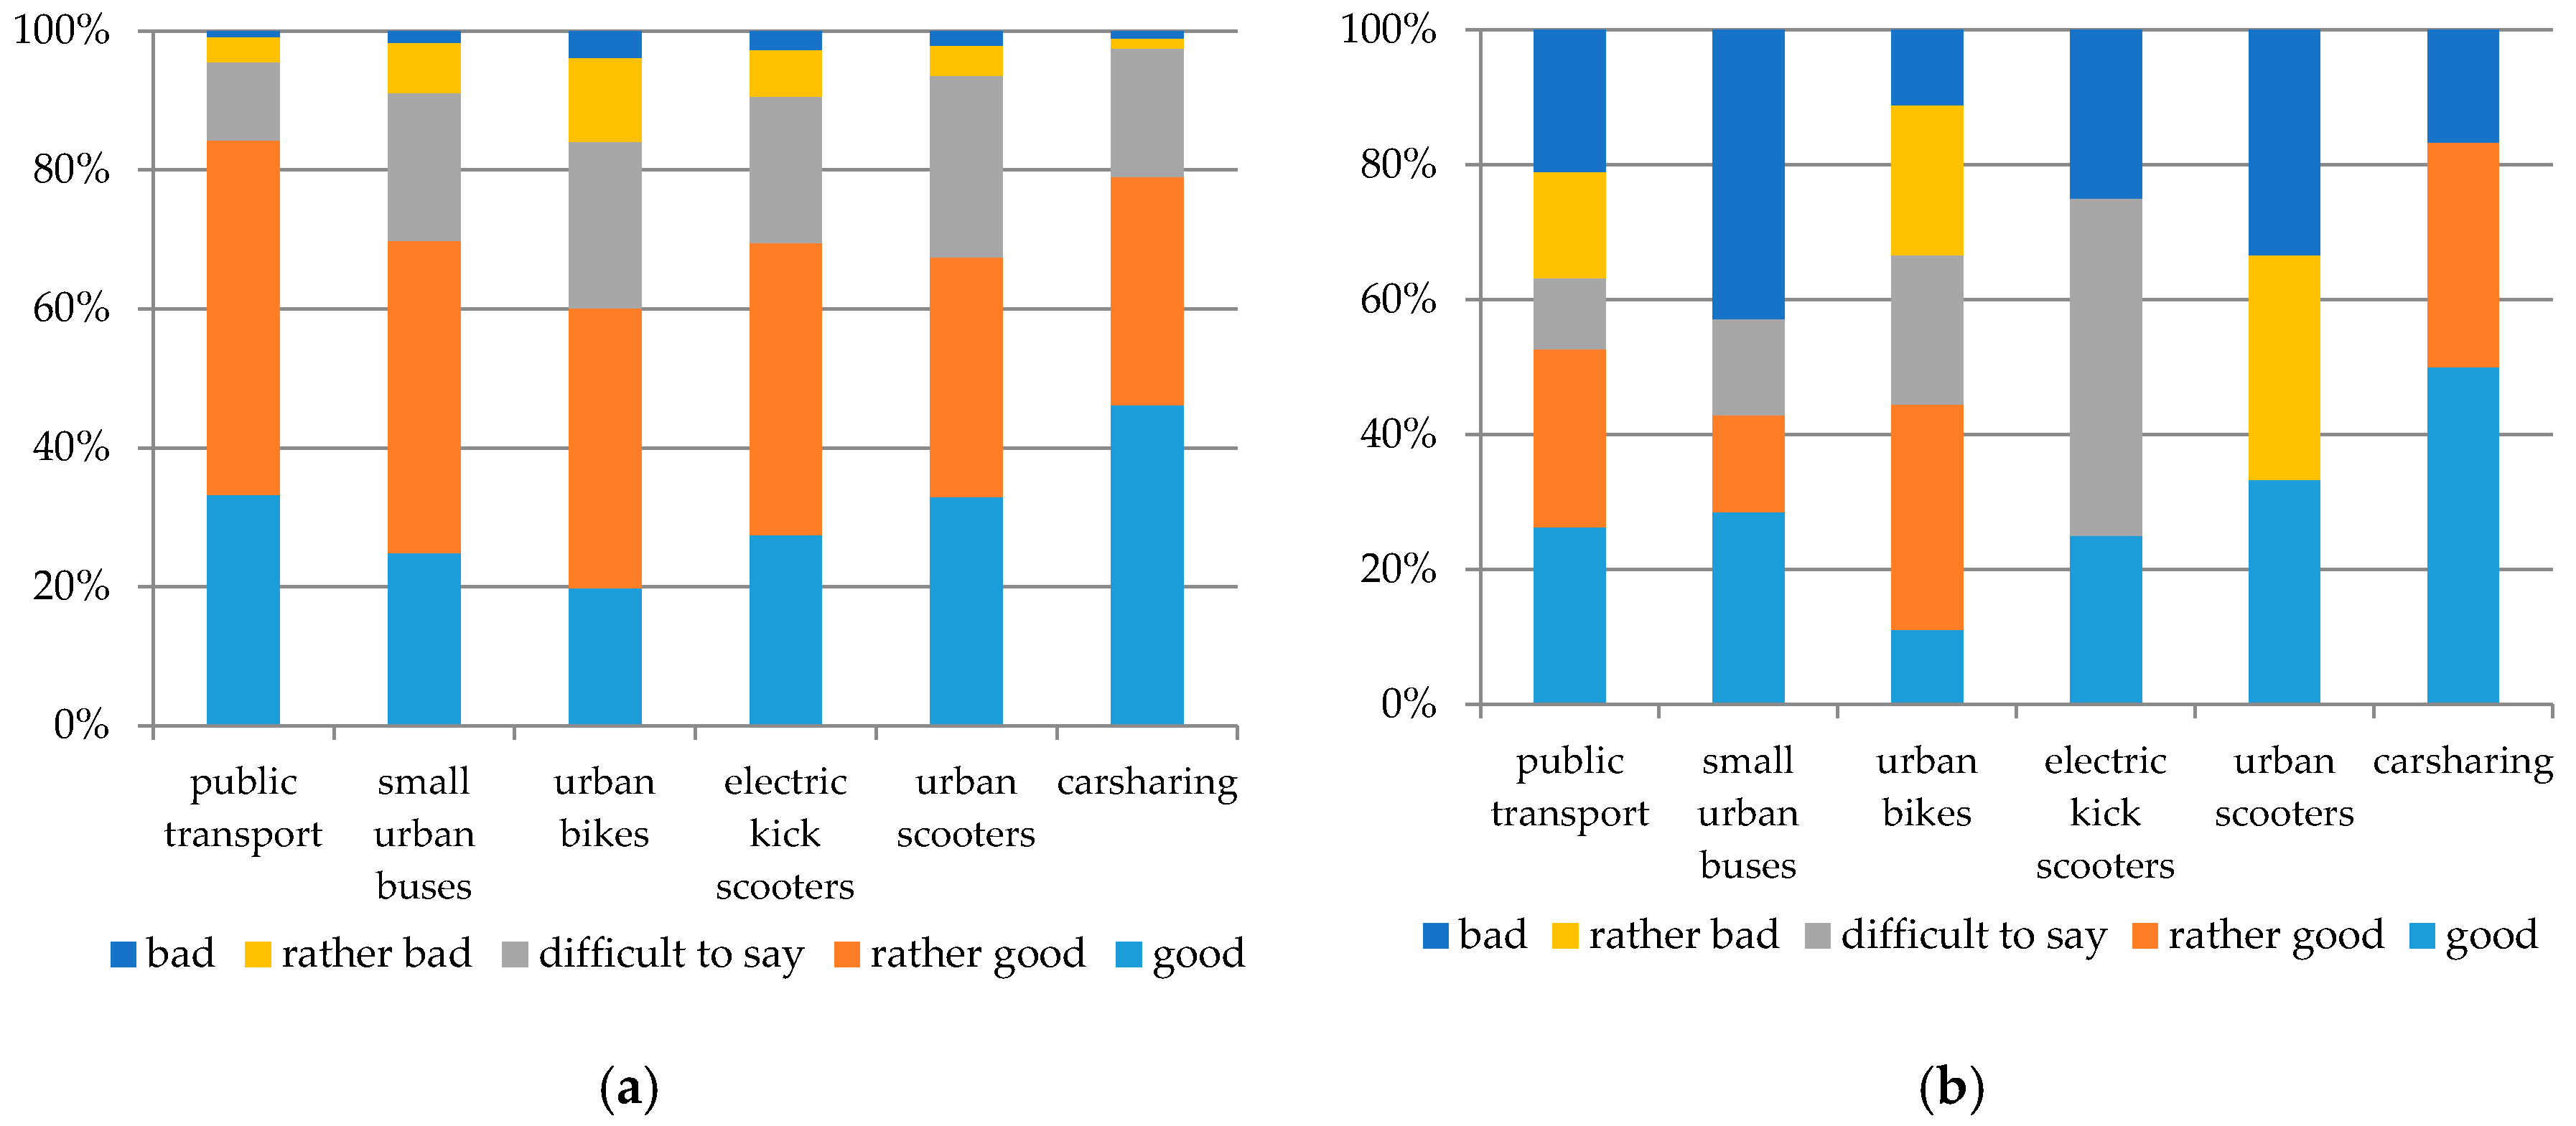
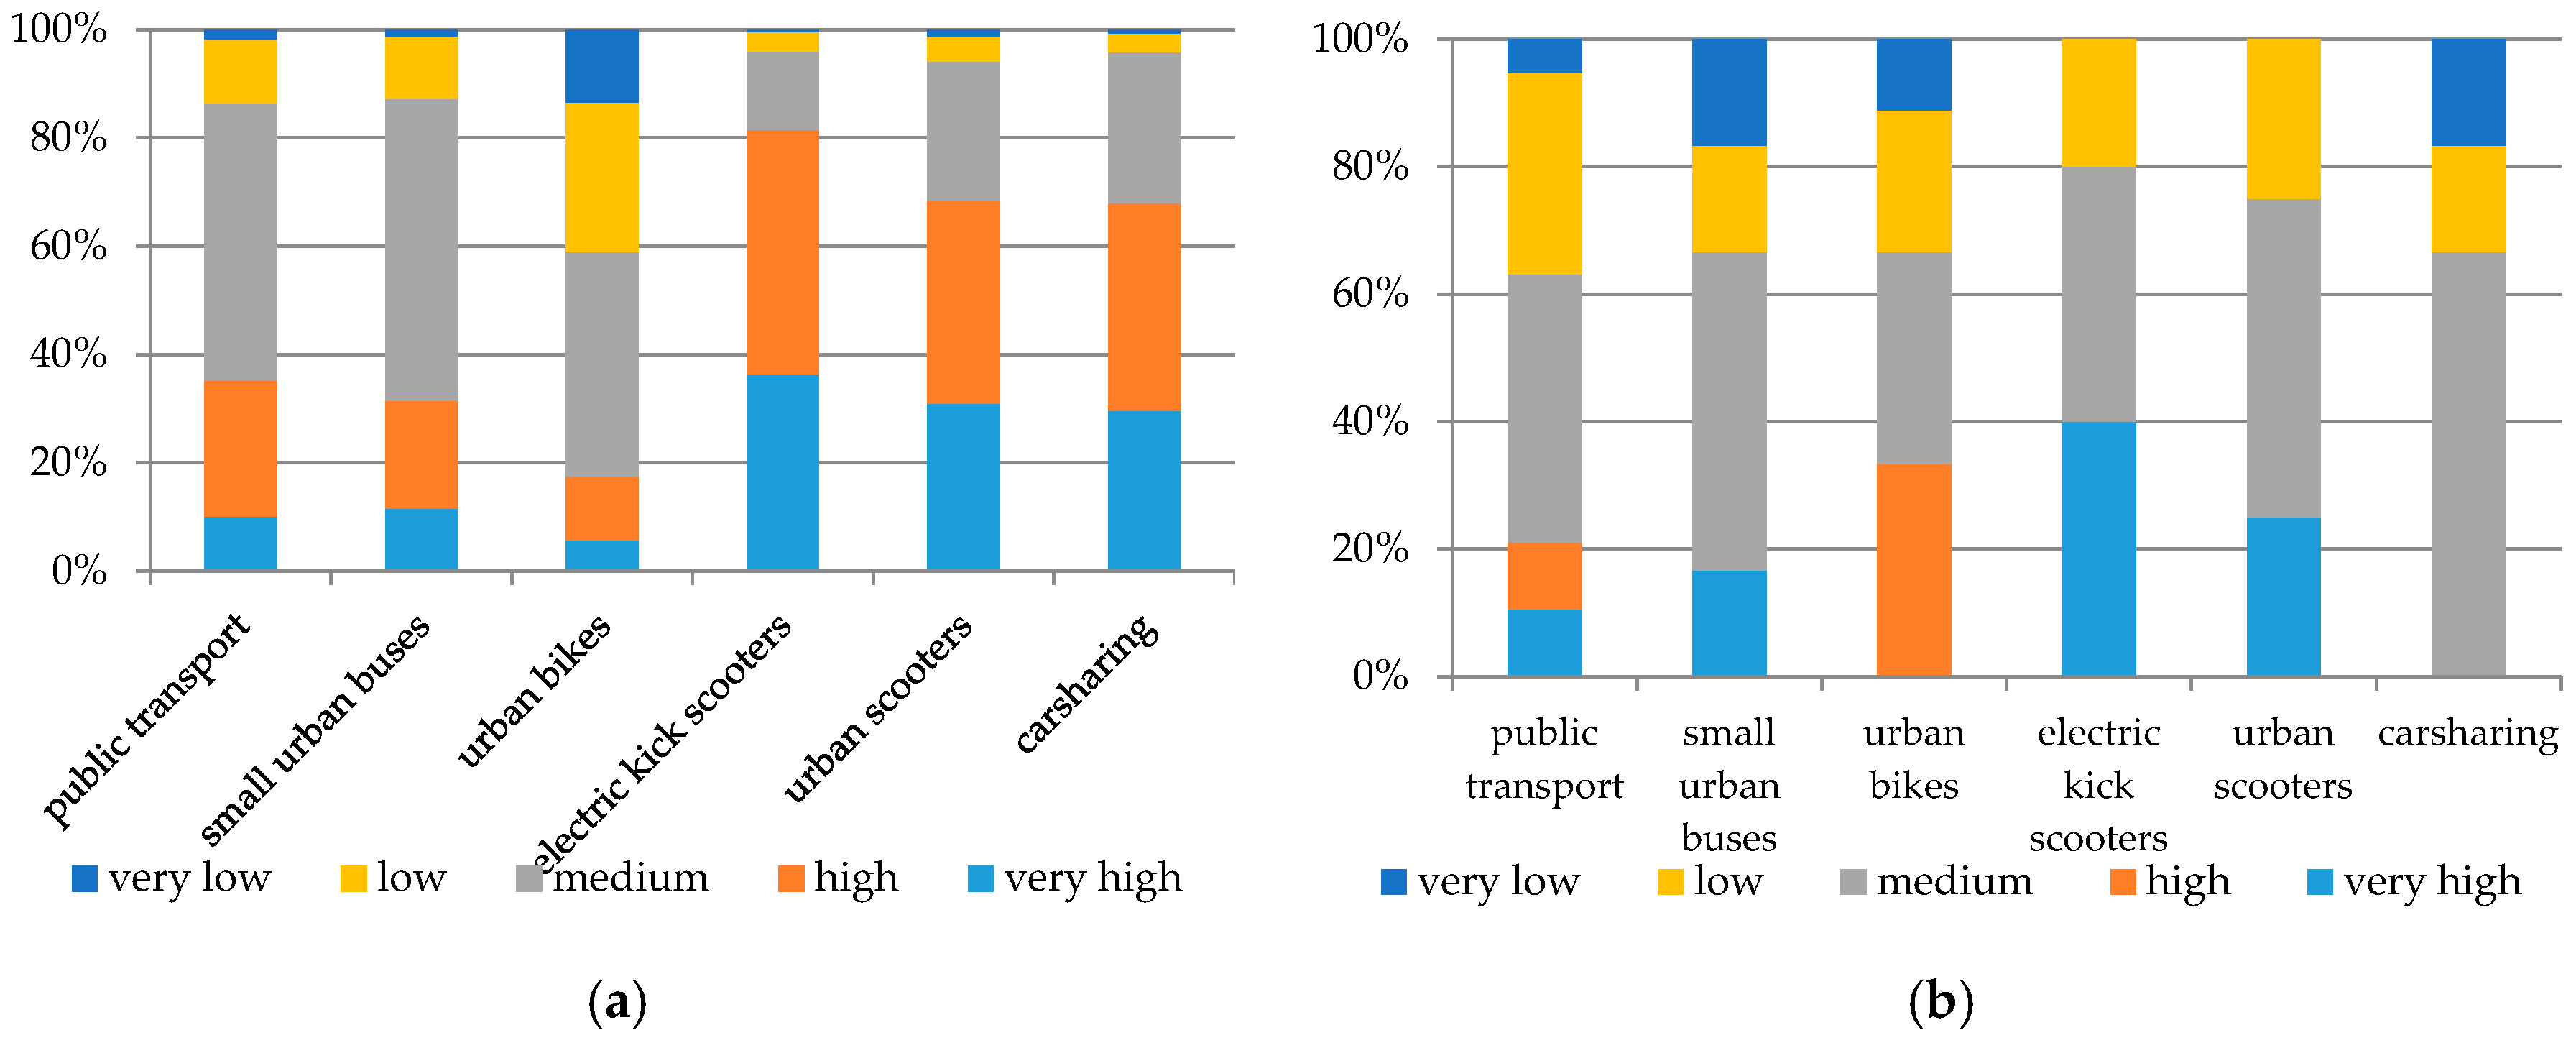
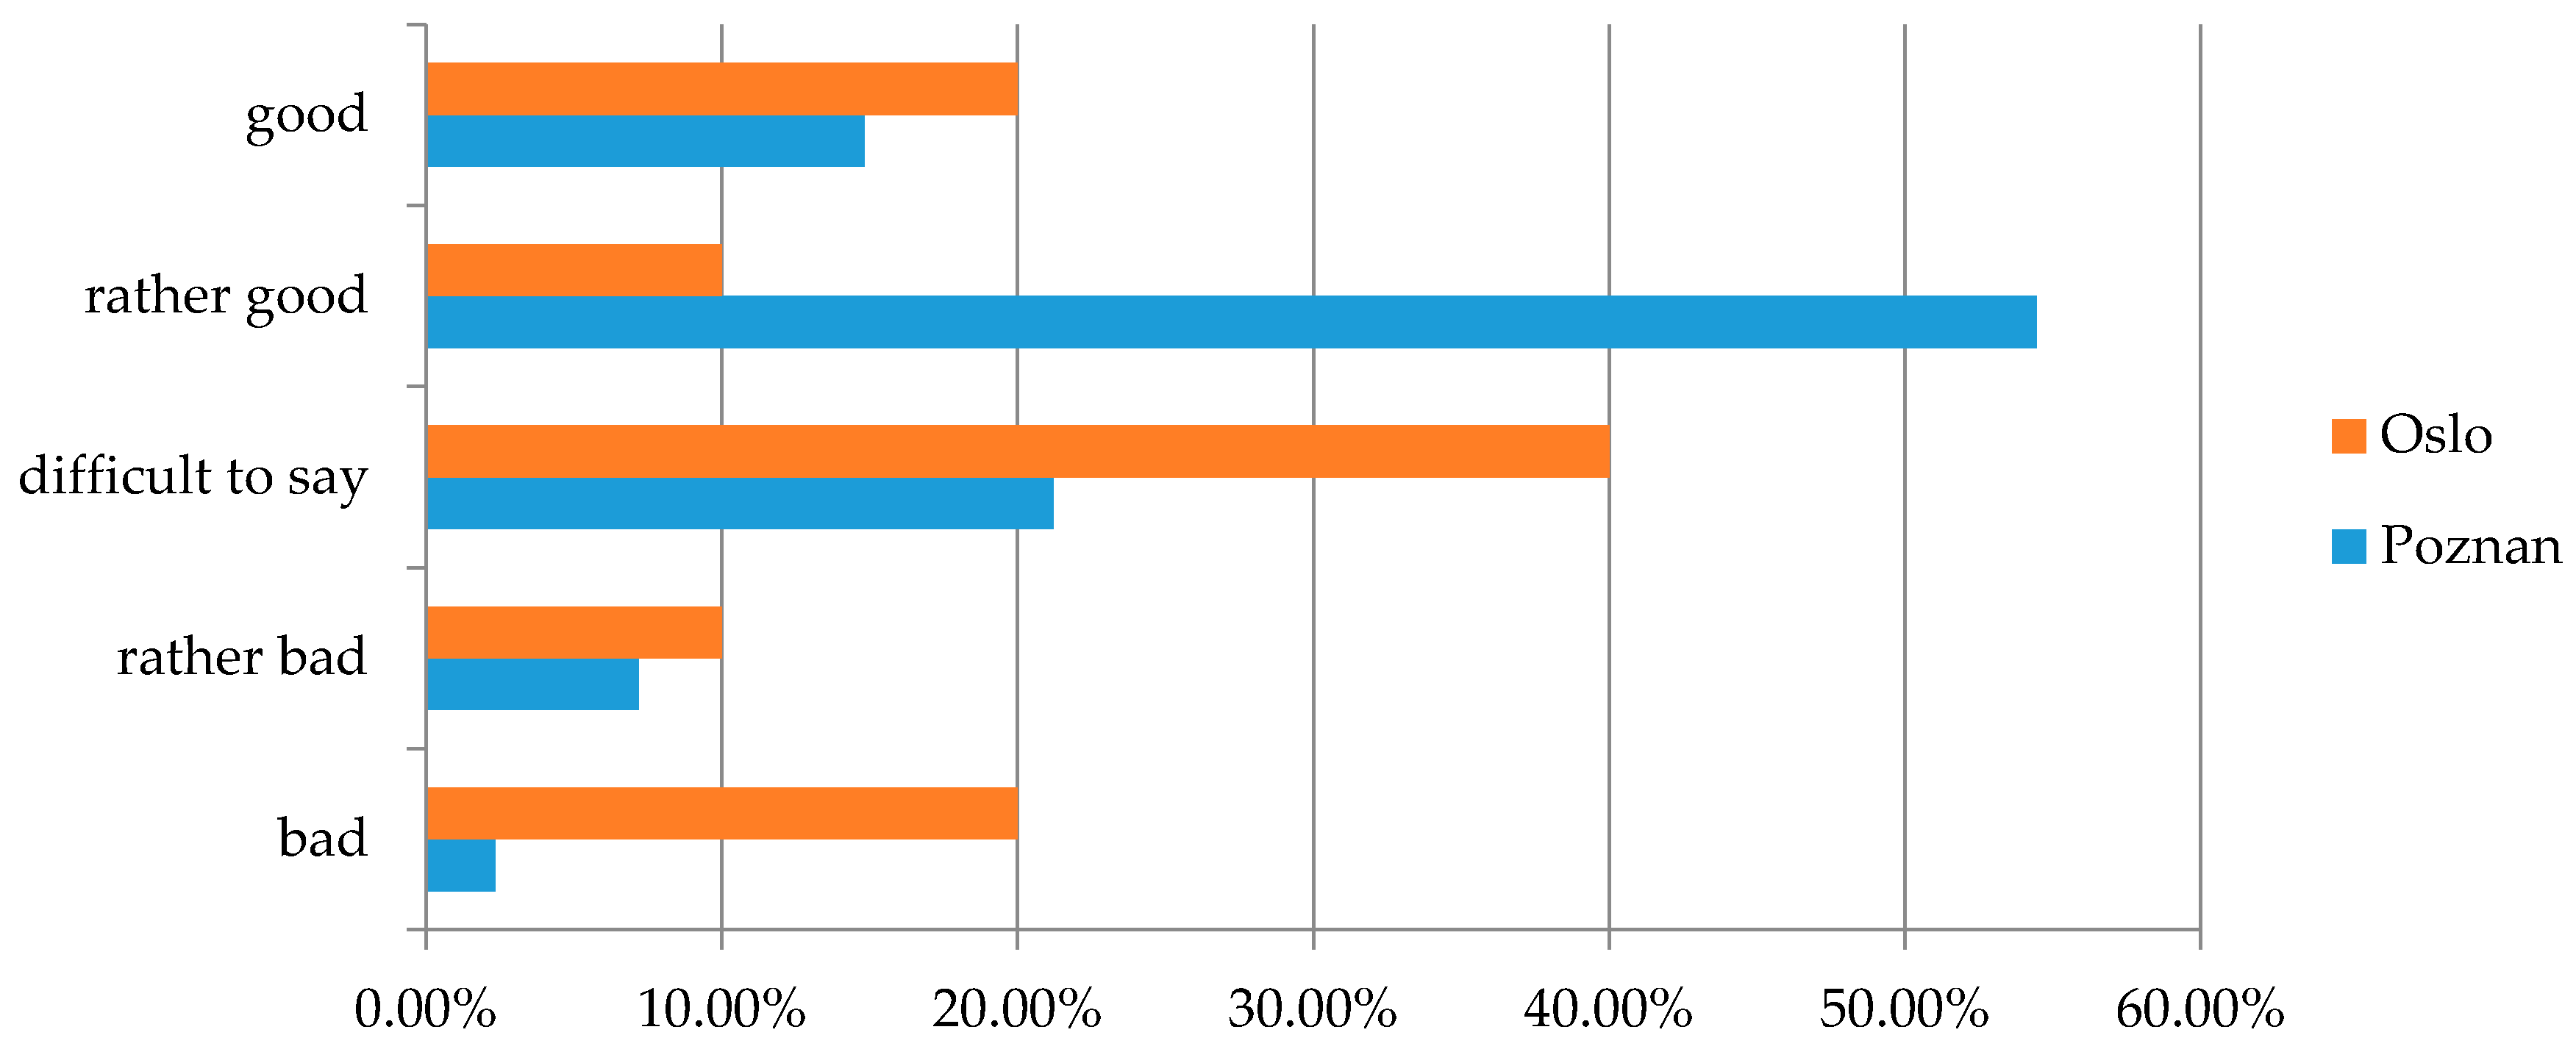
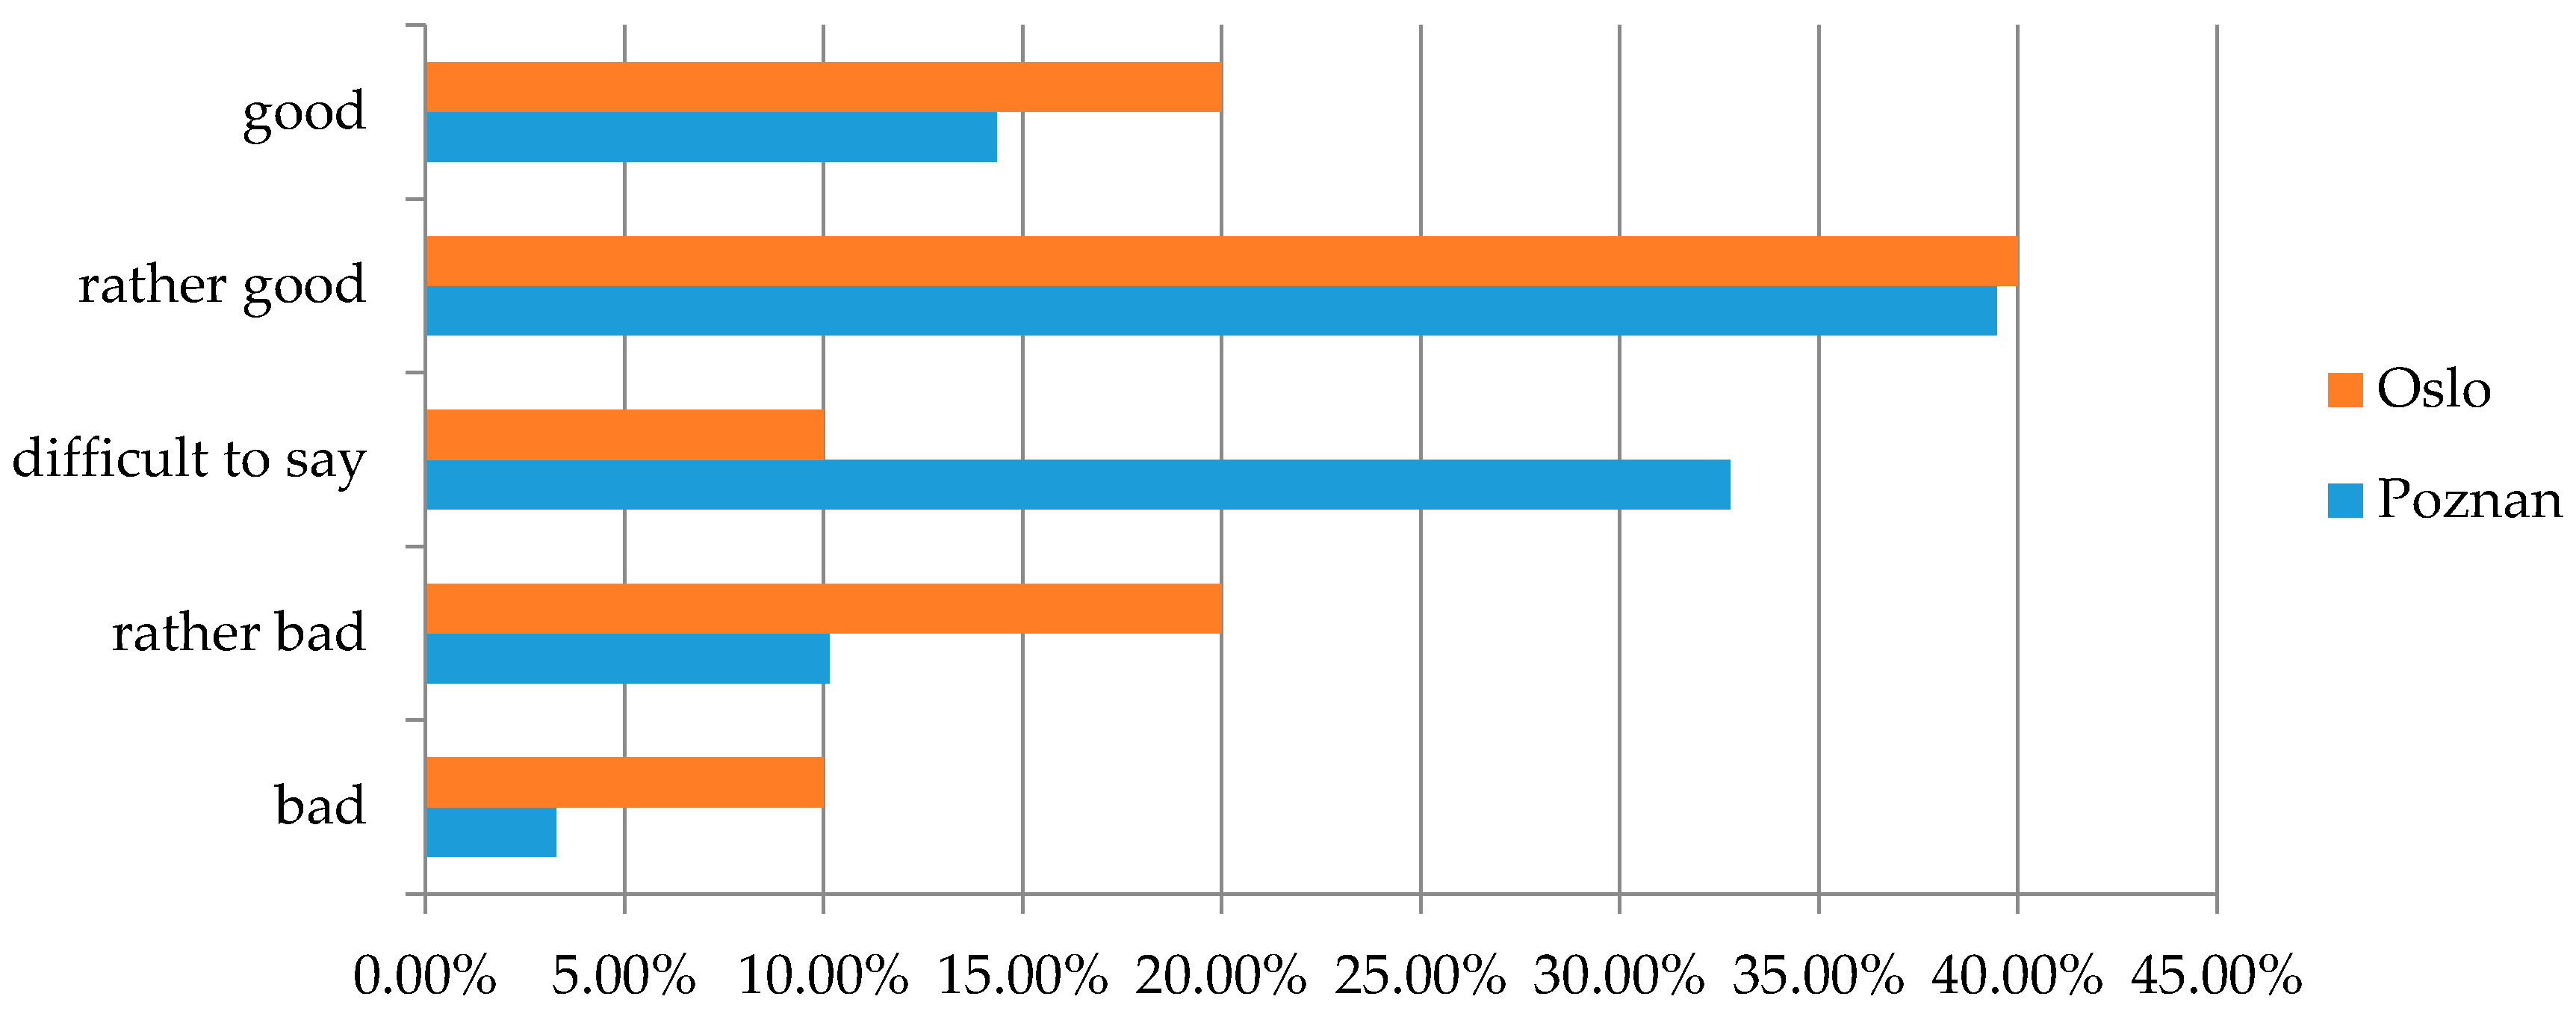
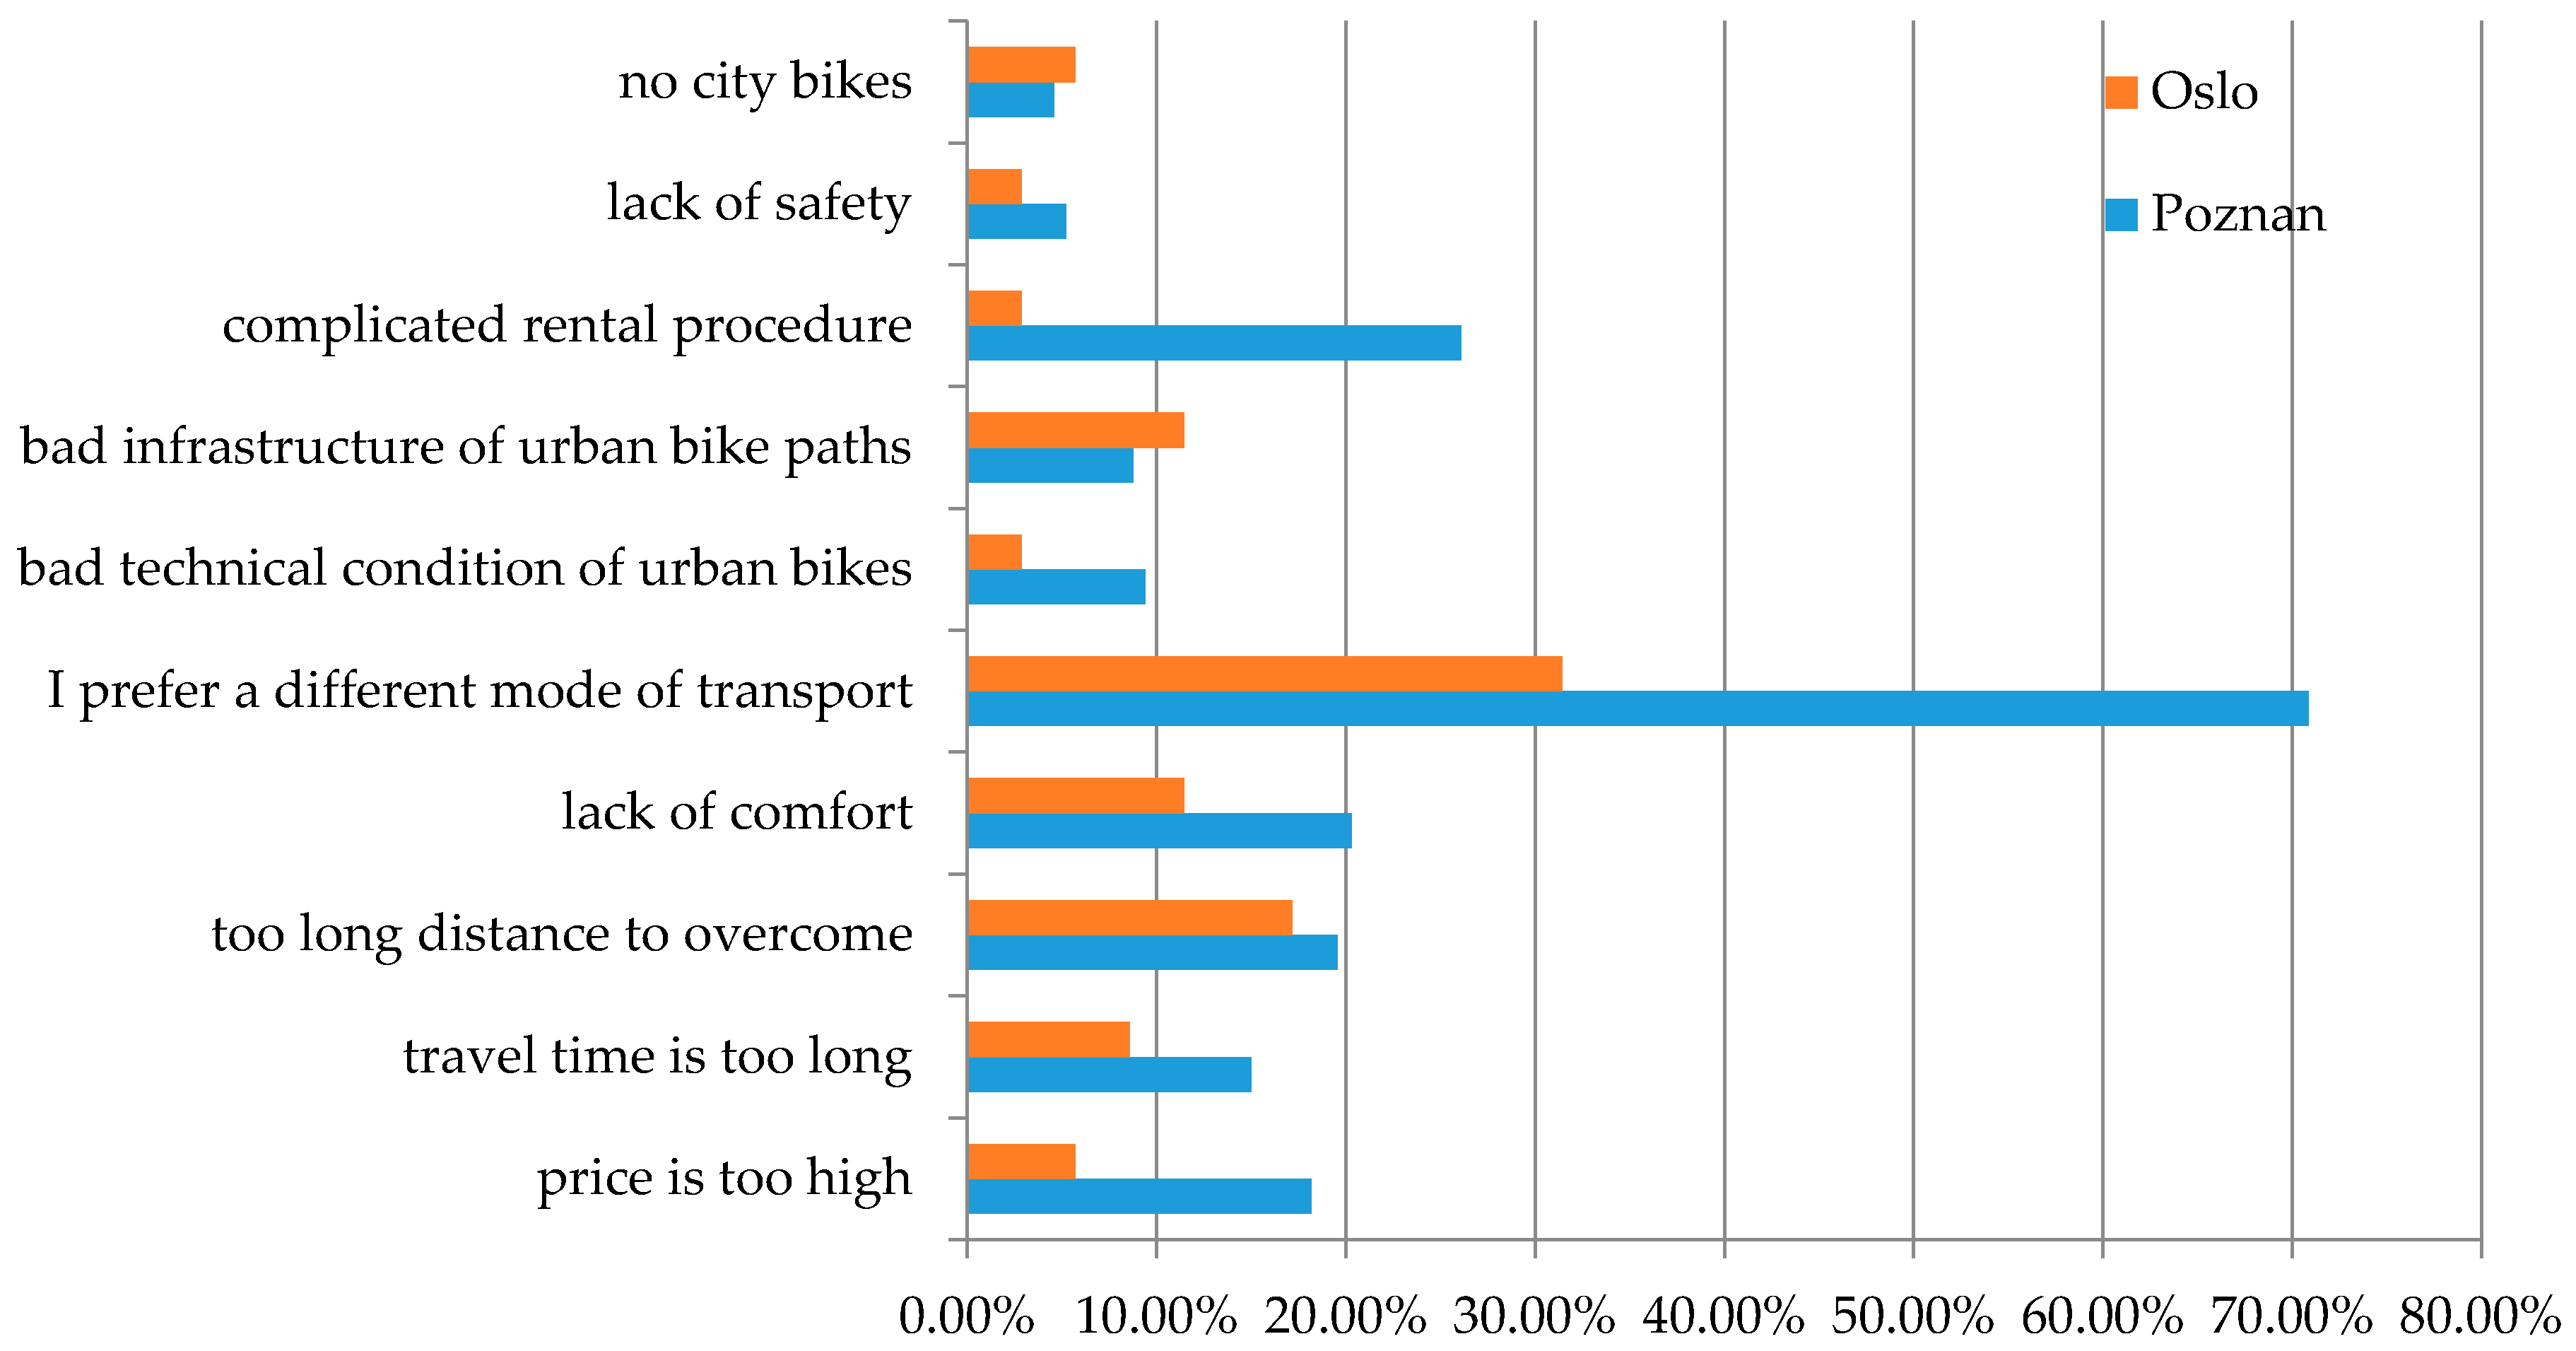
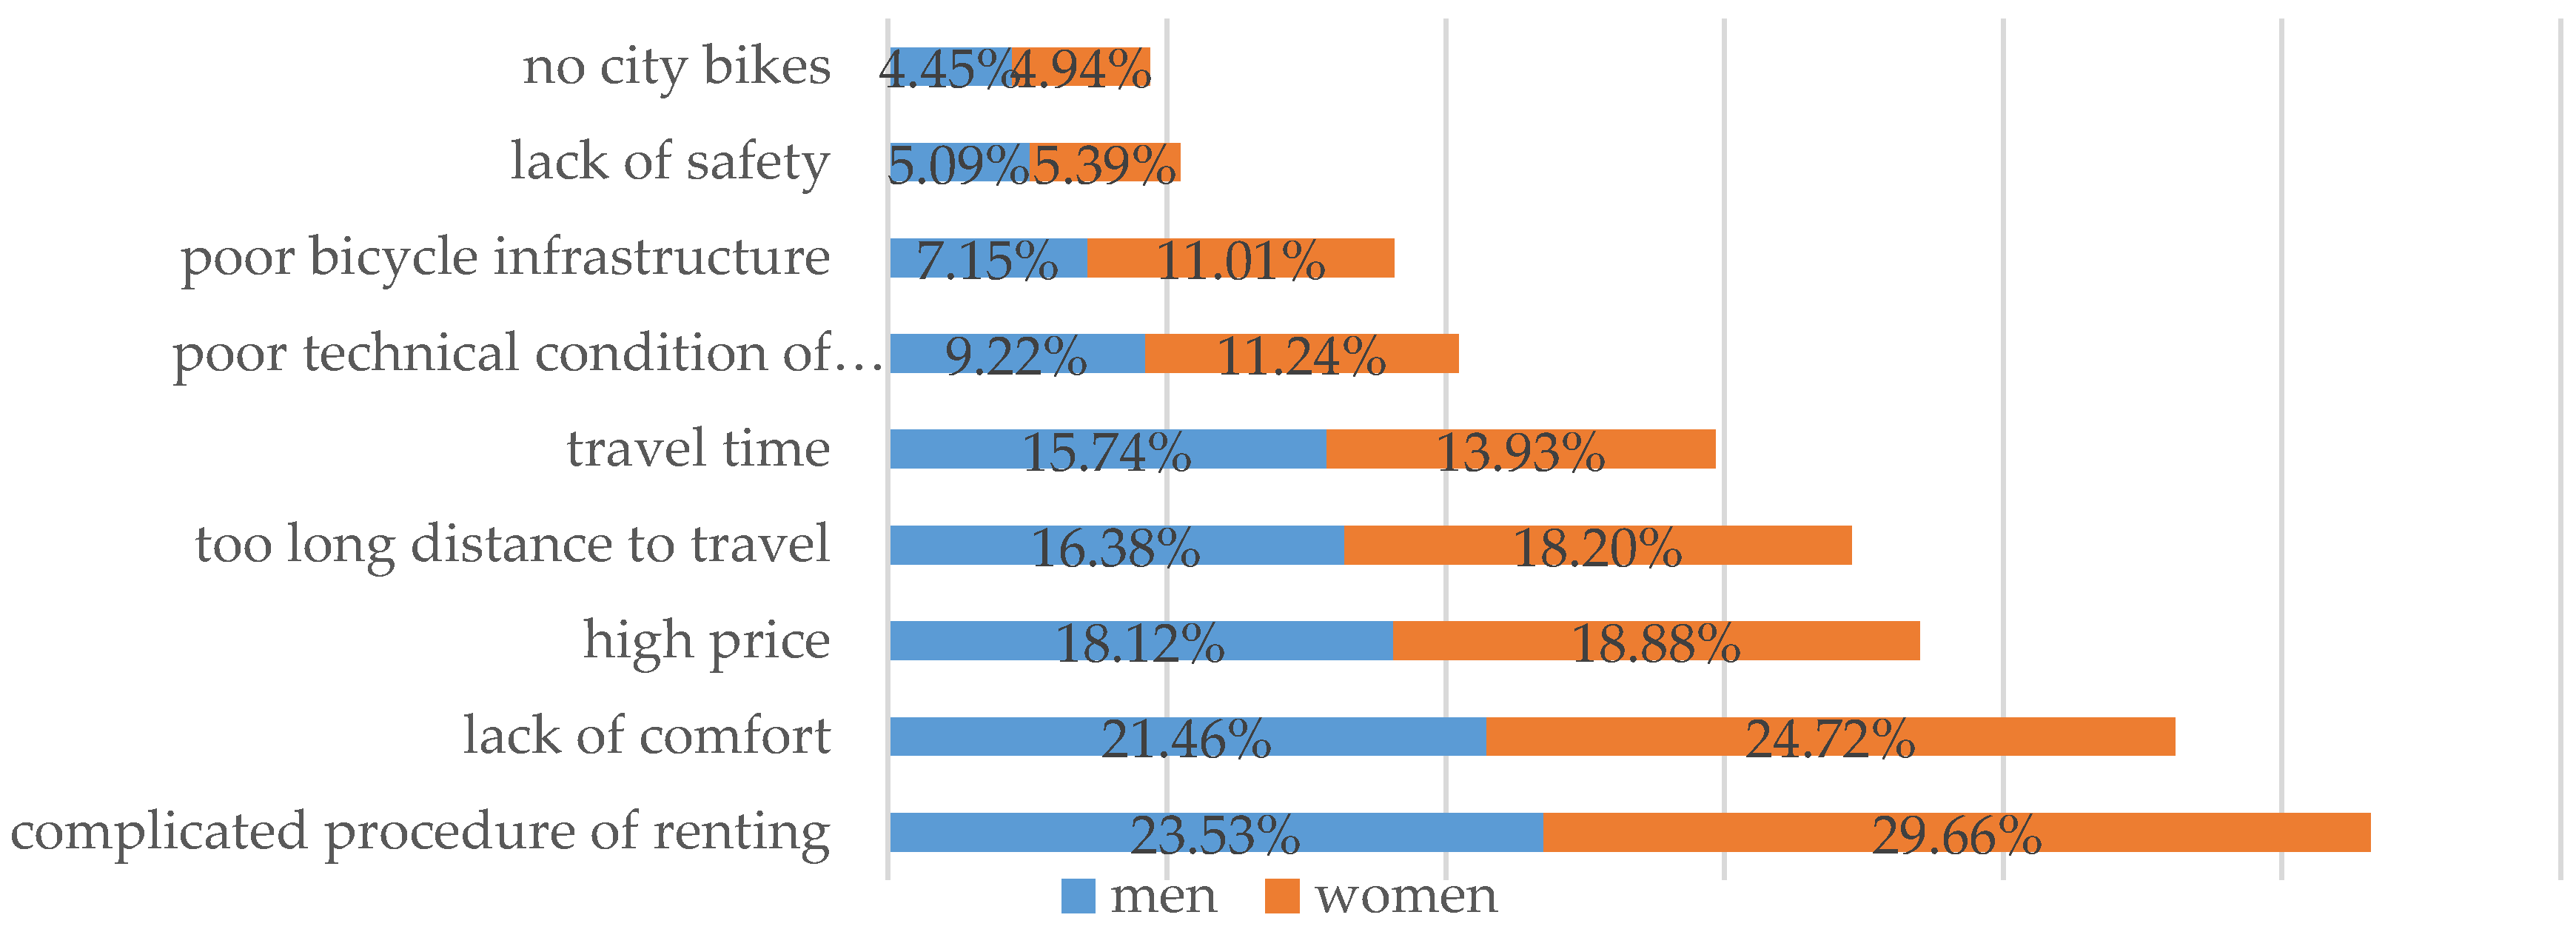
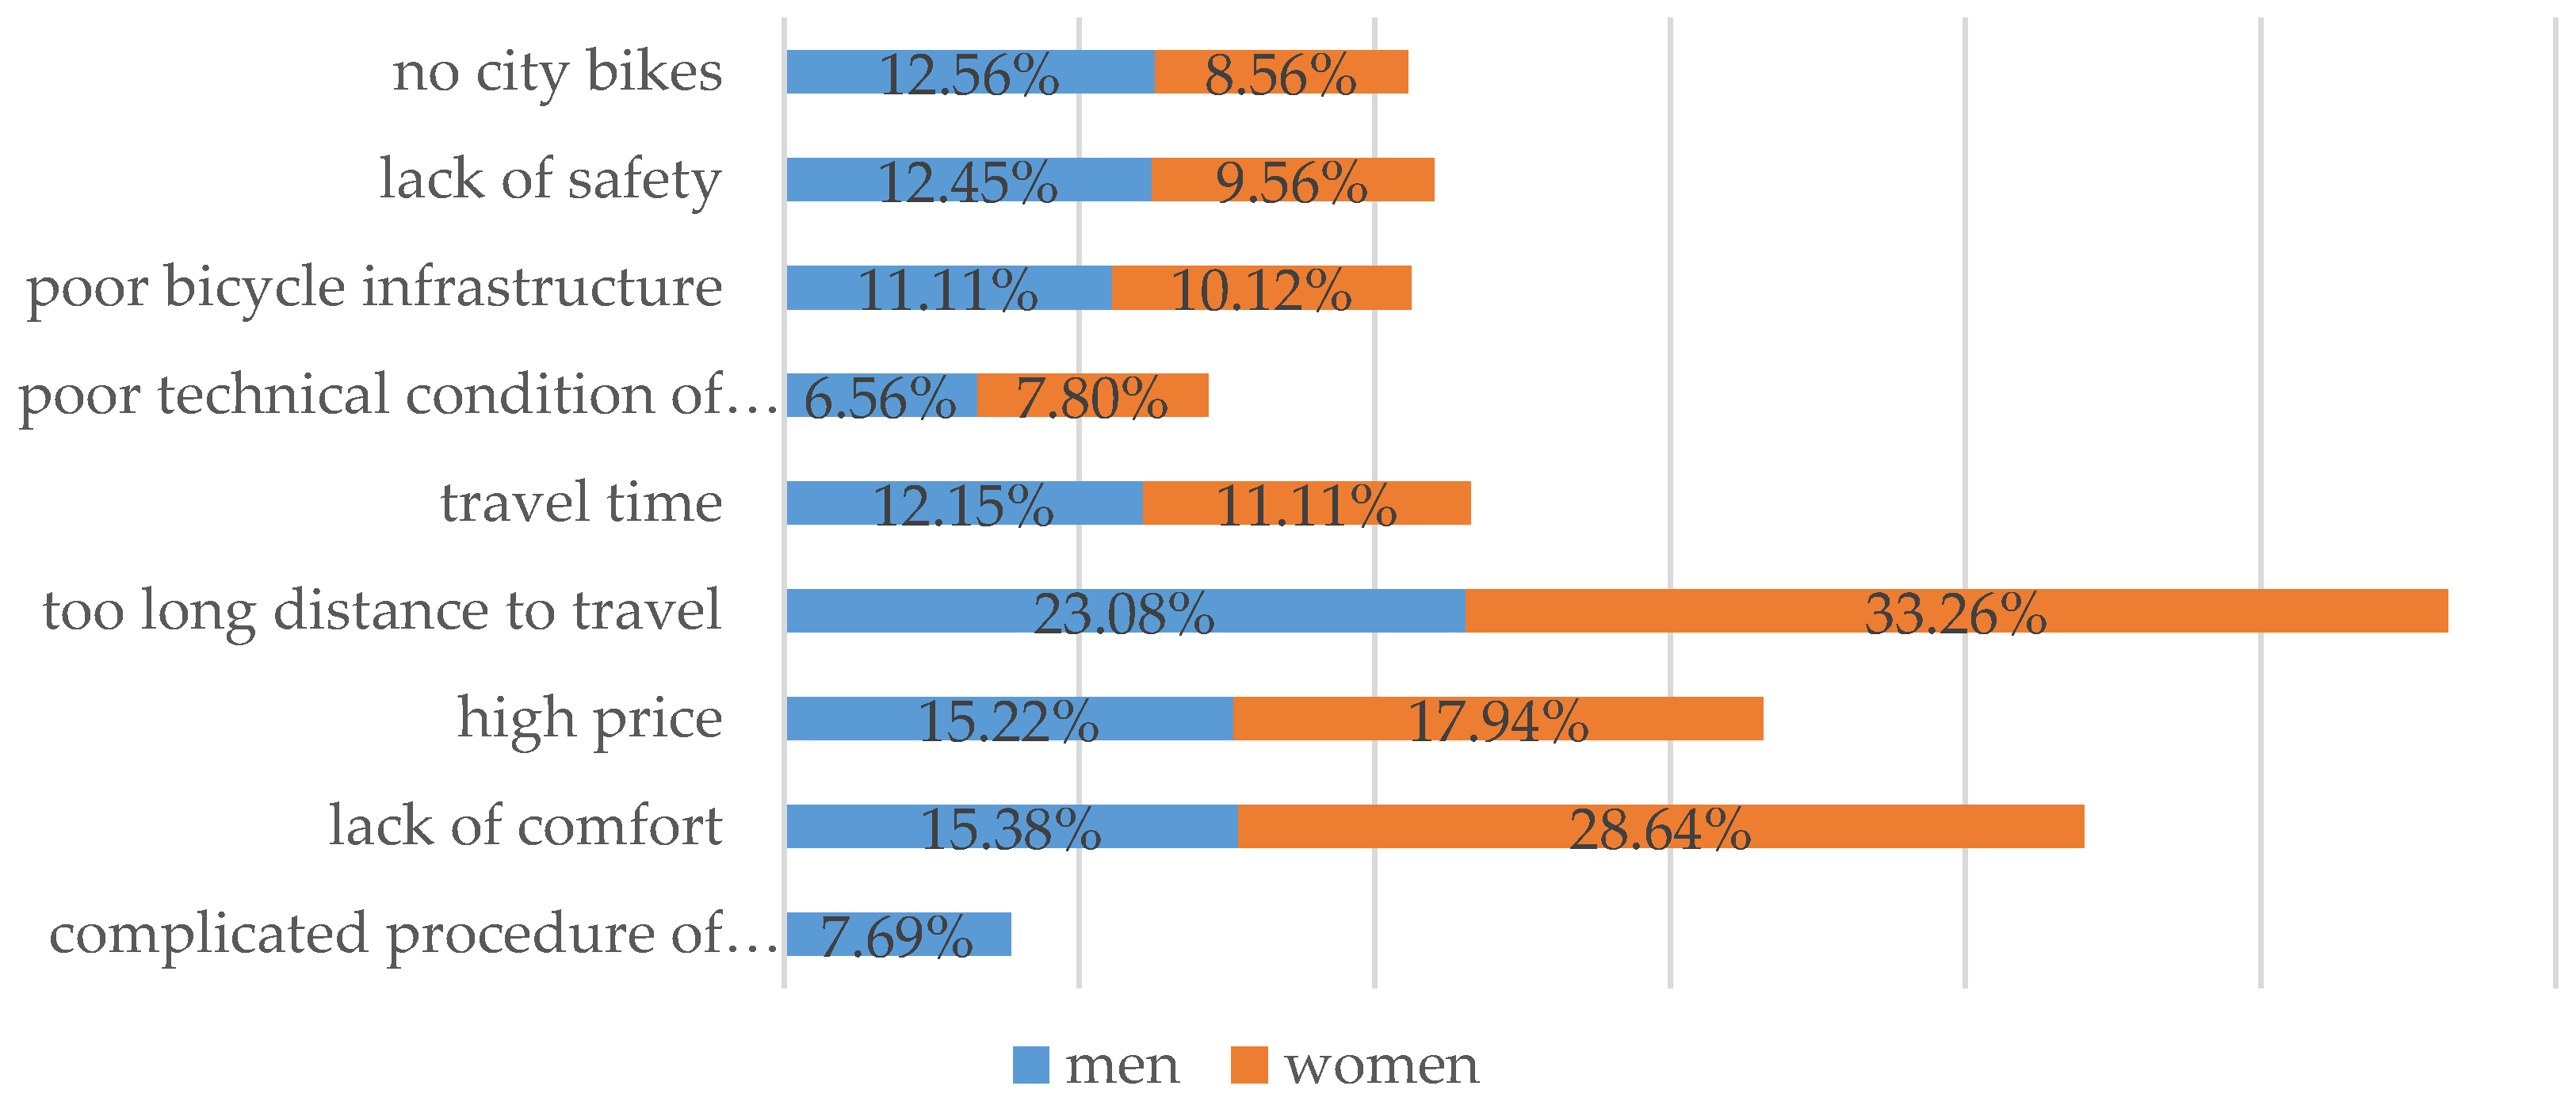
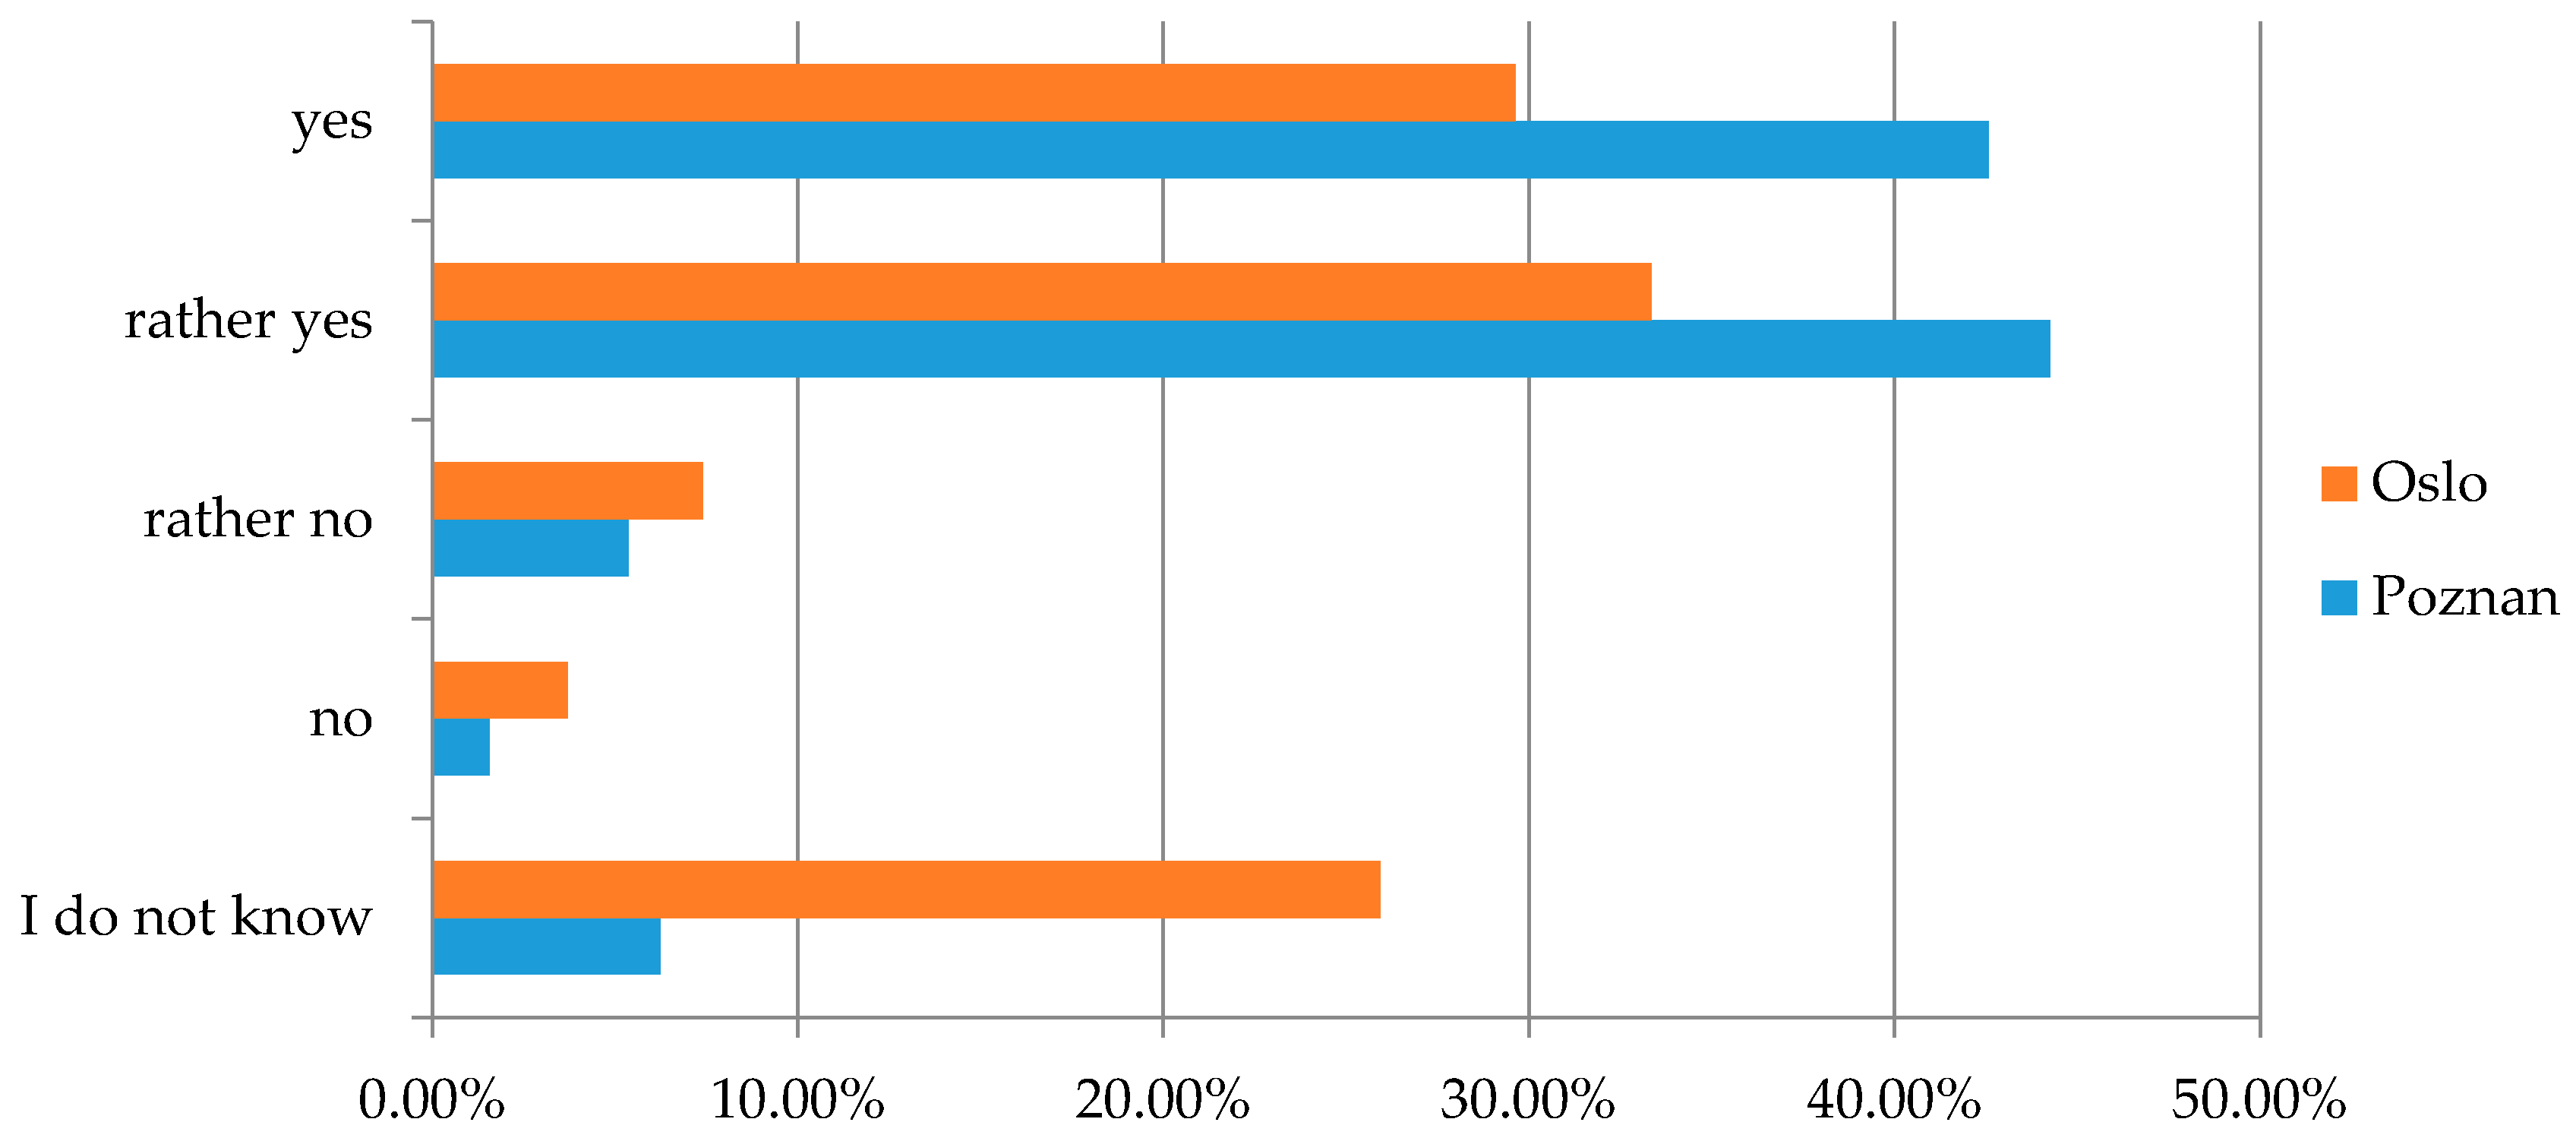