Article

Riparian Land-Use, Stream Morphology and Streambank Erosion within Grazed Pastures in Southern Iowa, USA: A Catchment-Wide Perspective

by
Mustafa Tufekcioglu
1,*,
Richard C. Schultz
2,
Thomas M. Isenhart
2,
John L. Kovar
3 and
James R. Russell
4
1
Faculty of Forestry, Artvin Coruh University, Seyitler Campus, Artvin 08000, Turkey
2
Department of Natural Resource Ecology and Management, Iowa State University, 339 Science Hall II, Ames, IA 50011, USA
3
USDA-ARS National Laboratory for Agriculture and the Environment, Ames, IA 50011, USA
4
Department of Animal Science, Iowa State University, Ames, IA 50011, USA
*
Author to whom correspondence should be addressed.
Sustainability 2020, 12(16), 6461; https://doi.org/10.3390/su12166461
Submission received: 16 July 2020 / Revised: 3 August 2020 / Accepted: 4 August 2020 / Published: 11 August 2020
(This article belongs to the Special Issue Sustainable Management of Semi-aquatic Ecosystems)

Abstract

:
Factors influencing streambank erosion at the field/reach scale include both watershed and riparian land-uses, stream hydrology and channel morphology at the catchment scale. This study assesses the relationship of riparian land-uses, stream morphologic characteristics and catchment scale variables to streambank erosion within grazed riparian pastures in the Southern Iowa Drift Plain. Thirteen cooperating beef cow–calf farms and their catchments ranging from 2.5 to 12.9 km2 in the Rathbun Lake watershed in South Central Iowa (USA) were chosen to conduct this study. Results suggest that the integration of stream morphologic characteristics and riparian land-uses at both the reach and catchment scale are necessary to explain the current level of streambank erosion measured at the reach scale. Larger catchment size or catchments with more total channel length were found to experience more bank erosion at the reach scale. A significant positive relationship between percent sand-and-silt in the bank soil and bank erosion rates implies that bank soils with less cohesiveness are more erodible. Catchment-scale assessments of the thirteen watersheds showed that within the 50 m corridor on both sides of the stream, 46 to 61% of riparian area was devoted to agricultural use and only 6 to 11% was in ungrazed perennial vegetation, much of it enrolled in the USDA Conservation Reserve Program. Overall, this and previous Rathbun watershed studies have shown that intensive agricultural use of riparian areas over such extents of time and scale could be directly (in field scale) and/or indirectly (watershed scale) related to excessive amounts of streambank erosion (ranging from 8.6 to 38.3 cm/yr) to receiving streams and lakes leading to their impairment and reduction in ecological services. Exclusion of cattle grazing in the riparian areas along buffered stream lengths (2.1% of the total watershed area) of the Rathbun watershed would reduce this impact. This approach could also be applicable to other similar watersheds with extensive land-use under grazed management.

1. Introduction

A river’s ability to erode and transport materials has been shown to be “a balance” between driving and resisting forces [1]. Driving force is directly related to the potential energy produced by the flow/discharge characteristics of a given stream cross-section. The driving force in Iowa streams has increased as a result of an increase in precipitation and the impact on surface runoff resulting from the conversion of 99% of Iowa’s tall grass prairie and 95% of its wetlands to row crop and grazed pasture agriculture [2]. In addition, some streams have also been channelized to increase arable land area for more agricultural production [3]. The resulting higher stream gradients and discharge has increased channel incision and the ability of streams to carry larger loads of sediment and nutrients throughout many parts of the Mississippi River basin [4]. Since stream discharge and gradient are proportional to sediment load and particle size [5], an increase in discharge and/or slope (driving force) must be balanced with an increase in sediment yield and/or sediment size (resisting forces). Any increase in discharge characteristics of an unstable stream channel must be followed with a morphological adjustment to dissipate the increased hydro-energy to create a new “state of equilibrium”. The morphological adjustment first starts with incision followed by widening and then aggradation, finally re-creating bank heights that are less than the critical height for instability and failure [6]. Over the long term, the change in the cross-sectional profile initiated by channel incision translates into a change in the longitudinal view as continued adjustments in the channel advance into the upper watershed [7]. Stream sinuosity is increased through meandering at the lower gradient downstream end of the channel network to reduce flow velocity in an effort to establish an equilibrium state from the modified upstream portion of the channel system. Such adjustments, however, could take many decades to complete.
The impact of local riparian land-use factors, such as animal grazing intensity, on bank erosion and/or cross-sectional channel modification has not been well established. This is partially due to the many interacting factors such as bank soil properties (cohesion of the bank soil or major textural unit), stream flow characteristics (number of high flow events and their frequencies), and channel morphology (stream bed slope and sinuosity; progression of channel evolution), all of which can play crucial roles in the adjustment of bank physiography and sediment loading [7,8,9,10]. However, some studies have concluded that riparian cattle grazing can initiate the first step towards greater eroded bank area and consequent destabilization [11,12] Indeed, a three-year study by Zaimes et al. [13] recorded greater streambank erosion rates from grazed pastures (continuous, rotational, and intensive rotational) than from riparian forest buffers and grass filters. In contrast, Nellesen et al. [14] stated that grazing management had no significant effects on site bank erosion.
In a riparian grazing system, the improvement in stream water quality will most likely be achieved with a set of integrated best management practices (BMPs) that are linked with stream geomorphic and hydrologic characteristics [15]. Additional resistance to stream flow can be introduced with a continuous cover of ground vegetation on the streambanks. This riparian vegetation can decrease bank retreat [16,17] by increasing bank stability and soil strength through mechanical reinforcement of the soil as a result of soil–root binding and from the hydrological effects of soil moisture extraction by transpiration, which leads to a reduction in soil pore-water pressure [18]. While herbaceous vegetation can effectively reduce the erosive effect of overland flow, woody vegetation has been observed to be more effective in reducing high streambank erosion rates and in promoting channel stabilization [19,20]. Knight et al. [21] suggested that the addition of a grass zone to the outside of a riparian forest buffer would reduce sediment loss resulting from ephemeral gullies and increase stream water quality. Li et al. [22] found an improvement in soil erosion resistance under the planting of grassy vegetation. Other BMPs, such as timing of cattle grazing, non-riparian shade, alternative water sources, and livestock exclusion with fencing, have been shown to effectively increase streambank stabilization [23,24], soil enzyme and microbial activities [25], and stream water integrity [14,26].
The purpose of this study was to assess the effect of riparian land uses and stream morphologic characteristics including streambank soil particle size, total streambank length and catchment size, and stream bed slope and sinuosity at the reach/field and catchment scale, on streambank erosion measured in grazed riparian stream reaches.

2. Materials and Methods

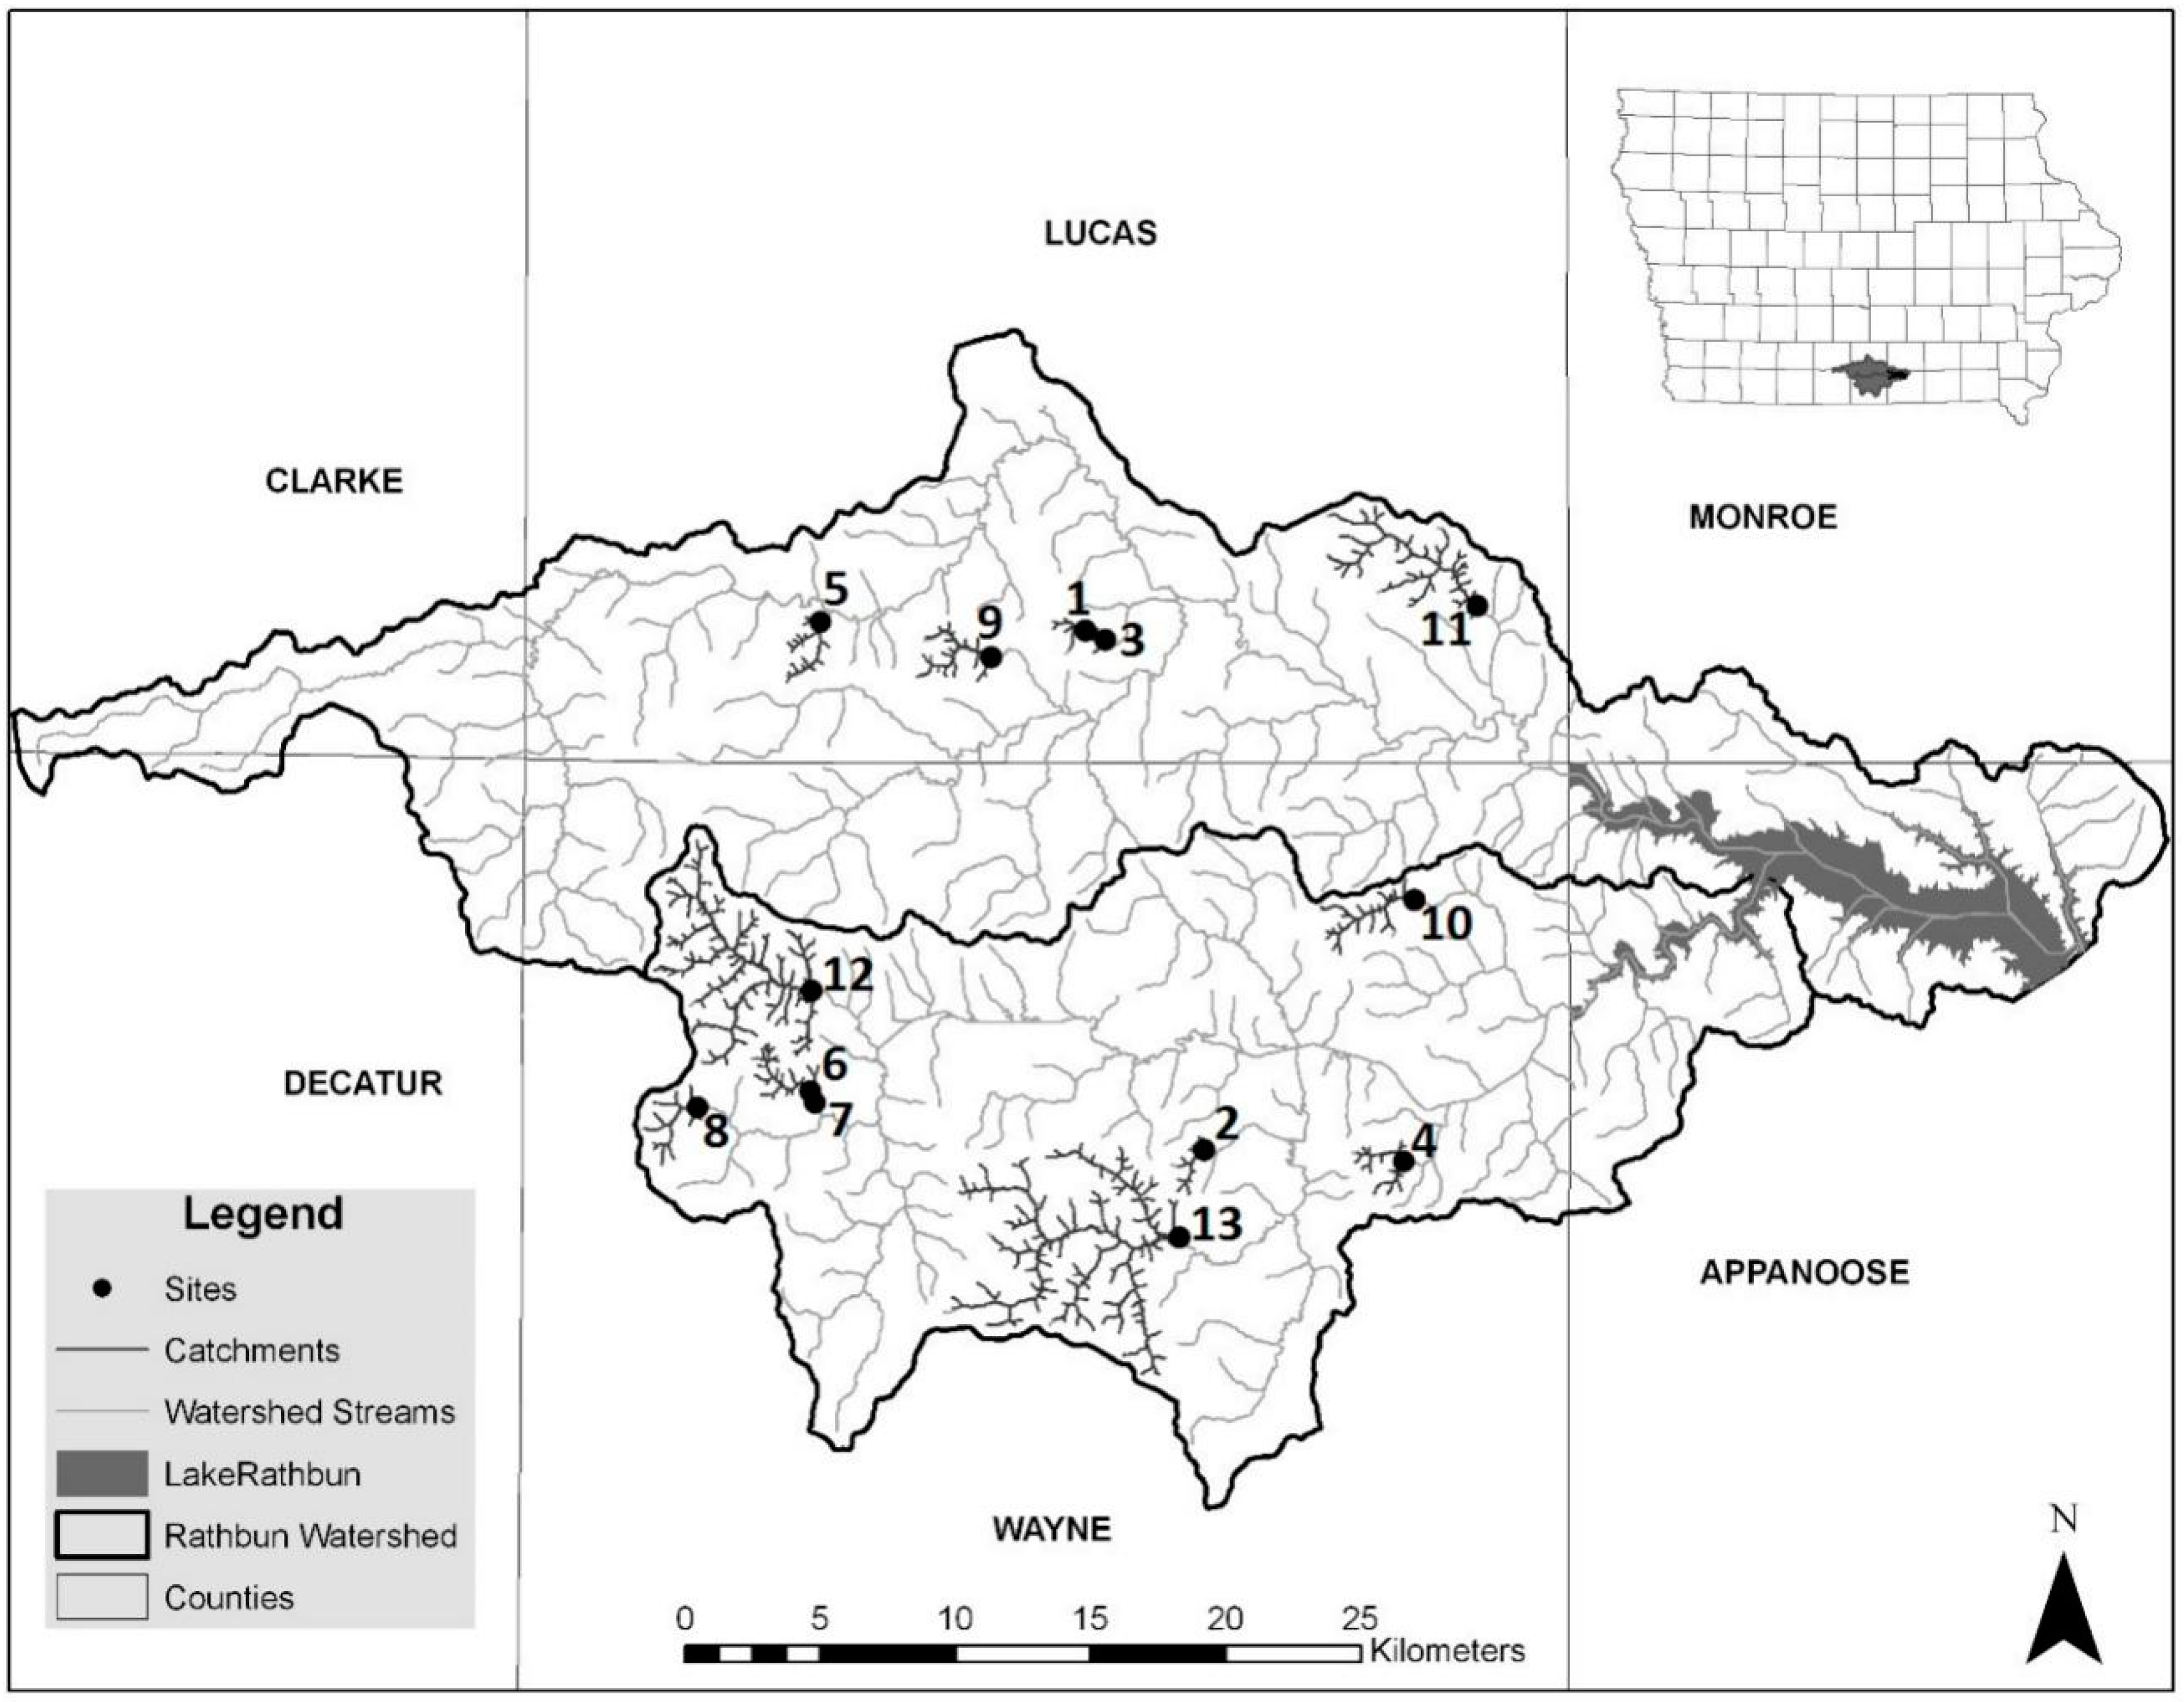
2.1. Study Sites and Treatments

Thirteen cooperating beef cow–calf farms along stream reaches in the Rathbun Lake watershed located on the Southern Iowa Drift Plain were chosen to conduct the study (Figure 1). The Southern Iowa Drift Plain is dominated by many rills, gullies, creeks, stepped erosion surfaces, integrated drainage networks, and rivers created by long geologic weathering processes [27]. In this region, streambank erosion takes place in glacial materials deposited about 500,000 years ago. Land use in the 143,323 ha Rathbun Watershed consists of 38% pasture and hayland, 30% crop land, 12% Conservation Reserve Program (CRP), 13% woodland and 7% urban/road/water. Riparian grazing treatments on the thirteen farms were classified by stocking rates that ranged from 0 to 28 cow-days m−1 yr. More detailed results/information regarding the Rathbun Lake watershed and its distinctive stocking rates and pasture characterization, and their effect on streambank erosion, were discussed by Tufekcioglu et al. [27]. Herein, we will specifically focus on the effect of riparian land use and land cover (LULC) and stream morphologic features, at both the field/reach and catchment scales, on streambank erosion.

2.2. Scope of the Work

Studies have pointed out that well-justified decisions regarding stream water quality and morphology can only be made if multi-scale processes (plot, field, and watershed) are accounted for in an integrated way [9,13,15,27]. In our companion study, carried out in same pasture sites as this one, we found that stocking rates of the grazing sites were significantly correlated to measured field parameters including eroded streambank length and bank soil bulk density [27]. However, there was no direct relationship between streambank erosion rates and stocking rates, which suggested that streambank erosion was not only related to field/reach scale processes but also watershed hydrological and morphological processes. Indeed, we found a significant relationship between stream flow stage and bank erosion from the same grazed pastures in the Rathbun Lake watershed [9]. In the present study, a number of soil and stream morphologic characteristics were monitored at the treatment pasture sites (stream sub-reaches) where erosion pins were installed in the streambanks and measured [27]. These characteristics were streambank soil texture, stream bed slope and sinuosity. Since streambank erosion is directly related to stream hydrology, any factor that contributes to a change in stream stage should also be monitored in order to document a change in streambank erosion [9]. As a result, we also measured stream characteristics at the catchment scale, which can contribute to an overall change in stream stages at the treatment pasture sites. These characteristics at the catchment scale (upstream channel system) included current land-use management of riparian areas within a 50 m strip on either side of the stream reaches, stream bed slope, sinuosity, and catchment stream length and size.

2.3. Streambank Soil Particle Size Analysis

Streambank soil was sampled using the soil core method (3 cm in diameter and 10 cm in depth; [28]). Soil samples for texture analysis were collected from eroded bank segments of the pasture stream reaches, where erosion pin plots were located. Soil sample collection was based on horizonation of streambank soils. Two soil cores from the mid-point of each horizon were collected for laboratory analysis. Since each soil horizon from the eroded bank surface had different heights, height-weighted averages were used to calculate the mean texture for the mean bank height for the plot. Soil particle sizes were determined by the pipet method, which relies on a solution of sodium hexametaphosphate to disperse soil aggregates into individual textural units [29].

2.4. Stream Bed Slope and Sinuosity

Slope and sinuosity measurements were calculated at two different scales using Geographic Information System (GIS) Arc Map 9.2 tools (Esri Inc., Redlands, CA, USA). One set of measurements was calculated at the grazed pasture stream reach (station) scale where the erosion pin plots were located. The other set included measurements at the catchment scale of stream reaches located above each of the treatment pastures. Stream bed slope values were calculated as the difference in elevations (rise) between the lowest and highest point of stream reach divided by the horizontal stream length (run) of a given stream reach. Sinuosity was estimated by first digitizing the total meandered length of a given stream reach at one meter resolution from Color Infrared digital orthophotos and then dividing that value by the straight line valley length of the reach.

2.5. Land-Use Determination within 50 m Strips on Either Side of the Stream

Land-use was determined using color-infrared orthophotos for the catchments above each of the grazed pasture sites (stations) where the pin plots were located. Similarly, land-use and land cover were determined within a 50 m strip along both sides of the stream using GIS Arc Map 9.2 tools. Land-use categories were classified as agricultural (grazed grassland, alfalfa, winter wheat, corn, and soybean), unmanaged (ungrazed grassland and deciduous forest), Conservation Reserve Program (CRP), and other (open water, roads, wetlands and residential areas) by stream order category (Figure 2).

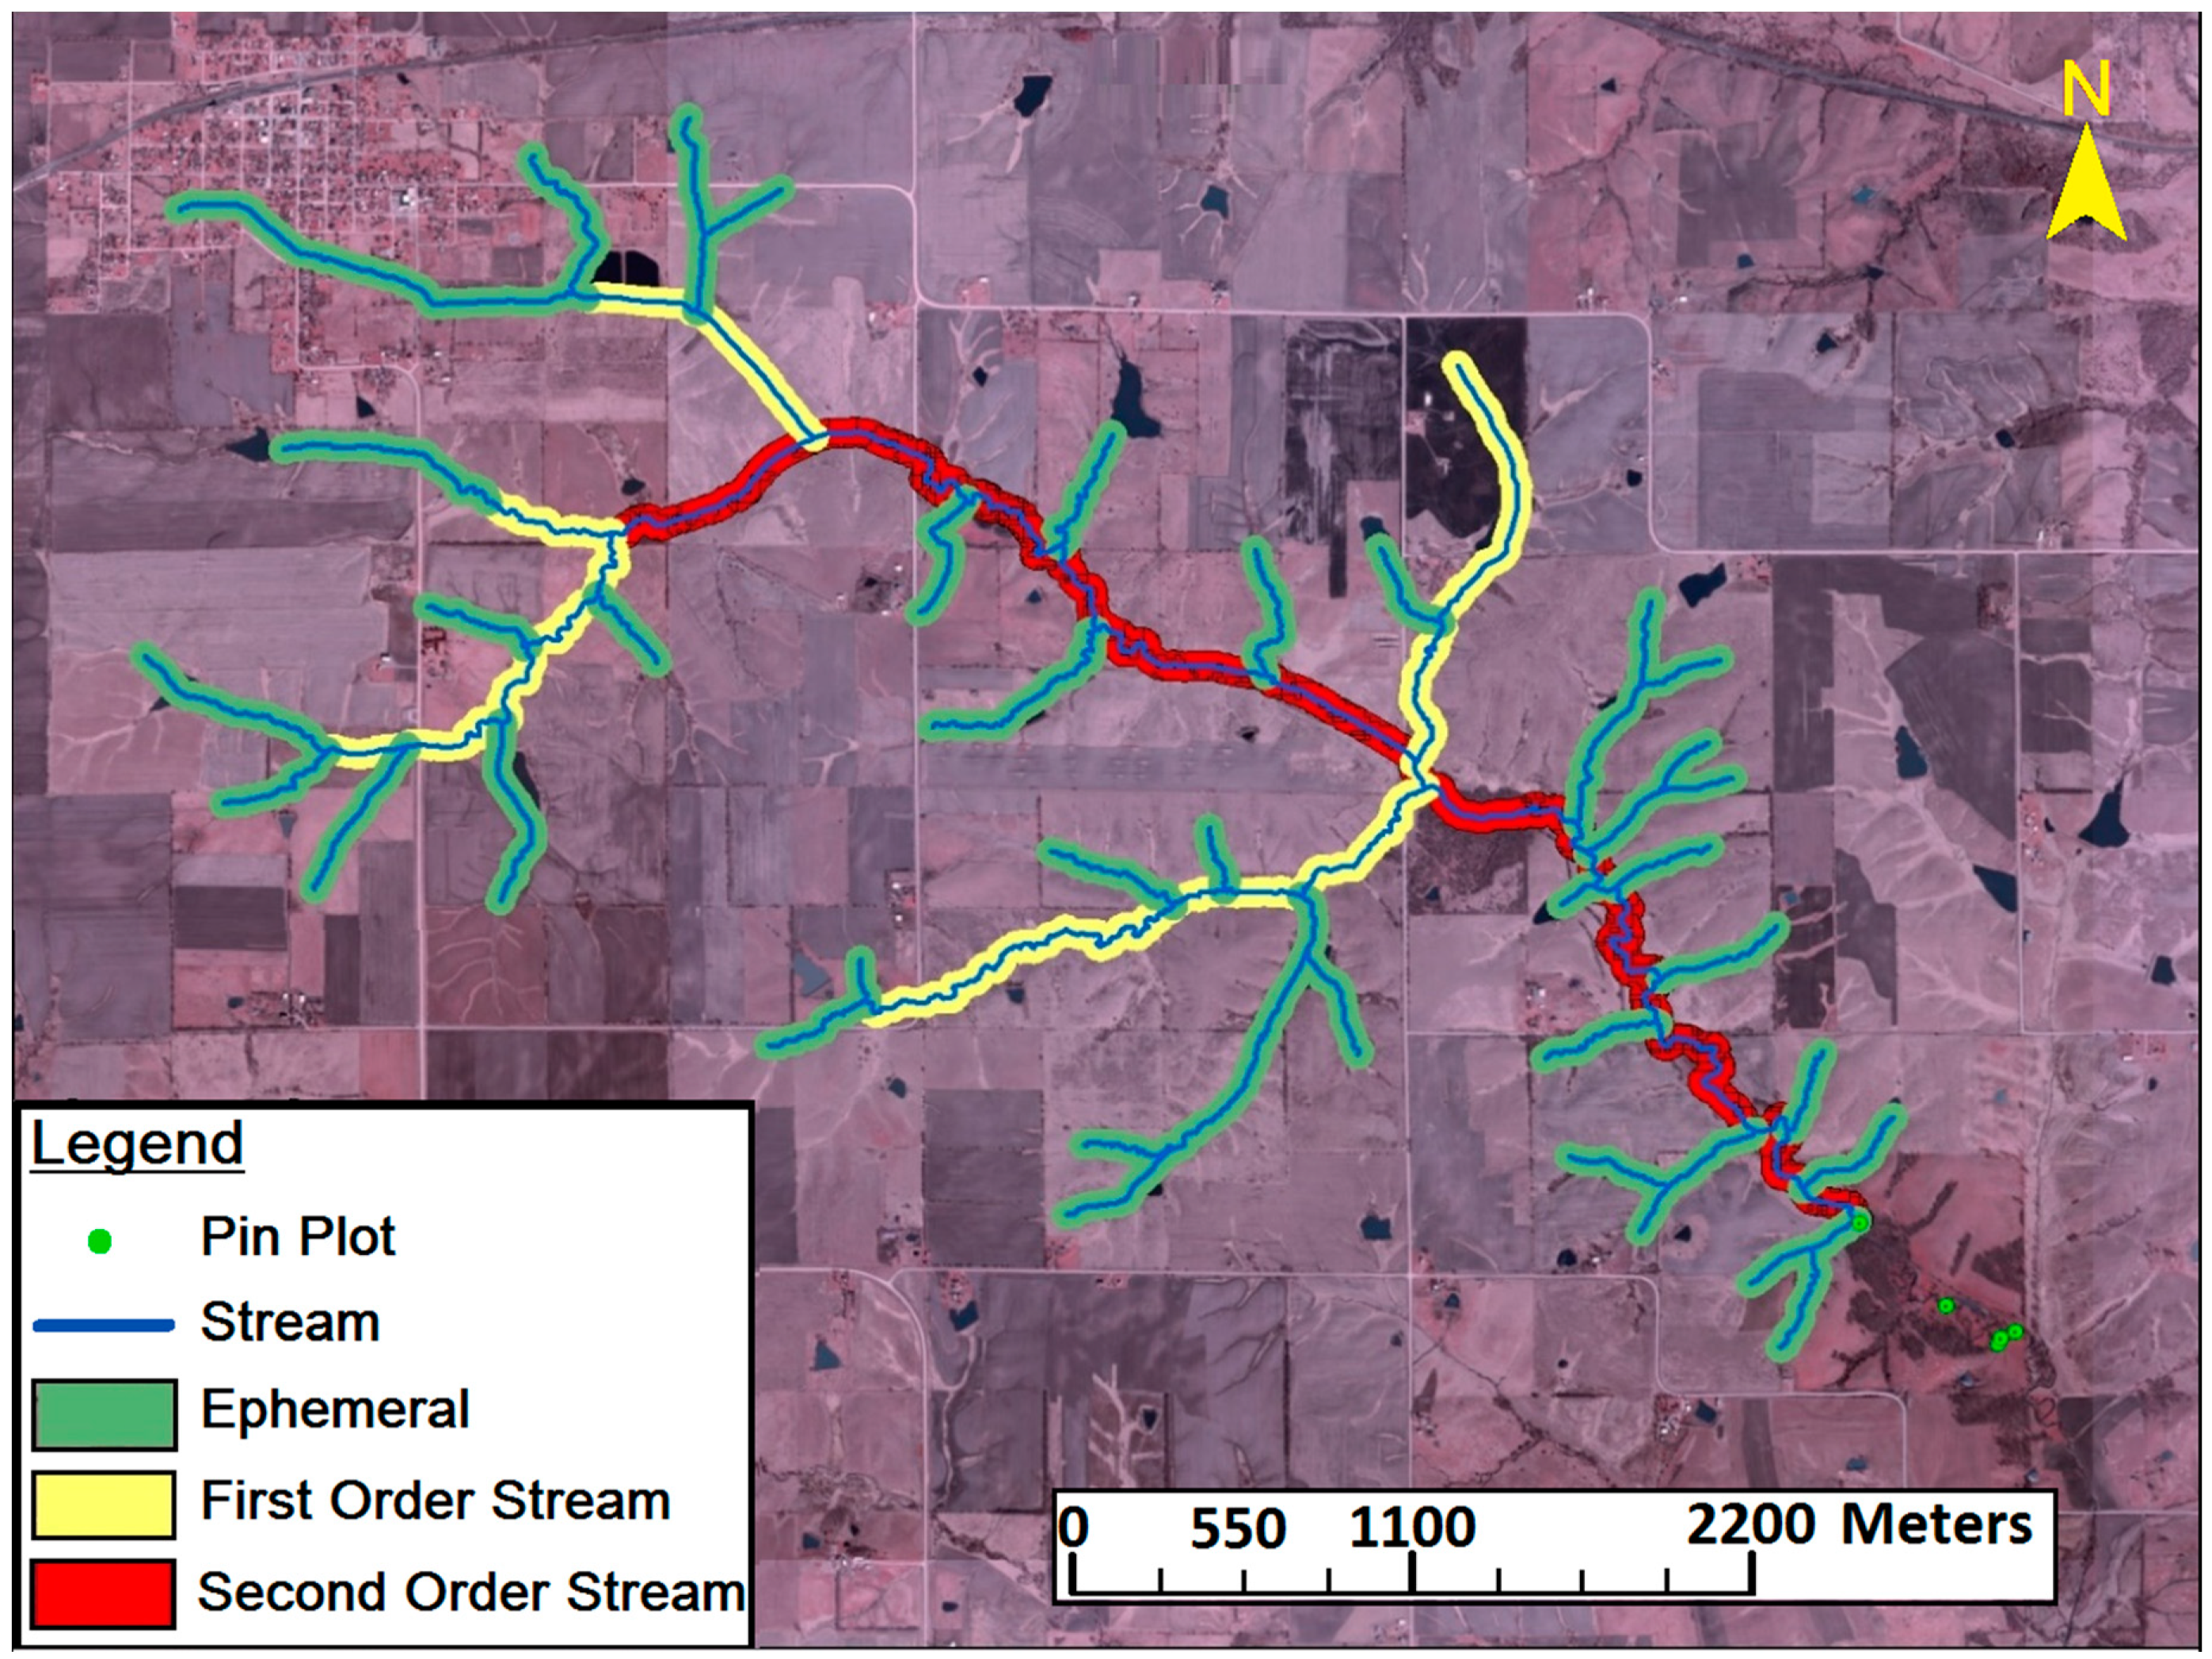
2.6. Catchments Size, Total Stream Lengths and Stream Order Classification

Catchment sizes and total stream lengths above each grazing pasture treatment were delineated and measured on digital orthophotos using GIS (Arc Map 9.2) software. Stream order was manually assigned to each catchment reach using the Strahler [30] classification system. Estimates of land use area within the 50 m strips along both sides of the streams were also described by stream order category (Figure 2).

2.7. Data Analysis

Relationships among bank soil texture, stream bed slope and sinuosity, and catchment land-use management on streambank erosion, were examined using the PROC MIXED procedure of SAS version 9.2 (SAS Institute Inc., Cary, North CA, USA). A multiple regression model, including streambank soil texture, stream bed slope and sinuosity, and land-use category (%), was used to explain the variability in the dependent variable, streambank erosion rate. The acceptable significance level was considered as p < 0.1 since bank erosion is influenced by many spatial, temporal, climatic and anthropogenic impacts.

3. Results and Discussion

Streambank erosion is a complex process driven by many interacting factors including bank soil properties (texture and structure as resisting force), stream morphology (longitudinal slope and sinuosity of the stream bed, and stream orders), and riparian land-use and its direct and/or indirect effects on stream hydrology and bank stability. In a degraded stream system, these factors are dynamic and adjust until a “state of equilibrium”, the balance between driving and resisting forces, is reached within the stream network. Once equilibrium has been reached, stream bed and bank degradation is minimized because the stream channel has adjusted to transport all of the sediment supplied to it with the available discharge. This dynamic process of channel modification is described by the channel evolution model [6], which is also important descriptors when addressing the variability in the sources of sediment load (top soil surface, streambank, stream bed, floodplain storage etc.) at the watershed scale and, in some cases, it may mask improvement in sediment reduction achieved by the edge of field practices [10]. Along with the effects of stream geomorphologic adjustment, riparian land-uses such as row-crop and grazed pasture have been shown to increase the bank soil loss and associated total-P by destabilizing the bank soil and by altering the flow regime of the stream itself [15,27,31].
In this three-year study, stepwise multi linear regression analysis revealed no significant relations among streambank erosion rates, streambank soil texture, stream bed slope and sinuosity, and percent of catchment in specific land-use category. This result may be related to the intensive agricultural land use as row-crop and grazed pasture, and low rates of CRP implementation in the riparian areas throughout all of the studied catchments, as well as the effects of spatial scale differences among the sites. However, there were some positive correlations between streambank erosion rates, and both sand-size particles in bank soil (%) and catchment stream lengths.

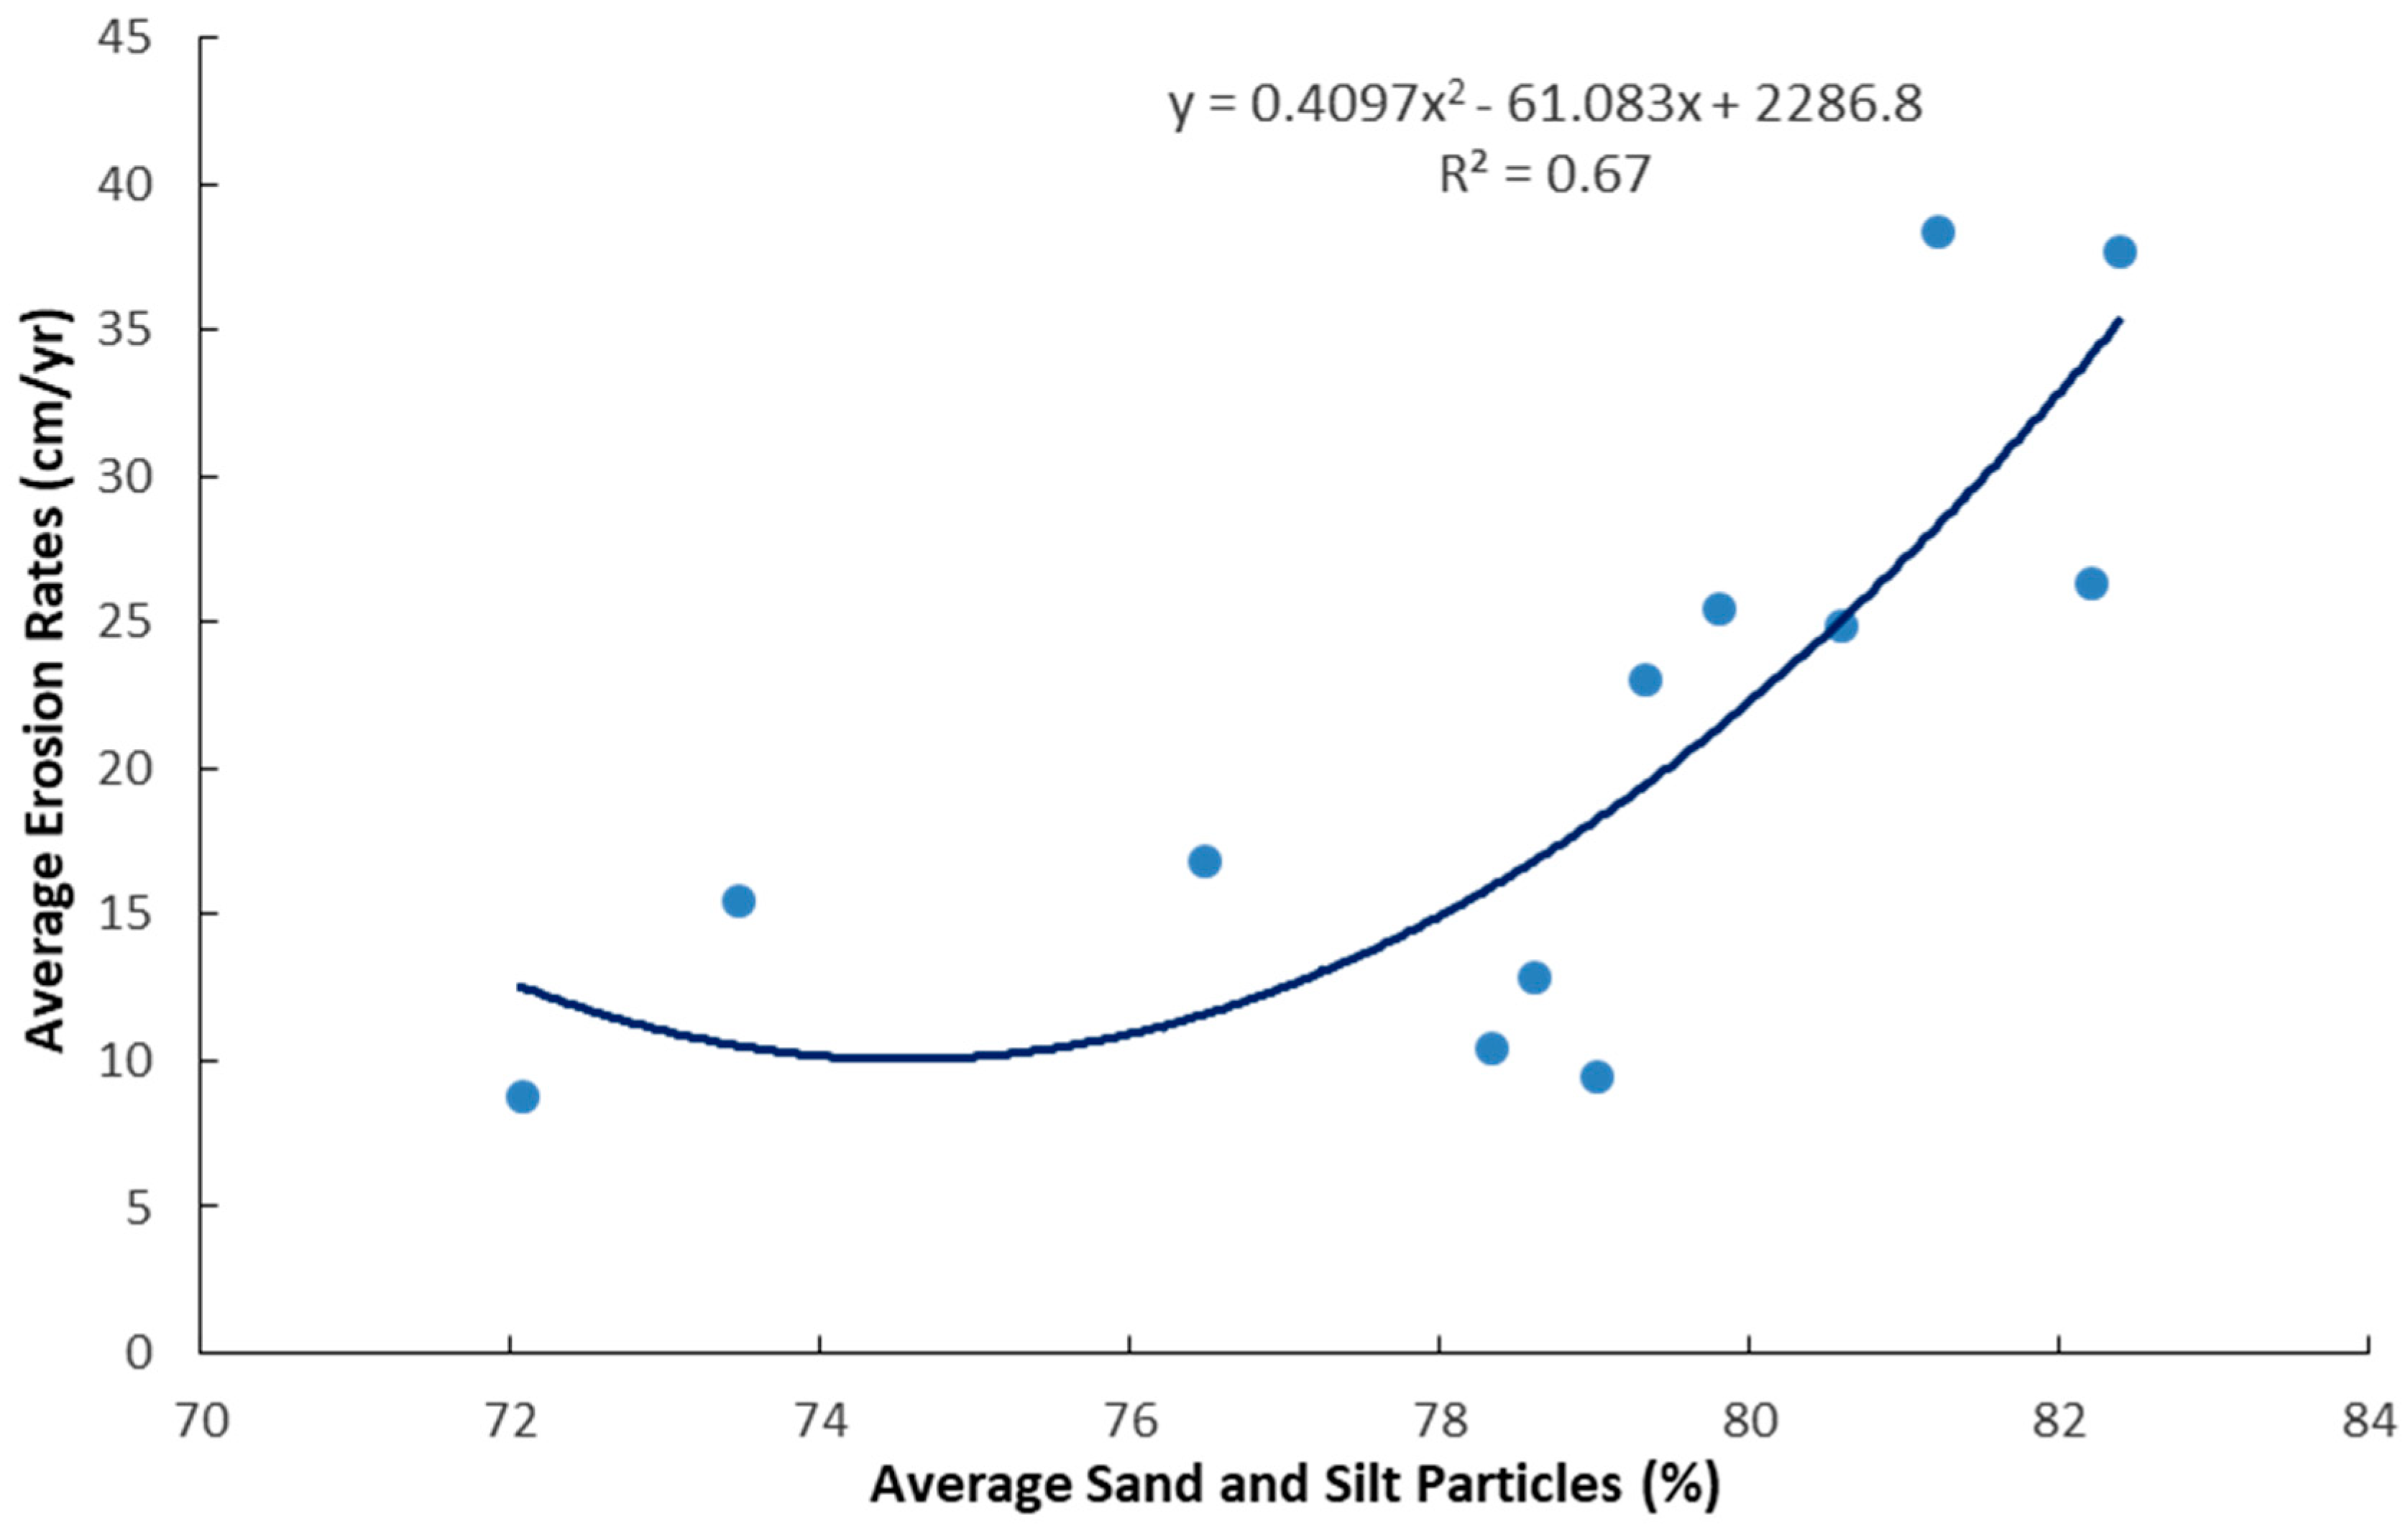
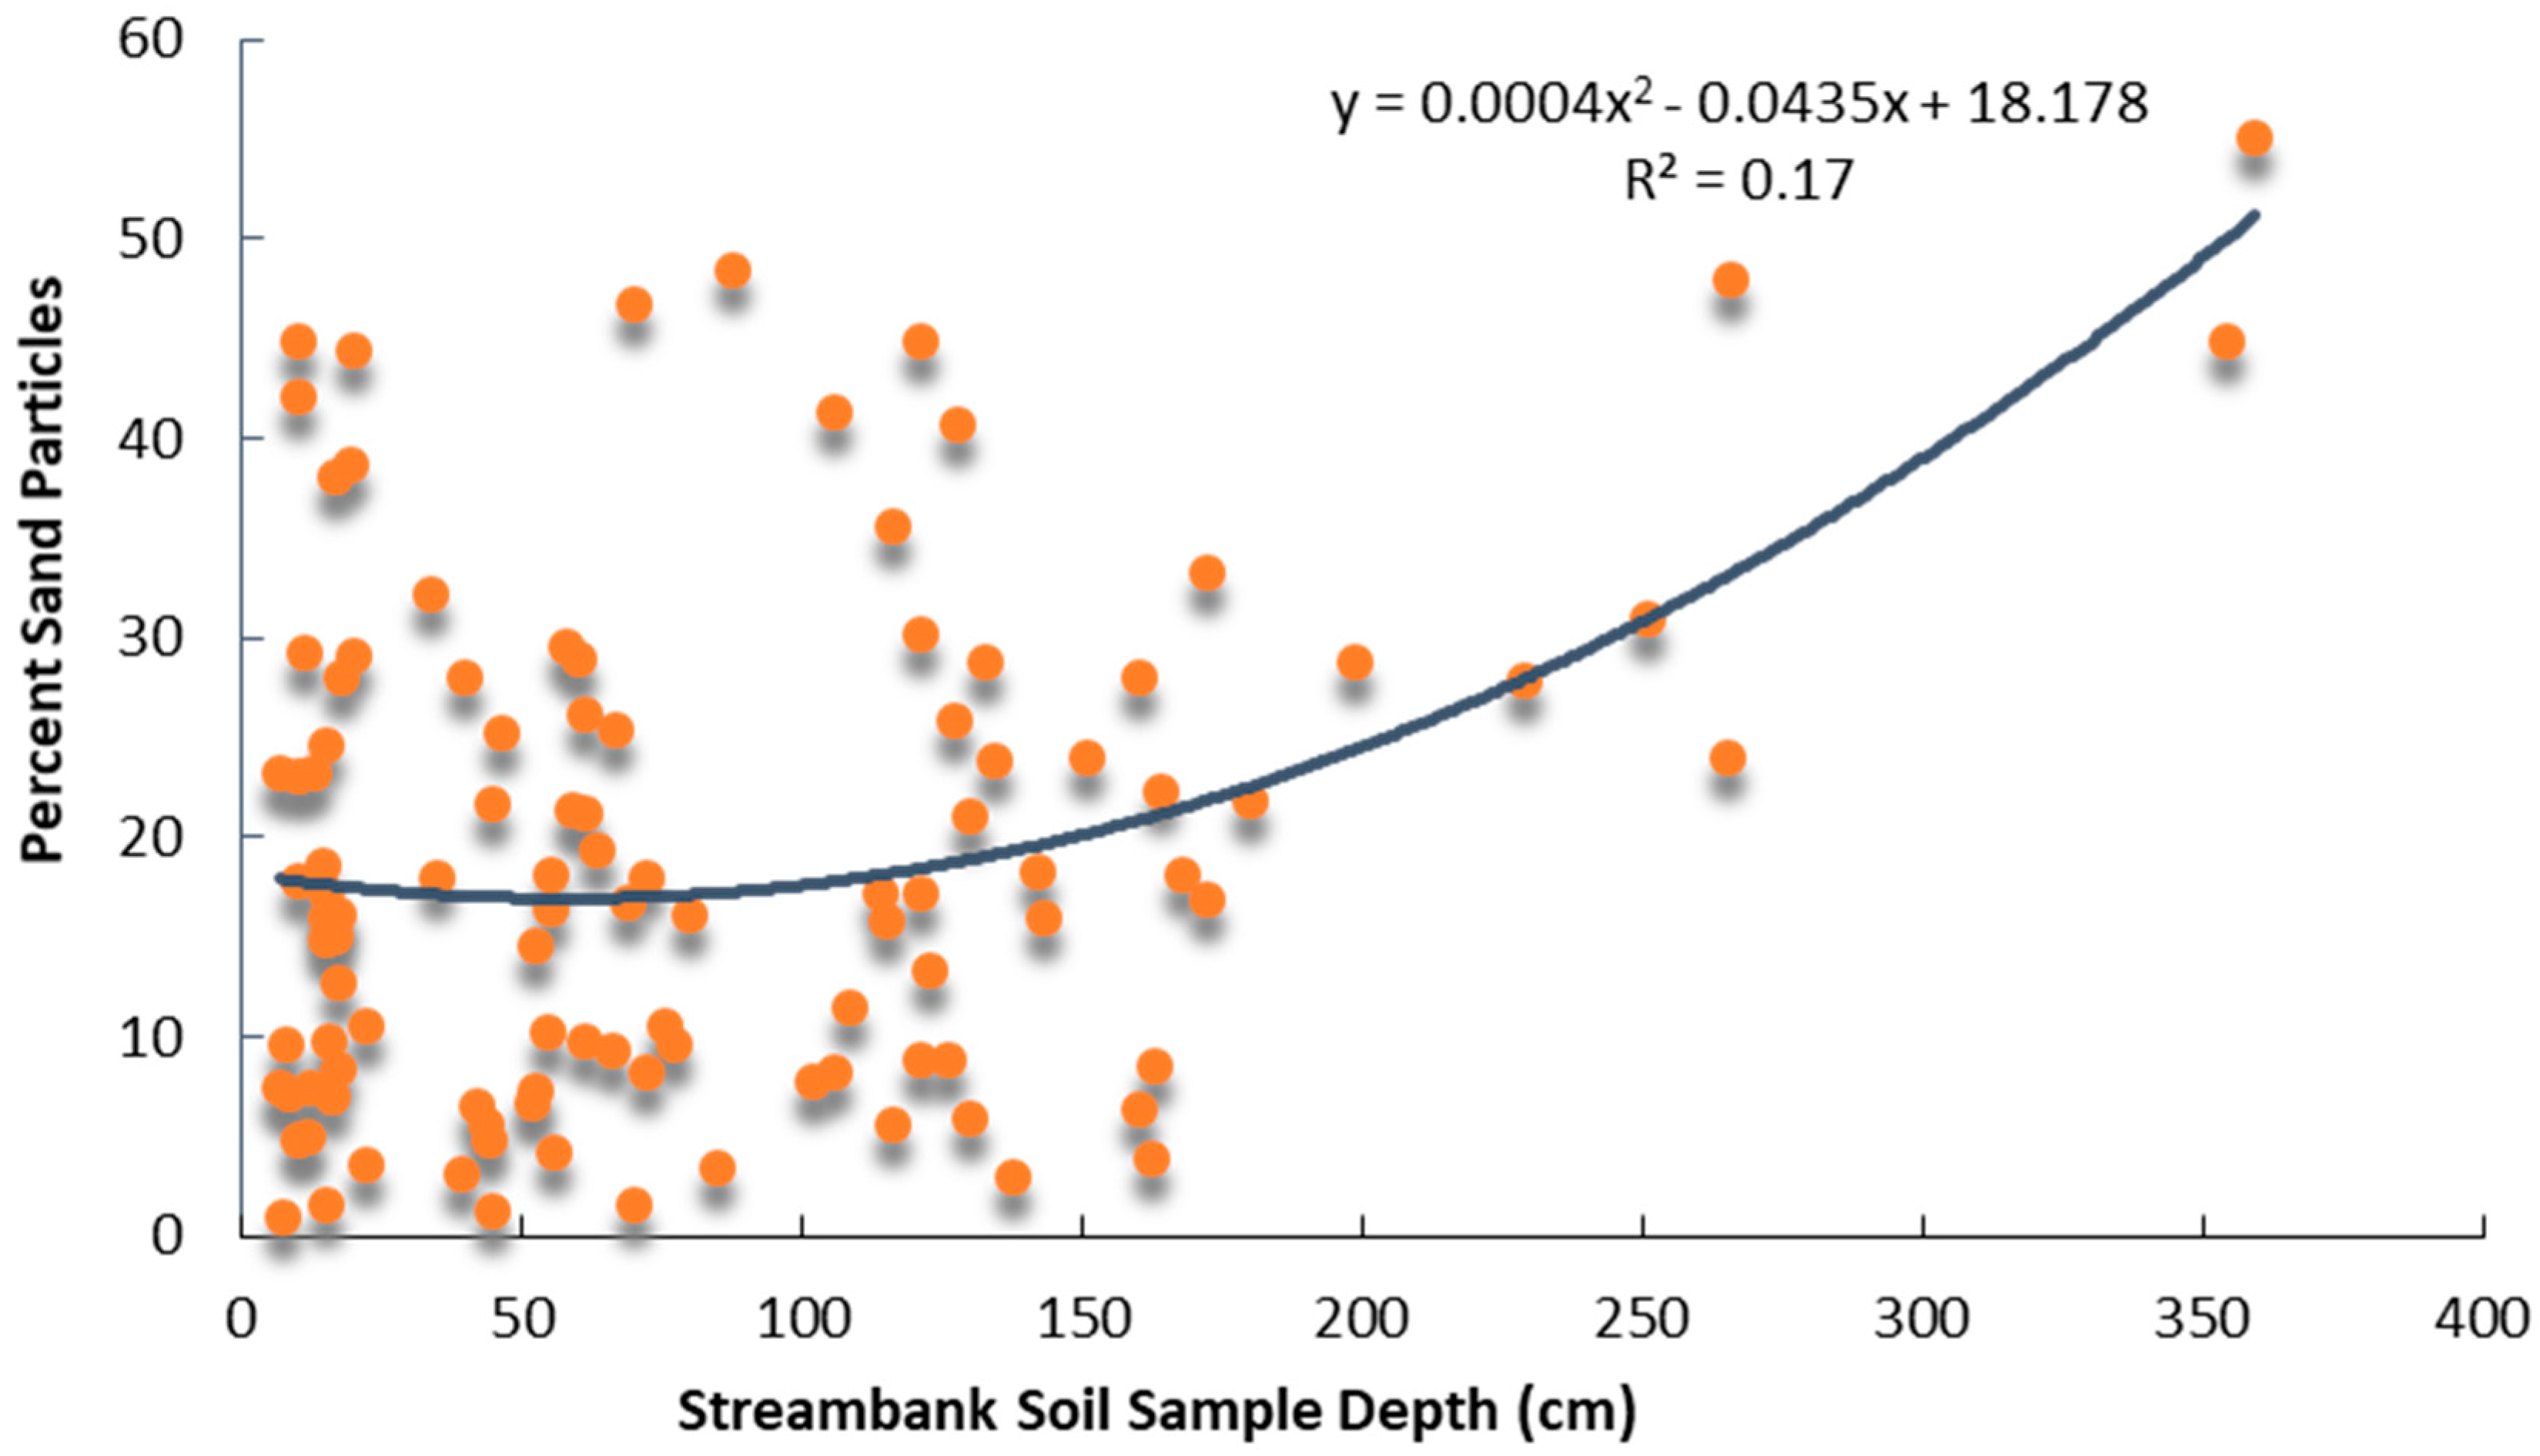
3.1. Streambank Soil Particle Size

In the dominant streambank textural classification of the thirteen sites was “silt loam” (Table 1). In this study, there was a significant relationship (p = 0.04; R2 = 0.36) between streambank erosion rates and total percent of sand and silt particles in the bank soil. The relation between these two variables was even higher (R2 = 0.67) when the outlier (site 7; [%75 sand and silt, 34 cm/yr erosion]) was not included in the relation best predicted by the polynomial model (Figure 3). Cohesiveness of a soil decreases with a higher percent of sand (coarser) particles, which increases its potential for detachment by stream flow (fluvial erosion) at a low shear stress [32]. Higher bank erosion rates with sandier bank materials have also been reported in other studies [11]. Others reported higher gully erosion with finer soil particles [33,34]. This may be due to effects of different stages (widening, incision, etc.) in the channel evolution model and associated variability in the sediment source input, and higher contribution by the “mass failure” bank erosion process during saturated conditions. In this study, the percent of sand significantly (p = 0.03; R2 = 0.17) increased with soil samples collected further down from the top of the streambank (Figure 4). This may partially explain the significantly higher erosion rates recorded from taller third-order streambanks (Table 2, [27]).

3.2. Stream Bed Slope and Sinuosity

Stream morphologic characteristics of the pasture reaches were compared to those of the catchment to see if there was any interaction between them that could shed light on streambank erosion in the pasture reaches. Although there were no significant interactions for a given stream order, from the data we can extrapolate that pasture stream reaches that were more sinuous and had lower stream bed slopes (site 3, 5, and 11) were most likely to yield smaller erosion rates within the given stream order classes (Table 2). However, in the case of site 5 and 11, the lower rates of bank erosion can also be attributed to the location of the stream reaches within the stream network. Site 5 was located just above the confluence with a third order reach and site 11 was just above the confluence with Rathbun Lake, so these two sites did not experience as much stream bed incision and bank erosion as the other sites because of frequent high water backup events from the higher order water bodies that were being blocked by debris. Although higher stream bed slope was recorded, lower streambank erosion rates were also recorded from site 1 and site 6, likely the result of both sites having well-established perennial vegetation through enrollment in the CRP. Grazing pasture site 7 experienced higher erosion rates than other first order streams, possibly because this site was located just below the CRP site 6 (Figure 1) where sediment input to stream water was lower. This may have increased the erosion rate from site 7 in order to maintain the equilibrium between stream power and sediment load (Qw. S ~ Qs. D50), as suggested by Lane’s [5] channel equilibrium model. In other words, if there is no sediment input with increased discharge passing through the vegetated banks of the CRP stream reach, the streambanks and bed of the unvegetated stream reaches of grazed pasture below the CRP site may erode more to increase suspended sediment concentration in the discharge [19].

3.3. Catchment Stream Length and Size

There was a significant relationship (p = 0.0309; R2 = 0.71) between erosion rates and catchment size (Figure 5). An even stronger relationship was found (p = 0.0173; R2 = 0.76) between erosion rates and catchment stream lengths by using the polynomial model (Figure 5). The larger catchment size or longer stream length translate into higher stage and stream power, which exerts greater stress on streambanks during high flow events [9]. This implies that when assessing streambank erosion at the field scale, it is important to account for the complexity of the entire stream channel network and its adjacent land-use introduced by scale differences [15]. Additionally, the gravitational force increases with bank soil saturation on the taller banks of higher order streams, which increases the soil bulk per unit weight [35], triggering bank failure and slumping. In the case of incised stream reaches with taller banks (mainly second and third order streams), bank stabilization should include trees along streambanks in addition to shrub and grass cover towards the field edge, whereas stream reaches with shorter banks (first order and ephemeral channels) could be stabilized with only grass and shrub cover [19].

3.4. Impacts of Land Use within 50 m Strips on Either Side of the Stream

Land-use/cover design and management at the watershed scale are major factors that control the amount of soil loss to water bodies [36,37,38,39]. On the other hand, the impacts of current riparian land-use on bank erosion at the field (reach) scale are still poorly understood due to varying temporal and spatial scale effects on stream hydro-morphology and the effects of connectivity of the stream channel process and riparian ecosystem [16,40,41]. Indeed, Myers et al. [42] recorded varying rates of streambank erosion throughout the watershed.
In this study, riparian land-use at the catchment scale within the 50 m corridor on both sides of the stream was found to consist of 46 to 61% agricultural use (row-crop and grazing), 6 to 11% in CRP (grass filter,) with the rest mainly unmanaged (Table 3). The small amount of riparian area within conservation buffers (maximum of 11%) illustrates a significant opportunity for implementation of management to reduce surface runoff and bank erosion [43]. However, because variation in stream discharge [16] and/or stage [9] is highly correlated to bank erosion rate, the impact of riparian management alone on bank erosion would not be enough to explain differences in erosion rates from these thirteen reaches. The connectivity of the stream ecosystem at the larger scale is not only important for aquatic ecosystem integrity [24] and water quality [44], but is also important for the stream morphologic and hydrologic modification that occurs further away from the place of perturbation. Richards et al. [45] found that stream morphological characteristics were strongly related to catchment conditions. Indeed, a study by Mukai [34] found strong correlation between gully erosion and other variables including catchment topography, morphology of the gully network and land cover/use change over a long temporal scale. These relationships could be one of the major reasons that the erosion rates in this study were not directly correlated [27] with pasture grazing intensities (cattle stocking rates). In this case, when evaluating the effect of stocking rates on the change of bank morphology at the reach scale, selection of bank erosion as the sole response variable may not be an appropriate choice [46] since it is not only under the influence of current riparian land-use, but also the complex nature of stream biogeochemical and hydrologic interactions in the longitudinal dimension at the catchment scale [47].
Since riparian areas are considered to be the critical source areas for sediment and nutrient contributions to the stream, their protection is very important for stream water quality and aquatic integrity. However, conversion from agricultural to conservation land-use represents opportunity costs to landowners. The magnitude of such costs can be assessed using a hypothetical situation where the total stream lengths on either side of the stream were buffered with perennial vegetation within 50 m. Under this scenario, an average of 2.1% of the total watershed would be required to buffer the streams (Table 4). Without a consideration of farm profitability, the ultimate solution to the stream water impairment problem at the large scale and over the long term lies in the dedication of this 2.1% of overall land-use for the recovery of riparian corridor function and stream habitat integrity.

4. Summary and Conclusions

Multi linear regression analysis showed no significant interaction between the independent variables streambank soil particle size, stream bed slope and sinuosity, and percent of riparian land-use, with streambank erosion rate as the response variable. This may be due to the complexity of the interactions between stream morphology and hydrology at both the field and catchment scales, and the relatively short duration (3 years) of the study. However, significant relationships between percent of bank total sand-and-silt particles and erosion rates revealed that bank soils with less cohesiveness are more likely to erode due to reduced binding capacity of the soil against erosive flow. Larger catchments or longer stream channels were found to be related to higher bank erosion rates, possibly due to the high potential stream discharge and taller saturated banks, which increase the gravitational force in the soil column resulting in soil strength failure and collapse. At the catchment scale, riparian vegetation cover assessment showed that within the 50 m corridor on both sides of the stream, 46 to 61% of riparian area was devoted to agricultural crop production and grazing, and only 6 to 11% was in CRP, with the rest mainly in “unmanaged use”. These data and previous studies allow the speculation that, in the long term and at the catchment scale, a high percentage of agricultural land-use in riparian areas can either directly or indirectly alter stream hydrologic regimes. In order to reach an equilibrium condition, where energy input to the stream channel is balanced with the minimal channel boundary resistance, such land-use alteration will result in streambank erosion and changes in channel morphology.

Author Contributions

For conceptualization, methodology, writing—original draft preparation, writing—review and editing, and formal analysis, M.T., R.C.S., T.M.I., J.L.K., and J.R.R. were involved. All authors have read and agreed to the published version of the manuscript.

Funding

This research was funded by the USDA Cooperative State Research, Education, and Extension service.

Acknowledgments

For their generous help in the field and laboratory we would like to thank the following staff and students: E. Kilburg, S. Mulder, T. Harms, W. Phillips, F. Boyer, D. Bear, N. Hongthanat, T. Hanson, L. A. Long, J. Lancial, C. Yildirim. We also would like to thank the landowners for allowing us to use their farms as research sites.

Conflicts of Interest

The authors declare no conflict of interest.

References

  1. Ritter, D.F.; Kochel, R.C.; Miller, J.R. Process Geomorphology, 4th ed.; McGraw-Hill Companies, Inc.: New York, NY, USA, 2002; p. 190. [Google Scholar]
  2. Whitney, G.G. From Coastal Wilderness to Fruited Plain: A History of Environmental Change in Temperate North AMERICA, 1500 to Present; Cambridge University Press: Cambridge, UK, 1994. [Google Scholar]
  3. Guthrie, W.K. Drainage, drainage, drainage: Creating natural disasters in Southeastern Nebraska. Great Plains Q. 2000, 20, 297–310. [Google Scholar]
  4. Knox, J.C. Agricultural influences on landscape sensitivity in the Upper Mississippi River Valley. Catena 2002, 42, 193–224. [Google Scholar] [CrossRef]
  5. Lane, E.W. Design of stable channels. Trans. Am. Soc. Civ. Eng. 1955, 120, 1234–1260. [Google Scholar]
  6. Simon, A.; Klimetz, L. Relative magnitudes and sources of sediment in benchmark watersheds of the Conservation Effects Assessment Project. J. Soil Water Conserv. 2008, 63, 504–522. [Google Scholar] [CrossRef]
  7. Simon, A.; Rinaldi, M. Disturbance, stream incision, and channel evolution: The roles of excess transport capacity and boundary materials in controlling channel response. Geomorphology 2006, 79, 361–383. [Google Scholar] [CrossRef]
  8. Bak, L.; Michalik, A.; Tekielak, T. The relationship between bank erosion, local aggradation and sediment transport in a small Carpathian stream. Geomorphology 2013, 191, 51–63. [Google Scholar] [CrossRef]
  9. Tufekcioglu, M.; Isenhart, T.M.; Schultz, R.C. High stage events and stream bank erosion on small grazed pasture stream reaches in the Rathbun Lake Watershed, Southern Iowa, USA. Int. J. Ecosyst. Ecol. Sci. 2019, 9, 775–786. [Google Scholar] [CrossRef]
  10. Beck, W.J.; Moore, P.L.; Schilling, K.E.; Wolter, C.F.; Isenhart, T.M.; Cole, K.J.; Tomer, M.D. Changes in lateral floodplain connectivity accompanying stream channel evolution: Implications for sediment and nutrient budgets. Sci. Total Environ. 2019, 660, 1015–1028. [Google Scholar] [CrossRef] [Green Version]
  11. Evans, D.J.; Gibson, C.E.; Rossell, R.S. Sediment loads and sources in heavily modified Irish catchments: A move towards informed management strategies. Geomorphology 2006, 79, 93–113. [Google Scholar] [CrossRef]
  12. Magner, J.A.; Vondrack, B.; Brooks, K.N. Grazed riparian management and stream channel response in Southeastern Minnesota (USA) streams. Environ. Manag. 2008, 42, 377–390. [Google Scholar] [CrossRef] [Green Version]
  13. Zaimes, G.N.; Schultz, R.C.; Isenhart, T.M. Streambank soil and phosphorus losses under different riparian land-uses in Iowa. J. Am. Water Resour. Assoc. 2008, 44, 935–947. [Google Scholar] [CrossRef]
  14. Nellesen, S.L.; Kovar, J.L.; Haan, M.M.; Russell, J.R. Grazing management effects on stream bank erosion and phosphorous delivery to a pasture stream. Can. J. Soil Sci. 2011, 91, 385–395. [Google Scholar] [CrossRef]
  15. Zaimes, G.N.; Tufekcioglu, M.; Schultz, R.C. Riparian land-use impacts on stream bank and gully erosion in agricultural watersheds: What we have learned. Water 2019, 11, 1343. [Google Scholar] [CrossRef] [Green Version]
  16. Purvis, R.A.; Fox, G.A. Streambank sediment loading rates at the watershed scale and the benefit of riparian protection. Earth Surf. Process. Landf. 2016, 41, 1327–1336. [Google Scholar] [CrossRef]
  17. Miller, R.B.; Fox, G.A.; Penn, C.J.; Wilson, S.; Parnell, A.; Purvis, R.A.; Criswell, K. Estimating sediment and phosphorus loads from streambank with and without riparian protection. Agric. Ecosyst. Environ. 2014, 189, 70–81. [Google Scholar] [CrossRef]
  18. Simon, A.; Collison, A.J.C. Quantifying the Mechanical and Hydrologic Effects of Riparian Vegetation on Streambank Stability. Earth Surf. Process Landf. 2002, 27, 527–546. [Google Scholar] [CrossRef]
  19. Zaimes, G.N.; Schultz, R.C.; Isenhart, T.M. Stream bank erosion adjacent to riparian forest buffers, row-crop fields, and continuously-grazed pastures along Bear Creek in Central Iowa. J. Soil Water Conserv. 2004, 59, 19–27. [Google Scholar]
  20. Zaimes, G.N.; Schultz, R.C.; Isenhart, T.M. Riparian land uses and precipitation influences on stream bank erosion in central Iowa. J. Am. Water Resour. Assoc. 2006, 42, 83–97. [Google Scholar] [CrossRef]
  21. Knight, K.W.; Schultz, R.C.; Mabry, C.M.; Isenhart, T.M. Ability of remnant riparian forests, with and without grass filters, to buffer concentrated surface runoff. J. Am. Water Resour. Assoc. 2010, 46, 311–322. [Google Scholar] [CrossRef]
  22. Li, R.; Wu, Q.; Zhang, J.; Wen, Y.; Li, Q. Effects of land use change of sloping farmland on characteristic of soil erosion resistance in typical karst mountainous areas of southwestern China. Pol. J. Environ. Study 2019, 28, 2707–2716. [Google Scholar] [CrossRef]
  23. Mclnnis, M.L.; Mclver, J.D. Timing of cattle grazing alters impacts on stream banks in an Oregon mountain watershed. J. Soil Water Conserv. 2009, 64, 394–399. [Google Scholar] [CrossRef]
  24. Ranganath, S.C.; Hession, W.C.; Wynn, T.M. Livestock exclusion influences on riparian vegetation, channel morphology, and benthic macroinvertebrate assemblages. J. Soil Water Conserv. 2009, 64, 33–41. [Google Scholar] [CrossRef] [Green Version]
  25. Qin, Y.; Niu, D.; Kang, J.; Zhou, Y.; Li, X. Effects of livestock exclusion on soil physical and biochemical properties of a desert rangeland. Pol. J. Environ. Study 2015, 24, 2587–2595. [Google Scholar] [CrossRef]
  26. Miller, J.; Chanasyk, D.; Curtis, T.; Entz, T.; Willms, W. Influence of streambank fencing with a cattle crossing on riparian health and water quality of the Lower Little River in Southern Alberta, Canada. Agric. Water Manag. 2010, 99, 247–258. [Google Scholar] [CrossRef]
  27. Tufekcioglu, M.; Isenhart, T.M.; Schultz, R.C.; Bear, D.A.; Kovar, J.L.; Russell, J.R. Stream bank erosion as a source of sediment and phosphorus in grazed pastures of the Rathbun Lake Watershed in southern Iowa, United States. J. Soil Water Conserv. 2012, 67, 545–555. [Google Scholar] [CrossRef] [Green Version]
  28. Naeth, M.A.; Pluth, D.J.; Chanasyk, D.S.; Bailey, A.W. Soil compacting impacts on grazing in mixed prairie and fescue grassland ecosystems of Alberta. Can. J. Soil Sci. 1990, 70, 157–167. [Google Scholar] [CrossRef]
  29. Gee, G.W.; Bauder, J.W. Particle-size analysis. In Method of Soil Analysis: Part 1—Physical and Mineralogical Methods, 2nd ed.; Klute, A., Ed.; Soil Science Society of America Book Series; Springer: Madison, WI, USA, 1986; pp. 383–411. [Google Scholar]
  30. Strahler, A.N. Quantitative analysis of watershed geomorphology. Am. Geophys. Union Trans. 1957, 38, 913–920. [Google Scholar] [CrossRef] [Green Version]
  31. Tufekcioglu, M.; Schultz, R.C.; Zaimes, G.N.; Isenhart, T.M.; Tufekcioglu, A. Riparian grazing impacts on streambank erosion and phosphorus loss via surface runoff. J. Am. Water Resour. Assoc. 2013, 49, 103–113. [Google Scholar] [CrossRef]
  32. Wynn, T.; Mostaghimi, S. The effects of vegetation and soil type on streambank erosion, Southwestern Virginia, USA. J. Am. Water Resour. Assoc. 2006, 42, 69–82. [Google Scholar] [CrossRef]
  33. Selkimaki, M.; Gonzalez-Olabarria, J.R. Assessing gully erosion occurrence in forest lands in Catalonia (Spain). Land Degrad. Dev. 2017, 28, 616–627. [Google Scholar] [CrossRef]
  34. Mukai, S. Gully erosion rates and analysis of determining factors: A case study from the semi-arid main Ethiopian Rift Valley. Land Degrad. Dev. 2017, 28, 602–615. [Google Scholar] [CrossRef]
  35. Simon, A.; Curini, A.; Darby, S.E.; Langendoen, E.J. Bank and near-bank processes in an incised channel. Geomorphology 2000, 35, 193–217. [Google Scholar] [CrossRef]
  36. Pope, I.C.; Odhiambo, B.K. Soil erosion and sediment fluxes analysis: A watershed study of the Ni Reservoir, Spotsylvania Country, VA, USA. Environ. Monit. Assess. 2014, 186, 1719–1733. [Google Scholar] [CrossRef] [PubMed]
  37. Colman, C.B.; Oliveira, P.T.S.; Almagro, A.; Soares-Filho, B.S. Rodrigues DBB. Effects of climate and land-cover changes on soil erosion in Brazilian Pantanal. Sustainability 2019, 11, 7053. [Google Scholar] [CrossRef] [Green Version]
  38. Khoi, D.N.; Nquyen, V.T.; Sam, T.T.; Nhi, P.T.T. Evaluation on effects of climate and land-use changes on streamflow and water quality in the La Buong River Basin, Southern Vietnam. Sustainability 2019, 11, 7221. [Google Scholar] [CrossRef] [Green Version]
  39. Mishra, K.; Sinha, R.; Jain, V.; Nepal, S.; Uddin, K. Towards the assessment of sediment connectivity in a large Himalayan river basin. Sci. Total Environ. 2019, 661, 251–265. [Google Scholar] [CrossRef]
  40. Peacher, R.D.; Lerch, R.N.; Schultz, R.C.; Willett, C.D.; Isenhart, T.M. Factors controlling streambank erosion and phosphorus loss in claypan watersheds. J. Soil Water Conserv. 2018, 73, 189–199. [Google Scholar] [CrossRef] [Green Version]
  41. Zaimes, G.N.; Schultz, R.C. Riparian land-use impacts on bank erosion and deposition of an incised stream in north-central Iowa, USA. Catena 2015, 125, 61–73. [Google Scholar] [CrossRef]
  42. Myers, D.T.; Rediske, R.R.; Mcnair, J.N. Measuring streambank erosion: A comparison of erosion pins, total station, and terrestrial laser scanner. Water 2019, 11, 1846. [Google Scholar] [CrossRef] [Green Version]
  43. Lyons, J.; Weigel, B.M.; Paine, L.K.; Undersander, D.J. Influence of intensive rotational grazing on bank erosion, fish habitat quality, and fish communities in Southwestern Wisconsin Trout streams. J. Soil Water Conserv. 2000, 55, 271–276. [Google Scholar]
  44. Allan, J.D.; Erickson, D.L.; Fay, J. The influence of catchment land use on stream integrity across multiply spatial scales. Freshw. Biol. 1997, 37, 149–161. [Google Scholar] [CrossRef] [Green Version]
  45. Richards, C.; Johnson, L.B.; Host, G.E. Landscape-scale influences on stream habitats and biota. Can. J. Fish. Aquat. Sci. 1996, 53, 295–311. [Google Scholar] [CrossRef]
  46. Lucas, R.W.; Baker, T.T.; Wood, M.K.; Allison, C.D.; Vanleeuwen, D.M. Streambank morphology and cattle grazing in two montane riparian areas in western New Mexico. J. Soil Water Conserv. 2009, 64, 183–189. [Google Scholar] [CrossRef]
  47. Frankl, A.; Poesen, J.; Scholiers, N.; Jacob, M.; Haile, M.; Deckers, J.; Nyssen, J. Factors controlling the morphology and volume (V)-length (L) relations of permanent gullies in the northern Ethiopian Highlands. Earth Surf. Process. Landf. 2013, 38, 1672–1684. [Google Scholar] [CrossRef] [Green Version]
Figure 1. Location of thirteen study sites and their catchments within the Rathbun Lake watershed in South Central Iowa. Numbers represent pasture Id based on the catchment sizes from smallest to largest. Note: sites 1 and 6 were under Conservation Reserve Program (CRP) management and all other sites were in grazing management.
Sustainability 12 06461 g001
Figure 2. Catchment stream lengths of the pasture site/Id 11 and its 50 m buffered areas based on the stream order category.
Sustainability 12 06461 g002
Figure 3. Relationship between erosion rates and percent sand-and-silt particle size.
Sustainability 12 06461 g003
Figure 4. Relationship between percent sand particles and height of streambank at which sample was collected. Note: Only streambanks taller than 100 cm were included.
Sustainability 12 06461 g004
Figure 5. Relationship between streambank erosion rate and both catchment size and catchment stream length.
Sustainability 12 06461 g005
Table 1. Percent particle sizes and their textural units from stream bank soils of the thirteen stream reaches.
Site IdLand-UseSand (%)Silt (%)Clay (%)Textural Unit
1CRP155828Silt clay loam
2Grazed305020Loam
3Grazed186022Silt loam
4Grazed325018Silt loam
5Grazed116524Silt loam
6CRP86527Silt loam
7Grazed96625Silt loam
8Grazed196021Silt loam
9Grazed166221Silt loam
10Grazed265419Silt loam
11Grazed196021Silt loam
12Grazed275618Silt loam
13Grazed433819Silt loam
AverageGrazed/CRP215722Mainly silt loam
Table 2. Stream morphologic characteristics in both field/reach and catchment scales and total erosion rates from pasture fields.
Site IdStream OrderStream Bed Slope (%)Stream SinuosityErosion Rates (cm/yr)
1I1.7 (2.1)1.1 (1.1)8.6
2I2.0 (1.8)1.2 (1.4)25.3
3I0.8 (1.7)1.4 (1.2)10.3
4I1.3 (2.0)1.6 (1.4)26.3
5I0.6 (1.6)2.0 (1.2)16.3
6I2.0 (1.3)1.5 (1.3)15.3
7I1.6 (1.4)1.3 (1.3)34.0
8I1.6 (0.7)1.1 (1.2)23.0
AverageI1.5 (1.6)1.4 (1.3)19.9
9II0.8 (0.8)1.4 (1.4)13.0
10II0.7 (0.8)1.4 (1.3)25.0
11II0.4 (0.6)1.5 (1.3)9.3
AverageII0.6 (0.7)1.4 (1.3)15.8
12III0.3 (0.3)1.1 (1.4)37.6
13III1.5 (0.3)1.2 (1.4)38.3
AverageIII0.9 (0.3)1.2 (1.4)38.0
Note; numbers inside the parenthesis represent the given stream feature at the catchment scale. Stream order category is based on Strahler (1957).
Table 3. Land-use types within 50 m on either side of the streams by stream order in studied catchments of the Rathbun watershed.
Stream OrderAgriculture (%)Unmanaged Use (%)CRP (%)Other (%)
Ephemeral6125113
1st642673
2nd523963
3rd464770
Note: Use in agriculture: grazed grassland, alfalfa, winter wheat, lush grass, corn, soybean. Unmanaged use: ungrazed grassland, deciduous forest. CRP: conservation reserve program. Other: open water, roads, wetlands, industrial and residential areas.
Table 4. The percent of total catchment area devoted to riparian buffers if 6 m wide buffers were established along the ephemeral channel and 18 m wide buffers were established along all other perennial channels that were designated as “agriculture” land use in this study. Note: The buffer widths of 6 m and (12 + 6) m are the minimum grass filter and forest buffer widths with the grass width of 6 m, respectively, recommended by Natural Resources Conservation Service.
Site IDBuffered Riparian Area (km2)Catchment Size (km2)Buffered Catchment Area (%)
10.022.50.9
20.083.22.7
30.073.91.9
40.104.42.2
50.084.71.6
60.144.83.0
70.165.82.8
80.127.11.7
90.147.61.9
100.1610.91.5
110.3620.11.8
120.8236.32.2
131.2456.62.2
Average0.2712.92.1

