Article

A Comprehensive Evaluation on Types of Microcracks and Possible Effects on Power Degradation in Photovoltaic Solar Panels

1
Department of Energy Engineering, School of Natural Resources Engineering and Management, German Jordanian University, P.O. Box 35247, Amman 11180, Jordan
2
Electrical Power Engineering Department, Hijjawi Faculty for Engineering Technology, Yarmouk University, P.O. Box 566, Irbid 21163, Jordan
3
Philadelphia solar, Al Qastal Industrial Area 2, Airfreight Road, Amman, Jordan, P.O. Box 143808, Amman 11814, Jordan
*
Authors to whom correspondence should be addressed.
Sustainability 2020, 12(16), 6416; https://doi.org/10.3390/su12166416
Submission received: 19 July 2020 / Revised: 5 August 2020 / Accepted: 6 August 2020 / Published: 10 August 2020
(This article belongs to the Section Energy Sustainability)

Abstract

:
Photovoltaic (PV) panels installation has become one of the major technologies used for energy production worldwide. Knowledge and competitive prices are the main reasons for the spread usage and expanded exploiting of PV systems. Accordingly, this creates several challenges for manufacturers and customers, mainly, the quality of PV panels to withstand environmental conditions during service lifetime. Hence, the quality of PV panels is a vital aspect. By thinking of PV power plants, it appears that some factors should be considered, like the developing microcracks (µcracks). An issue like that increases the chances of having power loss during the operation phase. Notably, µcracks develop in different shapes and orientations; the variation depends on what causes them. This study is a presentation and summary of data collected from different projects in Jordan to describe the effect of each µcracks shape on power loss, aiming to give decision makers an indication to decide whether to replace the faulty panels or not, depending on their own conditions and projects sizes. Hence, in this study, it was found that the µcracks have impacted power loss differently and recorded power reduction of percentages of 0.82–3.21% for poly-crystalline technology. Variation in power degradation depends on the module situation; whether it is stocked in facility or operated on-site. In the mono-crystalline technology case, the power losses varied between 0.55% and 0.9%, with the exception of some samples from both technologies that have effects other than microcracks, which affected power severely. Furthermore, a general overview is provided for µcracks before installation.

1. Introduction

Photovoltaic (PV) solar panels have become amongst the world’s largest distributed renewable energy sources worldwide [1]. This attributes to several facts, including the clean nature of this source of energy, simple configuration which supports modularity, availability in low cost due to mass production, and advanced technologies developed in the manufacturing process, easy installation, and minimal maintenance. Such features have made PV technology a safe investment environmentally, not only for governments, but also for the private sectors [2].
The PV panels are made from different layers, starting from an anti-reflected coated glass layer, encapsulation material, solar cells matrix, another encapsulant layer, and a back-sheet. Unfortunately, this structure does not provide adequate protection to the solar cells encapsulated inside. i.e., cells are under high risk of developing microcracks (µcracks) during any stage of the project life cycle, starting from production, transportation, installation, to the maintenance stage [3,4].
Evaluating the effects of µcracks on the performance of PV panels is considered to be one of the vital processes to maintain projects’ efficiency and profit. Accordingly, this evaluation process should follow precise guidelines assessed by performing root cause analysis, while estimating the possible effects of µcracks in the long run. This will help the operators in replacing the panels without a significant loss to the project, as well as to the environment, due to recycling challenges after the end of panels’ lifetime [5].
It is obvious that PV systems examine different weather conditions; as a result, efficiencies variate from site to another, and even from what is provided from the manufacturers. For instance, the accumulation of very small dust particles can reduce light transmission up to 11%, where the outdoor particles can be within the range of 1–50 microns. Other weather conditions like rain and snow can have greater effects on the PV panels’ performance [6].
It is recommended to have a regular cleaning profile, to avoid energy loss from the soiling effect, for example every month or every two weeks (which is even better). That is due to the fact that the annual energy loss can reach 5.02% in modules with power range of 80 W, and 1.37% in 310 modules [7].
Recently, because of the planned massive development in both the industrial and commercial sectors, energy demand in Jordan is expected to increase by at least 50% over the next 20 years. This anticipated growth makes the energy sector a significant contributor to the overall Jordan economy. Jordan have tailored new policies subjected to facilitate investment in renewable energy and motivate investments to achieve resilient and sustainable future power grid [8].
Based on studies made by the Jordan Ministry of Energy and Mineral Resources, the overall installed capacity from renewable energy in Jordan is 1130 MW in 2018. This amount constitutes 11% of the total generation capacity. Renewable energy projects currently under construction expected to operate at the end of 2021 will have a total capacity of 1200 MW. This increases the renewable energy share to a total capacity of 2400 MW, which constitutes 20% of the total generation capacity, compared to only 1% in 2014 [9].

1.1. Photovoltaic Types

Photovoltaics are being adopted as a significant renewable energy source globally. The hefty burden in PV projects is the capital cost, while the systems are expected to operate reliably with minimal operational costs for more than 25 years. PV solar modules consist mainly of solar cells and other supporting components encapsulated to each other. There are many types of PV solar cells used to assemble PV modules, which include mono-crystalline (MONO-SI), poly or multi-crystalline (P-Si), amorphous silicon (A-Si), and concentrated PV cell (CVP) [10].
Solar cells classification depends on the semiconductor material that is used in the manufacturing process. All those types share the same principle of converting sun light to electricity, and the main difference is the efficiency of the conversion process. Basically, solar cells can be single or multiple layers or configurations, where different absorption abilities are applied. Furthermore, there are different technological generations; the first generation is crystalline silicon based, mono and poly crystalline silicon, while the second and third generations are thin film and different thin film technologies [11].
The thickness of solar cells (poly or mono) varies from one supplier to another, and the cell efficiency varies from 26.7% for mono-crystalline to 22.3% for multi-crystalline silicon wafer-based technology. The highest efficiency recorded for thin-film technology is about 23.4% for copper indium gallium selenide (CIGS), and 21.0% for cadmium telluride (CdTe) solar cells. Material usage for silicon cells reduced significantly during the last 13 years, from around 16 g/Wp to about 4 g/Wp. This reduction is due to the increase in efficiency rates, using thinner wafers and wires, as well as larger ingots [12].
In general, crystallin silicon is the most spread used type in PV industry, due to the deep knowledge developed around it. Modules efficiency is within the range of 12–16%, exceptions depend on several factors [13].

1.2. Micro-Cracks

Some types of microcracks may grow according to their shape and location in the PV module. This growth might happen due to transportation, improper installation, handling, vibration, excessive load, environmental stresses, improper cleaning, and during the operation and maintenance stage. It is necessary to find the impact of each µcrack shape on the performance of the PV module, to optimize the power generation from the PV project and reduce the cost of operation and maintenance later.
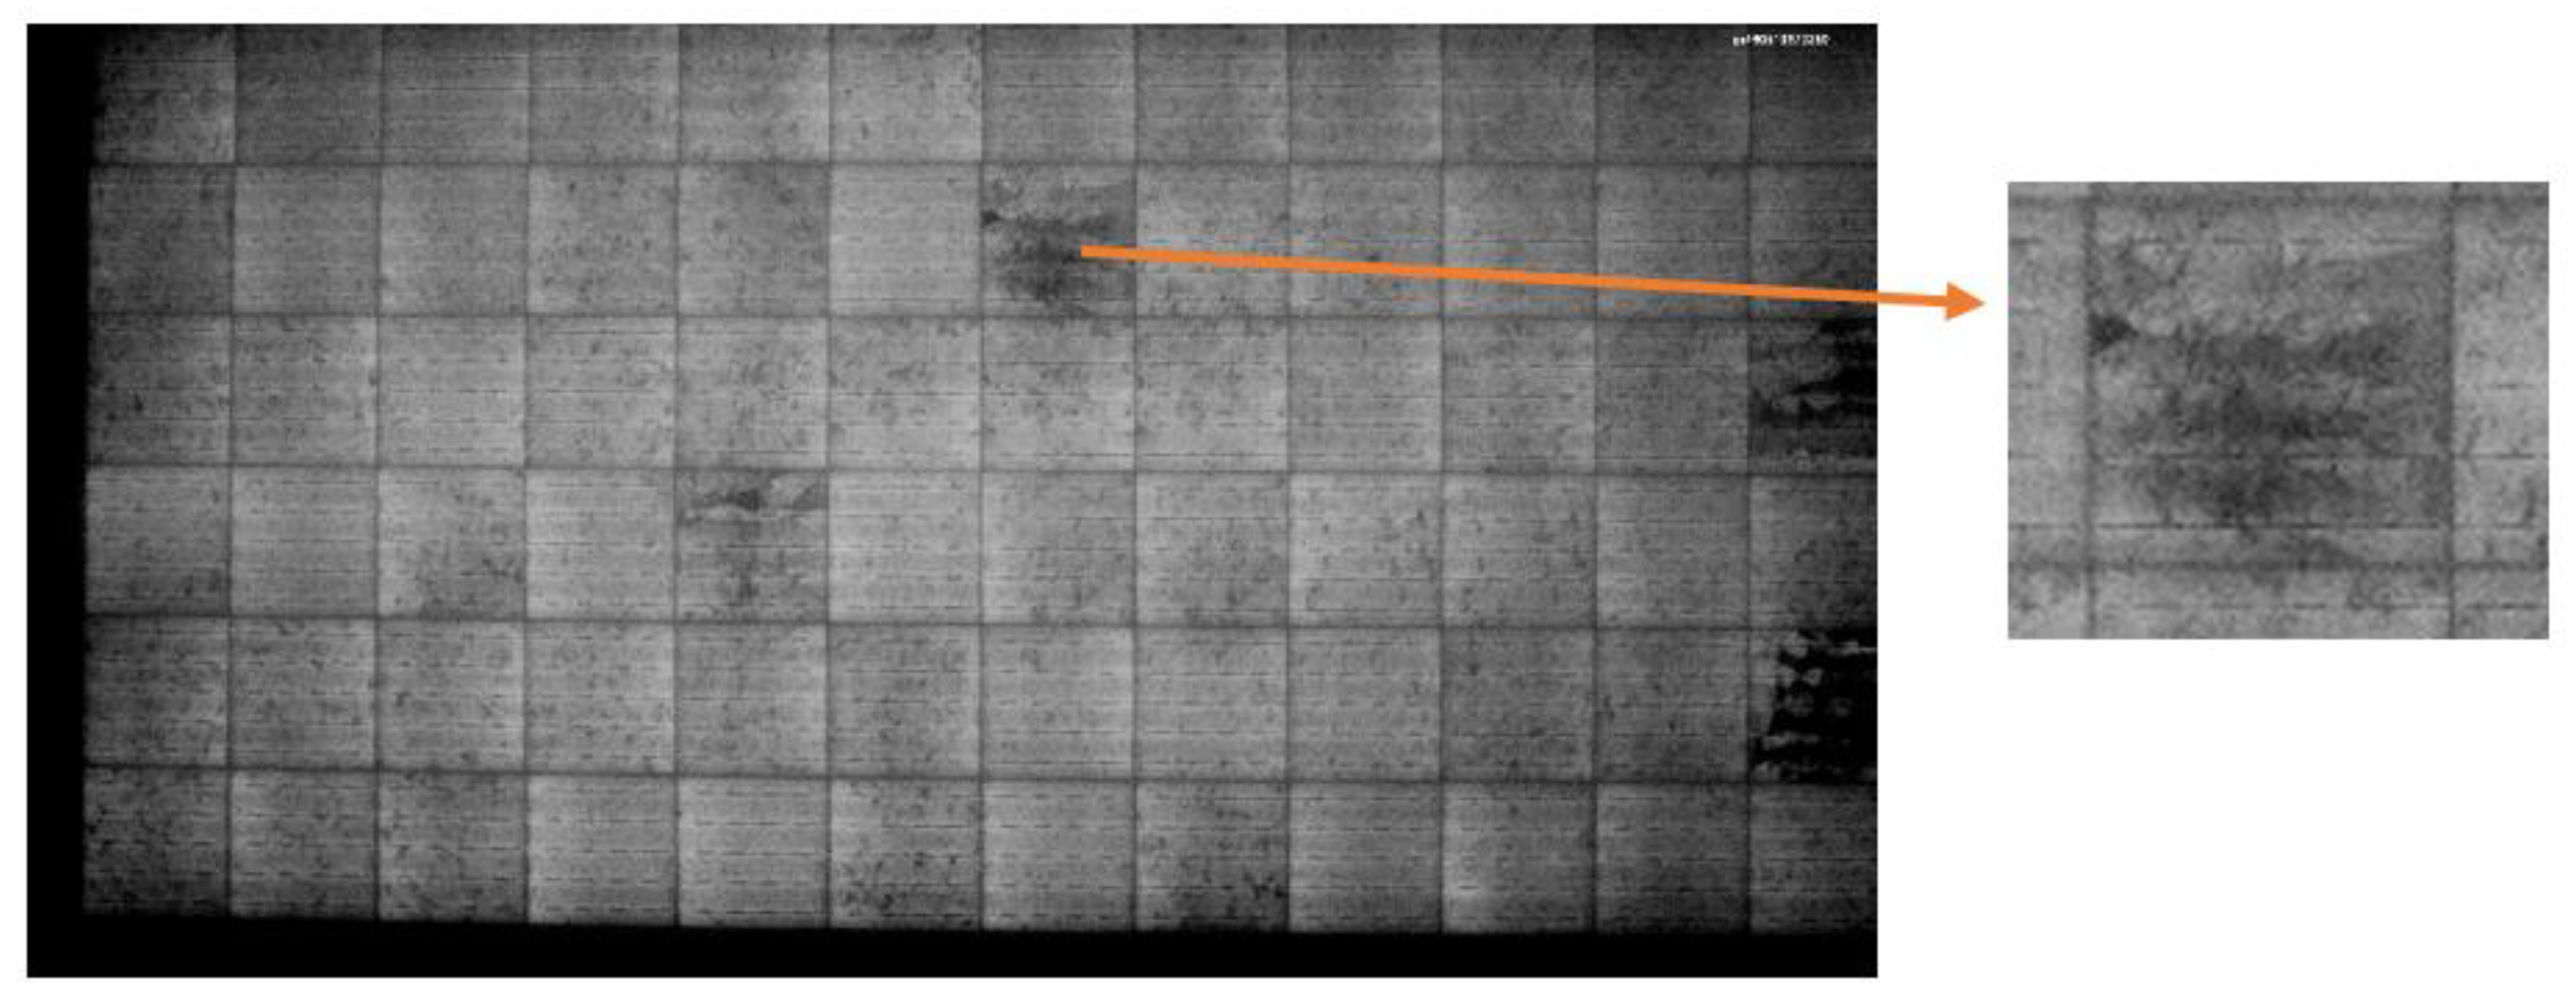
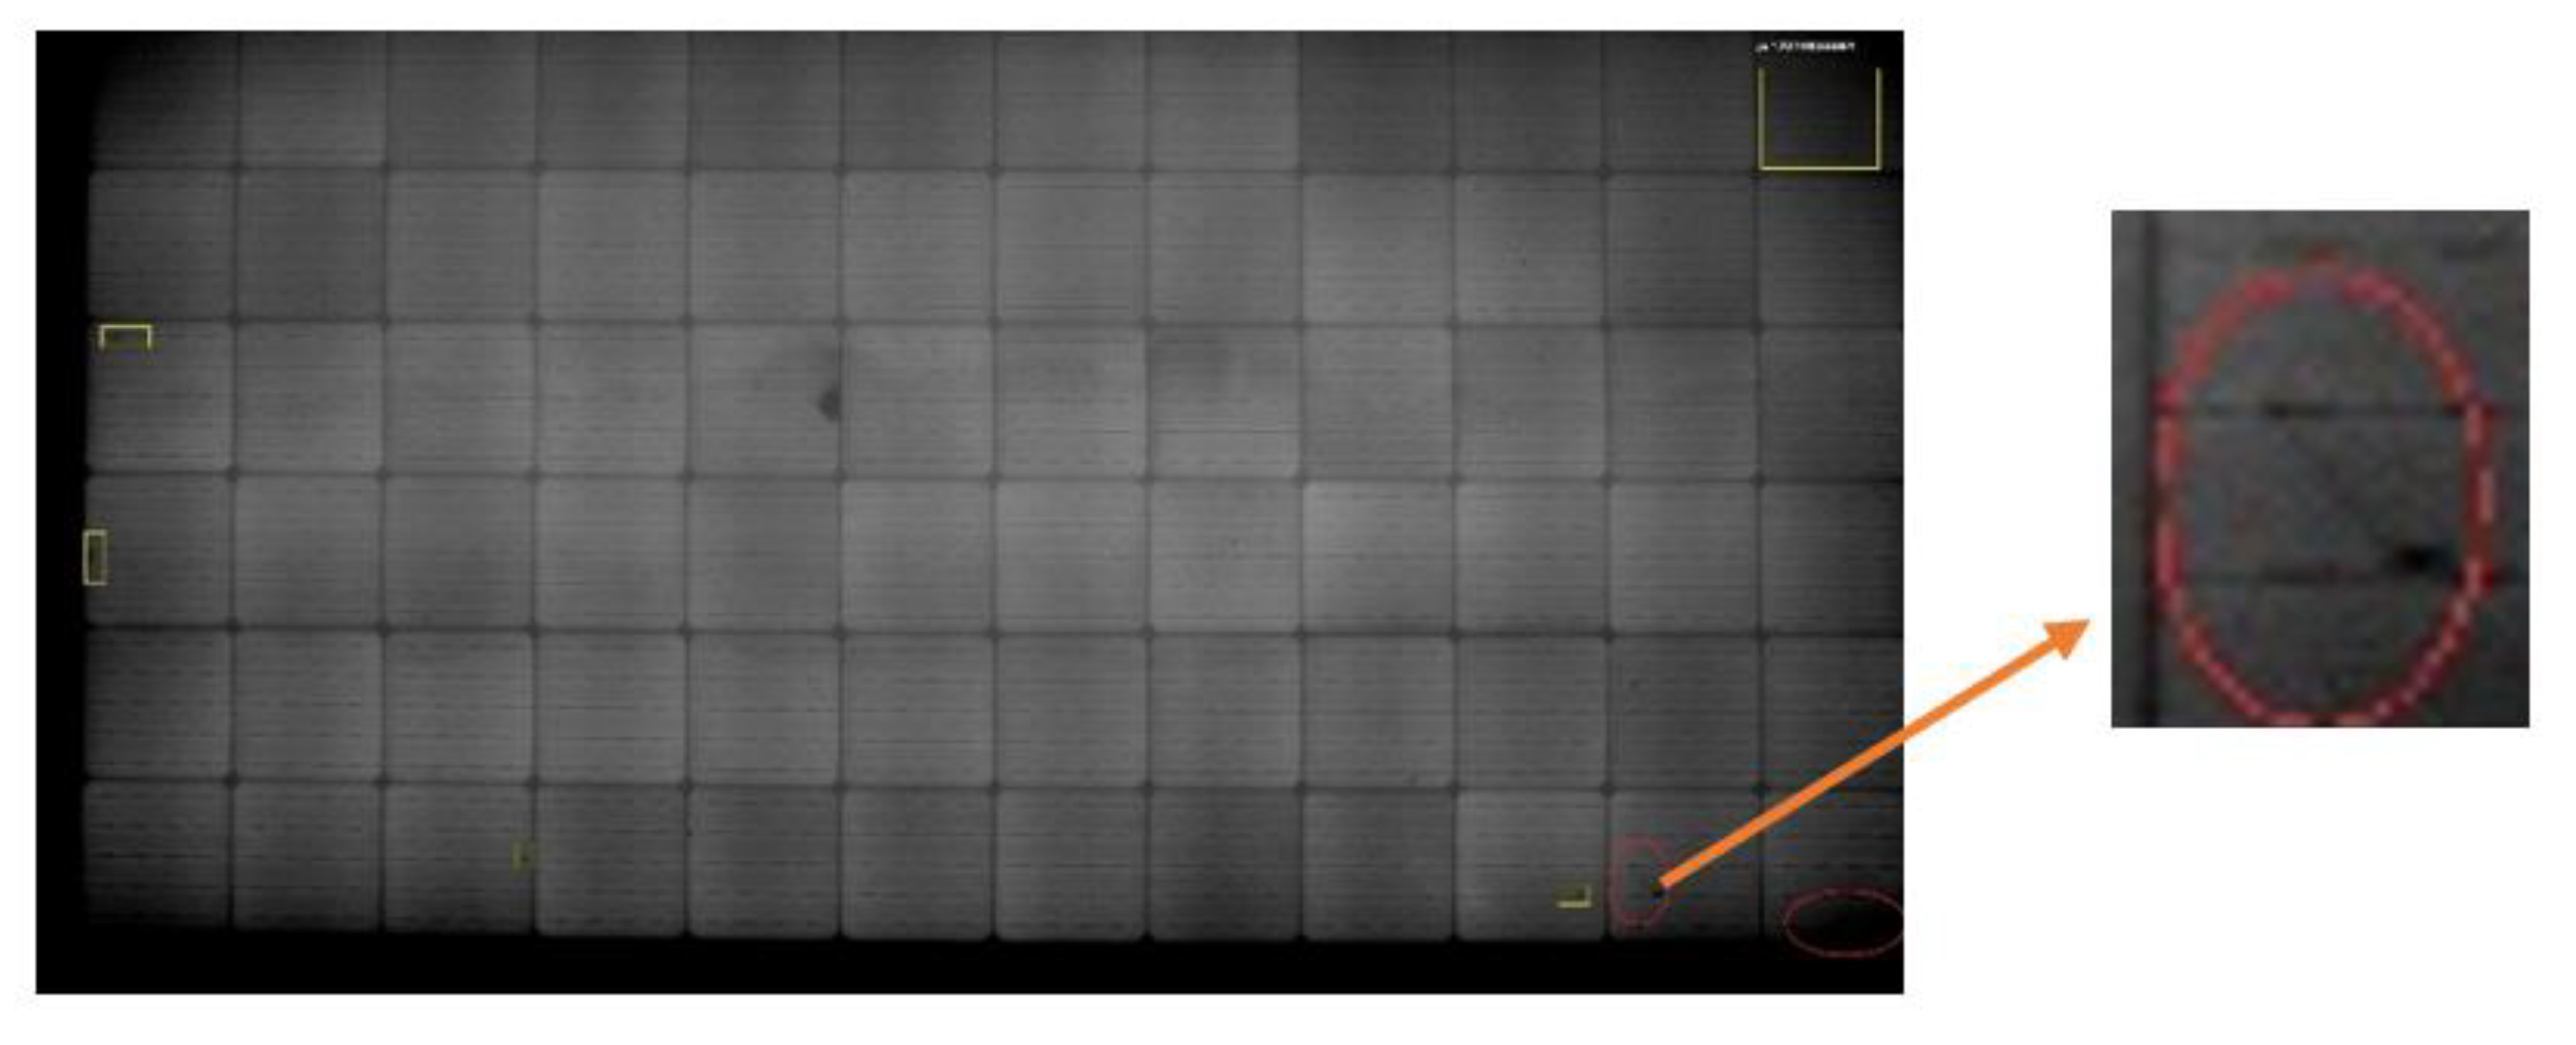
Cracks are described as a veritable problem that developed with PV panels throughout their lifetime. New panels can have µcrack but their influence is neglected; the problem appears when panels expose several conditions like weather conditions, tracking, cleaning, etc. The impact of those cracks depends on their orientation and the shape which is created by the cause type; see Figure 1 [14].
Figure 1 shows an example of µcracks that is classified as major, since the damage reaches 20% of the module. Moreover, µcracks can affect the power drop up to 3.2%, this percentage affects the overall produced power from economical and energy yield for large projects, taking into consideration that PV projects are long life projects [15].
Interestingly, µcracks’ orientation plays an important role in power degradation, for instance, vertical µcracks are crucial, as well as dendritic ones and multiple orientations. Around 6% of modules can have cracks after transportation. Accordingly, it is a vital issue to evaluate the types and severity of µcracks, ahead of approving and installing solar modules into PV systems [16].
Furthermore, µcracks play a fundamental role in preventing moisture from evaporating out of PV modules. Soldered cut lines are weaker than narrow cracks in preventing moisture from evaporating out of the modules. This clarifies why there are no snail trails which exist at the edges of the cells; there could be a chance for them to appear if the humidity is high enough inside ethylene-vinyl acetate (EVA) and Ag grid lines. Moreover, µcracks can be vertical, horizontal, dendritic, dark cells, impact µcracks, snail trails, and potential induced degradation (PID) dark cells on edges [17].
Timothy J. Peshek et al. [18] discussed solar cells cracking as one of four other factors that cause the degradation process; the concentration was on the cells scale. Furthermore, transportation induced impacts like vibration and sudden acceleration, after being manufactured were discussed. The simulation model developed shows that the maximum power output (Pmax) can be reduced by up to 2.5% after transportation. Every cell can be affected, but since some parts in the cell are not connected, the registered power reduction is very minor. However, if the mechanical loading experienced a harmonic manner, power loss can reach up to 8%. In addition, other environmental factors like wind and snow showed the same results.

1.3. Litrature Review

A literature review carried out revealed that several studies discussed the analysis of µcracks, and the effect of environmental factors on µcracks developments. Furthermore, some µcracks detection methods were investigated.

1.3.1. Analysis of µcracks

Papargyri, Lamprini et al. [19], discussed the origins and factors that affect the cell cracks. It has been shown that µcracks classifications, based on their characteristics, have been used to determine both the electrical and mechanical degradation of PV modules. Additionally, we analyzed PV modules’ cracks on the level of wafer, cell, and PV module, following experimental and numerical studies. It is concluded that the influence of cracks does not always necessarily lead to severe performance degradation; as a result, the impact of cracks on PV modules’ electrical characteristics is controversial.
M. Kontges et al. [20] showed that the influence of µcrack became crucial on PV panels after artificial aging, while the instant effect of µcrack on the module output power is small. Authors discussed the necessity to quantify the risk of power loss in PV modules that have faulty cells in their lifetime. This process enables manufacturers to reject faulty modules with high risk to fail, and keep modules that have uncritical µcrack influence.
In [21], authors demonstrated a statistical analysis approach, which uses the T-test and F-test for identifying whether the crack has significant impact on the total amount of power generated by the PV modules. Electroluminescence (EL) measurements were performed for scanning possible faults in the examined modules. Virtual instrumentation (VI) LabVIEW software was applied to simulate the theoretical I-V and P-V curves. The approach classified only 60% of cracks that significantly impacted the total amount of power generated by PV modules.
A research study presented by Dhimish, Mahmoud et al. [22], where the impact of photovoltaic (PV) µcrack was evaluated, through analyzing 4000 polycrystalline silicon solar cells. Electron microscopy is used to facilitate cracks detection through the acquisition of both the Everhart–Thornley detector and the back scatted electron diffraction image. It was achieved that the size of µcrack is approximately from 50 µm to a maximum of 4 mm. Moreover, µcrack have been categorized into two main categories including the ones that existed in the solar cell rear contact. The main observations are that the output power loss ranged between 0.9% and 42.8% due to µcracks, an increase of power loss by 1.7% resulted from cracks in solar cell fingers (due to reducing finger width), and a radical correlation between PV hot spots and the presence of µcrack where the minimum increase in the cell temperature is found at 7.6 °C.
The crack separation width is a critical factor in power loss. For instance, if the crack width is 2 µm or less, then there is no impact on the grid-line resistance. On the other hand, if the crack width becomes 7 µm or more, the finger becomes completely separated. Cracking in PV modules occurs when emulating (in laboratory) loading sequences for different transportation scenarios, accordingly, different power loss percentages appear. Power loss can reach up to 8% when transportation or wind gusts are simulated at the resonance frequency of the modules. Furthermore, when cycling vibrational loading was applied with an additional environmental stressor, such as thermal cycling, approximately 1.5–2.5% power loss was observed [18].
In [23], authors discussed PV modules with cracks, and indicated that those modules suffer from a lower stability of the power output under artificial ageing. This is slightly because cracked cell areas can be disconnected (electrically) from the active cell area. A total of 667 cracked cells in 27 PV modules with 60 cells each were used in this study. Cracks that are parallel to the busbars constitute around 50% of the crack orientations in the experiments. This crack orientation has a significant probability of having a potentially separated cell area crack of 16 to 24%, and can be of high criticality. Additionally, 12 of these PV modules were subjected to 200 cycles of a humidity-freeze test; a significant part of 29% of the cracked cells showed an increased resistance across the cracks and 7% showed isolated cell areas.

1.3.2. The Effect of Environmental Factors on µcracks Development

Environmental factors affect the overall performance of PV solar panels during operation, as discussed by Manju Santhakumari et al. [24] It is obvious that energy yield from the PV plant depends on the solar flux, quality of the related power-conditioning equipment incorporated in the system, panel specifications, location, and on the environmental parameters. Authors provided a comprehensive review of the effect of environmental factors on the various components of photovoltaic systems. It emphasized the environmental factors such as dust, ambient temperature, wind velocity, humidity, snowfall, hailstorms and sandstorms, which deteriorates the energy efficiency of solar plants and the various failure modes of the panels caused by these factors. Several recommendations were provided from authors to get a better improvement on PV panels’ performance like power conditioning setups, and preparing a database for the climate conditions.
Weather conditions are considered as important reasons for the electrical power yield degradation or variation compared to the standard conditions. An increasing concern regarding environmental conditions’ influence on PV panels is discussed through the literature, this fact is related to the large investment in solar PV panels. On the other hand, different solar panels’ technologies react differently against weather conditions and that appears on the degradation levels. In addition, the performance factor can be proportional to the initial cost of the power plant, and can be not. Furthermore, the selection of a PV panel can reduce the cost by up to 55% for a normal PV plant over 20 years of operation [25].
Furthermore, µcrack in polycrystalline Silicon is a serious concern for the durability of photovoltaic (PV) modules, due to the resulting electrical power-loss. As Paggi, Marco et al. (2013) [26] discussed in their study, a thermo-mechanical cohesive zone model was proposed, to predict the evolution of µcrack under the action of mechanical and thermal loads.

1.3.3. µcrack Detection Methods

Deitsch, Sergiu et al. [27] discussed the automatic classification of defective photovoltaic module cells in electroluminescence images. EL imaging is described as a useful method for PV modules inspection. Since EL images have a high spatial resolution, it is possible to detect the finest defects on PV modules surface. On the other hand, and since the manual operation, EL analysis is described as expensive, time consuming, and requires a high level of knowledge of many different types of defects. Authors discussed two approaches for automatic detection of such defects in a single image of a PV cell, which makes the continuous, highly accurate monitoring of PV cells feasible.
Solar cells are known as the key part of the PV system, therefore, the quality inspection of solar cells guarantees the conversion efficiency and an acceptable lifetime of PV modules. However, the automatic process of cracks detecting in EL images is considered a challenging task, as presented by Chen, Haiyong et al. [28]
Shuying Yang, et al. [29], defined PV modules’ failures on fields as any visual (and cosmetic), mechanical, electrical (safety) insulation, and performance related defects/degradation. Based on the time of failure creation, failures can be classified as infant failures, midlife failures, and wear-out failures. Moreover, a summary of all possible failures is presented in the study, to provide guidelines for installers.
A method for detecting µcracks in solar cells using two dimensional matched filters was developed by Spataru, Sergiu et al. [16] This method is derived from the EL intensity profile of typical µcracks. It showed a great potential for quantifying µcracks failure after manufacturing or module transportation, for determining modules quality criterion for cell cracking in PV modules.
Notably, µcracks detection of solar cells surface via combining short-term and long-term deep features is a new method proposed by Xiaoliang Qian et al. [30] Authors discussed that the short term deep features and the long term deep features are learned from the input image itself through stacked denoising auto encoder (SDAE), and a large number of natural scene images that people often see through convolutional neural networks (CNNs), respectively. Evaluations describe that the performance of combining short and long terms deep features is better than doing any of them separately; moreover, the performance of the proposed method is better than superficial learning-based methods, and finally, the presented method can efficiently detect different kinds of µcracks.
Mahmoud Dhimish et al. [31] presented a new technique for µcracks inspection in solar cells, by capturing the image of solar cells using the EL method, and then, use the proposed technique that consists of three stages to identify the µcracks size, location and its orientation. The developed technique has been validated using a full-scale PV module, and compared with up to date available PV µcrack detection methods.
A proposed method for quantifying the percentage of partially and totally disconnected solar cell cracks was performed, by analyzing EL images of the PV module that have been taken under high- and low-current forward bias. The method is based on analyzing module’s EL intensity distribution applied at modules and cell level. The proposed concept is applied on crystalline silicon PV module that experienced several conditions, like mechanical loading and humidity-freeze cycling, resulting in increasing cracks levels, as presented by Sergiu Spataru et al. [32]
In this study, discussion and analysis of the most common and frequent shapes of µcracks that developed in PV power plants in different locations were performed. The aim is to find and quantify the effect on power loss and to determine the degree of severity on PV panels output. In this research, a detailed analysis that expands the knowledge of µcracks-induced effects is presented.
The investigation is applied on four shapes, and orientations of µcracks detected by high accuracy electroluminescence tester are measured by flasher afterwards, to determine the power after being cracked.

2. Materials and Methods

Modules are tested by analyzing the EL image to determine the µcracks, then the I -V curve is measured by AAA (the classification used to determine the accuracy of flasher machine, so when it is classified as AAA, then the accuracy of testing results is high) rated flasher machine, to find the drop in power performance, if any. The EL tester used is equipped with NIR Nikon Camera, with an HD lens that has a total resolution of ≥16.2 megapixels per camera; X3 cameras are available inside and image pixel 405 µm/pixel, with a testing cycle time of the 30 s/panel and an exposure time around 2–4 s. This tester is suitable for both monocrystalline silicon and polycrystalline silicon module technology.
The test procedure starts on this EL tester by loading the sample into a loading conveyor, then the module moves to the inside of EL tester equipment, and positioned in a way that the cameras detects all cells depending on the number of cells assembled in a panel, then, the test is done, as the camera moved and the image appears on screen, then the image is detected by an operator to find any µcracks or any other issue. Then the image is saved with its serial number of the module, to be further checked and investigated. After testing and saving the image, the module ejected to the offloading conveyor which is handled by operators and stacked on a pallet, then the same process repeated for all other samples.
The EL images and the electrical data refer to the solar panels categorized in two categories. The first category refers to solar panels that were selected randomly from the last stage of the production line (before installation on site), which were 27 samples, and the other category for the already installed projects on-site in 5 different places, which were 44 samples, 17 samples of which are presented and discussed in this manuscript. Additionally, the second one starts after installation and operation for a couple of months, where some problems appeared in power drop.
Different projects were analyzed in several locations, and in different timing, as historical data were used for some projects to cover wider range of PV technologies (3BB, 4BB and 5BB), see Table 1. All samples are collected from projects in Jordan, where weather conditions do not vary considerably between the locations of sampling, due to the fact that all these locations are located on the same longitude and latitude.
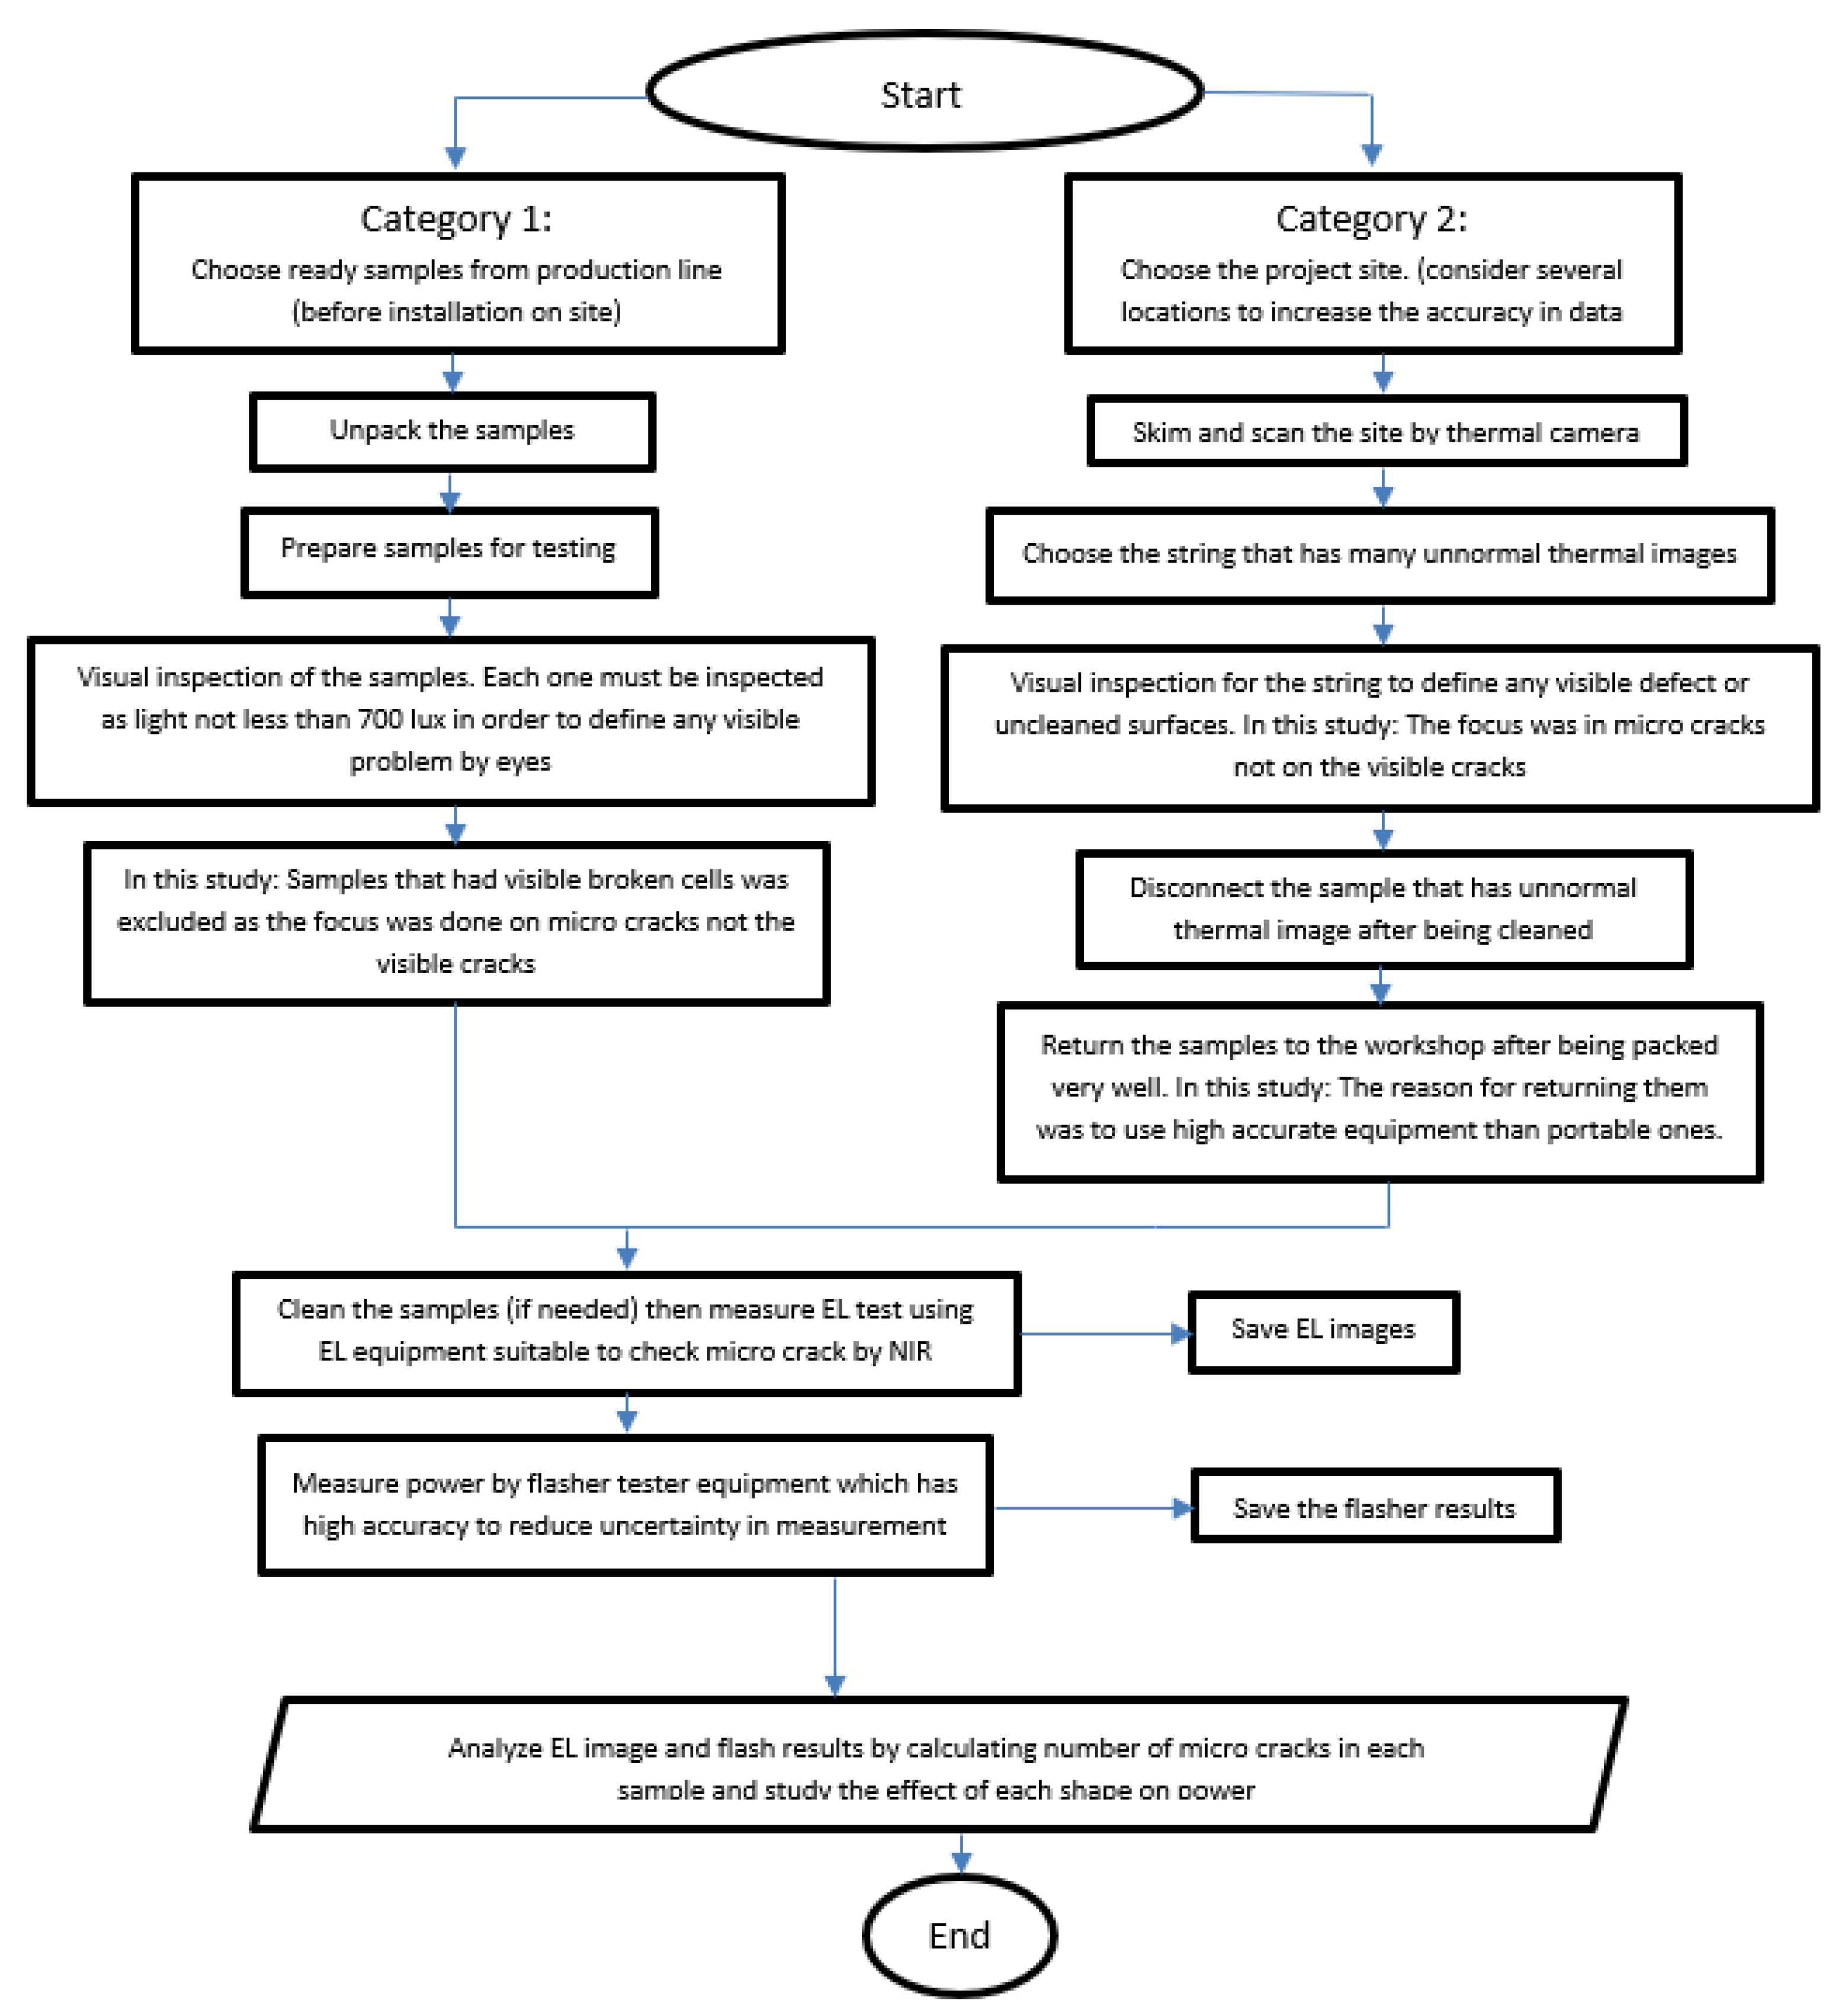
The work methodology was categorized into two categories, as shown in Figure 2. Category 1 started by choosing ready samples from the factory (27 samples), then moving them from warehouse into workshop for testing purposes, by unpacking, preparing for testing, doing visual inspection to avoid any visible cracks found in any sample, and excluding them in order to focus only on µcracks that cannot be detected by naked eyes. Then, cleaning them by wiping the dust if any. The testing was done using an EL tester; a flash testing is carried out to measure the electrical parameters.
Category 2 was done by visiting different projects at different sites in Jordan. A thermal camera is utilized to scan through the installation, to identify the string that had abnormal thermal image, from which 44 samples were collected and returned (after being packed very well in wooden box), from different projects to the workshop for testing, following the same procedure presented for category 1.
The module is loaded into the EL machine that provides a darkness environment inside. Inspection of the photovoltaic module is performed by electroluminescence testing. One image of the whole module is taken step by step and cell by cell and the entire module is displayed as a matrix of individual cells. The assembled image of the entire module is stored, and can be used for documentation or display at a module any time.
For electroluminescence inspection, a constant DC current is applied to the module. This current can be set by software to a value between 1 and 12 A DC, according to the cells efficiency. The voltage limit may be set to a value between 1 and 60 V DC, and in the study the current was 8–9 A DC and the voltage was 45–55 V DC depending on the technology.
Panels are loaded into the inspection system with the sunny side down. The inside conveyors are part of the system; the alignment of panels and closing the gates is performed automatically, when feed in position tolerance of ±5 mm to the sides is observed. The in-line system is designed to safely process framed panels and contacting to the junction box is performed automatically, by a contacting device that connects cables of the junction box with connecting devices; then the test is done.
The flasher machine was used to test the power and other electrical specification at standard test conditions, where it is capable of producing an effective irradiance of 1000 W/m2. The machine is rated as class AAA, and is equipped with Endeas software. The international standard IEC60904-09 is enforced concerning light spectrum, irradiance, non-uniformity, and short-term instability (STI), as shown in Table 2 [33]. The Xenon technology spectrum is continuous, from 300 nm up to 1200 nm, and the total cycle time used for testing in this study was 30 s. The measurements followed the IEC 61215-2 norms [31], where the panel is loaded into class AAA flasher and a reference PV device is used as a reference panel of the same size with the same cell technology, to match spectral responsivity as per the IEC60904-2 norms. Then, the current-voltage characteristics of the panel are measured in accordance with the IEC60904-1 standard, at a specific set of irradiance and temperature conditions [34].
Temperature of the panel is maintained at 25 ± 2 °C, then loading into loading conveyor, which moves automatically inside the chamber of the machine that is supplied with air conditioner to keep temperature inside at 25 ± 2 °C; the operator stands on the control unit press start button, the flash tube inside the chamber radiates 1000 W/m2, then I-V is issued and saved for further investigation then the panel ejected into offloading conveyor and testing continues the same for the subsequent samples.
The flasher machine before being used was calibrated by primary calibration module, which has same size of the samples and same cell technology; in order to match spectral responsivity, the non-uniformity was also measured by dividing the designated test area into 64 equally sized (by area) test positions, and the maximum uniformity detector size shall be the minimum of the designated test area divided by 64. The area covered by the detector measurements should be 100% of the designated test area and the measurement positions, distributed uniformly over the designated test area.
By the irradiance device, which is the sensor that is positioned in the test area, the irradiance determined in each test position is then calculated by the below equation.
N o n     u n i f o r m i t y ( % ) = m a x   i r r a d i a n c e     m i n   i r r a d i a n c e m a x   i r r a d i a n c e   +   m i n   i r r a d i a n c e × 100 %
The non-uniformity recorded 0.92% over the test area 200 × 100 cm2. Temporal instability of irradiance measured at short and long term instability by irradiance vs. time of a flash pulse and long term instability by change of irradiance during entire IV curve measurement. The measured value was 0.95%. The above results indicate that the flasher falls into AAA rate, which provides high accuracy IV curve measurements.

3. Results

3.1. Category 1: µcracks before Installation (Last Stage of the Production Line) before Being Delivered to the Site

The manufacturing processes might affect the cells and cause different types of µcracks. This study focuses on analyzing the vertical, horizontal, and dendritic µcracks. Samples were chosen randomly from the last stage of production line at different working days in the period from Apr19 to 19 May 2019. Poly-crystalline solar modules are targeted in this study, and the number of µcracks counted in each module after being tested by the EL tester. The flasher test is used to determine the power drop in each tested module, and the results are depicted in Table 3.
As can be noted in Table 3, the most effective shape is dendritic when the cell turns darker in color, as no current can pass, which means no power is generated in these areas. It also shows that the more dendritic the dark cells, the more power drop is recorded. The marked samples by asterisk experience power drop percentages that vary from 0.28–1.27%, depending on the dark areas size. Moreover, as long as the samples are not connected and exposed to the environment, they do not experience any kind of degradation, while installing these samples at the site can cause degradation, due to the impact of temperature and humidity [24]. Therefore, in this category, there is no need to add free of µcracks samples (healthy samples) to make a comparison, as both look similar in power due to the fact that no effect of environmental factors in the factory.
As per the study, the essential role of power drop is having a dark area in the µcrack itself, which makes that area non-active; with that non-activation caused in the dendritic shape, the sample records power drop, however, it is noticed that dendritic shape spread and cut more than one busbar, and that is why named dendritic.
It is expected that the µcrack in Figure 3 has dendritic dark color areas to show fast degradation once installed on-site due to thermal stresses that come from different environmental conditions, therefore such types of µcrack are segregated during the manufacturing process, and downgraded to other grades.

3.2. Category 2: µcracks after Installation

Different samples are grouped into four groups based on the type of solar cells and BB numbers. In each category, power drop percentage based on the type and number of µcrack is clarified.

3.2.1. Group 1: Poly-Crystalline 3BB

By looking at this 3BB sample, in Figure 4, and with considering light-induced degradation (LID) as 1.5%, then the power output is recorded as 249.106 W, neglecting the uncertainty of the flasher machine. The difference between power after neglecting LID and the measured power during testing equals at least 8 Watt; see Table 4.

3.2.2. Group 2: Poly-Crystalline 5BB

The drop-in power in Figure 5 is due to having all kinds of µcracks and dark areas. Considering that the LID effect for poly-crystalline is 1.5%, then the power output recorded is 325.05 W, neglecting the uncertainty of the flasher machine. At least 4.05 Watts have dropped from actual power at standard test conditions (STC), in comparison to its measured power during testing at STC, see Table 5. The uncertainty of the flashers depends on the non-uniformity, the spectrum, the short time instability, and the reference device. Additionally, the LID value might be higher than 1.5% depending on the quality of solar cells during the manufacturing process, but most manufacturers have the above-mentioned value at maximum. Moreover, there is an annual power degradation which is considered up to 0.7% by all PV modules manufacturers of (glass/back sheet) technology. However, the annual degradation can be detected after one year from the installation on site, noting that in this project the historical data recorded and tested in 2016. Moreover, as long as the samples chosen from projects were aged under one year, then they were considered as being in the same conditions, due to the fact that the PV technology warranty lasts for 25 years and annual degradation was counted on a yearly basis, so if anything happened, or any degradation was detected before the end of first year, the customer reports directly to the manufacture claiming the output, and such a study discusses the expected degradation causes. However, the large-scale projects were examined and tested before the end of first year from warranty start date and at the second year of warranty start date, as those can judge and evaluate the reliability of the project.
The sample shown in Figure 6 recorded a 4.51 W power drop, after the LID effect. Added to that, these dark areas refer to the PID effect, which started from the cell’s edges. It is clearly noticed that this sample has a PID effect after being installed for a couple of months on-site, because of the shape and location of dark areas. Table 6 shows that the highest power drop is at 2.02% when 9 µcracks exist.
There should be a careful installation of samples on-site, to avoid any improper or extensive mechanical load. Moreover, the effect of PID can obviously be noticed here as the dark areas started from the boarders. It is suggested to determine the LID and PID values for the number of samples before installing large-scale projects, and this is to reduce the losses and be aware of their impact in advance.
The sample shown in Figure 7 recorded a 2.52 W power drop after removing 1.5% LID, and this power drop refers to dark cells in multiple locations. The above dark areas refer to the PID effect.

3.2.3. Group 3: Mono-Crystalline 4BB

By examining Figure 8, high-power drop was measured, due to extensive types of µcracks that were detected, besides the dark cell that caused high reduction in power. Variation in strings colors is noticed, and this is caused due to the variation in current between strings in the same sample, see also Table 7.
Hot spot is noticed in the sample, which came from improper cleaning by dislodging dust to edges and cleaning the middle of the sample. While high extensive mechanical load caused some cells to have µcracks, such as, but not limited to, extensive drilling force to install screws.
The sample shown in Figure 9 has a significant power drop that is noticed, due to having many types of µcracks at the same time, and on top of that, dark areas. The LID effect for mono-crystalline panels is up to 3%, and that is double the poly-crystalline samples.

3.2.4. Group 4: Mono-Crystalline 5BB

The sample shown in Figure 10 shows another phenomenon of dark cells that exist only in one busbar along the string and multiple strings. This might refer to cold soldering ribbons during the manufacturing process or less qualified solar cells. By examining Table 8, the highest registered power drop is 3.22% for two µcracks.
The sample shown in Figure 11 has small impact cracks (x) like a small cross in some cells, while others show dark areas. It is known that impact cracks caused by an external force applied to the cells. However, the highest power drop after eliminating the LID effect was recorded in Figure 12; the sample showed two µcracks besides comprehensive dark spots in many cells, due to improper soldering of the ribbons into the cells. In the above samples, with their results recorded in Table 7, a 3% LID effect was considered for MONO PERC cells.
The sample in Figure 12 shows different locations of vertical µcracks, but the length of each one is small, except in one cell, which is located in the third column from the right; it looks larger than the others and cuts three bus bars. Moreover, it has a small dark spot.
Figure 13 describes the classifications of µcracks influence on the severity of output power yield. This conclusion is very important in order to reject the major affected modules or replace them, in addition to monitoring others in case their effect is converted to major [15].

3.3. Discussion of µcracks Influence on Payback Period

In samples 1 and 2 from group 1 results, the standard annual degradation for this technology is 0.7%, according to the manufacturer warranty sheet. Additionally, the payback period for such projects in that year was projected at 5 years, and the max system voltage for each project was 1000 V, which means that all 26 samples are connected in one string. This constitutes around 1% of the project size. Assuming constant annual degradation of sample 1 of 3.21%, then the payback period would be extended to 20 years, whereas the payback period for sample 2 would be extended to 10 years. This is in case the 1% of each project size was affected from the µcracks effect.
In group 2, the average power drop is 1.4% for all samples after a couple of months of installation (less than one year, and no annual degradation is considered in such case). The samples show several µcracks shapes and PID effect, noting that the standard annual degradation for this technology is 0.7% according to the manufacturer warranty sheet, and the payback period for such projects in that year was three years. Assuming constant annual degradation is 1.4%, then the payback period would be extended to six years. This is in case all the samples are connected in the same string.
For group 3, the standard annual degradation for this technology is 0.65% according to manufacturer warranty sheet, and the payback period for such projects in that year of installation was five years. Assuming constant annual degradation on average for both mentioned samples in Figure 8 and Figure 9 is 5.5%, then the payback period would be extended to 40 years, and this is in the case that both samples connected in same string.
The standard annual degradation for the technology in group 4 is 0.65% according to the manufacturer warranty sheet, and the payback period for such projects in that year was three years. Assuming the constant annual degradation of above samples in Table 8 is 0.55%, then the payback period would remain the same, since the µcracks effect reduced the power less than the standard annual degradation provided by the manufacturer.
It appears that µcracks can have a severe effect on the payback period if the faulty panels are not replaced. The most effect can be seen on group 3 (mono-crystalline 4 BB), where group 4 (mono-crystalline 5 BB) is the lowest influence. These data are estimated considering that the faulty panels will affect the complete strings in projects.

4. Conclusions and Summary

This manuscript presented and discussed a procedural methodology to test, evaluate and verify the impact of micro cracks on the performance of PV modules prior to installation phase, as well as testing operating samples from the field. Test results of both sampling methods revealed important performance parameters quantification and identification, in relation to the existence of micro cracks of different shapes and sizes. The direct impact of micro cracks on the power production capacity of PV modules is vital element in this study. Data were collected from different projects in Jordan, to describe the effect of each µcracks shape on power loss, aiming to give decision makers an indication to decide whether to replace the faulty panels or not, depending on their own conditions and projects sizes. It is found that the µcracks have impacted power loss differently and recorded power reduction of percentages of 0.82–3.21% for poly-crystalline technology. Variation in power degradation depends on the module situation; whether it is stocked in facility or operated on-site. In mono-crystalline technology’s case, the power losses varied between 0.55% and 0.9%, except that some samples from both technologies have other effects other than micro cracks, which affected power severely.
The samples tested before installation on-site recorded a power drop from 0.2–1.3% for poly-crystalline technology. While samples form installed modules on sites (3BB solar cells), we recorded a power drop of 0.82–3.21%. For the case of poly crystalline samples (5BB) that have a PID effect, the power drop was 0.8–2.1%.
Power drop in experimented mono crystalline modules was 2–9% for samples that have (4BB) mono PERC solar cells exposed to improper cleaning and extensive ML, whereas mono PERC (5BB) dropped from 0.2–0.9%.
This study points out the need for further studies to precisely figure out the relation between the number of the busbars that exist in the solar cell, shape, location and final performance of µcracks.
EL imaging helps to identify the dark areas and the PID effect besides µcracks. Therefore, the EL tester, a type of camera, and an experienced technician or engineer are necessary to perform the testing.
It is found that the snail trail that had appeared visually in some samples examined in this study did grow in the path of µcracks only. Therefore, the snail trail is a visual appearance that comes with µcrack. The point here is that, with all samples, the snail trail has no ability to grow nor increase with the time, as long as the source of µcracks is not there.

Author Contributions

Conceptualization, M.B. and A.A.-S.; Data curation, Z.D. and A.A.-S.; Formal analysis, M.B., M.A.-A. and A.A.-S.; Investigation, A.R.; Methodology, M.B., Z.D. and A.A.-S.; Visualization, Z.D. and M.A.-A.; Writing – original draft, M.B. and A.R. All authors have read and agreed to the published version of the manuscript.

Funding

This research received no external funding.

Acknowledgments

The authors would like to thank the German Jordanian University represented by the Deanship of Graduate Studies and Scientific Research for supporting this work.

Conflicts of Interest

The authors declare no conflict of interest.

References

  1. El hendouzi, A.; Bourouhou, A.; Ansari, O. The Importance of Distance between Photovoltaic Power Stations for Clear Accuracy of Short-Term Photovoltaic Power Forecasting. J. Electr. Comput. Eng. 2020, 2020, 1–14. [Google Scholar] [CrossRef] [Green Version]
  2. Chowdhury, M.S.; Rahman, K.S.; Chowdhury, T.; Nuthammachot, N.; Techato, K.; Akhtaruzzaman, M.; Tiong, S.K.; Sopian, K.; Amin, N. An overview of solar photovoltaic panels’ end-of-life material recycling. Energy Strategy Rev. 2020, 27, 100431. [Google Scholar] [CrossRef]
  3. Almeshaiei, E.; Al-Habaibeh, A.; Shakmak, B. Rapid evaluation of micro-scale photovoltaic solar energy systems using empirical methods combined with deep learning neural networks to support systems’ manufacturers. J. Clean. Prod. 2020, 244, 118788. [Google Scholar] [CrossRef]
  4. Mathias, N.; Shaikh, F.; Thakur, C.; Shetty, S.; Dumane, P.; Chavan, S. Detection of Micro-Cracks in Electroluminescence Images of Photovoltaic Modules. SSRN J. 2020. [Google Scholar] [CrossRef]
  5. Bekkelund, K. A Comparative Life Cycle Assessment of PV Solar Systems. Master’s Thesis, Department of Energy and Process Engineering, Norwegian University of Science and Technology, Trondheim, Norway, 2013. [Google Scholar]
  6. Ghazi, S.; Ip, K. The effect of weather conditions on the efficiency of PV panels in the southeast of UK. Renew. Energy 2014, 69, 50–59. [Google Scholar] [CrossRef]
  7. Al-Addous, M.; Dalala, Z.; Alawneh, F.; Class, C.B. Modeling and quantifying dust accumulation impact on PV module performance. Sol. Energy 2019, 194, 86–102. [Google Scholar] [CrossRef]
  8. Abu-Rumman, G.; Khdair, A.I.; Khdair, S.I. Current status and future investment potential in renewable energy in Jordan: An overview. Heliyon 2020, 6, e03346. [Google Scholar] [CrossRef] [PubMed]
  9. NEPCO. National Electric Power Company Annual Report 2018; NEPCO: Amman, Jordan, 2018. [Google Scholar]
  10. PI Berlin, Industry Trends in PV Module Quality from over 250 Factory Audits; PI Photovoltaik-Institut Berlin AG: Berlin, Germany, 2019.
  11. Bagher, M.A. Types of Solar Cells and Application. AJOP 2015, 3, 94. [Google Scholar] [CrossRef] [Green Version]
  12. Fraunhofer, I.S.E. Photovoltaics Report; Fraunhofer ISE: Freiburg, Germany, 2019. [Google Scholar]
  13. Gerbinet, S.; Belboom, S.; Léonard, A. Life Cycle Analysis (LCA) of photovoltaic panels: A review. Renew. Sustain. Energy Rev. 2014, 38, 747–753. [Google Scholar] [CrossRef]
  14. Köntges, M.; Kajari-Schröder, S.; Kunze, I.; Jahn, U. Crack Statistic of Crystalline Silicon Photovoltaic Modules. In Proceedings of the 26th European Photovoltaic Solar Energy Conference and Exhibition, Berlin/Heidelberg, Germany, 5–9 September 2011; pp. 3290–3294. [Google Scholar] [CrossRef]
  15. Bdour, M.; Al-Sadi, A. Analysis of Different Microcracks Shapes and the Effect of Each Shape on Performance of PV Modules; ICEEESM: Barcelona, Spain, 2020. [Google Scholar]
  16. Spataru, S.; Hacke, P.; Sera, D. Automatic Detection and Evaluation of Solar Cell Micro-Cracks in Electroluminescence Images Using Matched Filters. In Proceedings of the 2016 IEEE 43rd Photovoltaic Specialists Conference (PVSC), Portland, OR, USA, 5–10 June 2016; IEEE: Portland, OR, USA, 2016; pp. 1602–1607. [Google Scholar]
  17. Gu, X.; Liu, Z.; Qiu, Y.; Cao, C.; Lim, M.T. An Effective Method On Evaluating Photovoltaic Module Snail Trail. Energy Procedia 2018, 150, 58–65. [Google Scholar] [CrossRef]
  18. Peshek, T.J.; Fada, J.S.; Martin, I.T. Degradation Processes in Photovoltaic Cells. In Durability and Reliability of Polymers and Other Materials in Photovoltaic Modules; Elsevier: Amsterdam, The Netherlands, 2019; pp. 97–118. ISBN 978-0-12-811545-9. [Google Scholar]
  19. Papargyri, L.; Theristis, M.; Kubicek, B.; Krametz, T.; Mayr, C.; Papanastasiou, P.; Georghiou, G.E. Modelling and experimental investigations of microcracks in crystalline silicon photovoltaics: A review. Renew. Energy 2020, 145, 2387–2408. [Google Scholar] [CrossRef]
  20. Köntges, M.; Kunze, I.; Kajari-Schröder, S.; Breitenmoser, X.; Bjørneklett, B. The risk of power loss in crystalline silicon based photovoltaic modules due to micro-cracks. Sol. Energy Mater. Sol. Cells 2011, 95, 1131–1137. [Google Scholar] [CrossRef]
  21. Dhimish, M.; Holmes, V.; Mehrdadi, B.; Dales, M. The impact of cracks on photovoltaic power performance. J. Sci. Adv. Mater. Devices 2017, 2, 199–209. [Google Scholar] [CrossRef]
  22. Dhimish, M. Micro cracks distribution and power degradation of polycrystalline solar cells wafer: Observations constructed from the analysis of 4000 samples. Renew. Energy 2020, 145, 466–477. [Google Scholar] [CrossRef]
  23. Kajari-Schršder, S.; Kunze, I.; Kšntges, M. Criticality of Cracks in PV Modules. Energy Procedia 2012, 27, 658–663. [Google Scholar] [CrossRef] [Green Version]
  24. Santhakumari, M.; Sagar, N. A review of the environmental factors degrading the performance of silicon wafer-based photovoltaic modules: Failure detection methods and essential mitigation techniques. Renew. Sustain. Energy Rev. 2019, 110, 83–100. [Google Scholar] [CrossRef]
  25. Ustun, T.S.; Nakamura, Y.; Hashimoto, J.; Otani, K. Performance analysis of PV panels based on different technologies after two years of outdoor exposure in Fukushima, Japan. Renew. Energy 2019, 136, 159–178. [Google Scholar] [CrossRef]
  26. Paggi, M.; Sapora, A. Numerical Modelling of Microcracking in PV Modules Induced by Thermo-mechanical Loads. Energy Procedia 2013, 38, 506–515. [Google Scholar] [CrossRef]
  27. Deitsch, S.; Christlein, V.; Berger, S.; Buerhop-Lutz, C.; Maier, A.; Gallwitz, F.; Riess, C. Automatic classification of defective photovoltaic module cells in electroluminescence images. Sol. Energy 2019, 185, 455–468. [Google Scholar] [CrossRef] [Green Version]
  28. Chen, H.; Zhao, H.; Han, D.; Liu, K. Accurate and robust crack detection using steerable evidence filtering in electroluminescence images of solar cells. Opt. Lasers Eng. 2019, 118, 22–33. [Google Scholar] [CrossRef]
  29. Yang, S.; Jiang, L. Crystalline Silicon PV Module Field Failures. In Durability and Reliability of Polymers and Other Materials in Photovoltaic Modules; Elsevier: Amsterdam, The Netherlands, 2019; pp. 177–216. ISBN 978-0-12-811545-9. [Google Scholar]
  30. Liu, D. (Ed.) Lecture Notes in Computer Science. In Proceedings of the Advances in Neural Networks--ISNN 2007: 4th International Symposium on Neural Networks, ISNN 2007, Nanjing, China, 3–7 June 2007; Springer: Berlin, Germany; New York, NY, USA, 2007; ISBN 978-3-540-72382-0. [Google Scholar]
  31. Dhimish, M.; Holmes, V.; Mather, P. Novel Photovoltaic Micro Crack Detection Technique. IEEE Trans. Device Mater. Relib. 2019, 19, 304–312. [Google Scholar] [CrossRef] [Green Version]
  32. Spataru, S.; Hacke, P.; Sera, D.; Glick, S.; Kerekes, T.; Teodorescu, R. Quantifying Solar Cell Cracks in Photovoltaic Modules by Electroluminescence Imaging. In Proceedings of the 2015 IEEE 42nd Photovoltaic Specialist Conference (PVSC), New Orleans, LA, USA, 14–19 June 2015; IEEE: New Orleans, LA, USA, 2015; pp. 1–6. [Google Scholar]
  33. IEC. Photovoltaic Devices–Part 9: Solar Simulator Performance Requirements; IEC: Geneva, Switzerland, 2006. [Google Scholar]
  34. IEC. Terrestrial Photovoltaic (PV) Modules–Design Qualification and Type Approval; IEC: Geneva, Switzerland, 2016. [Google Scholar]
Figure 1. µcracks influence [15].
Sustainability 12 06416 g001
Figure 2. Working methodology.
Sustainability 12 06416 g002
Figure 3. Dendritic with dark areas in four cells 325.8 W–5BB Project–Poly Crystalline 4.214 W power drop.
Sustainability 12 06416 g003
Figure 4. Sample installed for four months in 2016 in Dabouq 241 W–3BB project–Poly.
Sustainability 12 06416 g004
Figure 5. µcracks are exist 5BB project 321 W.
Sustainability 12 06416 g005
Figure 6. Poly sample installed in Ein al Basha 316.9 W; the pic was taken after installation-5BB.
Sustainability 12 06416 g006
Figure 7. Poly sample installed in Ein al Basha—(320.6 W)—the pic was taken after installation-5BB project.
Sustainability 12 06416 g007
Figure 8. Samples installed in 2016 in ALMafraq project before installation on the left and after installation on the right—shows power drop 31 W-4BB project.
Sustainability 12 06416 g008
Figure 9. Mono sample installed in ALMafraq project; the picture was taken after installation and shows power drop 8.5 W-4BB project.
Sustainability 12 06416 g009
Figure 10. Module with 359 W, vertical µcracks in two cells after installation and appearance of the dark area.
Sustainability 12 06416 g010
Figure 11. Module with 485 W, impact crack and some dark areas in some cells.
Sustainability 12 06416 g011
Figure 12. Module with 358.7 W, vertical µcracks after installation on-site.
Sustainability 12 06416 g012
Figure 13. Here; µcracks categorization into major and minor on power yield.
Sustainability 12 06416 g013aSustainability 12 06416 g013b
Table 1. Category 1 and 2 samples projects.
Groups (Based on BB Numbers)Number of SamplesLocationYear
Category 1
Mixed27After production2019
Category 2
1 (3 BB-Poly)2Dabouq and Al-Qastal (both in Amman)2016
2 (5 BB-Poly)8 *Ein Al-Basha2019
3 (4 BB-Mono)2Al-Mafrag2016
4 (5 BB-Mono)5Al-Qastal2019
* the first sample was taken from panels that have been installed for two weeks in China, and then shipped to Jordan.
Table 2. IEC904-9 ed.2 compliance [33].
IEC904-9 ed.2 Compliance
Spectrum < ±25%AAA
Non-Uniformity < ±2%AAA
Short term instability (STI) < 0.5% AAA
Table 3. Here; µcracks before installation (last stage of the production line) before delivery to the site.
Sample Nr.AnalysisNumber of Broken CellsCategoryActual PowerNameplate Label (0 + 3%)Drop in Power (Watt)% Power Drop
1Dendritic in 1 cell and 4 diagonal to bus bars and 1 vertical.6dendritic, vertical, diagonal333.303330N/AN/A
23 diagonal, 3 vertical and 5 dendritic with no dark areas.11vertical330.255330N/AN/A
32 dendritic and 1 vertical3Dendritic and vertical332.291330N/AN/A
4* 5 dendritic and 5 Parallel to bus bars (vertical).10dendritic and vertical326.297330At least 3.7031.12
5* V shape on one bus bar (Other)1vertical and others336.293330No dropN/A
6parallel to bus bar (vertical)11vertical330.327330No dropN/A
7broken cell from edge (others)1others331.778330No dropN/A
8dendritic1dendritic331.464330No dropN/A
9Vertical with dark areas3vertical331.464330No dropN/A
10broken cell from edge1others334.898330No dropN/A
11broken cell on busbar/vertical1vertical334.693330No dropN/A
12Dendritic with dark area1dendritic333.974330No dropN/A
13vertical4vertical333.974330No dropN/A
14vertical4vertical333.899330No dropN/A
15diagonal on 4 cells 2 cells have dark impurities on wafers (others)4others332.057330No dropN/A
16dendritic1dendritic332.091330No dropN/A
17Diagonal14diagonal332.301330No dropN/A
18Diagonal2diagonal332.301330No dropN/A
19dendritic2dendritic332.022330No dropN/A
20dendritic1dendritic335.468330No dropN/A
21impact crack (others)1others332.476330No dropN/A
22horizontal crack4horizontal331.508330No dropN/A
23horizontal crack5horizontal330.6330No dropN/A
241 dendritic 1 horizontal2dendritic and horizontal330.315330No dropN/A
25broken cell on busbar (vertical with dark area)1vertical330.49330No dropN/A
26* 4 diagonal and 1 dendritic5Dendritic and vertical329.051330At least 0.9490.28
27* Dendritic with dark areas4dendritic325.786330At least 4.2141.27
* The marked samples refer to EL Figure 3.
Table 4. Poly-Crystalline Sample–3BB.
Sample Nr.AnalysisNumber of Broken CellsCategoryActual PowerNameplate Label (0 + 3%)Drop in Power (Watt)% Power Drop (after Discarding LID)
1
(Installed for 4 months in Amman-Dabouq from June–November 2016)
Parallel to busbar (vertical) with dark areas in 9 cells and 2 without dark areas11Vertical and dark areas24125083.21
2
(Installed for 2 months in Amman-Al-Qastal from February–March 2016)
Parallel (vertical) to the bus bar with dark areas in 8 cells and 3 without dark areas. (Backsheet scratch detected in the first string).11Vertical and dark areas245.82503.4051.36
Table 5. Analysis for one Poly-5BB Crystalline Module shipped to Jordan and installed for two weeks in China.
AnalysisDendritic and Vertical (after Exposed on Site for Two Weeks Then Shipped to Jordan)
Number of µcracks31
Categorydendritic and vertical
Actual Power321
Nameplate label (0 + 3%)330
Actual power once sold330
Drop in power per (W)4.05
Power drop in (%) after discarding LID1.22
Table 6. Poly-Crystalline Samples–5BB Installed for 3 months in Amman-Ein ALBasha Jan–Mar 2019.
AnalysisNumber of µcracksCategoryActual PowerNameplate Label (0 + 3%)Power Drop (W)Power Drop in % after Removing LID
Impact crack, vertical besides some dark areas in some cells2Impact and vertical320.63252.520.78
Original power
328.06
Parallel on all bus bars-4 cells/vertical4Vertical316.9463254.511.4
Original power
326.36
dendritic-1 cell and vertical 34Dendritic and Vertical316.3413255.91.8
Original power
327.15
* parallel to bus bar 4 and 5 dendritic9Dendritic and Vertical316.3453256.542.02
Original power
327.806
horizontal and vertical5horizontal and vertical316.3013253.281.01
Original power
324.452
vertical to bus bar5vertical316.9263255.311.64
Original power
327.145
vertical to bus bar4vertical319.83252.80.86
Original power
327.609
Modules with PID effect that caused dark areas had not been counted. * refers to the sample with the highest power drop.
Table 7. Mono-Crystalline Sample–4BB Installed for 4 months in AL Mafraq-Jordan from Feb–Mar 2016.
AnalysisNumber of µcracksCategoryActual PowerNameplate Label (0 + 3%)Drop in Power (W)Power Drop in % after Discarding LID
Dark cell, dendritic vertical and other * plus 24 Light cells6Dendritic, vertical, dark cell and tangent Micro cracks324.436031.2028.77
Originally it was 366.6 W
Vertical, dendritic with the dark area and tangent micro cracks5Dendritic with the dark area, vertical and tangent micro cracks3453608.5652.42
Originally it was 364.5 W
* Refers to the highest power drop sample.
Table 8. Mono Crystalline Samples–5BB Installed for 2 months in Amman-AlQastal, from July to October 2019.
AnalysisNumber of µcracksCategoryActual PowerNameplate Label (0 + 3%)Power Drop (W)Power Drop in % after Discarding LID
* Vertical micro cracks2vertical359.0263703.220.89
S.N:original power
PS170219553493373.454 W
Impact crack1Impact (others)358.4853700.800.22
S.N:original power
PS170219555091370.405 W
Vertical micro cracks2vertical358.709 W3701.940.53
S.N:original power
PS170219566646371.805 W
Vertical1Vertical359.4413701.360.37
S.N:original power
PS170219550530371.959 W
Others (dark areas)Not countedOthers360.0483702.70.74
S.N:original power
PS170219596750373.985
* Refers to the highest power drop sample.

