Scenario-Based Allocation of Emergency Resources in Metro Emergencies: A Model Development and a Case Study of Nanjing Metro

Abstract
1. Introduction
2. Literature Review
2.1. Metro Emergency Management
2.2. The Allocation of Emergency Resources
2.3. Scenario Analysis Theories
2.4. Review Summary
3. The Application of Scenario Analysis in Metro Emergencies
3.1. Classification of Metro Emergencies
3.2. Classification of Corresponding Emergency Resources
3.3. Scenario Analysis of Metro Emergencies
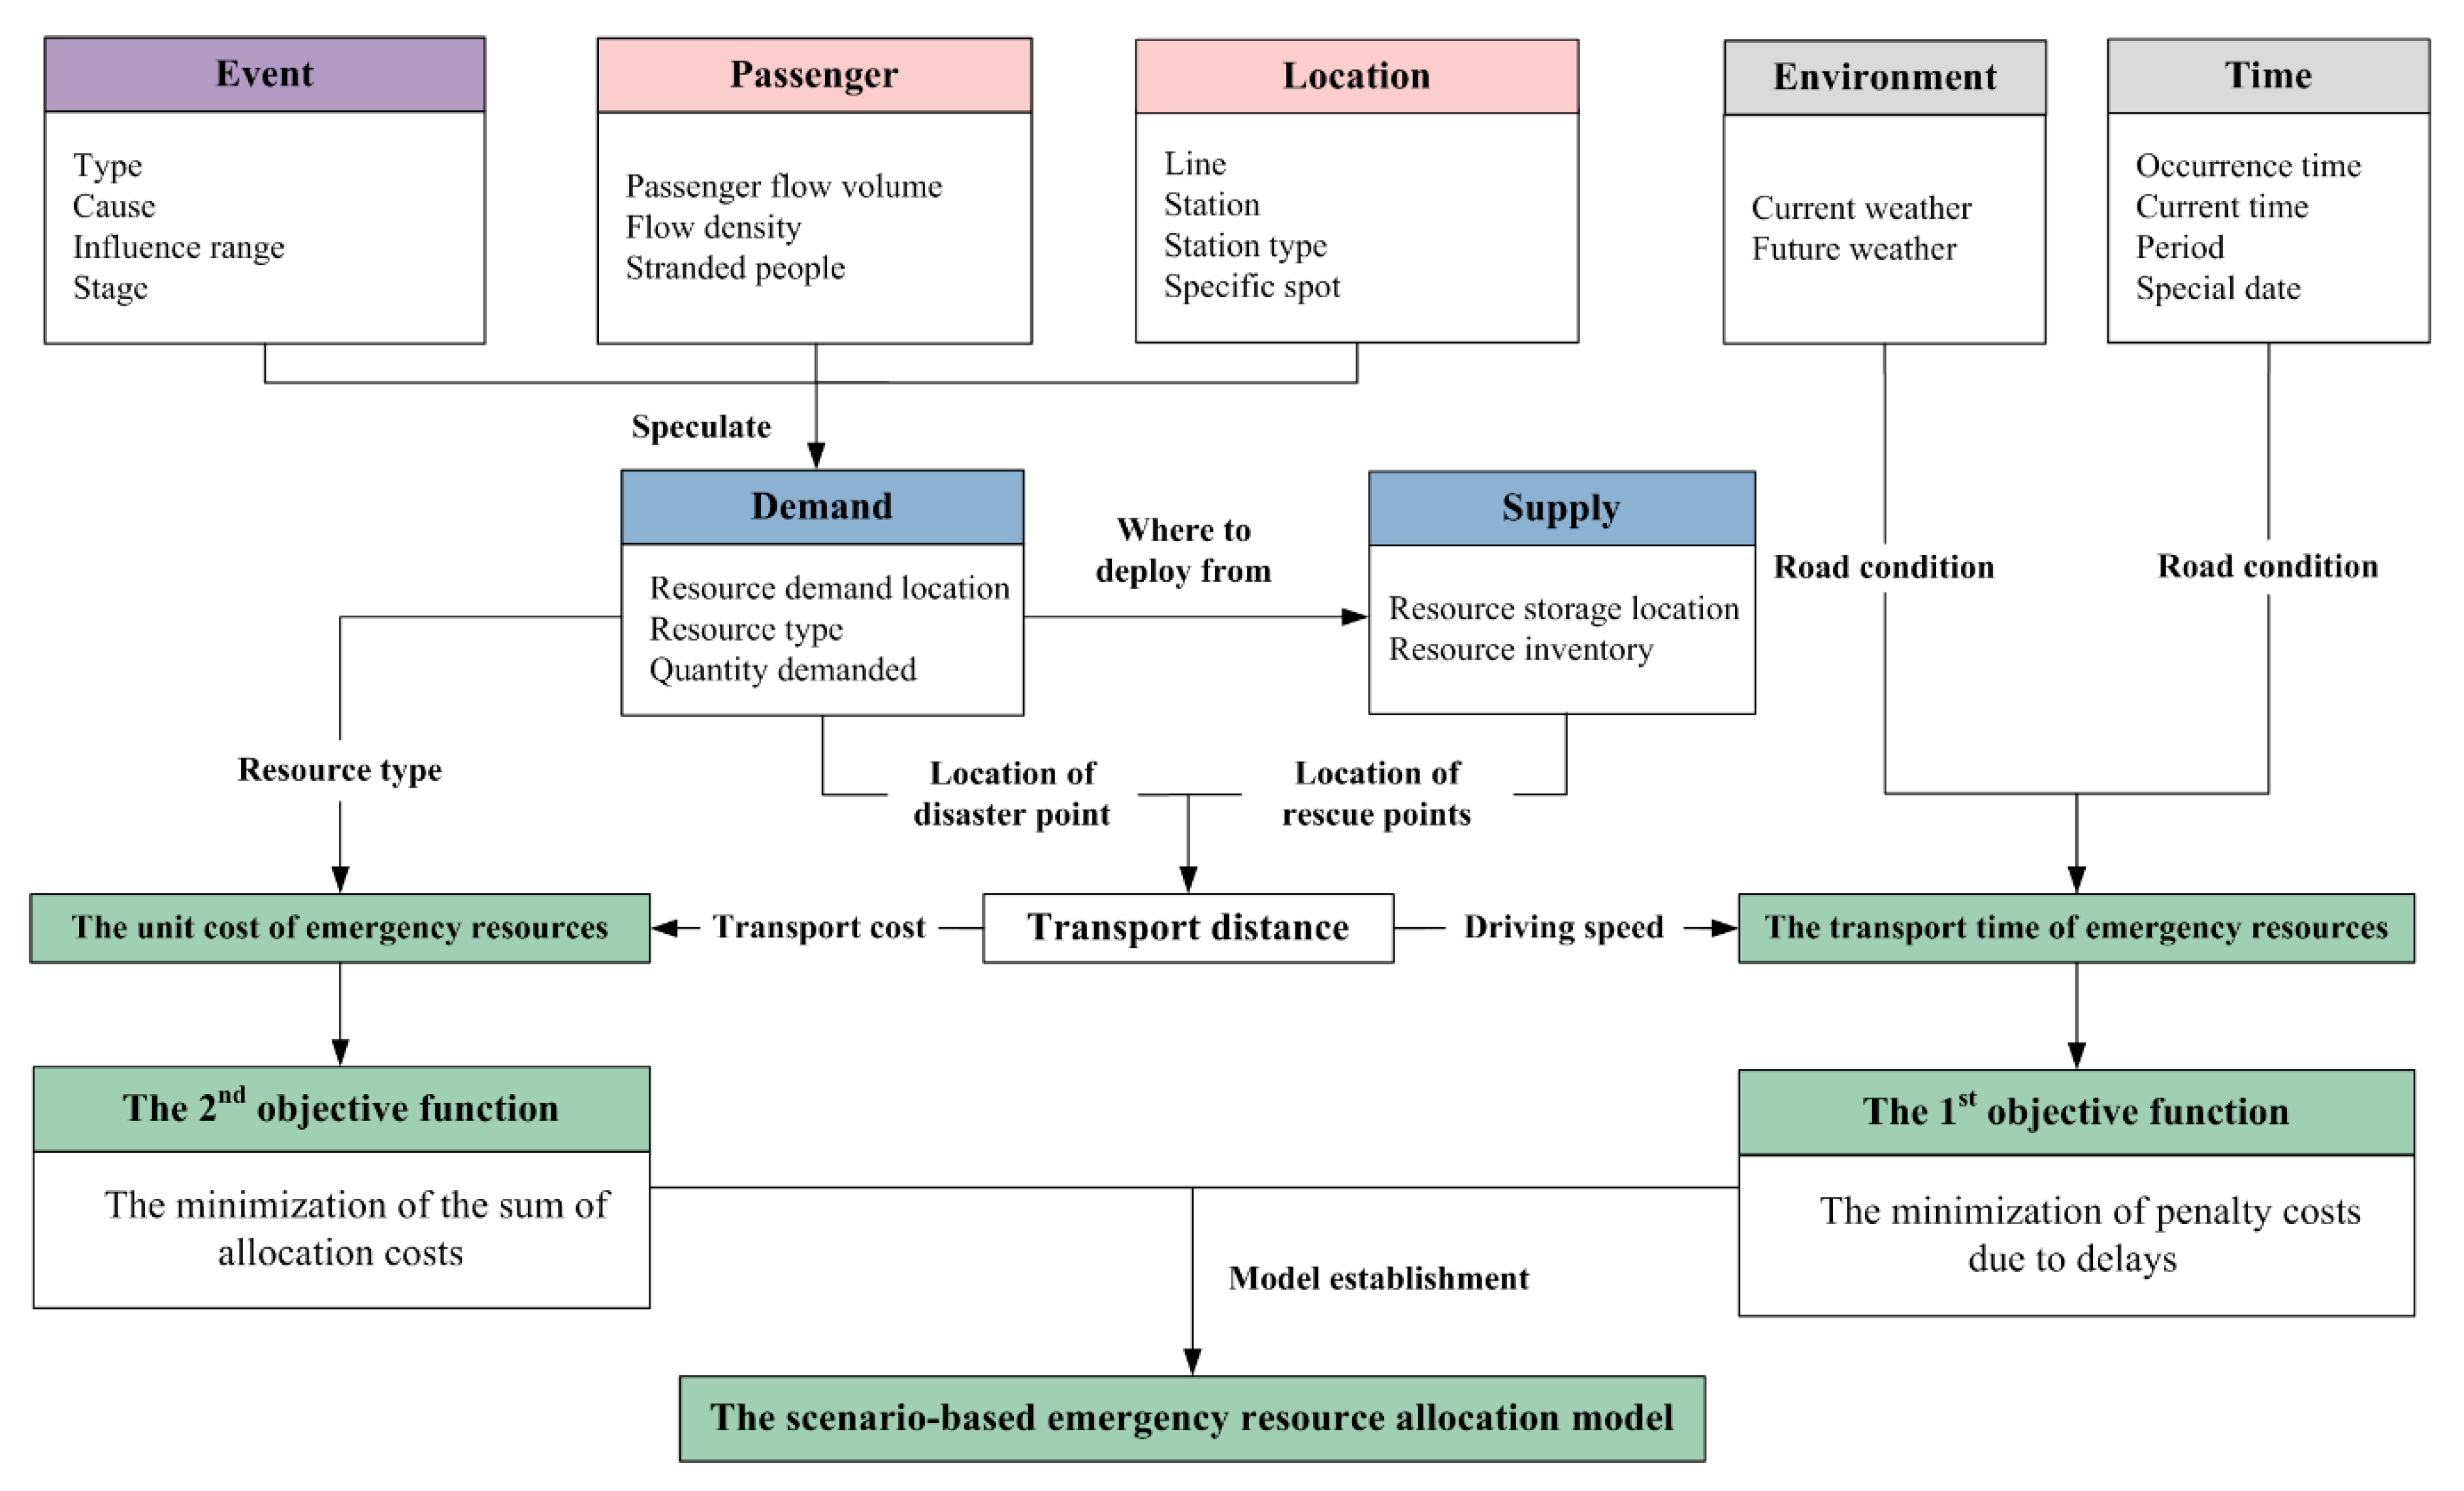
3.4. Logic Framework
4. Resource Allocation Model for Metro Emergencies
4.1. Model Development
4.1.1. Explanation of Hypothesis
4.1.2. Modeling
4.1.3. Model Analysis
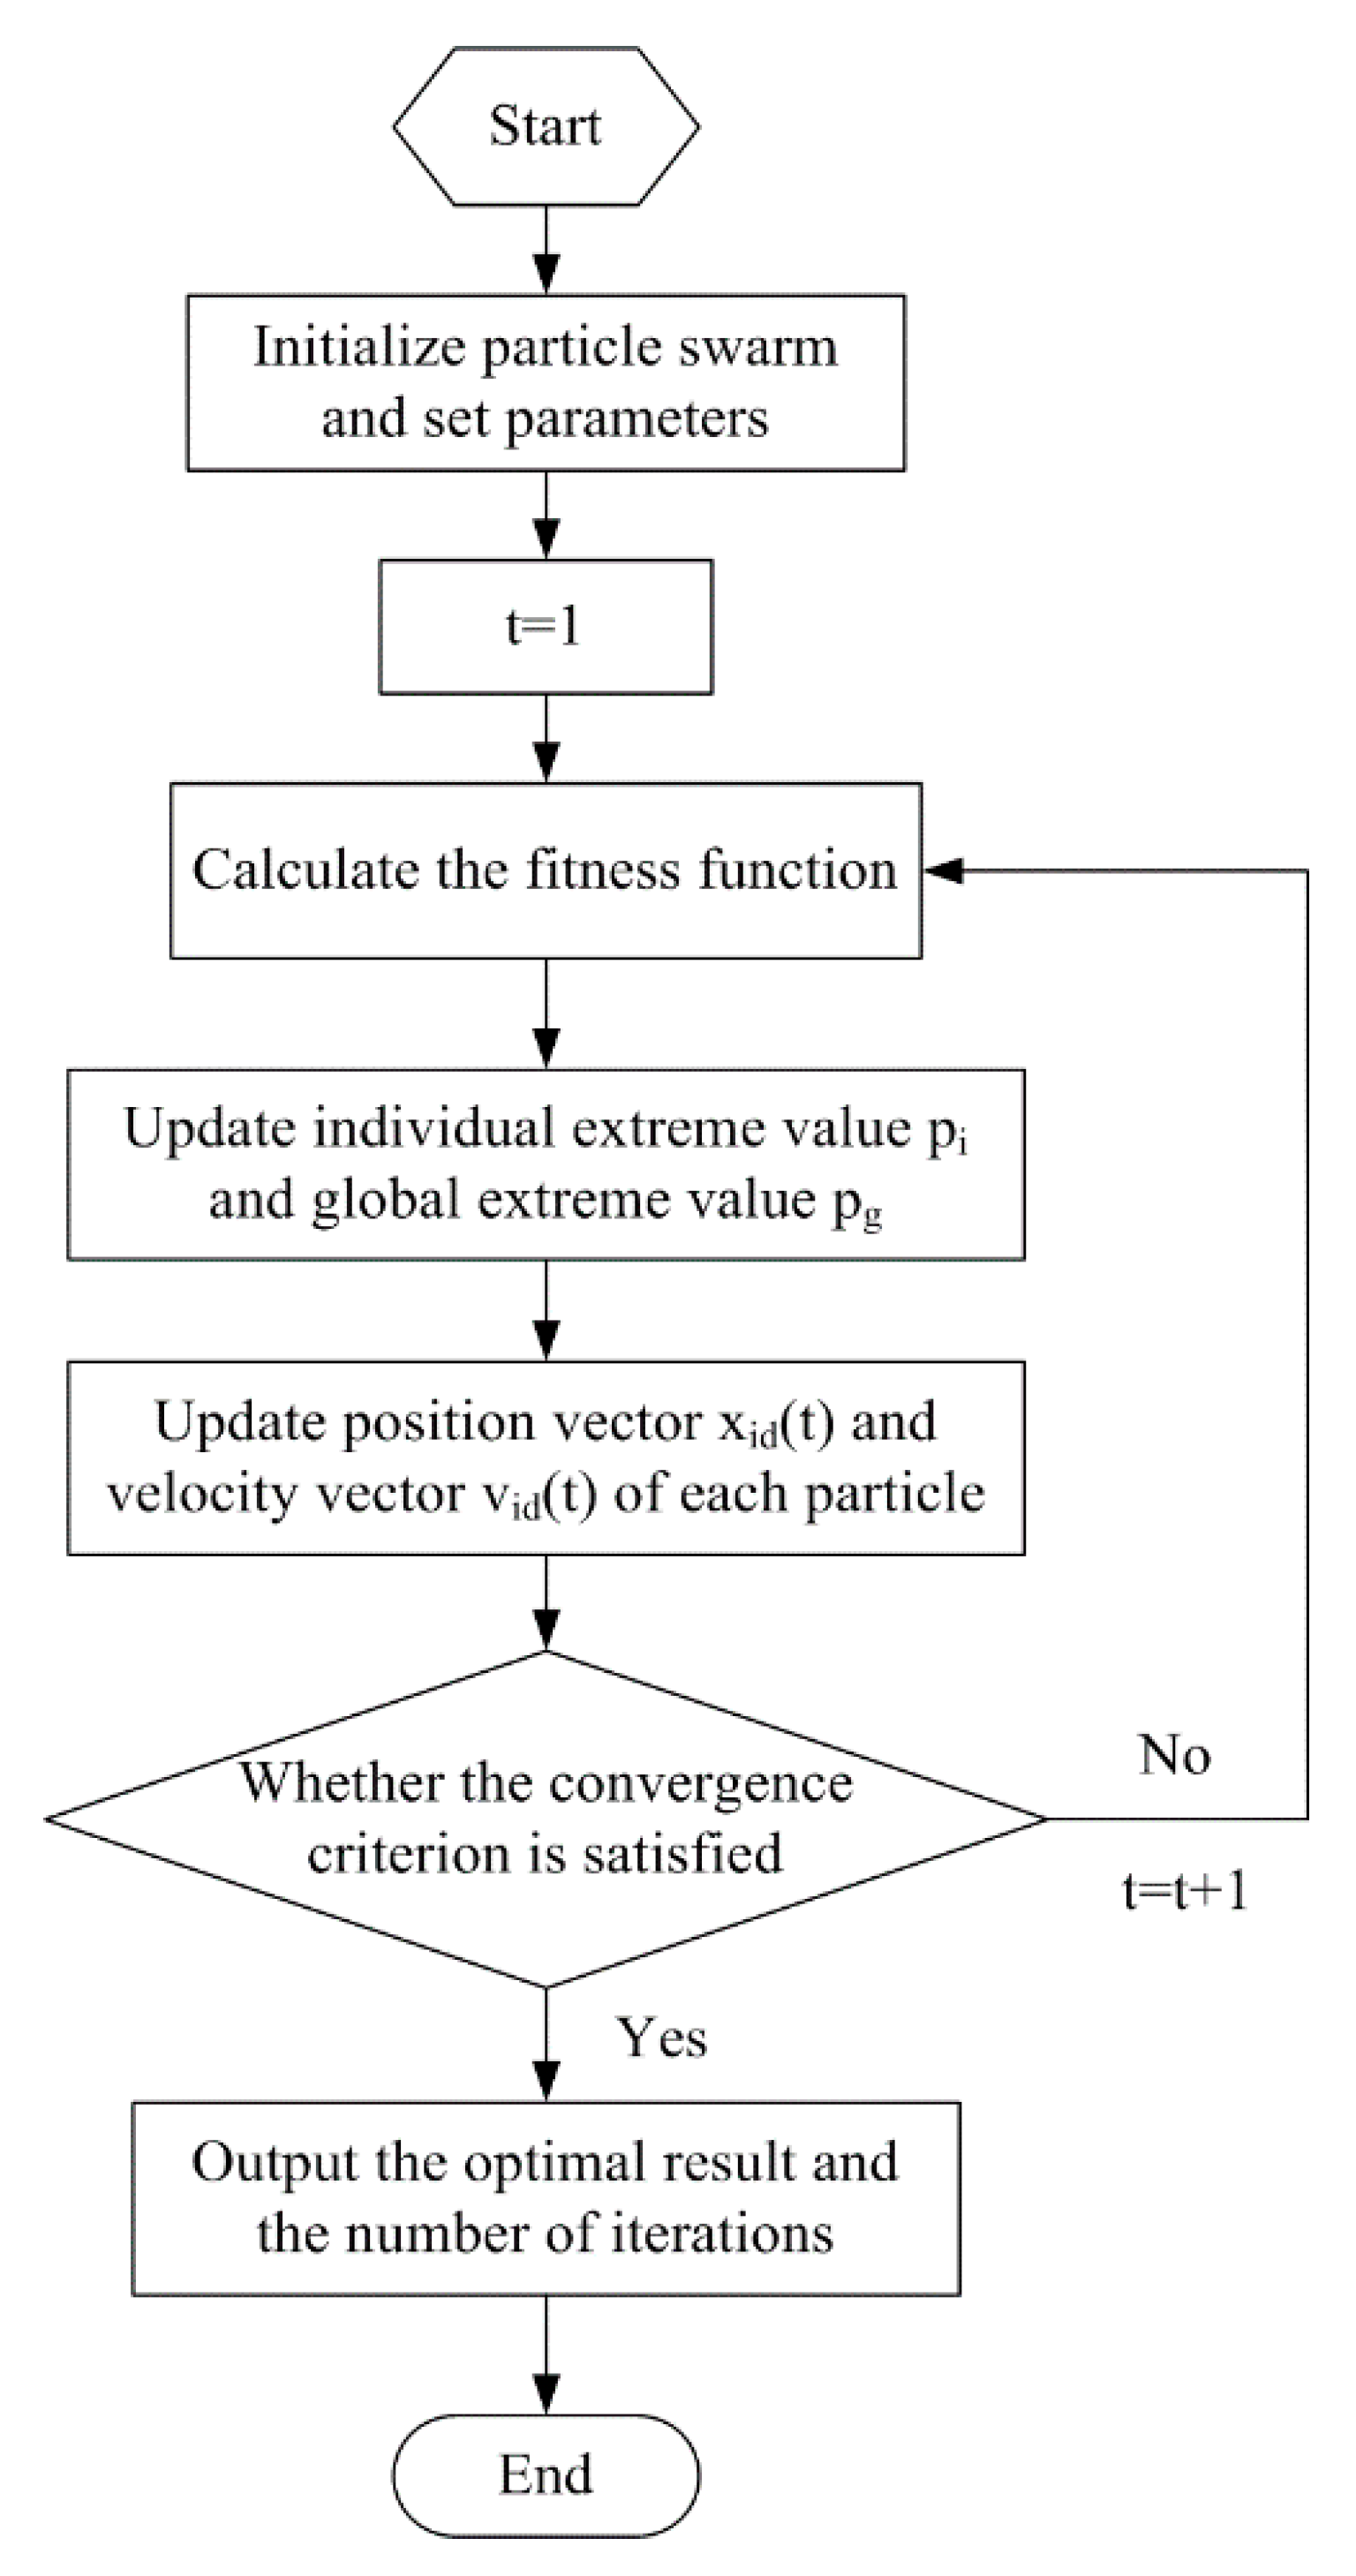
4.2. Model Solving Algorithm
5. Case Study
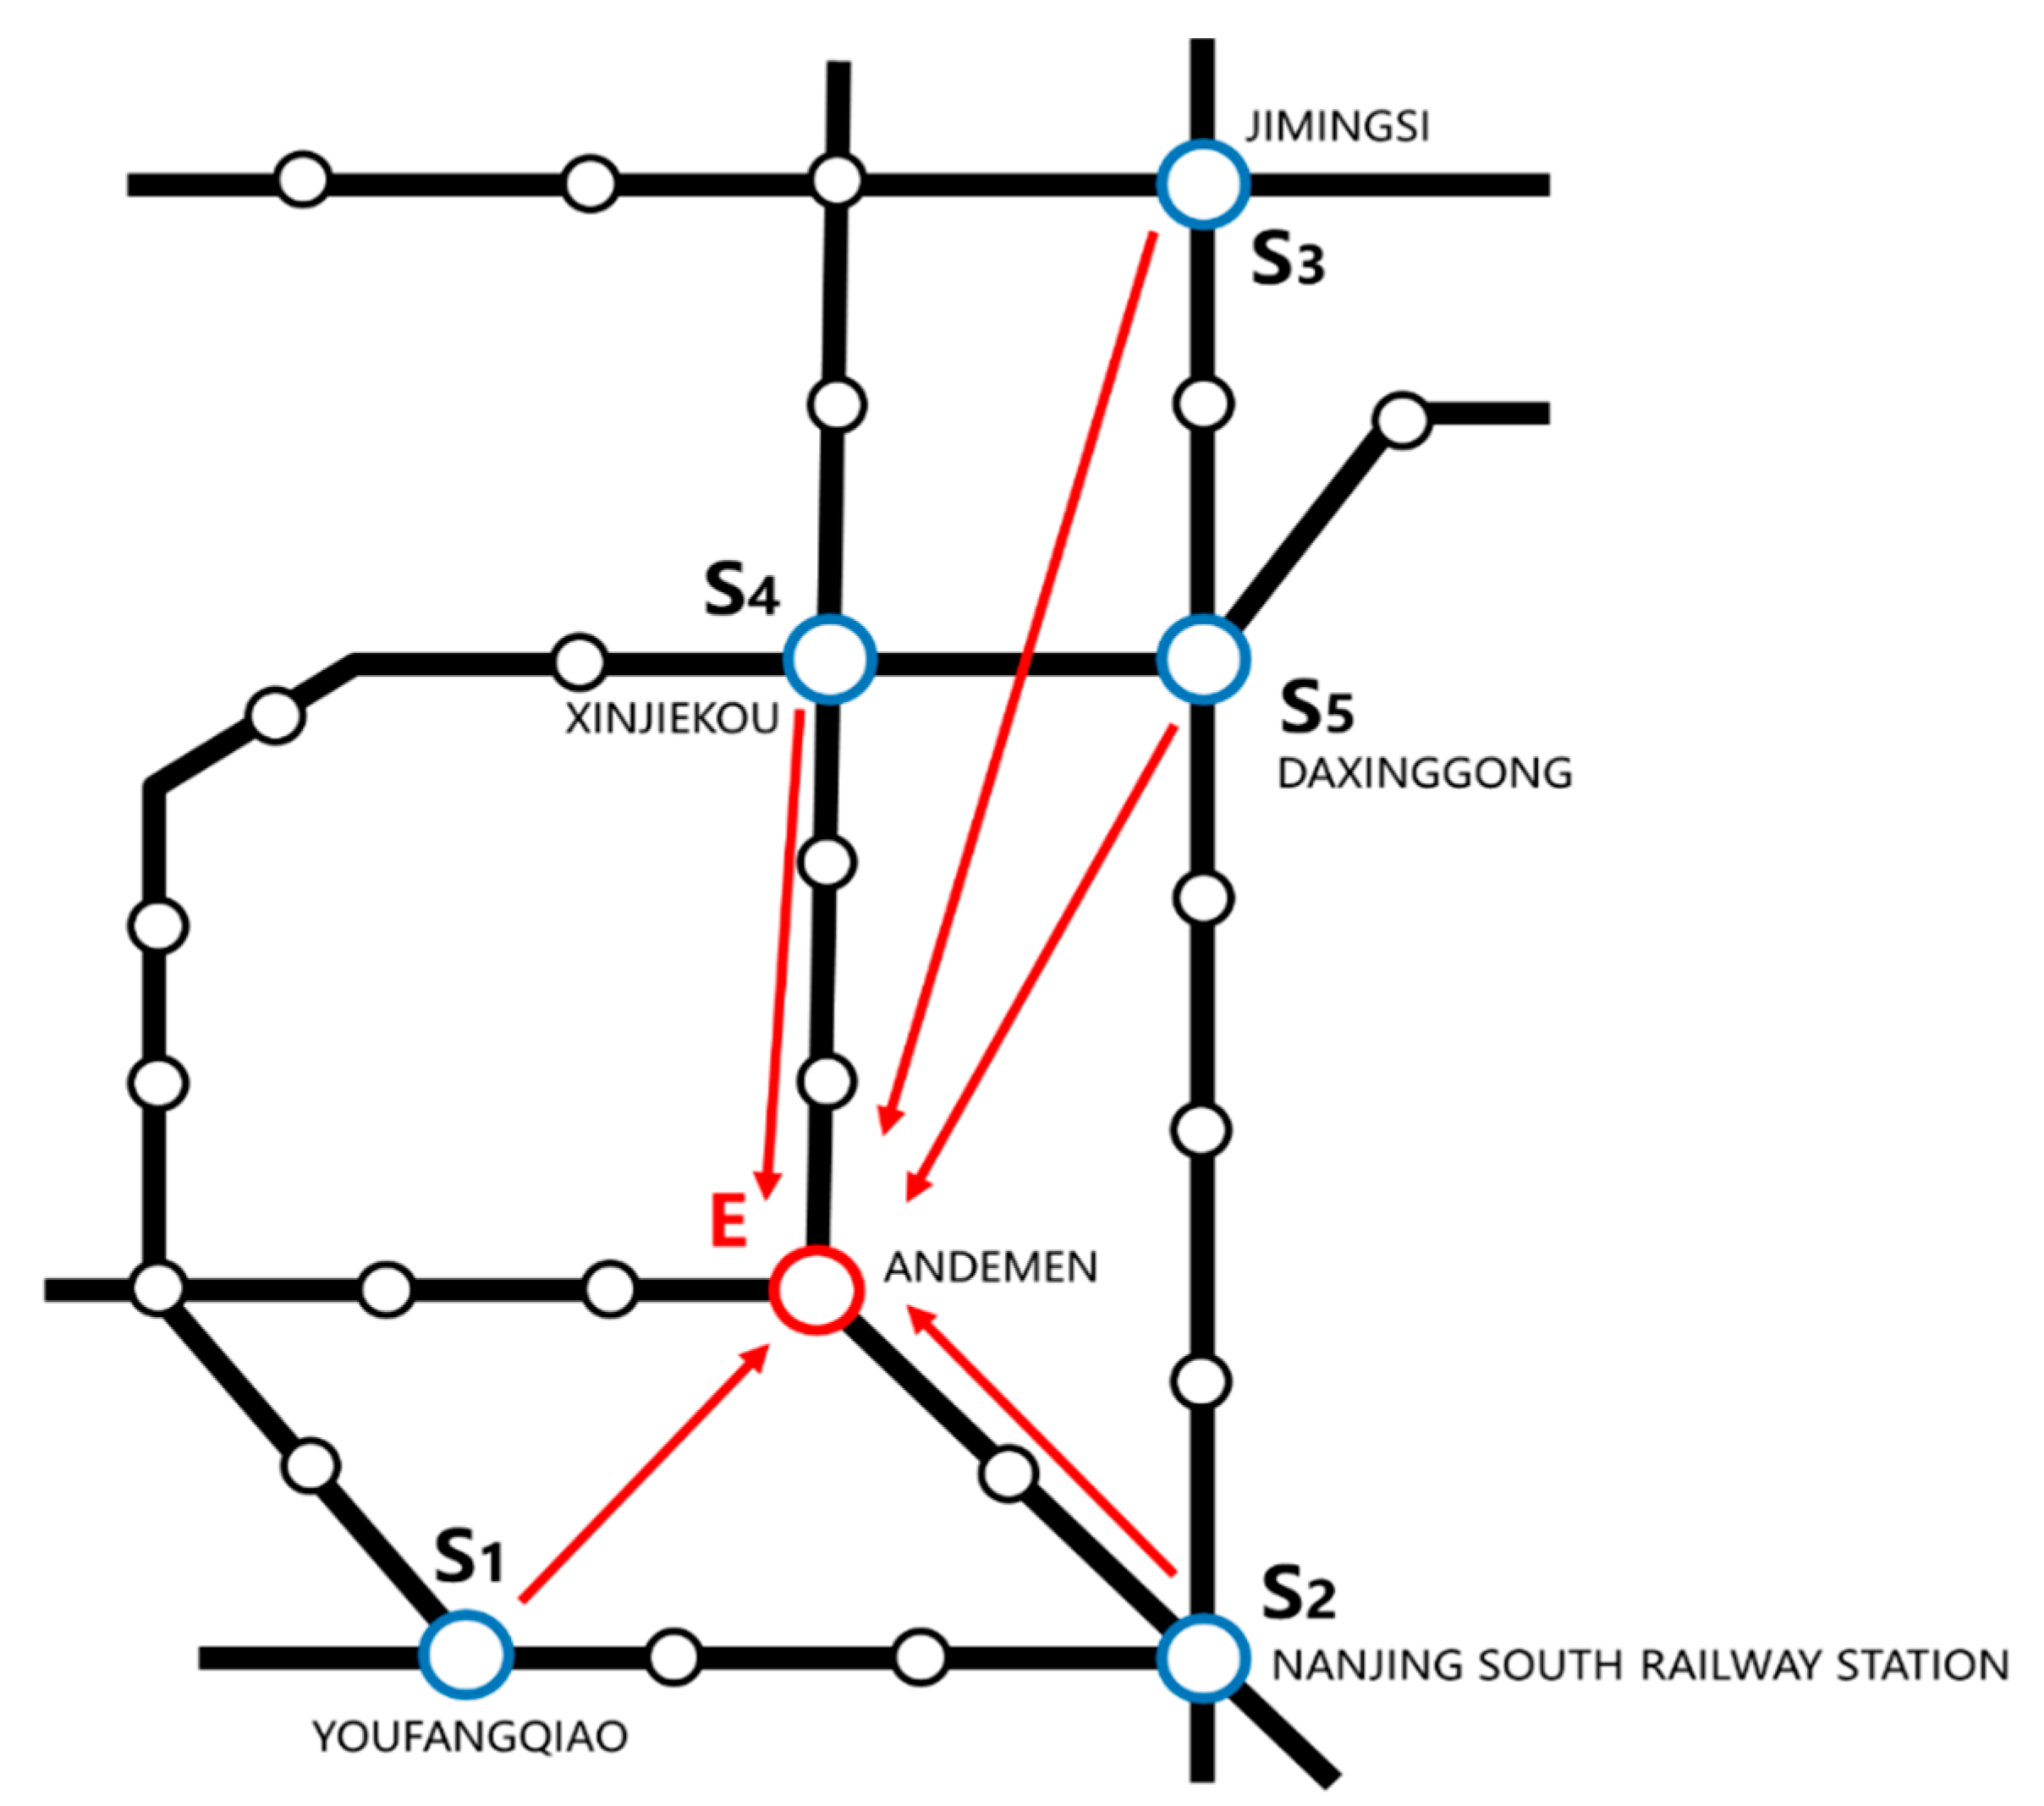
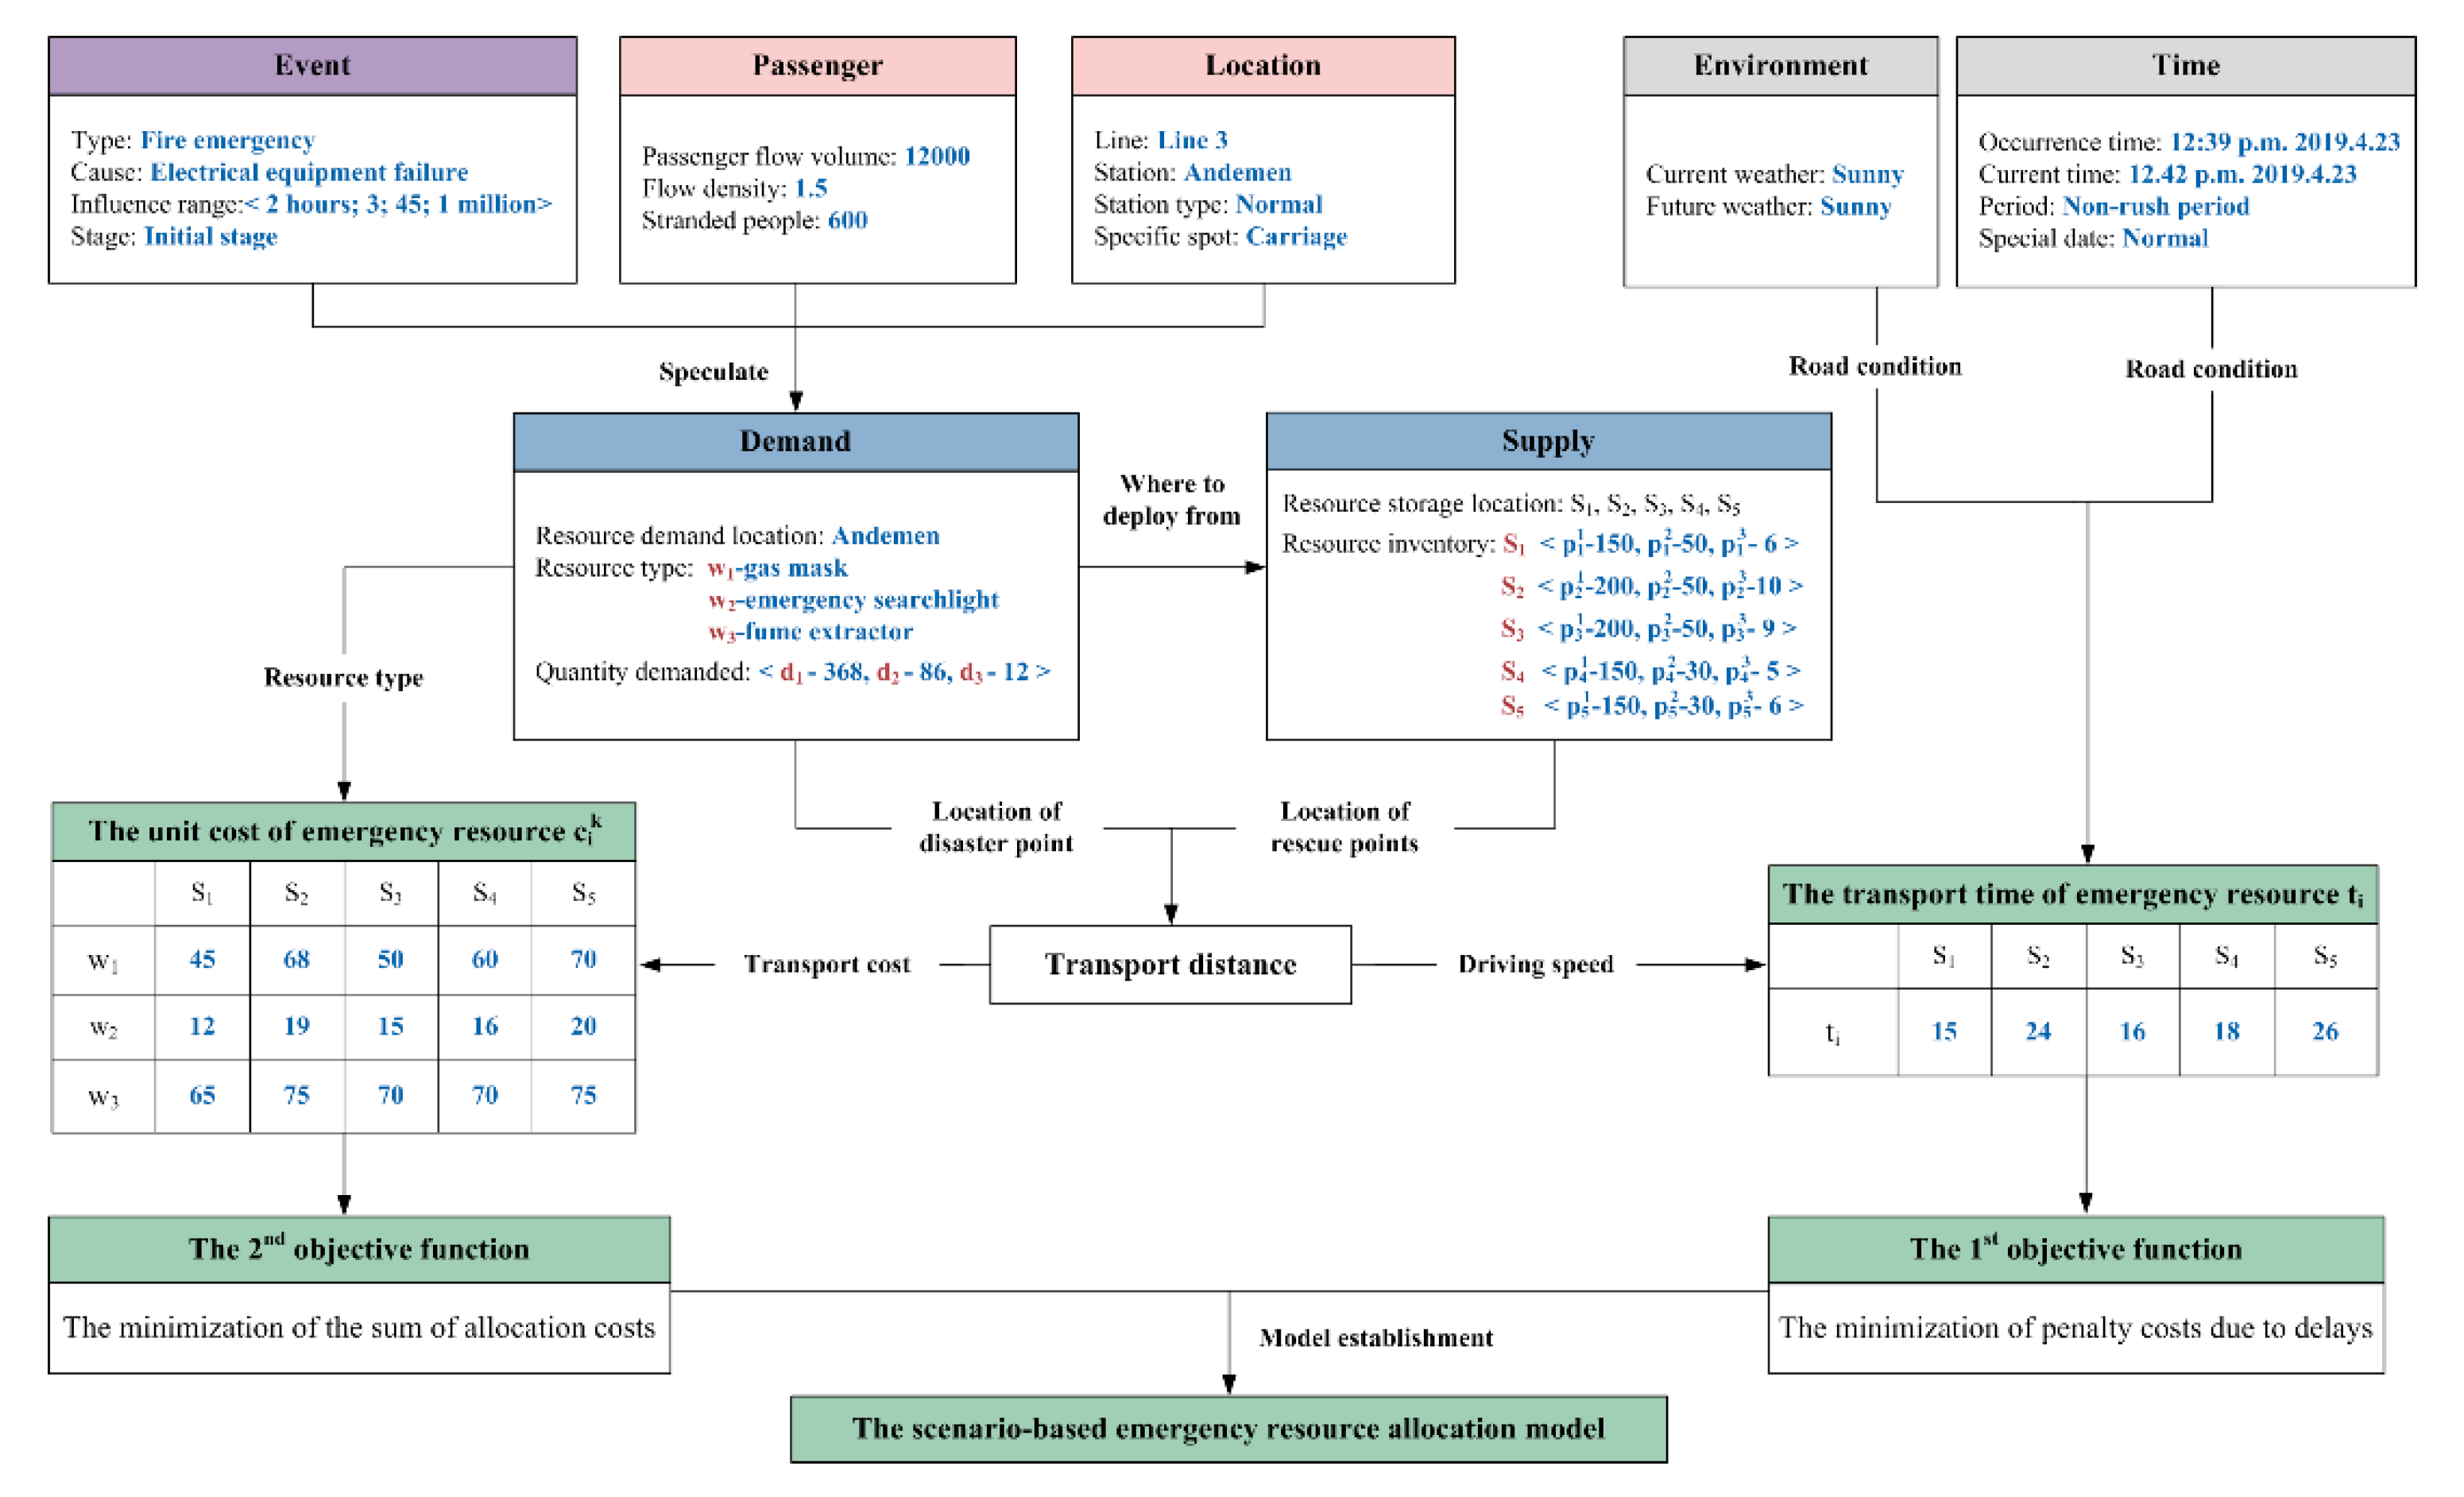
5.1. Scenario Description
5.2. Computational Results
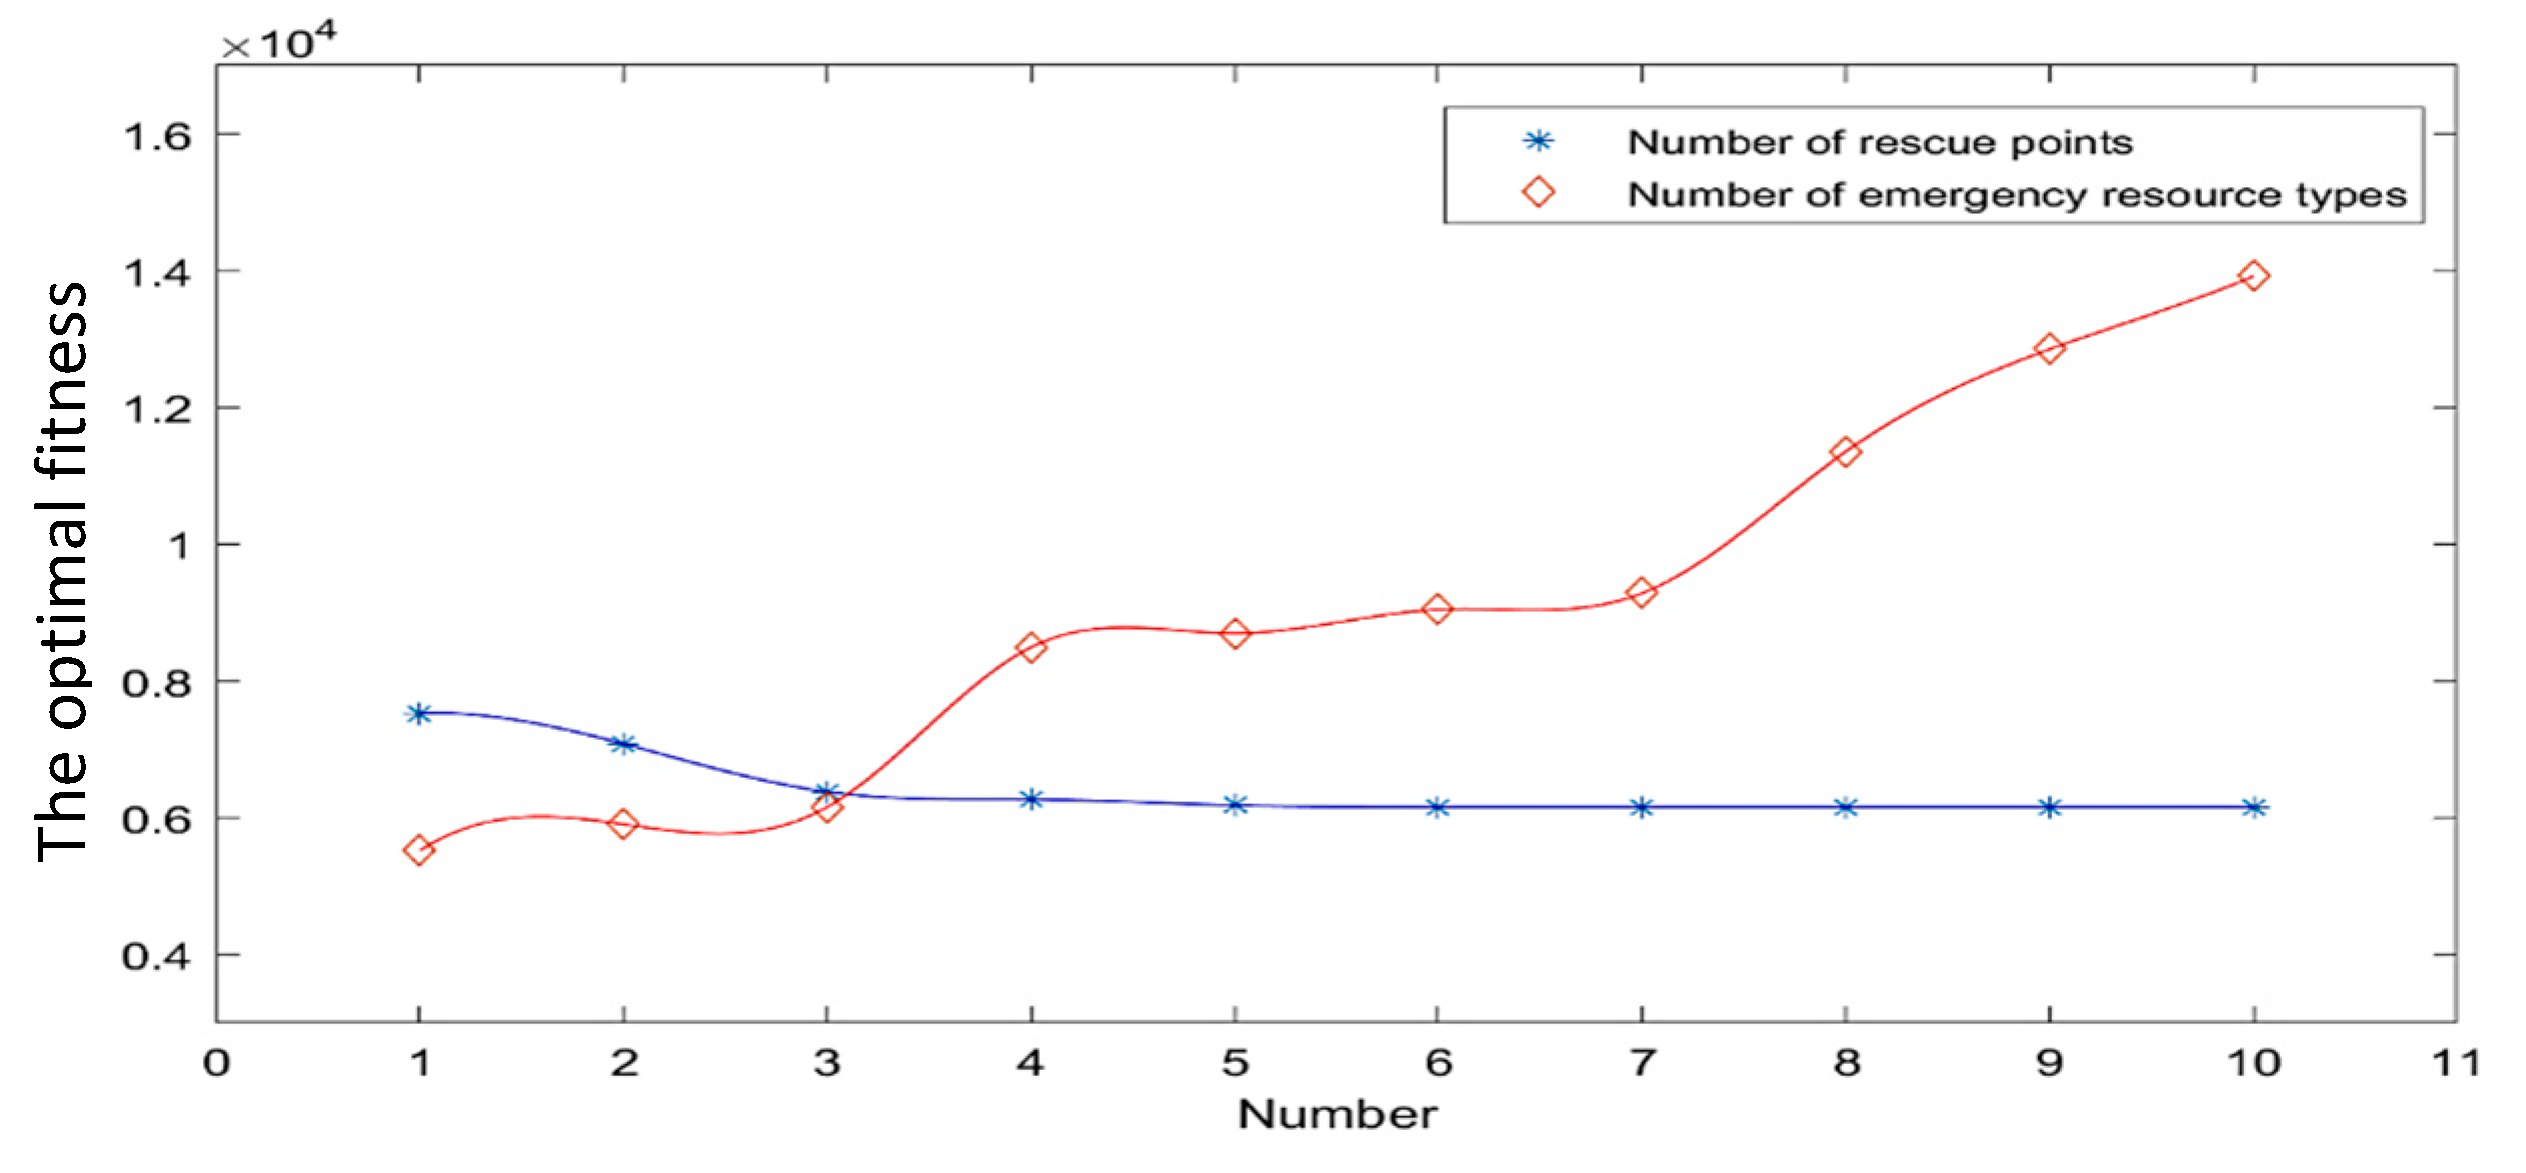
5.3. Sensitivity Analysis
6. Discussion
7. Conclusions
Author Contributions
Funding
Acknowledgments
Conflicts of Interest
References
- Deng, Y.; Song, L.; Zhou, J.; Wang, J. Evaluation and reduction of vulnerability of subway equipment: An integrated framework. Saf. Sci. 2018, 103, 172–182. [Google Scholar] [CrossRef]
- An Analysis Report on the Development Prospect and Investment Strategy Planning of Chinese Metro Industry. Available online: https://bg.qianzhan.com/report/detail/459/190410-1b0fb515.html. (accessed on 24 January 2020).
- Ding, X.; Yang, X.; Hu, H.; Liu, Z. The safety management of urban rail transit based on operation fault log. Saf. Sci. 2017, 94, 10–16. [Google Scholar] [CrossRef]
- Minciardi, R.; Sacile, R.; Trasforini, E. Resource Allocation in Integrated Preoperational and Operational Management of Natural Hazards. Risk Anal. 2009, 29, 62–75. [Google Scholar] [CrossRef]
- The Contingency Plan for Urban Rail Transit Operation Emergencies. Available online: http://www.gov.cn/zhengce/content/2015-05/14/content_9751.htm (accessed on 14 May 2015).
- Li, Q.; Deng, Y.; Liu, C.; Zeng, Q.; Lu, Y. Modeling and analysis of subway fire emergency response: An empirical study. Saf. Sci. 2016, 84, 171–180. [Google Scholar] [CrossRef]
- Mendonca, D.; Beroggi, G.E.; Wallace, W.A. Decision support for improvisation during emergency response operations. Int. J. Emerg. Manag. 2001, 1, 30. [Google Scholar] [CrossRef]
- Rennemo, S.J.; Rø, K.F.; Hvattum, L.M.; Tirado, G. A three-stage stochastic facility routing model for disaster response planning. Transp. Res. Part E Logist. Transp. Rev. 2014, 62, 116–135. [Google Scholar] [CrossRef]
- Caunhye, A.M.; Nie, X.; Pokharel, S. Optimization models in emergency logistics: A literature review. Socio-Econ. Plan. Sci. 2012, 46, 4–13. [Google Scholar] [CrossRef]
- Beijing Subway Fire Emergency Response Drill. Available online: https://m.sohu.com/a/122353876_420076/?pvid=000115_3w_a (accessed on 23 December 2016).
- Yan, W.-Y.; Wang, J.-H.; Jiang, J.-C. Subway Fire Cause Analysis Model Based on System Dynamics: A Preliminary Model Framework. Procedia Eng. 2016, 135, 431–438. [Google Scholar] [CrossRef]
- Hui, Z.; Yi, L. Key problems on fundamental science and technology integration in “scenario-response” based national emergency response platform system. Syst. Eng. theory Pract. 2012, 32, 947–953. [Google Scholar]
- Qilin, S. Study on scenario evolvement and alternative generation of “scenario-response” decision-making in unconventional emergencies. J. Univ. Sci. Technol. China. 2012, 11. [Google Scholar]
- Liu, L.; Xu, H.; Li, S.M. A review of the situation and scenario-response theory in emergency management of unconventional emergencies. J. Univ. Electron. Sci. Technol. China 2013, 6, 20–26. [Google Scholar] [CrossRef]
- Liu, H.; Chen, H.; Hong, R.; Liu, H.; You, W. Mapping knowledge structure and research trends of emergency evacuation studies. Saf. Sci. 2020, 121, 348–361. [Google Scholar] [CrossRef]
- Hong, L.; Gao, J.; Zhu, W. Self-evacuation modelling and simulation of passengers in metro stations. Saf. Sci. 2018, 110, 127–133. [Google Scholar] [CrossRef]
- Tsukahara, M.; Koshiba, Y.; Ohtani, H. Effectiveness of downward evacuation in a large-scale subway fire using Fire Dynamics Simulator. Tunn. Undergr. Space Technol. 2011, 26, 573–581. [Google Scholar] [CrossRef]
- Hong, L.; Gao, J.; Zhu, W. Simulating emergency evacuation at metro stations: An approach based on thorough psychological analysis. Transp. Lett. 2016, 8, 113–120. [Google Scholar] [CrossRef]
- Jiang, C.; Yuan, F.; Chow, W.K. Effect of varying two key parameters in simulating evacuation for subway stations in China. Saf. Sci. 2010, 48, 445–451. [Google Scholar] [CrossRef]
- Wang, C.; Song, Y. Fire Evacuation in Metro Stations: Modeling Research on the Effects of Two Key Parameters. Sustainability 2020, 12, 684. [Google Scholar] [CrossRef]
- Zhao, M.; Liu, X. Development of decision support tool for optimizing urban emergency rescue facility locations to improve humanitarian logistics management. Saf. Sci. 2018, 102, 110–117. [Google Scholar] [CrossRef]
- Deng, Y.L.; Li, Q.M.; Lu, Y.; Song, L.L. Analysis of Site Selection for Metro Emergency Stations in Network Operation. Adv. Transp. Stud. 2013, 32. [Google Scholar]
- Zhu, J.M. Methods of multi-objective decision-making for emergency facility location problem under failure scenario. Syst. Eng. Theor. Pract. 2015, 35, 720–727. [Google Scholar]
- Zhao, J.; Zhong, S.; Wu, Y.; Yan, X.; Tang, J. Metformin use and survival of lung cancer patients: Meta-analysis findings. Indian J. Cancer 2017, 54, 63. [Google Scholar] [CrossRef]
- Feng, J.-R.; Gai, W.-M.; Li, J.-Y. Multi-objective optimization of rescue station selection for emergency logistics management. Saf. Sci. 2019, 120, 276–282. [Google Scholar] [CrossRef]
- Kolesár, P.; Walker, W.E. An Algorithm for the Dynamic Relocation of Fire Companies. Oper. Res. 1974, 22, 249–274. [Google Scholar] [CrossRef]
- Barbarosoğlu, G.; Arda, Y.; Barbaroso, Y.A.G. A two-stage stochastic programming framework for transportation planning in disaster response. J. Oper. Res. Soc. 2004, 55, 43–53. [Google Scholar] [CrossRef]
- Horner, M.W.; Downs, J.A. Optimizing hurricane disaster relief goods distribution: Model development and application with respect to planning strategies. Disasters 2010, 34, 821–844. [Google Scholar] [CrossRef] [PubMed]
- Tzeng, G.-H.; Cheng, H.-J.; Huang, T.D. Multi-objective optimal planning for designing relief delivery systems. Transp. Res. Part E Logist. Transp. Rev. 2007, 43, 673–686. [Google Scholar] [CrossRef]
- Ni, W.; Shu, J.; Song, M. Location and Emergency Inventory Pre-Positioning for Disaster Response Operations: Min-Max Robust Model and a Case Study of Yushu Earthquake. Prod. Oper. Manag. 2017, 27, 160–183. [Google Scholar] [CrossRef]
- Yin, H. Study on the Optimal Dispatching of Emergency Resources in Dangerous Goods Accidents Under Uncertain Conditions. Master’s Thesis, South China University of technology, Guangdong, China, 2013. [Google Scholar]
- Zheng, Y.; Mu, R.; Lin, J.; Cheng, L. Research of dynamic multi-stage scheduling decision model and algorithm for railway emergency resources. Comput. Eng. Appl. 2015, 51, 213–219. [Google Scholar]
- Sun, C.H. Study on the Configuration Optimization Method of Subway Emergency Resources Based on Network. Master’s Thesis, Beijing Jiaotong University, Beijing, China, 2010. [Google Scholar]
- Liu, X. Research on the Allocation of Relief Supplies for Subway Emergencies. Master’s Thesis, Lanzhou Jiaotong University, Lanzhou, China, 2015. [Google Scholar]
- Modi, J.; Jung, H.; Tambe, M.; Shen, W.-M.; Kulkarni, S. Dynamic Distributed Resource Allocation: A Distributed Constraint Satisfaction Approach. Comput. Vis. 2002, 2333, 264–276. [Google Scholar] [CrossRef]
- Konak, A.; Coit, D.W.; Smith, A.E. Multi-objective optimization using genetic algorithms: A tutorial. Reliab. Eng. Syst. Saf. 2006, 91, 992–1007. [Google Scholar] [CrossRef]
- Suleyman, A.W. The emerging area of emergency management and engineering. IEEE Trans. Eng. Manag. 1998, 45, 103–105. [Google Scholar]
- Pan, Y.; Yu, J.; Da, Q.L. Emergency resources scheduling on continuous consumption system based on particle swarm optimization. J. Syst. Eng. 2007, 22, 556–560. [Google Scholar] [CrossRef]
- Mete, H.O.; Zabinsky, Z.B. Stochastic optimization of medical supply location and distribution in disaster management. Int. J. Prod. Econ. 2010, 126, 76–84. [Google Scholar] [CrossRef]
- Paul, J.A.; Zhang, M. Supply location and transportation planning for hurricanes: A two-stage stochastic programming framework. Eur. J. Oper. Res. 2019, 274, 108–125. [Google Scholar] [CrossRef]
- Wang, S.S.; Wang, Y. Emergency Resources Allocation among Multiple Disaster Places under Fair Priority Principle. Oper. Res. Manag. Sci. 2008, 3, 16–21. [Google Scholar]
- Huang, K.; Jiang, Y.; Yuan, Y.; Zhao, L. Modeling multiple humanitarian objectives in emergency response to large-scale disasters. Transp. Res. Part E Logist. Transp. Rev. 2015, 75, 1–17. [Google Scholar] [CrossRef]
- Lou, W. The theory of scenario analysis. Future Dev. 2012, 9, 17–26. [Google Scholar]
- Chang, M.-S.; Tseng, Y.-L.; Chen, J.-W. A scenario planning approach for the flood emergency logistics preparation problem under uncertainty. Transp. Res. Part E Logist. Transp. Rev. 2007, 43, 737–754. [Google Scholar] [CrossRef]
- Rawls, C.G.; Turnquist, M.A. Pre-positioning of emergency supplies for disaster response. Transp. Res. Part B Methodol. 2010, 44, 521–534. [Google Scholar] [CrossRef]
- Zhang, J.L.; Li, R.; Liu, X.T. Analysis of emergency treatment process based on fire scenario of subway tunnel. Trans. Enterp. Manag. 2016, 31, 65–67. [Google Scholar] [CrossRef]
- Liu, T.M. Studies on scenes construction of emergency planning. J. Saf. Sci Technol. 2012, 8, 5–12. [Google Scholar]
- Lu, Y.; Li, Q.; Xiao, W. Case-based reasoning for automated safety risk analysis on subway operation: Case representation and retrieval. Saf. Sci. 2013, 57, 75–81. [Google Scholar] [CrossRef]
- Wang, S.L. Study on Pedestrian Emergency Evacuation Behavior and Simulation of Subway Station. Master’s Thesis, Zhengzhou University, Henan, China, 2019. [Google Scholar]
- National Development and Reform Commission. The Catalogue of Key Emergency Support Resources; NDRC: Beijing, China, 2015. [Google Scholar]
- Fan, W.C.; Liu, Y.; Wen., W.G. Triangular Framework and "4+1" Methodology for Public Security Science and Technology. Sci. Technol. Rev. 2009, 6, 3. [Google Scholar]
- Wu, Q.; Tan, W.; Gai, W.W. Study on scenario analysis of civil aviation emergency based on dynamic Bayesian network. J. Saf. Sci. Technol. 2016, 3, 169–174. [Google Scholar]
- Han, C.F.; Wang, X.G.; Kong, J.J. Dynamic Mechanism of Unconventional Emergency Decision-making System. Soft. Sci. 2009, 8, 50–53. [Google Scholar]
- Paragios, N.; Ramesh, V. A MRF-based approach for real-time subway monitoring. IEEE Computer Society Conference on Computer. Vis. Pattern Recognit. 2001, 1, 1034–1040. [Google Scholar]
- Shao, D.Q.; Liu, T.; Wang, W.N.; Li, Z.Z. Construction of Traffic Accident Scenes Model Based on the Theory of Regional Disaster System. Geomat. Spat. Infor. Technol. 2018, 41, 34–38. [Google Scholar]
- Yuan, Y.; Shao, C.; Cao, Z.; Chen, W.; Yin, A.; Yue, H.; Xie, B. Urban Rail Transit Passenger Flow Forecasting Method Based on the Coupling of Artificial Fish Swarm and Improved Particle Swarm Optimization Algorithms. Sustainability 2019, 11, 7230. [Google Scholar] [CrossRef]
- Lu, J.; Ma, X.; Xing, Y. Risk factors affecting the severity of disruptions in metro operation in Shanghai, 2013–2016. J. Transp. Saf. Secur. 2019, 1–24. [Google Scholar] [CrossRef]
- Zarboutis, N.; Marmaras, N. Searching efficient plans for emergency rescue through simulation: The case of a metro fire. Cogn. Technol. Work. 2004, 6, 117–126. [Google Scholar] [CrossRef]
- Yu, J.; Ji, Y.; Gao, L.; Gao, Q. Optimization of Metro Passenger Organizing of Alighting and Boarding Processes: Simulated Evidence from the Metro Station in Nanjing, China. Sustainability 2019, 11, 3682. [Google Scholar] [CrossRef]
- Liu, M.; Zhao, L.D. An integrated and dynamic optimization model for the multi-level emergency logistics network in anti-bioterrorism system. Int. J. Sys. Sci. 2011, 9, 1–15. [Google Scholar]
- Li, X.J. Analysis on the Safety risk of Subway Operation. J. Eng. Manag. 2017, 31, 83–88. [Google Scholar] [CrossRef]
- Sheng, Y.; Sun, Q.Y.; Wang, Y.M. Emergency scenario evolution and extraction method of key elements. J. Saf. Sci. Technol. 2015, 11, 17–21. [Google Scholar]
- Diab, E.; Shalaby, A. Metro transit system resilience: Understanding the impacts of outdoor tracks and weather conditions on metro system interruptions. Int. J. Sustain. Transp. 2019, 1–14. [Google Scholar] [CrossRef]
- Gu, Y. Research on Storage and Dispatch of Regional Emergency Resources for the Significant Emergent Events. Doctor’s Thesis, Wuhan University of Technology, Wuhan, China, 2009. [Google Scholar]
- Sun, M.; Pan, Y. Multi-resource emergency scheduling based on complex networks. Oper. Res. Manag. Sci. 2009, 6, 164–169. [Google Scholar]
- Yu, Y.Y.; Chi, H.; Qi, M.L.; Pan, B.C. Modeling and algorithm of resource layout evaluation and adjustment in emergency management. Sys. Eng. 2008, 1, 75–80. [Google Scholar]
- Yuan, Y.; Wang, D.F. Route selection model in emergency evacuation under real time effect of disaster extension. J. Syst. Simul. 2008, 20, 1563–1566. [Google Scholar] [CrossRef]
- Xu, B.K. An improved weighted summation algorithm for solving multi objective optimization problems. Master’s Thesis, Xi’an University of Electronic Science and Technology, Xi’an, China, 2010. [Google Scholar]
- Kennedy, J.; Eberhart, R.C.; Shi, Y. Swarm Intelligence; Elsevier: Amsterdam, The Netherlands, 2001. [Google Scholar]
- Dominguez, M.; Fernandez-Cardador, A.; Cucala, A.; Gonsalves, T.; Fernández-Rodríguez, A. Multi objective particle swarm optimization algorithm for the design of efficient ATO speed profiles in metro lines. Eng. Appl. Artif. Intell. 2014, 29, 43–53. [Google Scholar] [CrossRef]
- Gao, H.B. Research on Particle Swarm Optimization and its Several Applications in Engineering. Master’s Thesis, Huazhong University of Science and Technology, Wuhan, China, 2004. [Google Scholar]
- Hu, X.; Shi, Y.; Eberhart, R. Recent advances in particle swarm. Proceedings of the 2004 Congress on Evolutionary Computation. Evol. Comput. 2004, 90–97. [Google Scholar] [CrossRef]
- Liu, D. Research on Particles Swarm Optimization and Its Engineering Application. Doctor’s Thesis, Southwest Jiaotong University, Chengdu, China, 2013. [Google Scholar]
- Li, T.G. Particle Swarm Optimization Based on Deb’s Feasibility Rule for Optimal Design of Hydraulic Cylinder. Hydraul. Pneum. 2015, 7, 55–59. [Google Scholar]
- Li, M.L.; Dai, C.J.; Liu, C.S. Adaptive Particle Swarm Optimization for Bilevel Programming Problem. Infor. Technol. Infor. 2014, 1, 94–96. [Google Scholar]
- Al Moubayed, N.; Petrovski, A.; McCall, J. D 2 MOPSO: MOPSO Based on Decomposition and Dominance with Archiving Using Crowding Distance in Objective and Solution Spaces. Evol. Comput. 2014, 22, 47–77. [Google Scholar] [CrossRef] [PubMed]


| Metro Emergency Types | Site Management and Support Resources | Life Rescue Resources | Engineering Rescue and Professional Disposal Resources |
|---|---|---|---|
| Natural disasters | Meteorological monitoring equipment, aftershock monitoring equipment, emergency searchlight, gunny bag, cordon, intercom, fluorescent indicator rod. | Ventilator, life detector, stretcher, guide rope, first-aid kit, safety helmet, bandage, raincoat, life jacket, toothless saw, chain saw, glare flashlight, lifeboat. | Electric equipment inspection car, emergency pump, high-power drainage equipment, emergency tool kit. |
| Production safety emergencies | Cordon, fume extractor, intercom, poisonous gas detector, emergency searchlight, emergency evacuation sign, bus, infrared detector, fire engine. | Fireproof suit, fireproof gloves, emergency medicine, stretcher, wet towel, gas mask, oxygen ventilator, oxygen bomb. | Hydraulic lifting equipment, cable tester, screw support frame, gear box oil, air compressor filter core, spare cable conductor, emergency tool kit. |
| Social security emergencies | Emergency searchlight, cordon, emergency evacuation sign, intercom, poisonous gas detector, fume extractor, sprinkler system, explosive detector. | Protective glasses, oxygen ventilator, fireproof suit, fireproof gloves, anti-erode gloves, gas mask, first-aid kit, first-aid equipment, safety helmet. | Blast pipe, emergency tool kit. |
| Public health emergencies | Microbiological detector, disinfectant, interphone, loudspeaker. | Vaccine, oxygen ventilator, medical protective mask, forehead temperature gun, defibrillation pacemaker. | Epidemic prevention vehicle. |
| Scenario Elements | Literature Sources | |
|---|---|---|
| Event | Emergency type | [54] |
| Event cause | [54] | |
| Influence range | [55] | |
| Event stage | [55] | |
| Passenger | Passenger flow volume | [16,56] |
| Passenger flow density | [16,56] | |
| Number of stranded people | [16,56] | |
| Time | The occurrence time | [57] |
| Current time | [57] | |
| Passenger flow period | [56] | |
| Special date | [57] | |
| Location | Line | [58] |
| Station | [6] | |
| Station type | [59] | |
| Specific spot | [58] | |
| Environment | Weather | [60,61] |
| Demand | Resource demand location | [33,34,62] |
| Resource type | [33,34,62] | |
| Demanded resource quantity | [33,34,62] | |
| Supply | Resource storage location | [52,62] |
| Resource inventory quantity | [52,62] | |
| Notation | Description |
|---|---|
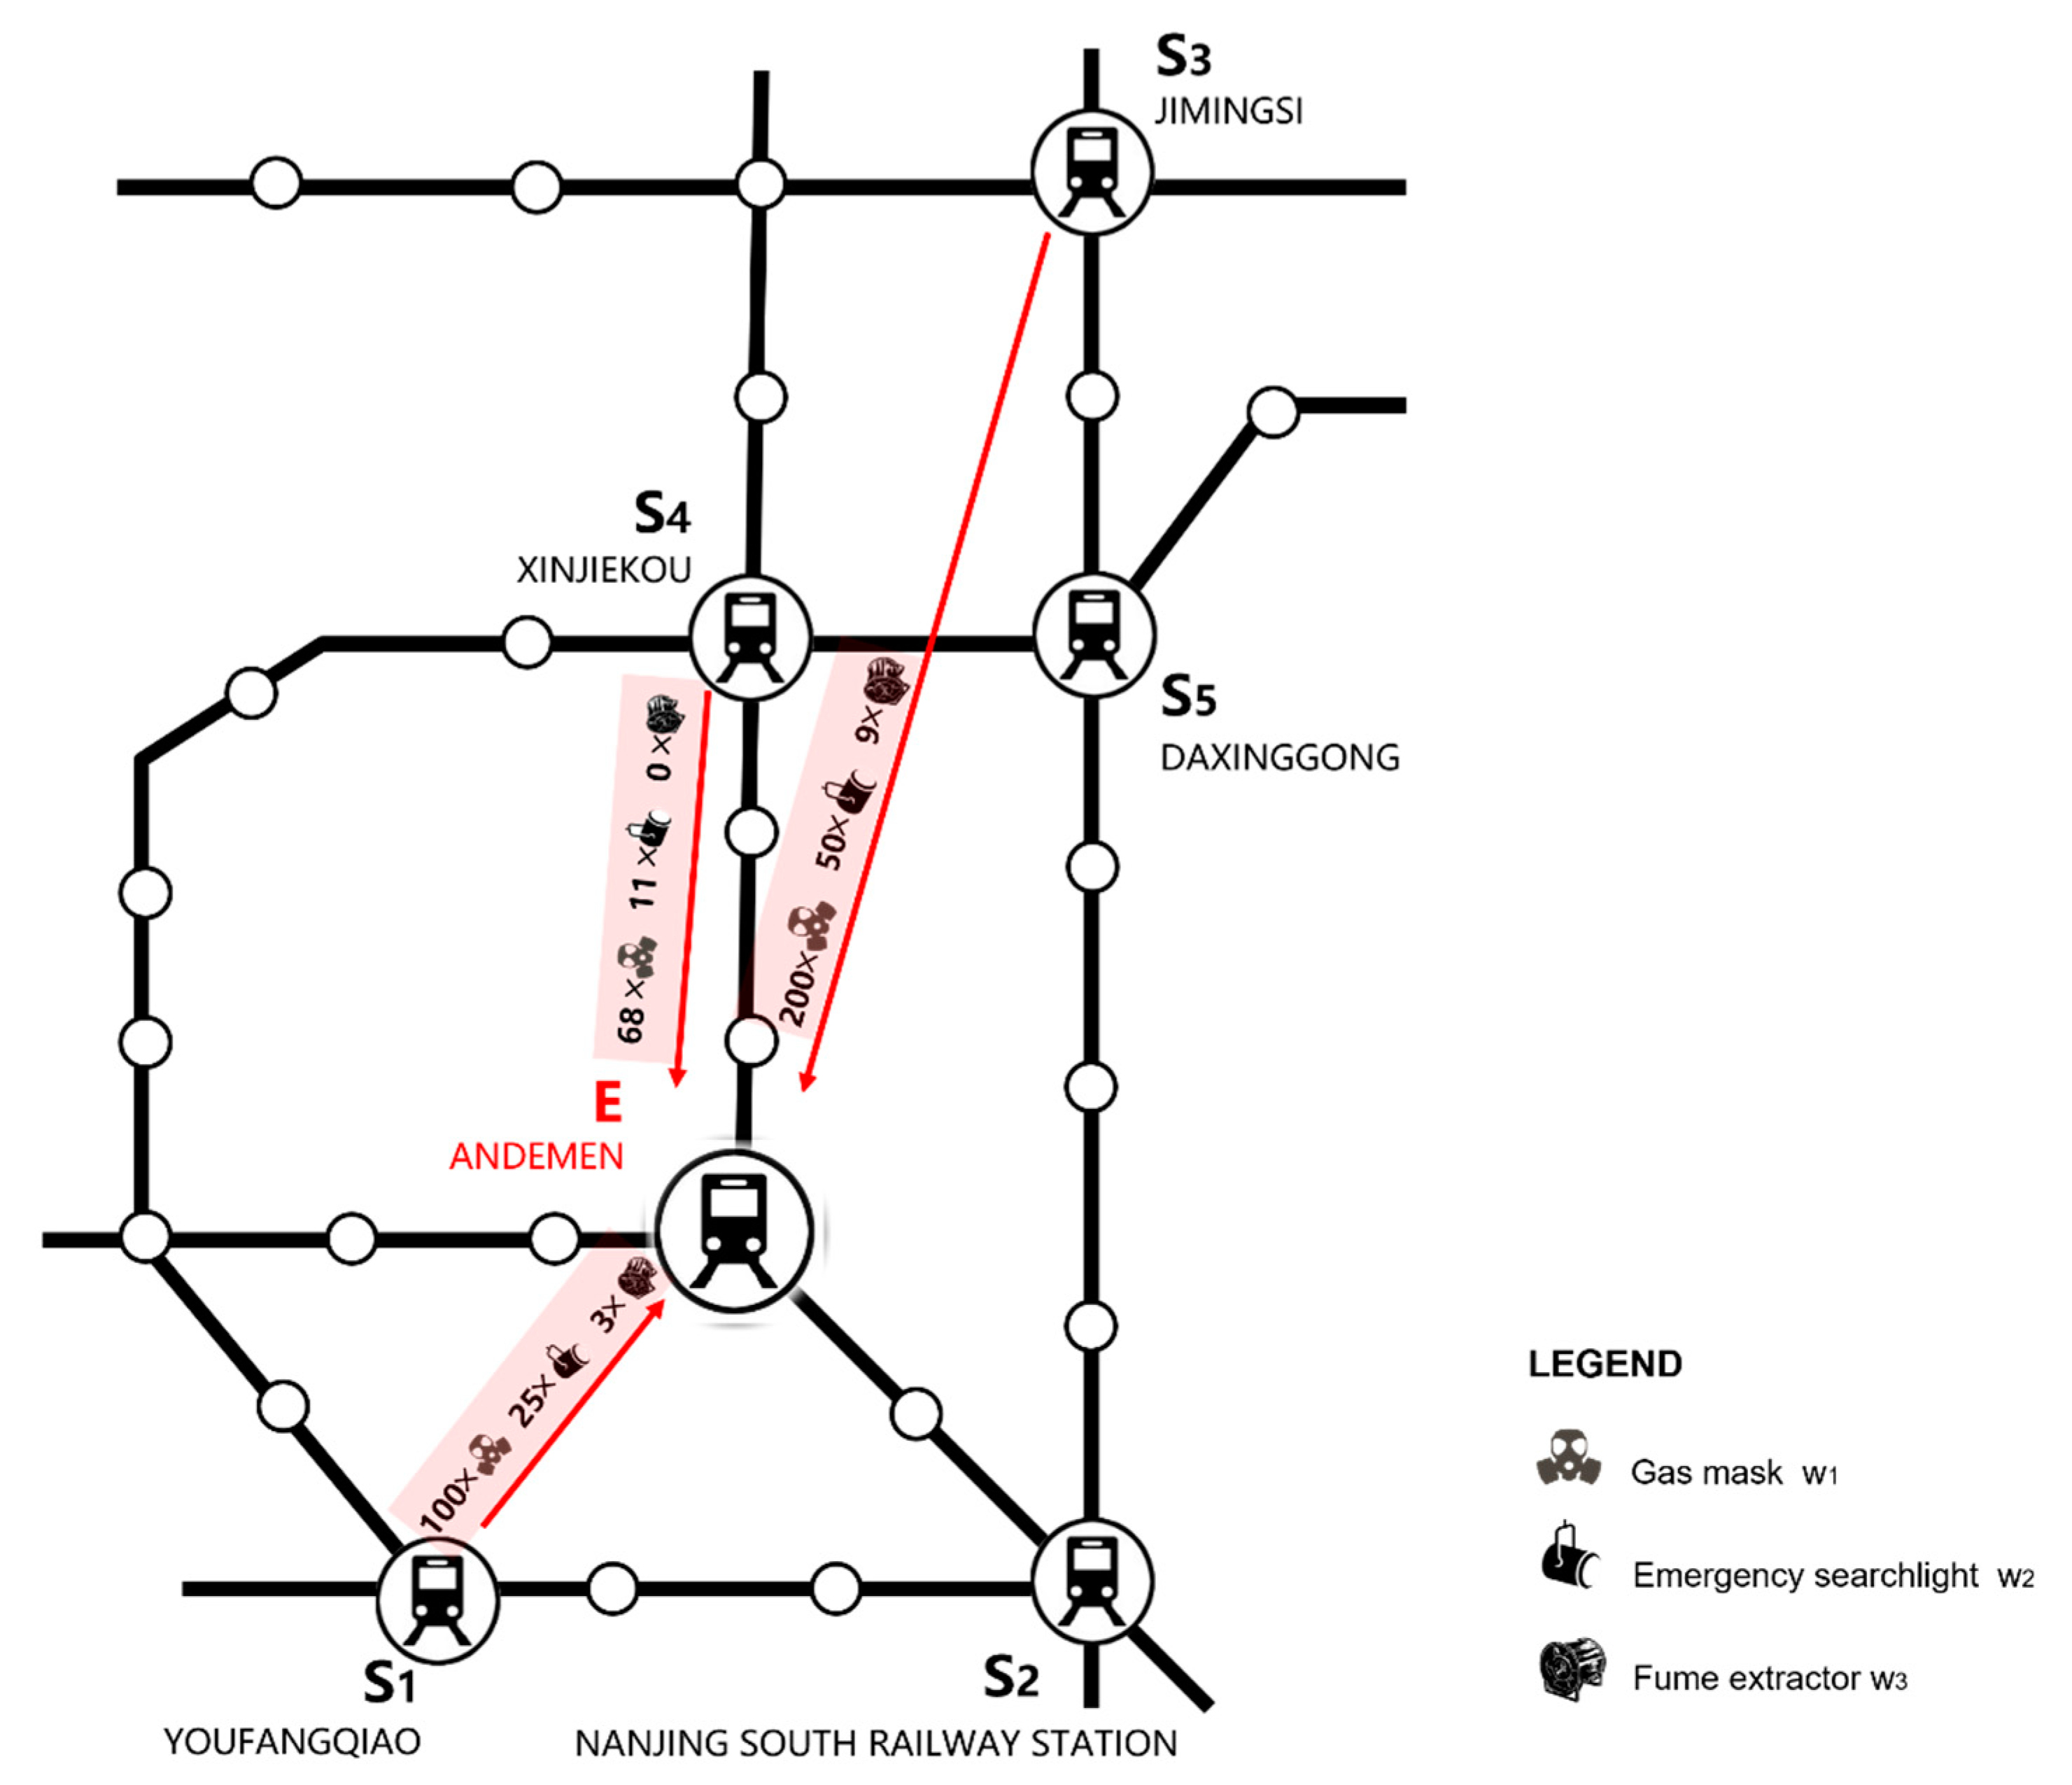
| S1, S2, … Sn | Rescue points. |
| E | Disaster point. |
| w | The number of emergency resource types. |
| Decision variable which represents the number of type k resources allocated from rescue point Si to disaster point E. | |
| The type k emergency resource inventory owned by rescue point Si. | |
| The unit cost of type k emergency resource allocated from rescue point Si, including use cost and deployment cost. | |
| Type k emergency resource demanded by disaster point E. | |
| Emergency resource transport time from rescue point Si to disaster point E. | |
| T | Maximum time spent in delivering resource from an emergency rescue point to a disaster point, as set forth in the contingency plan of the metro management department. |
It is used to measure whether the transport time from rescue point Si and disaster point E has exceeded the maximal limit time. | |
| , [64] It is the penalty cost coefficient of losses caused by the delay of emergency resources per unit of time and quantity, which is calculated according to different delay time. In order to facilitate calculation, it is assumed that the coefficients of various resources are the same in the same time interval. Usually, the coefficient increases sharply when the delay time is close to the bearing limit of the disaster point. |
| Parameters | Value |
|---|---|
| Initial population size N | 200 |
| Search space dimensions D | 15 |
| Maximum number of iterations Tmax | 1000 |
| Maximum position coordinate value xmax | 250 |
| Maximum velocity Vmax | 10 |
| Upper bound of inertia weight δmax | 0.9 |
| Lower bound of inertia weight δmin | 0.4 |
| Self-cognition coefficient c1 | 1.424 |
| Group-cognition coefficient c2 | 1.424 |
| Rescue Point | S1 | S2 | S3 | S4 | S5 |
|---|---|---|---|---|---|
| w1 | 100 | 0 | 200 | 68 | 0 |
| w2 | 25 | 0 | 50 | 11 | 0 |
| w3 | 3 | 0 | 9 | 0 | 0 |
© 2020 by the authors. Licensee MDPI, Basel, Switzerland. This article is an open access article distributed under the terms and conditions of the Creative Commons Attribution (CC BY) license (http://creativecommons.org/licenses/by/4.0/).
Share and Cite
Lu, Y.; Sun, S. Scenario-Based Allocation of Emergency Resources in Metro Emergencies: A Model Development and a Case Study of Nanjing Metro. Sustainability 2020, 12, 6380. https://doi.org/10.3390/su12166380
Lu Y, Sun S. Scenario-Based Allocation of Emergency Resources in Metro Emergencies: A Model Development and a Case Study of Nanjing Metro. Sustainability. 2020; 12(16):6380. https://doi.org/10.3390/su12166380
Chicago/Turabian StyleLu, Ying, and Shuqi Sun. 2020. "Scenario-Based Allocation of Emergency Resources in Metro Emergencies: A Model Development and a Case Study of Nanjing Metro" Sustainability 12, no. 16: 6380. https://doi.org/10.3390/su12166380
APA StyleLu, Y., & Sun, S. (2020). Scenario-Based Allocation of Emergency Resources in Metro Emergencies: A Model Development and a Case Study of Nanjing Metro. Sustainability, 12(16), 6380. https://doi.org/10.3390/su12166380