Abstract
Production process sustainability refers to a manufacturing system in which manufacturing industries produce products in a sustainable way. In recent years, sustainability has become a major concern and challenge for manufacturing systems because of growing consciousness of the effects of their activities on the environment, society, and economy. Different organizational reports and the academic literature have proposed indicators of sustainable manufacturing that help to measure product and process sustainability. However, little of the previous research is related to employee-activity based indicators for production process sustainability. To bridge the gap, this study identified a set of indicators of production process sustainability based on direct and indirect impacts of manufacturing activities on employees, who are key resources in the entire production process, for efficiently applying a sustainability perspective. In addition, the paper provides an evaluation model for selecting relatively important indicators based on expert opinions. A fuzzy Delphi method was applied for the screening process of the decision makers (experts). A Delphi questionnaire prepared with a nine-point linguistic scale corresponding to respective linguistic variables was utilized to assess expert opinions on the importance of each indicator. These expert opinions were aggregated for each indicator by using an adopted algorithm that considers the degree of importance allocated to the decision makers, and the similarity and distance among decision maker opinions. Lastly, the key employee-activity based indicators were chosen based on the threshold value set.
1. Introduction
Even though the concept of sustainability is an essential feature of human activities in any organization, including manufacturing industries, it is a complex problem that considers many dimensions as an important component of the issue. In the past, sustainability was described mainly as the quality of sustaining the environment. Gradually, the term has integrated environmental, economic and social dimensions (i.e., the three pillars of sustainability) to improve the quality of life. These pillars are expressed as a triple bottom line, which was developed by John Elkington [1]. Previous studies have commonly considered or assumed these pillars to define manufacturing or production sustainability. The United States Department of Commerce defines manufacturing sustainability as producing products by using processes that reduce negative environmental effects, conserve energy and natural resources, are safe for society (i.e., employees, communities and consumers) and are economically viable [2]. In the same manner, the Lowell Center for Sustainable Production (LCSP) defines it as the manufacturing of products using processes and systems that are non-polluting, conservative of energy and natural resources, economically feasible, safe and healthy for society, and socially and creatively rewarding for all workers [3].
In the current global industrial growth scenario, production processes and product sustainability have received increasing attention [4]. Taking into consideration this opportunity, previous and current authors have been conducting research on identifying sustainability indicators based on their own opinion categories, in addition to the triple bottom line, and ways to measure manufacturing sustainability [4,5,6,7,8,9].
Basing his work on the triple bottom line expression of sustainability dimensions proposed by John Elkington in 1997, McKenzie [1] reminds researchers that it is not possible to achieve a desired level of overall production process sustainability without achieving at least basic levels of all forms of sustainability (i.e., environmental, economic and social) simultaneously. In the last decades, various entities have made great efforts to give management and concerned bodies a stronger foundation on how to achieve overall manufacturing sustainability. However, the identification and quantification of social sustainability indicators, especially an employee-activity based indicator, is far more difficult than those of economic and environmental sustainability. Consequently, it is the most neglected element of triple bottom line reporting [1,5,10,11]. More recently, Ahmad et al. [11] mentioned that developing and using indicators which are reliable for the social and economic dimensions of manufacturing sustainability should be considered as an important future research direction.
Employees are core resources of manufacturing processes, for they influence the processes directly or indirectly while interacting with the production environment. Researchers in human factors and ergonomics give emphasis on human beings and their relations with products, tools, facilities, processes and environments used in the work [12], and they utilize data and methods to design theory and principles to optimize human wellbeing (which is related to the social goal) and system performance (which is related to the economic goal). From their descriptions, both human factors and sustainable development are human centered [13,14]. Therefore, identifying employee-activity based indicators of sustainability by considering the interaction between employees and other elements in the production area could play an important role in attaining a sustainable manufacturing process.
Recently, UN listed 17 sustainable development goals with specific targets to be achieved in the coming 10 years [15]. As in any organizational sectors, these goals inspire manufacturing industries to implement sustainable practices into their daily activities. For example, protecting labor rights and promoting safe and secure working environments for all workers, equal pay for work of equal value, decent job creation, education or training, etc, are among the specific targets of the decent work and economic growth goal; whereas substantially reducing the number of deaths and illnesses from hazardous chemicals, air, water, pollution and contamination is one of the specific targets of good health and wellbeing goal. These targets can be directly or indirectly related to employee social wellbeing. Therefore, identifying and understanding the importance level of employee-activity based sustainability indicators plays an important role regarding manufacturing sustainable practices that would in turn contributes to sustainable development goals.
Most previous studies related to manufacturing sustainability measures have used pre-defined sustainability indicators identified from the literature, to the best knowledge of the authors. These sustainability indicators have been used as criteria or factors for measuring manufacturing sustainability without further decisions on their importance. Latif et al. [4] developed a sustainability index for manufacturing industry using 77 factors in the categories of energy efficiency, waste management and worker health and safety, respectively, which were identified from the literature and chosen for consideration by author. In the same way, Singh et al. [16] considered 22 indicators for evaluating the sustainability of manufacturing industries under economic, environmental and social aspects, respectively. From these, one can understand the necessity of providing a common method for screening the key important sustainability indicators from a list of indicators by using the judgment of a group of experts.
To bridge the gap, the main objective of this study was to develop a framework to identify a list of employee-activity based indicators for production process sustainability in manufacturing and screening the relatively key indicators from the identified list of indicators. This can be achieved through the following specific objectives:
- (1)
- To generate a list of various indicators of production process sustainability from extensive literature review by considering ideas related to employees: working environment, satisfaction, motivation, health and wellbeing, performance, involvement, commitment to the organization, and physiological and psychological needs.
- (2)
- To apply fuzzy Delphi methods that consider the similarities and distances among the opinions of the decision makers to develop agreements on the indicators and determine the key indicators that affect the production process sustainability for further consideration in evaluating the overall process sustainability index.
Understanding and utilizing of the employee-activity based indicators of sustainability in production process will be directly or indirectly beneficial for shareholders, employees, and the country’s sustainable development. With these employee-activity based indicators in a sustained production process:
- (a)
- The overall manufacturing performance will be improved because of ensured social sustainability and improved individual employee performance.
- (b)
- Acceptance of the industry product in the market will be increased because it is expected that in the future, consumers in the modern market will consider the percentage of negative impacts of the production process on the employees and environment during the production process.
- (c)
- The industry will fulfill the legal requirements set by the government regarding safe and satisfactory work and workplace environments for the employee.
The rest of this paper is arranged as follows. An overall theoretical framework that discusses definitions, concepts, analysis of previous work and framework are given in Section 2. In Section 3, the research methodology is introduced. This section is followed by Section 4 in which results and discussion are presented. Finally, conclusion is provided in Section 5.
2. Theoretical Framework
2.1. Production/Manufacturing Process Sustainability
The production process is concerned with transforming raw materials and components into a product by integration of transforming resources (including the building, machinery, computers and employees) (Figure 1). In this process, employees interact with raw materials, the working environment, the process layout, organizational work management, and machinery/equipment. Therefore, it is important to provide employee-activity based indicators to protect the employees.
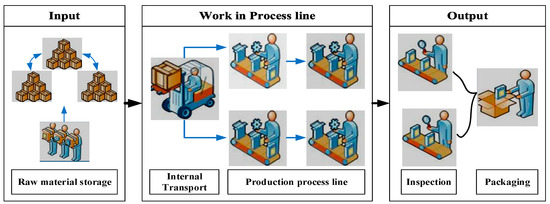
Figure 1.
Production process activities.
The concept of sustainability initially articulated in the Brundlandt Report defines sustainable development as the development that meets the desires of the current generation without negotiating the capacity of next generations to meet their own desires [17]. Sustainability is defined by Garetti and Taisch [18] as a quality that permits the preservation, retention, and maintenance of nature. Most researchers argue that the sustainability of industrial activity is a major concern of the manufacturing sector because of several recognized and emerging causes, such as the reduction of natural resource consumption, strong government and organizational regulations related to the environment and occupational safety and health, and customer interest in products manufactured in sustainable ways.
A manufacturing or production system is of key importance to improving the quality of life of a society, and such systems are the basis of our civilized way of life. However, it also affects the environment and society (employees, customers and community) [19]. The design and development of sustainable production processes aims to find compromises on these conflicting issues. Different authors have defined manufacturing process sustainability as not only requiring the design of processes to reduce harmful environmental effects, conserve energy and natural resources, and protect the safety of employees, communities and consumers, but also requiring that the process be economically sound [18,20].
2.2. Sustainability Pillars/Dimension
From past literature, it is clear that sustainability is a crucial issue to protect our society from the negative environmental impacts generated in every industrial activity and to ensure societal wellbeing, health and satisfaction. Initially, sustainability was described with a single dimension, which mainly focused on the quality of sustaining the environmental aspect. Gradually, this idea was further expanded into three dimensions, including the quality of sustaining economic and societal aspects, which are together commonly expressed as the triple bottom line developed by John Elkington in 1997 [1,18]. For instance, Vinodh [21], Lee et al. [22], Badurdeen et al. [23], Sabaghi et al. [24], and Singh et al. [16] consider environmental, economic and social dimensions in their works related to sustainability assessment. To achieve strong overall production process sustainability, industrial activities should consider proportionally the pillars of sustainability.
The interrelationships of the pillars of sustainability are commonly categorized into either a three-overlapping-circles model, in which the influences of the three dimensions on each other are equally represented, or a three nested dependencies model, in which the social and economic aspects are dependent on the proper control of the environmental aspects. According to Jasiulewicz-Kaczmarek and Saniuk [25], assessment based on the economic dimension is a traditional engineering focus, the environmental dimension is a current engineering focus, and the social dimension is a future engineering focus. In this study, we utilize the three-overlapping-circles model (Figure 2) for the sustainable production process framework even though the main emphasis is on the social indicators.
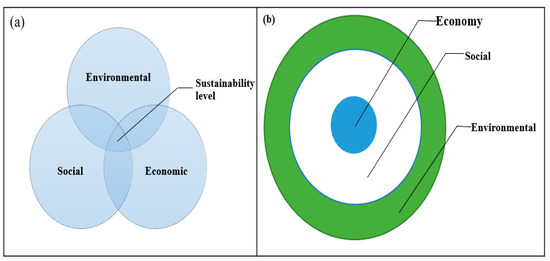
Figure 2.
Models that represent the interrelationships between the three pillars of sustainability: (a) three overlapping circle; (b) three nested dependencies.
2.3. Relations between Sustainability and Ergonomics
It is generally accepted that overall manufacturing process sustainability demands for a convergence between the economic development, social equity, and environmental protection. Since sustainability is a diversified concept, different professions like engineering, design, business, management, human factors or ergonomics etc. can contribute to its development.
Ergonomics gives attention to human beings and their relations with products, tools, facilities, processes, and environments used in work [12]. Its objectives are to boost the effectiveness with which work done and to improve required human values, including enhanced well-being, reduced fatigue and stress, increased comfort, better user acceptance, improved job satisfaction and quality of life. These objectives of ergonomics coincides with those attributes addressing pillars of sustainability and there are strong connections between ergonomics and sustainability. According to Wise [26], sustainability has largely considered design, business and engineering aspects over the past decades, however, ergonomics has been much less considered in the sustainability development, despite its strong relationships with all three pillars of sustainability. In addition, Radjiyev et al. [27] and Ryan and Wilson [28] confirmed in their literature review that there was insufficient published works from human factors community to sustainability.
Even though there is a slow start with the ergonomics community with consideration to sustainability, more recently there has been rising interest and some actions taken to strengthen the need [29,30]. For example, Cao et al. [5] provided sustainability framework based on ergonomics that focused on a social pillar of sustainability, whereas in our previous studies Lin et al. [9] emphasized/focused on the interaction of products with the society across the total product life cycle and guide the industries to produce sustainable products. The present study specifically considered employee as the center of the study with the objective of investigating indicators that make the environment of production processes more suitable for improving health and wellbeing, motivation and satisfaction, and performance of the employee. A summary review was performed to investigate the existing literature that correlates the ergonomics actions with sustainable manufacturing, as shown in Table A1 (Appendix A). As can be seen, there is a need to look into the role of ergonomics in a manufacturing or production process during the development of sustainability. Therefore, this study attempts to develop a process-based sustainability framework that considers the interaction of employee with activities in the production process.
2.4. Related Works on Manufacturing Sustainability Assessment
Sustainability refers to the utilization of resources to satisfy the desires of the current with consideration of capacity of next generations to meet their own desires [17]. This definition contains the idea of intra-generation equity that has been a ground for many sustainability literatures to explain the term. Because of the complexities and diversification of sustainability issue, different approaches or methods, conceptual frameworks and perspectives are used to define indicators and measure overall sustainability. For gaining information on the conceptual framework and the manufacturing sustainability evaluation approach, a review was performed to investigate the existing literature, as shown in Table A2 (Appendix B).
The indicators and ways of evaluating the overall performance of organizations towards sustainability usually varies from one study to another. For instance, Latif et al. [4] utilized unequal number of indicators that measures energy efficiency, waste management and workers health and safety to evaluate overall manufacturing sustainability index with the help of an interactive model based on user responses. Bappy et al. [31] considered an equal number of indicators that evaluate the index for each pillars of sustainability using Analytical Hierarchy process (AHP) and Hierarchical evidential reasoning (HER) that finally helps to obtain a supply chain sustainability index. In addition, Ocampo [32] provided a framework that contains three levels for evaluating a sustainable manufacturing index considering indicators under environmental stewardship, economic growth and social wellbeing using Analytical Hierarchy Process (AHP).
Singh et al. [16] and Cao et al. [5] both applied fuzzy approach to assess manufacturing sustainability. Singh et al. [16] considered 22 indicators under economic, environmental and social dimensions whereas Cao et al. [5] utilized indicators under the social dimension only. In general, the majority of approaches in the literature did not consider all sustainability dimensions with appropriate proportions. Specifically, the indicators of the social pillar lacks adequate attention [1,5,10].
Despite the fact that strong manufacturing sustainability can be achieved by considering all sustainability dimensions in a balanced way, a review article conducted by De Oliveira Neto et al. [33] shows that only 9 out of 128 articles include the social dimension whereas the rest of the articles ignores it. According to Badri Ahmadi et al. [34] the social aspects of sustainability have been given less consideration in the literature and practices of sustainable development. Furthermore, Gunasekaran and Subramanian [35] and Sutherland et al. [36] state that most previous studies related to sustainability assessment model were developed based on environmental and economic aspects without giving attention to the social dimension. These have all justified that there has been lack of representation of the indicators under the social dimension in the sustainability assessment.
Another limitation of the past research is that majority of the studies utilized all the developed indicators based on their own research objectives and used those indicators directly to assess the performance of the production process towards sustainability without screening their levels of importance. Often, the uncertainty and fuzziness of common understanding from the expert opinions are neglected. Therefore, this study attempts to address these research gaps by developing the employee-activity based indicators for a sustainable production process and identifying the rank and significance of those indictors using the fuzzy Delphi method.
2.5. Fuzzy Delphi Method
In multi-criteria decision-making, it is recommended that information is collected through group decision making and discussion among experts. For this purpose, Delphi method has been widely used. This method was initially introduced in the 1950s in the defense research and spreaded out in other areas including environmental, science, societal, technological research and others [37,38]. The definition of the expert in Delphi method varies based on the perspective and the objective of the survey. In general, the expert should possess knowledge and practical engagement; capacity and willingness to participate; adequate time to participate; and effective communication skill [39,40]. Regarding the number of the expert to be considered in the Delphi survey, Amr Sourani and Sohail [41] mentioned that a minimum is seven or eight experts, and according to Geist [42] and Ahmad and Wong [39], a range from 20 to 60 expert are appropriate. For instance, 13 experts was used by Sánchez-Lezama et al. [43] to determine the socio-ecological factors that influence adherence to mammography screening. Ahmad and Wong [39] considered 10 experts to develop weighted and comprehensive sustainability indicators for the Malaysian food manufacturing industry. Liu et al. [44] used 17 experts to explore the main resistance and key factors that affect renewable energy application concerning Taiwan building.
Although the Delphi method can be used to obtain a constant flow of expert opinions, it possesses the following weaknesses: time consuming, failure to consider fuzziness and data reliability problem if the researcher failed to select appropriate experts, [45]. For this matter, the Delphi method has undergone continuous developments and modifications since its introduction [40]. Fuzzy Delphi method is one of the modifications. In order to account for the amount of fuzziness in group decision [46] making, Fuzzy Delphi method was proposed by combining the concept of traditional Delphi method and fuzzy set theory to consider human linguistic preferences in making-decision. Applying this method to expert group decision can solve the fuzziness of common understanding of their opinions. This method was also purposely designed for complex and imprecise problems such as sustainability assessments [47]. In this study, we utilized fuzzy Delphi method because it captures the uncertainty due to the human factor valuation and thus improves the validity of the features quantification.
2.6. Employee-Activity Based Indicators of Production Process Sustainability Framework
An indicator is defined as a sign that shows the condition or existence of something. According to the description of Veleva and Ellenbecker [3], indicators are used to assess and motivate progress towards sustainability goals. In the same way, the sustainable manufacturing toolkit of the Organization for Economic Cooperation and Development (OECD) defined indicators as a well-established means of defining, tracking and improving performance. In this study, sustainability indicators are defined as well-defined positive and negative signs for the achievement of production process sustainability, which are established by considering the interactions between employees and industrial facilities, the working environment, materials used, work culture, and other factors in the production process.
A production process is a complex process that requires high utilization of natural resources such as energy and raw materials and the interaction of human operators with machines and working environments to convert input materials into output products. Besides the products manufactured, the production process may also involve dissatisfaction, accidents and injuries to the human operators, waste generated, and environmental pollution. To minimize the negative impacts of the production process and achieve a sustainable process, research organizations and industries have developed sustainability indicators for social, environmental and economic aspects. However, most researchers in sustainable manufacturing have mainly focused on environmental and economic aspect sustainability indicators and concentrated little on the social aspect.
The social aspect includes three groups: employees, customers, and community. In this study, our major concern is on developing the social aspect sustainability indicators of production processes, and specifically on employee-activity based indicators in the production process. The sustainability framework is developed with four levels. Level 1 is the main goal, which is indicators of production process sustainability. Level 2 is the sustainability dimension, which includes social, environmental, and economic or technological factors. Level 3 is a cluster comprising employee safety, motivation and satisfaction, work task management, production or work environment, workplace waste and emissions, occupational health and safety, production process safety and flexibility, and human-machine interactions. Level 4 is a list of indicators. A comprehensive list of employee activity-based indicators of production process sustainability was formulated by the researchers through an exhaustive review of the literature (Appendix A and Appendix B) and from expert suggestions, as depicted in Figure 3.
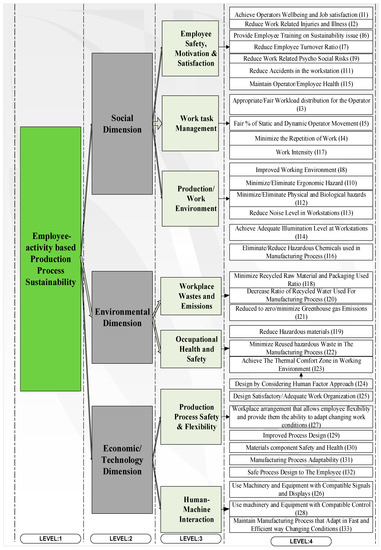
Figure 3.
Hierarchical framework for production process sustainability indicators based on employee-activity. (I: represent indicators).
The sustainability indicators created were dependent on their direct or indirect impacts on the safety, health, satisfaction, motivation and performance of employees. For instance, minimizing the recycled raw materials and packaging used in a production process was identified as one of the indicators, with the intention of investigating the amount of recycled materials used in the process and to understand its effects on employee health and safety, which should indirectly determine employee engagement with the company. The operational descriptions of the indicators are listed in Table 1.

Table 1.
Operational description of sustainability indicators.
3. Research Methodology
3.1. Data Description and Methods for Analysis
Sustainability problems often include high degrees of vagueness and subjectivity derived from human judgment. This study was conducted using data collected by a questionnaire survey of experts from December 2018 to March 2019. The 33 indicators of production process sustainability (Figure 3) established from related literature were used as input for the questionnaire. Then the survey was conducted by sending an e-mail questionnaire to academicians (university professors), researchers, industrial managers and experts. The expert was selected based on purposive sampling. A total of 35 experts were invited to participate in the survey. Of the 35, 30 appropriately finished the questionnaire; the response rate was 85.71%. As mentioned in the Section 2.5 of this manuscript, the number of experts participated in the survey is within the specified range according to our literature review. In the questionnaire, basic information (job category, qualifications and work experience), a short description of the topic, and the definitions of indicators with response alternatives were included. The profile of these experts are as depicted in Table 2.
Table 2.
The expert profile.
The emphasis of the survey was to ask the experts to give their opinions on the importance of each employee activity-based indicator for production process sustainability according to linguistic terms and corresponding fuzzy numbers, as indicated in Table A3 (Appendix C) [48].
Sustainability assessment problems consist of difficulties along with a series of doubts and ambiguity. To handle this difficult problem, it is more useful to consider linguistic values or fuzzy numbers than conventional quantitative expressions. Fuzzy numbers are classified as TFN, trapezoidal fuzzy numbers, and Gaussian fuzzy numbers, depending on the nature or shape of the membership function. This study utilized triangular fuzzy numbers because they are easy to use in promoting representation and information processing [49]. The representations of triangular fuzzy numbers to the corresponding linguistic terms applied in the study are shown in Figure A1 (Appendix D)
To perform TFN, this study utilized the Fuzzy Delphi method, which is mostly applied in engineering, management, business and the physical sciences for screening processes by employing a fuzzy set to represent opinions from experts [50]. Vagueness and uncertainty associated with sustainability assessment are resolved by fuzzy techniques that depend on the assumptions of the main aspects of human judgement and thoughts, which are linguistic terms or labels of a fuzzy scale. The detailed procedure of the fuzzy Delphi method applied in this study to determine group fuzzy opinions of experts on each indicator is shown in Figure 4.
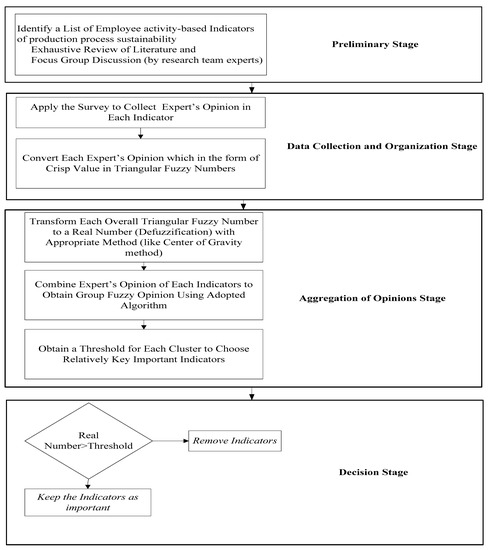
Figure 4.
Flow Chart of the Fuzzy Delphi method to determine key important sustainable production process indicators.
According to Hsu and Chen [51], experts’ opinions can be aggregated based on similarity, in which a similarity index is introduced to measure the consistency of each expert with other experts. Lee [52] combined expert opinions using the distance between one expert’s opinions and those of others. Expert opinion aggregation considering either similarity or distance between opinions independently will lead to a loss of information. Therefore, this study considers the similarity and distance between the experts’ opinions equally to arrive at the group consensus for the indicators from individual expert opinions through the algorithm that as stated below and analysis were performed in MATLAB software (version R2018b):
Step 1: For each indicator, organize the linguistic values of the TFNs that are the minimum (a), optimum (b) and maximum (c) of all expert (decision maker) opinions. , Where, n is the total number of decision makers participating in the survey (which is 30 for this study) and is the expert opinion.
Step 2: Calculate the similarity between each pair of experts’ opinions and for all decision makers (Equation (1)) [53]:
For and
Step 3: Determine the distance among pairs of decision makers opinions and for all decision makers by Equations (2) and (3) below [54].
Then define the normalized distance:
For and
Step 4: Calculate the consistency degree between each pair of experts’ opinions (Equation (4)) [55] for
The value of used in this study is 0.5, which indicates for the consistency of experts’ opinions that the similarity and distance between the experts’ opinions are equally important.
Step 5: Determine the level of significance of each expert considering their working experience. In this study, the working experience of the experts who participated in the survey were classified in years of experience: <5, 5–10, 10–15, 15–20, and >20. The summary of the level of significance () for each decision maker (expert) is presented in Table 3.
Table 3.
Significance level of experts.
Step 6: Determine the weighted consistency degree for each decision maker for using Equation (5):
Step 7: Determine the combined weight of decision maker for using Equation (6):
Step 8: Combine fuzzy opinion for each indicator ‘I’ into a group fuzzy opinion by Equation (7) [43,55]:
Which means,
3.2. Defuzzification
For each created sustainability indicator, the fuzzy group opinion is obtained in the triangular fuzzy number values using the stated algorithm. Therefore, it is necessary to utilize defuzzification for fuzzy values associated with each production process sustainability indicator. Defuzzification is a method to change the fuzzy numbers into crisp real numbers. Even though there are a number of defuzzification techniques, mean of maximum, center-of-area (CoA), center of gravity (CoG) and alpha-cut methods are the most common approaches [43,56]. This study applies the center of gravity method to create crisp values [57]. The defuzzified values of the fuzzy numbers can be obtained from Equation (8).
To select the key sustainability indicators, this study considers the threshold value in the form of the average value for each cluster. The indicators with crisp real values greater than the independently set average value for each cluster were retained.
3.3. Reliability of Questionnaire
Reliability helps for evaluating the degree to which a measurement of phenomenon offers stable and consistent result. In addition, it is also concerned with the repeatability of a measure. The researchers can test the reliability of their instruments (questionnaire items) in order to know to what extent they can say that the data are consistent [58]. The most frequently used internal consistency or reliability measure is Cronbach Alpha Coefficient. It is considered as the best suitable measure of reliability when making use of Likert scales [59]. For this study, we test the reliability of the questionnaire in order to know whether all items in the questionnaire consistently measure the performance of production process towards sustainability. For this purpose, the study determined the Cronbach Alpha for a sample of 30 decision makers (experts) in SPSS software (version 20). The value of Cronbach Alpha obtained was 0.898, which is greater than the commonly used tolerable value (0.7).
4. Results and Discussion
Results
Theoretically, the total life cycle approach for sustainability assessment of manufacturing industries considers the pre-manufacturing process, the manufacturing process, use and post-use. Different organizations and researchers have identified a number of sustainability indicators with their own defined objectives and scopes by considering the sustainability dimension as their professional basis. This study has identified a number of sustainability indicators of production and manufacturing process parts by considering employee-activities as the basis.
The listed indicators were identified by considering their direct and indirect impacts on employee health, safety, satisfaction, motivation and performance. Then screening of the key indicators was determined by the expert survey and the fuzzy Delphi method, which was applied for analysis. Because of the participation of a number of experts who provided opinions on the decisions of the relative importance of sustainability indicators, the fuzzy Delphi method was also used to solve the fuzziness (i.e., uncertainty and imprecision) of the common understanding of the expert opinions. To obtain the group fuzzy opinions for each indicator, the study utilized a fuzzy Delphi method algorithm that considers the rank of significant decision makers based on their working experience and the similarity and distance between the expert opinions.
The analysis was performed in MATLAB software (version R2018b). Table 4 lists, for each indicator, the group fuzzy opinion and its corresponding defuzzified values. For instance; 0.9054, 0.9004, and 0.7687 are defuzzified values (average values) of safe process design for employee, reduce accidents at workstations and appropriate or fair workload distribution for the operator’s indicators respectively. The employee-activity based sustainable production process indicators showed a crisp real value (defuzzified value) higher than the average value given priority in the implementation process. According to the analysis conducted in the study, 16 relatively important indicators were identified, as shown in Table 4.
Table 4.
Combined group opinions on importance of employee-activity based sustainable production process indicators.
The descriptions of the sustainability indicators selected as relatively important from the expert survey are given and linked to seven clusters derived from employee-activity related production process sustainability (as shown in Appendix E).
- (a)
- Employee safety, motivation and satisfaction: Of the seven indicators, three were retained. Reduce accidents in the workstation had the highest score of 0.9004, followed by maintain operator or employee health and reduce work-related injuries and illness.
- (b)
- Work task management: Appropriate workload distributions for the operators, with a value of 0.7687, and work intensity, with a value of 0.7630, were retained from the four sustainability indicators.
- (c)
- Production/work environment: Of six indicators, four were retained. Minimize or eliminate ergonomic hazards had the highest value of 0.8754, followed by improve the working environment, minimize or eliminate physical and biological hazards, and eliminate or reduce hazardous chemicals used in the production process.
- (d)
- Workplace waste and emissions: Only reduce to zero or minimize greenhouse gas emissions was retained; its value was 0.7467.
- (e)
- Occupational health and safety: Reduce hazardous materials, with a value of 0.8010, and achieve the thermal comfort zone in the working environment, with a value of 0.7827, were retained.
- (f)
- Production process safety and flexibility: Of the seven sustainability indicators, three were retained, as follows: Safe process design for the employee had the highest value of 0.9054, followed by design considering the human factor approach and materials component safety and health.
- (g)
- Employee-machine interaction: Of the three indicators, only use machinery and equipment with compatible signals and displays, with a value of 0.8156, was retained.
5. Discussion
As mentioned in the theoretical background, the problem of production process sustainability has been addressed through proper consideration of the factors affecting the three pillars of sustainability dimension. Previous relevant studies focused either on the environment and economics or on the overall sustainability dimension.
In the literature review, it was shown that the attention given to social indicators was less than expected and even that most studies have considered social indicators that are too broad [5]. In addition, the Jasiulewicz-Kaczmarek and Saniuk [25] sustainability view states that social sustainability is a future engineering focus, which led the researchers to further work on identifying social indicators in specific ways for sustainability assessment.
To fill the gap to some extent, this study established a list of sustainability indicators from the perspective of direct and indirect impacts of manufacturing or production activities on employee health, wellbeing, motivation, performance, characteristics and behavior. The literature review, research team suggestions and organizational reports (such as corporate social responsibility [60]) were used as the background for the identification of the indicators. Consistent with the literature review and research team opinions, the average scores given to all indicators by the experts who participated in the survey showed that they are all important, very important and extremely important factors for evaluating production process sustainability (Table 4). In addition, the study provides a screening process to identify the most influential indicators. This would help the company to plan resources accordingly for evaluating the sustainability of the production process.
Previous studies utilized lists of sustainability indicators identified from literature review, organizational reports and standards, without assessing the relative importance of these indicators. To solve this problem, the study developed a systematic method that identifies the key important indicators. The screening procedures of the importance of indicators of production process sustainability were determined with an expert survey conducted with the fuzzy Delphi method. The fuzzy Delphi method considers human linguistic preferences by combining fuzzy theory and the traditional Delphi methods in decision-making. This method provides an advantage over traditional Delphi methods in that it helps to solve the uncertainty and imperfection associated with expert opinions on the decisions of the importance of each indicator during the questionnaire survey process. The experts who participated in the survey were industrialists, professors, researchers and industrial managers with different work experiences on production process sustainability, and this variety affected the process of aggregating individual opinions into group consensus. To overcome this effect, the study determined the degree of importance of the experts according to years of experience and the similarity and distance between expert opinions in an individual opinion aggregation process.
The study developed a sustainability framework that included seven clusters, in which similar category indicators were grouped into their relevant clusters. The decision to prioritize the importance of sustainability indicators depended on the separately-set thresholds for each cluster obtained from the average values of members in each cluster. For instance, the threshold value of production/work environment cluster was 0.8377, which was obtained by averaging the respective real/defuzzified values of indicators included in the cluster. Among all members of this cluster, those indicators with greater values than the threshold were considered as the most influential indicators to achieve social sustainability of the organization.
The identified and validated indicators in this study improves the overall performance of industries towards sustainability because they are affecting the employee health, performance or efficiency, motivation to the work, and their innovative capacity. For instance, accidents in workstation and work-related injuries and illness can lead to bad employee health condition, and in turn reduce their productivity and increase absenteeism. Therefore, this the present study includes the reduction of accidents in workstations and work-related injuries and illness as sustainable production process indicators. In the similar manner, greenhouse gases (GHGs) emissions, chemicals, physical and biological hazards can cause destruction to the environment and subsequently to the employee health. That is why we include the reduction of GHGs emissions and hazards as sustainability indicators.
The review articles by Oliveira Neto et al. [33] shows that reduction of greenhouse gases emissions, and replacing chemicals and/or toxic inputs by organic products are some of actions towards achieving a strong sustainability. This is consistent with our present identified and validated sustainability indicators under the categories of environmental aspects.
According to the review and analysis of social indicators of manufacturing sectors conducted by Ahmad et al. [11], sustainability assessment studies (under literature survey) mainly consider indicators that determine the essential labor rights like salary, freedom of collective bargaining, equal opportunity, freedom of association, etc. under the category of workers/employees. However, indicators that evaluate labor satisfaction (for example, turnover, absenteeism, etc.) were not included in the reviewed studies. The indicators developed in the present study under the employee safety, motivation and satisfaction cluster can be used to determine the worker satisfaction and should not be neglected.
In our previous work by Lin et al. [9] a total of 40 sustainability indictors or factors were developed based on the interaction of product with the society. The importance level of these indicators was investigated by experts (management decision makers). The survey result showed that product safety, product serviceability, product quality, product usability, liquid and solid particulate emission turned out to be the indicators that highly contribute to the product sustainability, as compared to the other identified indicators based on the interaction of product with the society. Whereas in our present study focusing on employee activity in the workplace, safe process design for the employee, reducing accidents at workstations, maintaining operator/employee health, minimizing or eliminating ergonomic hazards and reducing work related injuries and illnesses achieved the maximum agreement regarding their contribution to a sustainable production process among the experts (management decision makers) participated in the survey.
In general, every manufacturing firm considers the pre-manufacturing, manufacturing, use, and post-use stages of a product’s life cycle. Overall, the effects of an established list of sustainability indicators are classified into these four stages of the product life cycle for manufacturing sustainability assessment [61,62]. Many previous studies have stated that the social dimension indicators are less represented as compared to the other sustainability dimension [10,11,25]. Our present study, by establishing sustainability indicators affecting directly or indirectly employee in the production process contribute to fill the gap of social dimension. To evaluate overall sustainability, it requires a comprehensive approach considering both the effects of product design on the user and the environment, and the effects of the production process on the worker and workplace environment. This can be achieved by a combined and integrated application of the employee activity-based indicators developed in this study and the product-design-based indicators developed in previously towards a total ergonomics or user-and employee-centered sustainability approach in the future.
6. Conclusions
Manufacturing industries are forced by governmental policy and user interests to measure and quantify the sustainability of their activities to produce products in sustainable ways. However, achieving production process sustainability is a complex problem that can be measured by the influence of the manufacturing system on the environment, employees, customers, community and economy. The identification of indicators of sustainability with specified objectives and ways of selecting relatively important indicators represents an operational method to minimize the complexity associated with the sustainability problem.
In this study, indicators of production process sustainability were identified by considering direct and indirect influences of the manufacturing system on the employee-activity. These indicators are classified into their own pillars of sustainability (i.e., social, environmental, economic and technological) and seven clusters. The sustainability clusters considered in the sustainability framework are employee safety, motivation and satisfaction; work task management; production or work environment; workplace waste and emissions; occupational health and safety; production process safety and flexibility; and employee—machine interaction. In addition, the key important indicators were selected by using a fuzzy Delphi method. A Delphi questionnaire based on linguistic variables was designed to collect expert opinions on the importance of each indicator for determining production process sustainability. The consistency of the data was examined using Cronbach’s alpha, and in this study, the Cronbach’s alpha of the data was 0.898, which is greater than the minimum acceptable value. The overall fuzzy opinion for each indicator was obtained based on the degree of significance of the decision makers (experts) and the similarity and distance among expert opinions. Then the threshold or average values associated with the sustainability clusters were used to select the key important indicators from the list of identified indicators.
The contribution of this study is that it improves the representation of social indicators in the evaluation of production process sustainability and provides a mechanism for screening the critical employee-activity based sustainability indicators from a list of established ones. In addition, the result of the study guide company policy makers to allocate the resources that improve their performance towards sustainable production process, which directly and indirectly improve employee performance, safety and health. One limitation of the current study is that the composition of the participant is limited to researchers, university professors, industrial expert and managers. For future research direction it would be interesting, to include the workers and other stakeholders in the questionnaire to evaluate the sustainability indicators for different point of view. And also, it will be worthy to focus on how to measure and quantify each relatively important indicator, how to generate a model to obtain overall sustainable production process values, and how to implement them in a selected manufacturing firm.
Author Contributions
C.J.L. conceptualized, guided and supervised the research work, reviewed and edited the manuscript; T.T.B. conducted the literature review, processed and analyzed the data, draft the manuscript; D.C. reviewed the manuscript, provided resources and publication support; B.C.J. reviewed the manuscript and co-supervised the research; and T.C.K. reviewed the manuscript and facilitated the data collection. All authors have read and agreed to the published version of the manuscript.
Funding
This research received no external funding.
Conflicts of Interest
The authors declare no conflict of interest.
Appendix A
Table A1.
Summary of studies on relations between Ergonomics and manufacturing sustainability.
Table A1.
Summary of studies on relations between Ergonomics and manufacturing sustainability.
| No. | Objective | Methodology | Authors |
|---|---|---|---|
| 1 | To provide social sustainability evaluation structure from the viewpoint of ergonomics | Weighted Mamdani fuzzy inference system(FIS) | Cao et al. [5] |
| 2 | To investigate the connection among work and sustainability based on literature review | Literature review: Mapping the relationships | Bolis et al. [63] |
| 3 | To identify research trends of ergonomics and sustainability and connecting areas where human factors can play a significant role in sustainable development | Review of Literature | Radjiyev et al. [27] |
| 4 | To reveals on the effect sustainability has had and is having on areas of ergonomics and human factors | Review | Haslam and Waterson [30] |
| 5 | To investigate sustainable manufacturing and the role of human factor or ergonomics in attaining it | Literature review | Jasiulewicz-Kaczmarek and Saniuk [25] |
| 6 | To provide an overview on indicators and goals for sustainable production planning and controlling processes in manufacturing industries from a human factors viewpoint | Root cause analysis | Zarte et al. [64] |
| 7 | To investigate and identify ergonomics-based factors of sustainable product considering the interaction of product with society across its life cycle | Fuzzy Delphi method | Lin et al. [9] |
| 8 | To analyze ergonomics contribution to sustainability | Literature Review | Martin et al. [29] |
| 9 | To show that the objectives of ergonomics are thoroughly associated with the objectives of design for environmental sustainability | Review | Thatcher [65] |
| 10 | To study the role of ergonomics in supporting the work on sustainability | Literature review and expert survey | Ryan and Wilson [28] |
Appendix B
Table A2.
Summary studies on framework and assessment methodologies of manufacturing process/product Sustainability.
Table A2.
Summary studies on framework and assessment methodologies of manufacturing process/product Sustainability.
| No. | Objective | Methodology | No of Indicators Used | Authors |
|---|---|---|---|---|
| 1 | To provide a method for identifying sustainability criteria and propose how it can be applied in manufacturing industries | A sustainability compliance index and qualitative measurement scale for the criteria | 5 sustainability criteria considered under each of 4 sustainability principle | Hallstedt [66] |
| 2 | To determine sustainability index of small and medium scale manufacturing industry | An interactive model based on user responses | 29 energy efficiency, 15 waste management and 33 worker health and safety | Latif, Gopalakrishnan [4] |
| 3 | To develop a suitable methodology for product sustainability evaluation considering triple bottom line across product life cycle. | SAFT: Sustainability assessment using fuzzy-inference technique | 20, 26 and 9 influencing factors under environmental, economic and social aspects identified, whereas 4, 5, and 4 used for case study | Sabaghi, Mascle [24] |
| 4 | To investigate the effect of sustainability on the manufacturing industries; and as most promising areas of research and development. | Literature review | no specific number of indicators mentioned | Garetti and Taisch [18] |
| 5 | To provide tool that evaluates the sustainability index (SI) of manufactured products and processes considering the pillars of sustainability | Evaluation score: Data normalization process and aggregation Case study | 16, 10 and 3 indicators under economic-technological, environmental, and social respectively | Schuch Bork, de Souza [67] |
| 6 | To provide an approach of calculating sustainable industrial index as measurement for a combined sustainable level. | Analytical hierarchy process (AHP) | 16, 8, and 9 under environmental stewardship, economic growth and social wellbeing respectively | Ocampo [32] |
| 7 | To evaluate sustainability of configuration design alternatives | Weighted decision matrix and artificial neural network | 8, 8, and 9 under environmental, economic and social aspect respectively | Hassan, Saman [68] |
| 8 | To suggest a sustainability index that shows companies level on the three dimension of sustainability | Analytic Hierarchy Process (AHP) Case study | 7 social, 3 economic and 4 environmental | F. Salvado, Azevedo [69] |
| 9 | To provide the framework of the key performance indicators to help the enterprise in importing sustainable development criteria | Balanced scorecard (BSc) and Quality Function Deployment | 9 economy, 12 environmental and 8 society | Hsu, Chang [70] |
| 10 | To propose a sustainability assessment model considering a correlation matrix between the three pillars of sustainability. | Correlation matrix and balanced score card | 4 social, 4 environmental and 4 economic | Nicoletti Junior, de Oliveira [71] |
| 11 | To investigate measurement methods that are used to evaluate sustainability performance of supply chains | Literature review | no specific number of indicators mentioned | Qorri, Mujkić [72] |
| 12 | To provide a business model that aids enterprise work in a more sustainable way | Business model | Equal number of key factors for sustainable business model used under the social, economic and environmental | Matinaro, Liu [73] |
| 13 | To identify the most appropriate sustainable indicators for enterprises operating in yachting industry | Literature review | 7 economic, 21 environmental and 16 social | Hojnik, Biloslavo [74] |
| 14 | To evaluate sustainability in supply chain by incorporating uncertain, inadequate, and subjective in nature sources of information | Analytical hierarchy process (AHP); Hierarchical evidential reasoning (HER) | 5 economic, 5 environmental and 5 social | Bappy, Ali [31] |
| 15 | To review the studies and investigates the indicators of sustainability of manufacturing sectors in viewpoint of triple bottom line (TBLs) | Literature survey | 63 environmental indicators from 24 studies, 26 indicators from 21 studies and 55 indicators from 21 studies | Ahmad, Wong [11] |
| 16 | To discusses the sustainable manufacturing | Concepts, implementation techniques and assessment | 14 manufacturing cost, 13 personal health and safety, 16 waste management,12 energy consumption and 14 environmental impact | Kishawy, Hegab [75] |
| 17 | To identify key performance indicators(KPIs) related to sustainability issue and propose mechanism of integrating them in company strategies | Review and survey | 4 economic goals, 5 social goals and 5 environmental goals used as sustainability perspective | Hristov and Chirico [76] |
Appendix C
Table A3.
Linguistic terms with their corresponding Likert scale and value of fuzzy numbers.
Table A3.
Linguistic terms with their corresponding Likert scale and value of fuzzy numbers.
| Likert Scale | Triangular Fuzzy Number (TFN) | Linguistic Variable or Definition |
|---|---|---|
| 1 | (0.0, 0.0, 0.125) | Less important (LI) |
| 2 | (0.0, 0.125, 0.25) | Judgment values between LI and F |
| 3 | (0.125, 0.25, 0.375) | Fair (F) |
| 4 | (0.25, 0.375, 0.5) | Judgment values between F and I |
| 5 | (0.375, 0.5, 0.625) | Important (I) |
| 6 | (0.5, 0.625, 0.75) | Judgment values between I and VI |
| 7 | (0.625, 0.75, 0.875) | Very important (VI) |
| 8 | (0.75, 0.875, 1.0) | Judgment values between VI and EI |
| 9 | (0.875, 1.0, 1.0) | Extremely important (EI) |
Appendix D

Figure A1.
Triangular membership function of linguistic value. LI: less important; F: fair; I: important; VI: very important; EI: Extremely important, and the intermediates between values.
Appendix E


Figure A2.
Graph of aggregated expert’s opinion versus indicators for each cluster: (a) employee safety, motivation and satisfaction; (b) work task management; (c) production/work environment; (d) workplace wastes and emissions; (e) occupational health and safety; (f) production process safety and flexibility; (g) employee machine interaction.
References
- McKenzie, S. Social Sustainability: Towards Some Definitions; Hawke Research Institute, University of South Australia: Adelaide, Australia, 2004. [Google Scholar]
- Jayal, A.D.; Badurdeen, F.; Dillon, O.W., Jr.; Jawahir, I.S. Sustainable manufacturing: Modeling and optimization challenges at the product, process and system levels. CIRP J. Manuf. Sci. Technol. 2010, 2, 144–152. [Google Scholar] [CrossRef]
- Veleva, V.; Ellenbecker, M. Indicators of sustainable production: Framework and methodology. J. Clean. Prod. 2001, 9, 519–549. [Google Scholar] [CrossRef]
- Latif, H.H.; Gopalakrishnan, B.; Nimbarte, A.; Currie, K. Sustainability index development for manufacturing industry. Sustain. Energy Technol. Assess. 2017, 24, 82–95. [Google Scholar] [CrossRef]
- Cao, Y.; Wang, S.; Lili, Y.; Zhou, J. A social sustainability assessment model for manufacturing systems based on ergonomics and fuzzy inference system. In International Conference on Sustainable Design and Manufacturing; Springer: Cham, Switzerland, 2016; pp. 639–648. [Google Scholar]
- Lucato, W.C.; Santos, J.C.S.; Pacchini, A.P.T. Measuring the sustainability of a manufacturing process: A conceptual framework. Sustainability 2017, 10, 81. [Google Scholar] [CrossRef]
- Tseng, M.-L. Modeling sustainable production indicators with linguistic preferences. J. Clean. Prod. 2013, 40, 46–56. [Google Scholar] [CrossRef]
- Bottani, E.; Gentilotti, M.C.; Rinaldi, M. A fuzzy logic-based tool for the assessment of corporate sustainability: A case study in the food machinery industry. Sustainability 2017, 9, 583. [Google Scholar] [CrossRef]
- Lin, C.J.; Belis, T.T.; Kuo, T.C. Ergonomics-based factors or criteria for the evaluation of sustainable product manufacturing. Sustainability 2019, 11, 4955. [Google Scholar] [CrossRef]
- Widok, A.H.; Wohlgemuth, V. Social sustainability and manufacturing simulation defining social criteria for a holistic sustainability simulation approach in manufacturing companies. In Proceedings of the Sixth International Conference on Advances in System Simulation IARIA, Nice, France, 12–16 October 2014. [Google Scholar]
- Ahmad, S.; Wong, K.Y.; Rajoo, S. Sustainability indicators for manufacturing sectors: A literature survey and maturity analysis from the triple-bottom line perspective. J. Manuf. Technol. Manag. 2019, 30, 312–334. [Google Scholar] [CrossRef]
- Sanders, M.S.; McComick, E.J. Human Factors in Engineering and Design, 7th ed.; McGraw-Hill, Inc.: New York, NY, USA, 1993. [Google Scholar]
- Zink, K.J. Designing sustainable work systems: The need for a systems approach. Appl. Ergon. 2014, 45, 126–132. [Google Scholar] [CrossRef]
- Stephen, L.; Craig, B. Achieving transition to sustainability: Lessons from human factors and ergonomics. In Proceedings of the 4th International Conference on Sustainability Engineering and Science, Auckland, New Zealand, 30 November–3 December 2010. [Google Scholar]
- UN. Sustainable Development Goals: 17 Goals to Transform Our World. Available online: https://www.un.org/sustainabledevelopment/ (accessed on 24 June 2020).
- Singh, S.; Olugu, E.U.; Fallahpour, A. Fuzzy-based sustainable manufacturing assessment model for SMEs. Clean Technol. Environ. Policy 2014, 16, 847–860. [Google Scholar] [CrossRef]
- WCED. Report of the World Commission on Environment and Development: Our Common Future; Oxford University Press: Oxford, UK, 1987. [Google Scholar]
- Garetti, M.; Taisch, M. Sustainable manufacturing: Trends and research challenges. Prod. Plan. Contr. 2012, 23, 83–104. [Google Scholar] [CrossRef]
- Herrmann, C.; Bogdanski, G.; Winter, M.; Heinmann, T.; Thiede, S.; Zein, A. Sustainability in Production Engineering—Holistic Thinking in Education. In Advances in Sustainable Manufacturing, Proceedings of the 8th Global Conference on Sustainable Manufacturing, Abu Dhabi, UAE, 22–24 November 2010; Springer: Berlin/Heidelberg, Germany, 2011. [Google Scholar]
- Davim, J.P. Sustainable Manufacturing, Control Systems, Robotics and Manufacturing Series; W. ISTE Ltd.: London, UK, 2010. [Google Scholar]
- Vinodh, S. Assessment of sustainability using multi-grade fuzzy approach. Clean Technol. Environ. Policy 2011, 13, 509–515. [Google Scholar] [CrossRef]
- Lee, J.Y.; Kang, H.S.; Noh, S.D. MAS2: An integrated modeling and simulation-based life cycle evaluation approach for sustainable manufacturing. J. Clean. Prod. 2014, 66, 146–163. [Google Scholar] [CrossRef]
- Badurdeen, F.; Shuaib, M.A.; Lu, T.; Jawahir, I.S. Sustainable value creation in manufacturing at product and process levels: Metrics-based evaluation. In HandBook of Manufacturing Engineering and Technology; Springer: New York, NY, USA, 2015; pp. 3343–3375. [Google Scholar]
- Sabaghi, M.; Mascle, C.; Baptiste, P.; Rostamzadeh, R. Sustainability assessment using fuzzy-inference technique (SAFT): A methodology toward green products. Expert Syst. Appl. 2016, 56, 69–79. [Google Scholar] [CrossRef]
- Jasiulewicz-Kaczmarek, M.; Saniuk, A. Human factor in sustainable manufacturing. In Lecture Notes in Computer Science (Including Subseries Lecture Notes in Artificial Intelligence and Lecture Notes in Bioinformatics); Springer: New York, NY, USA, 2015; pp. 444–455. [Google Scholar]
- Wise, J. Human factors & the sustainable design of built environments. Proc. Hum. Factors Ergon. Soc. Annu. Meet. 2001, 45, 808–812. [Google Scholar]
- Radjiyev, A.; Qiu, H.; Xiong, S.; Nam, K.H. Ergonomics and sustainable development in the past two decades (1992–2011): Research trends and how ergonomics can contribute to sustainable development. Appl. Ergon. 2015, 46 Pt A, 67–75. [Google Scholar] [CrossRef]
- Ryan, B.; Wilson, J.R. Ergonomics in the development and implementation of organisational strategy for sustainability. Ergonomics 2013, 56, 541–555. [Google Scholar] [CrossRef]
- Martin, K.; Legg, S.; Brown, C. Designing for sustainability: Ergonomics—Carpe diem. Ergonomics 2013, 56, 365–388. [Google Scholar] [CrossRef]
- Haslam, R.; Waterson, P. Ergonomics and sustainability. Ergonomics 2013, 56, 343–347. [Google Scholar] [CrossRef]
- Bappy, M.M.; Ali, S.M.; Kabir, G.; Paul, S.K. Supply chain sustainability assessment with Dempster-Shafer evidence theory: Implications in cleaner production. J. Clean. Prod. 2019, 237, 117771. [Google Scholar] [CrossRef]
- Ocampo, L.A. A hierarchical framework for index computation in sustainable manufacturing. Adv. Prod. Eng. Manag. 2015, 10, 40–50. [Google Scholar] [CrossRef]
- De Oliveira Neto, G.C.; Rodrigues Pinto, L.F.; Castro Amorim, M.P.; Giannetti, B.F.; Villas Bôas de Almeida, C.M. A framework of actions for strong sustainability. J. Clean. Prod. 2018, 196, 1629–1643. [Google Scholar] [CrossRef]
- Badri Ahmadi, H.; Kusi-Sarpong, S.; Rezaei, J. Assessing the social sustainability of supply chains using Best Worst Method. Resour. Conserv. Recycl. 2017, 126, 99–106. [Google Scholar] [CrossRef]
- Gunasekaran, A.; Subramanian, N. Sustainable operations modeling and data analytics. Comput. Oper. Res. 2018, 89, 163–167. [Google Scholar] [CrossRef]
- Sutherland, J.W.; Richter, J.S.; Hutchins, M.J.; Dornfeld, D.; Dzombak, R.; Mangold, J.; Robinsonm, S.; Hauschild, M.Z.; Bonou, A.; Schönsleben, P.; et al. The role of manufacturing in affecting the social dimension of sustainability. CIRP Ann. 2016, 65, 689–712. [Google Scholar] [CrossRef]
- Hasson, F.; Keeney, S.; McKenna, H. Research guidelines for the Delphi survey technique. J. Adv. Nurs. 2000, 32, 1008–1015. [Google Scholar]
- Linstone, H.A.; Turoff, M. The Delphi Method. Techniques and Applications; Addison-Wesley Educational Publishers Inc.: Boston, MA, USA, 2002. [Google Scholar]
- Ahmad, S.; Wong, K.Y. Development of weighted triple-bottom line sustainability indicators for the Malaysian food manufacturing industry using the Delphi method. J. Clean. Prod. 2019, 229, 1167–1182. [Google Scholar] [CrossRef]
- Dapari, R.; Ismail, H.; Ismail, R.; Ismail, N.H. Application of fuzzy Delphi in the selection of COPD risk factors among steel industry workers. Tanaffos 2017, 16, 46–52. [Google Scholar]
- Sourani, A.; Sohail, M. The Delphi method: Review and use in construction management research. Int. J. Constr. Educ. Res. 2015, 11, 54–76. [Google Scholar] [CrossRef]
- Geist, M.R. Using the Delphi method to engage stakeholders: A comparison of two studies. Eval. Program Plan. 2010, 33, 147–154. [Google Scholar] [CrossRef]
- Sánchez-Lezama, A.P.; Cavazos-Arroyo, J.; Albavera-Hernández, C. Applying the Fuzzy Delphi Method for determining socio-ecological factors that influence adherence to mammography screening in rural areas of Mexico. Cad. Saude Publica 2014, 30, 245–258. [Google Scholar] [CrossRef] [PubMed]
- Liu, S.-Y.; Perng, Y.-H.; Ho, Y.-F. The effect of renewable energy application on Taiwan buildings: What are the challenges and strategies for solar energy exploitation? Renew. Sustain. Energy Rev. 2013, 28, 92–106. [Google Scholar] [CrossRef]
- Kamarulzaman, N.; Jomhari, N.; Raus, N.M.; Yusoff, Z.M. Applying the Fuzzy Delphi Method to analyze the user requirement for user centred design process in order to create learning applications. Indian J. Sci. Technol. 2015, 8. [Google Scholar] [CrossRef]
- Murray, T.J.; Pipino, L.L.; Gigch, J.P. A pilot study of fuzzy set modification of Delphi. Hum. Syst. Manag. 1985, 5, 76–80. [Google Scholar] [CrossRef]
- Mendoza, G.A.; Prabhu, R. Fuzzy methods for assessing criteria and indicators of sustainable forest management. Ecol. Indic. 2004, 3, 227–236. [Google Scholar] [CrossRef]
- Xu, Y.; Wang, H. Optimal weight determination and consensus formation under fuzzy linguistic environment. Proc. Comput. Sci. 2013, 17, 482–489. [Google Scholar] [CrossRef][Green Version]
- Zhang, L.; Xu, X.; Tao, L. Some similarity measures for triangular fuzzy number and their applications in multiple criteria group decision-making. J. Appl. Math. 2013, 2013, 538261. [Google Scholar] [CrossRef]
- Saffie, N.A.M.; Mohd Shukor, N.A.; Rasmani, K.A. Fuzzy Delphi method: Issues and challenges. In Proceedings of the International Conference on Logistics, Informatics and Service Sciences (LISS), Sidney, Australia, 24–27 July 2016. [Google Scholar]
- Hsu, H.M.; Chen, C.T. Aggregation of fuzzy opinions under group decision making. Fuzzy Sets Syst. 1996, 79, 279–285. [Google Scholar]
- Lee, H.S. Optimal consensus of fuzzy opinions under group decision making environment. Fuzzy Sets Syst. 2002, 132, 303–315. [Google Scholar] [CrossRef]
- Chen, S.-M. Aggregating fuzzy opinions in the group decision-making environment. Cyber. Syst. Int. J. 1998, 29, 363–376. [Google Scholar] [CrossRef]
- George, B.; Maria, B. Fuzzy set, Fuzzy logic, applications. In Advances in Fuzzy Systems-Applications and Theory; World Scientific Publishing CO.Pte.Ltd.: Singapore, 1995; Volume 5. [Google Scholar]
- Lu, C.; Lan, J.; Wang, Z. Aggregation of fuzzy opinions under group decision-making based on similarity and distance. J. Syst. Sci. Complex. 2006, 19, 63–71. [Google Scholar] [CrossRef]
- Saletic, D.Z.; Velasevic, D.M.; Mastorakis, N.E. Analysis of basic defuzzification techniques. In Proceedings of the 6th WSES International Multiconference on Circuits, Systems, Communications and Computers, Crete, Greece, 7–14 July 2002. [Google Scholar]
- Hsu, Y.-L.; Lee, C.-H.; Kreng, V.B. The application of Fuzzy Delphi Method and Fuzzy AHP in lubricant regenerative technology selection. Expert Syst. Appl. 2010, 37, 419–425. [Google Scholar] [CrossRef]
- Huck, S.W. Reading Statistics and Research, 6th ed.; Addison Wesley/Pearson: Boston, MA, USA, 2011. [Google Scholar]
- Taherdoost, H. Validity and reliability of the research instrument; How to test the validation of a questionnaire/survey in a research. Int. J. Acad. Res. Manag. 2016, 5, 28–36. [Google Scholar] [CrossRef]
- CSR Corporate Social Responsibility 2016 Report Public Information; Cisco Systems, Inc.: San Jose, CA, USA, 2016.
- Shuaib, M.; Seevers, D.; Zhang, X.; Badurdeen, F.; Rouch, K.E.; Jawahir, I.S. Product sustainability index (ProdSI). J. Ind. Ecol. 2014, 18, 491–507. [Google Scholar] [CrossRef]
- Ahmad, S.; Wong, K.Y. Sustainability assessment in the manufacturing industry: A review of recent studies. Benchmarking 2018, 25, 3162–3179. [Google Scholar] [CrossRef]
- Bolis, I.; Brunoro, C.M.; Sznelwar, L.I. Mapping the relationships between work and sustainability and the opportunities for ergonomic action. Appl. Ergon. 2014, 45, 1225–1239. [Google Scholar] [CrossRef]
- Zarte, M.; Pechmann, A.; Nunes, I.L. Indicators and goals for sustainable production planning and controlling from an ergonomic perspective. In Advances in Human Factors and Systems Interaction; Springer: New York, NY, USA, 2019; pp. 363–373. [Google Scholar]
- Thatcher, A. Green ergonomics: Definition and scope. Ergonomics 2013, 56, 389–398. [Google Scholar] [CrossRef]
- Hallstedt, S.I. Sustainability criteria and sustainability compliance index for decision support in product development. J. Clean. Prod. 2017, 140, 251–266. [Google Scholar] [CrossRef]
- Schuch Bork, C.A.; Fracaro de Souza, J.; de Oliveira Gomes, J.; Venancio Pappetti Canhete, V.; De Barba, D.J., Jr. Methodological tools for assessing the sustainability index (SI) of industrial production processes. Int. J. Adv. Manuf. Technol. 2016, 87, 1313–1325. [Google Scholar] [CrossRef]
- Hassan, M.F.; Saman, M.Z.M.; Sharif, S.; Omar, B. Sustainability evaluation of alternative part configurations in product design: Weighted decision matrix and artificial neural network approach. Clean Technol. Environ. Policy 2015, 18, 63–79. [Google Scholar] [CrossRef]
- Salvado, M.F.; Azevedo, S.; Matias, J.; Ferreira, L.M.D.F. Proposal of a sustainability index for the automotive industry. Sustainability 2015, 7, 2113–2144. [Google Scholar] [CrossRef]
- Hsu, C.-H.; Chang, A.-Y.; Luo, W. Identifying key performance factors for sustainability development of SMEs—Integrating QFD and fuzzy MADM methods. J. Clean. Prod. 2017, 161, 629–645. [Google Scholar] [CrossRef]
- Nicoletti, A., Jr.; de Oliveira, M.C.; Helleno, A.L. Sustainability evaluation model for manufacturing systems based on the correlation between triple bottom line dimensions and balanced scorecard perspectives. J. Clean. Prod. 2018, 190, 84–93. [Google Scholar] [CrossRef]
- Qorri, A.; Mujkić, Z.; Kraslawski, A. A conceptual framework for measuring sustainability performance of supply chains. J. Clean. Prod. 2018, 189, 570–584. [Google Scholar] [CrossRef]
- Matinaro, V.; Liu, Y.; Lee, T.-R.J.-S.; Poesche, J. Extracting key factors for sustainable development of enterprises: Case study of SMEs in Taiwan. J. Clean. Prod. 2019, 209, 1152–1169. [Google Scholar] [CrossRef]
- Hojnik, J.; Biloslavo, R.; Cicero, L.; Cagnina, M.R. Sustainability indicators for the yachting industry: Empirical conceptualization. J. Clean. Prod. 2020, 249, 119368. [Google Scholar] [CrossRef]
- Kishawy, H.A.; Hegab, H.; Saad, E. Design for sustainable manufacturing: Approach, implementation, and assessment. Sustainability 2018, 10, 3604. [Google Scholar] [CrossRef]
- Hristov, I.; Chirico, A. The role of sustainability key performance indicators (KPIs) in implementing sustainable strategies. Sustainability 2019, 11, 5742. [Google Scholar] [CrossRef]
© 2020 by the authors. Licensee MDPI, Basel, Switzerland. This article is an open access article distributed under the terms and conditions of the Creative Commons Attribution (CC BY) license (http://creativecommons.org/licenses/by/4.0/).