1. Introduction
With the deterioration of the ecological environment and resource depletion, promoting the electric vehicle (EV) industry development has been a new concentration for the auto industry, as it can significantly reduce the direct carbon emissions from petroleum [
1,
2,
3]. In recent years, the global EV market has been developing rapidly. According to BloombergNEF, the sales of passenger EVs were 450,000 in 2015 and jumped to 2.1 million in 2019, increasing by 3.7 times. Additionally, it is anticipated that 58% of global passenger vehicle sales will be electric by 2040 [
4].
China has the largest EV market globally, rising fast in both output and sales. From the supply side, China produced a total of 0.38 million new energy vehicles in 2015, and the annual production of new energy vehicles jumped to 1.24 million in 2019, according to the China Association of Automobile Manufacturers (CAAM). From the demand side, China takes the largest share of global EV sales. In 2015, China accounted for over 20% of global passenger EV sales, and that share has increased to 50% since 2017.
As the sales of EVs rapidly grow, the supply of the charging infrastructure still lags behind the demand. That is especially true for the public charging points and charging piles. As the number of EV owners with access to home charging options saturates, all countries are faced with the urgent need for more public charging infrastructure [
5]. According to BloombergNEF, about 12 million public charging points are needed globally.
In China, due to the world’s most massive EV sales and the seriously insufficient private parking spaces, promoting the public charging infrastructure is in particular crucial for the country’s booming EV industry. China’s governments have made great efforts and investments to enhance the construction of EV charging piles in public areas. The number of public charging piles has experienced a sharp increase from 0.05 million in 2015 to over 0.5 million in 2019, according to the China Electric Vehicle Charging Infrastructure Promotion Alliance (EVCIPA). However, even in 2019, the ratio of EV stocks to public charging pile stocks was still as high as 8.25, significantly restricting the development of the EV industry. The obstacle to EV development caused by insufficient charging infrastructure is not exclusive to China. It has been well-recognized by the literature across numerous countries [
6].
Existing studies will be reviewed before we put forward our research questions. With the booming of the EV industry, there is a growing literature on the electric vehicle market concerning the barriers to further develop the EV industry. For example, Adhikari et al. [
6] identified 17 barriers for EV promotion and divided them into five categories, covering the technical, policy, economic, infrastructure, and social barriers. Specifically, Yong and Park [
7] emphasized the role of policy supports, Vassileva and Campillo [
8] focused on the power system, Quak et al. [
9] and She et al. [
10] were concerned with the high purchase price and battery costs, Haddadian et al. [
11] discussed the regulatory framework, and Sierzchula et al. [
12] concluded that financial incentives and charging infrastructure are important.
These factors would restrict the development of the EV industry, mainly because they will suppress the user’s willingness to buy electric vehicles [
13]. According to the studies that focus on the factors affecting the intentions of consumers to buy electric vehicles from the demand perspective [
14,
15,
16], a bundle of factors—for example, the limited one-time travel distance with a full charge, the limited battery life [
17], the relatively high price [
18], the inaccessibility of the charging stations, and huge time cost to charge—will all affect the subjective cognition of consumers or, in other words, the user acceptance of electric vehicles.
Among all factors, the poorly developed charging infrastructure is widely recognized as one of the most critical barriers for consumers to purchase EVs across the world [
19]. However, for now, studies on EV charging infrastructure focus more on the optimal location choice of the charging stations using the methods of qualitative analysis [
20], quantitative analysis [
21,
22], case study [
23], theoretical analysis [
24,
25], or simulations [
26,
27,
28]. At least two essential research gaps are left to be filled. First, though it is intuitive that the charging infrastructure would affect the sales of electric vehicles, rare studies directly estimate the economic magnitude of that effect, which is vital for infrastructure investments and policy making. Second, many real-world obstacles to the construction and operation of the charging stations may be overlooked in the simulation—for example, whether there are sufficient parking spaces to install the parking facilities or not and if the property management company is willing to be engaged in the charging station operation. Understanding these obstacles is the key to identifying the “most feasible” locational choice based on the “optimal” one.
To fill the research gap and quantify the magnitude of the barrier for EV development from the charging infrastructure, this paper estimates the impact of the number of public charging piles on the sales of EVs in China using panel regression analysis. Based on the panel data provided by CAAM and EVCIPA, our regression results show that insufficient public charging piles would significantly limit the sales of EVs. One standard deviation change in the number of public charging piles would cause about a 13% standard deviation change in the EV sales rate in the next month. In addition, that impact would be more statistically significant as well as larger in magnitude if the public charging piles were built up for specific users or in cities in Eastern China. In addition, we conducted a field survey by randomly selecting 101 communities in Beijing, China, to explore the reasons that restrict the construction or operation of the public charging piles. The survey shows that, for now, it is more feasible to install public charging piles in the residential and the government communities. However, office buildings and shopping malls have a higher potential to be the public areas to install charging infrastructure after breaking down the barriers. The top four barriers are limited parking spaces, complicated circuit modification, unclear responsibilities for the property management company (PMC), and the objection or high mobility of existing parking space users.
The rest of this paper has four sections.
Section 2 describes the empirical strategies and data.
Section 3 reports the regression results of the impact of charging pile availability on EV sales.
Section 4 shows the field survey design and findings of the restrictions on charging pile availability.
Section 5 concludes the paper.
3. Impact of Public Charging Pile Availability on EV Sales
3.1. Baseline Results
Columns 1 and 2 in
Table 2 show the results of the regression of Equation (1), without or with control variables, respectively. The interested coefficient of
was 0.008, which was statistically significant at a 99% confidence level. That indicates that the availability of public charging piles had significantly positive effects on EV sales. In other words, insufficient public charging piles would significantly restrict the demand for electric vehicles.
The relative effect of on EV sales was 0.015, which means one standard deviation change in the number of public charging piles would cause about a 1.5% standard deviation change in the sales of electric vehicles in the next month.
In Columns 3 and 4, we modified Equation (1) using the EV sales rate (i.e., the ratio of EV sales to EV production) as the dependent variable and reported the regression results. The interested coefficient of was still significantly positive. The relative effect of on the EV sales rate was about 0.13, which indicates that one standard deviation change in the number of public charging piles would cause about a 13% standard deviation change in the EV sales rate in the next month.
3.2. Results of Two Types of Public Charging Piles
In China, there are two types of public charging piles: one is for unspecific or public use and the other is for particular or private use. According to EVCIPA, by the end of 2019, 80% of public charging piles were for unspecific use in China, and those for private use accounted for 20%. To understand the impact of different types of charging piles on the EV industry development, we ran the regression using the number of public charging piles for public use () and that for private use (, respectively.
Table 3 shows the results. Generally, both types of public charging piles had significantly positive effects on the sales and sales rate of EVs. In contrast, the magnitude of the effects of piles for private use was larger than that of piles for public use. For example, one standard deviation change in the number of public charging piles for public use would cause about a 10% standard deviation change in the EV sales rate in the next month (Column 2), while that number was as high as 23% for the public charging piles for private use (Column 4). That means that sufficient public charging piles are helpful for increasing the demand for electric vehicles, and that contribution would be larger in magnitude if the public charging piles were built up for specific users.
3.3. Heterogeneity Analysis
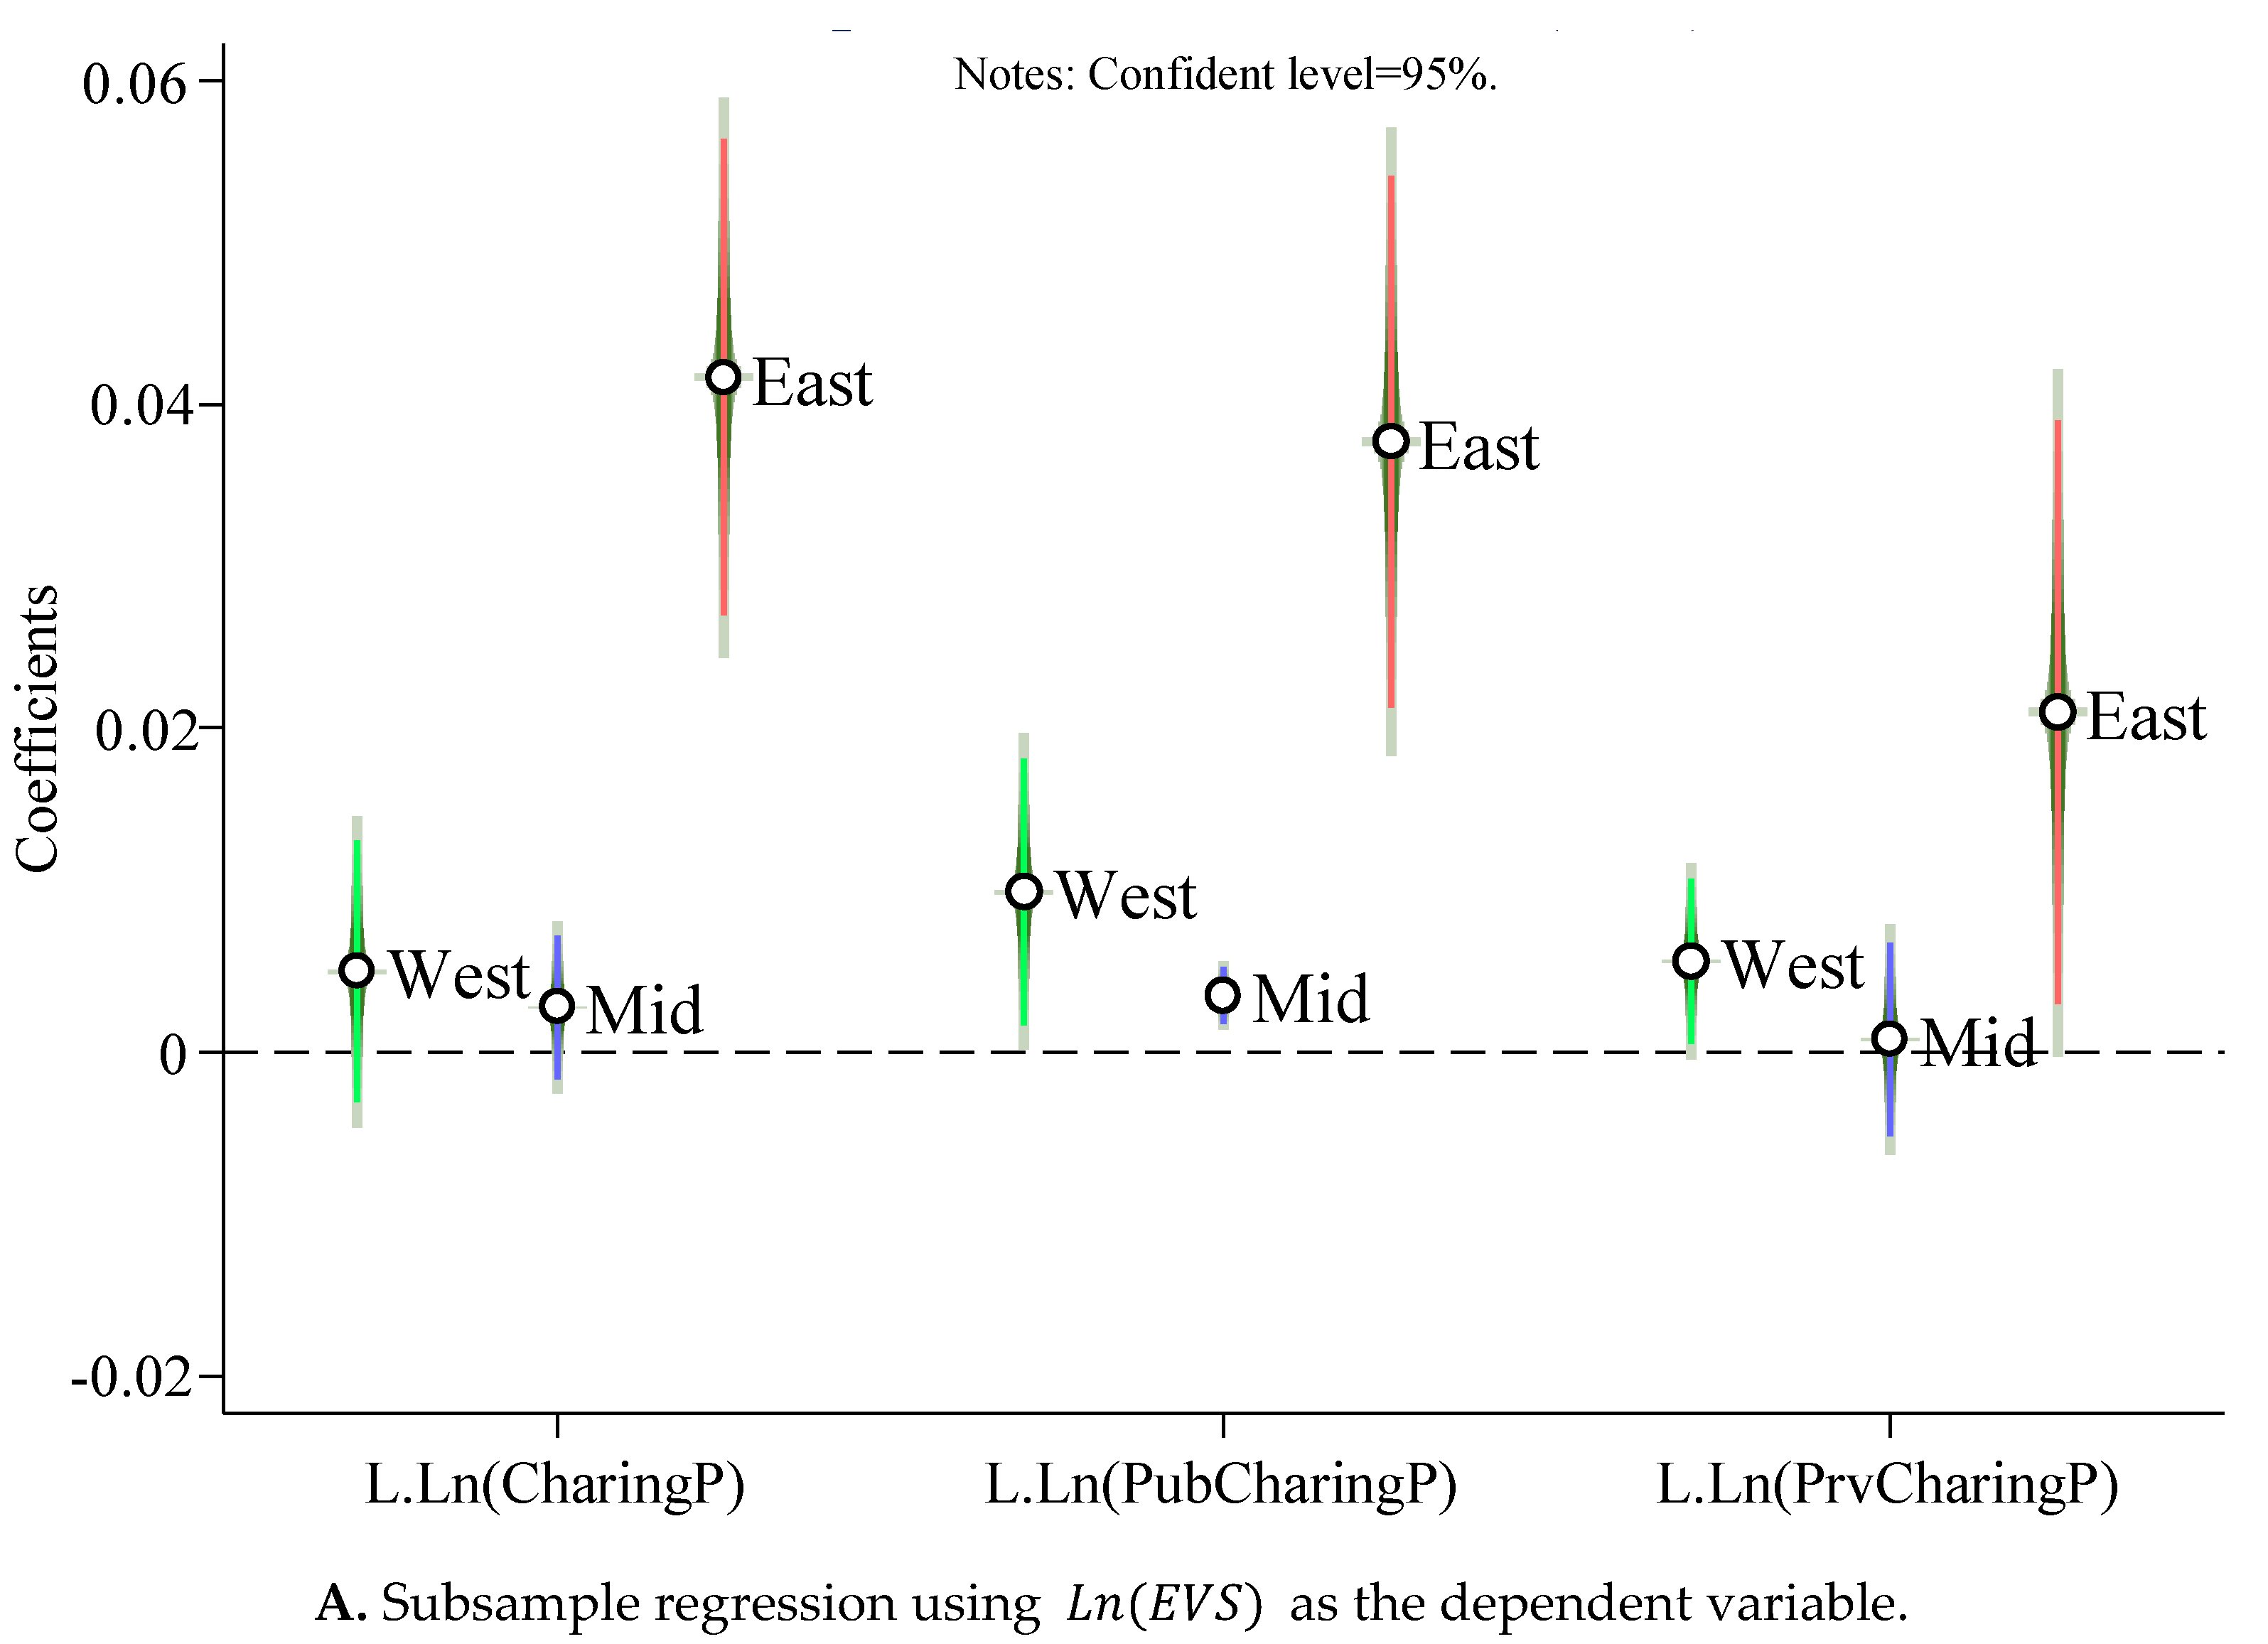
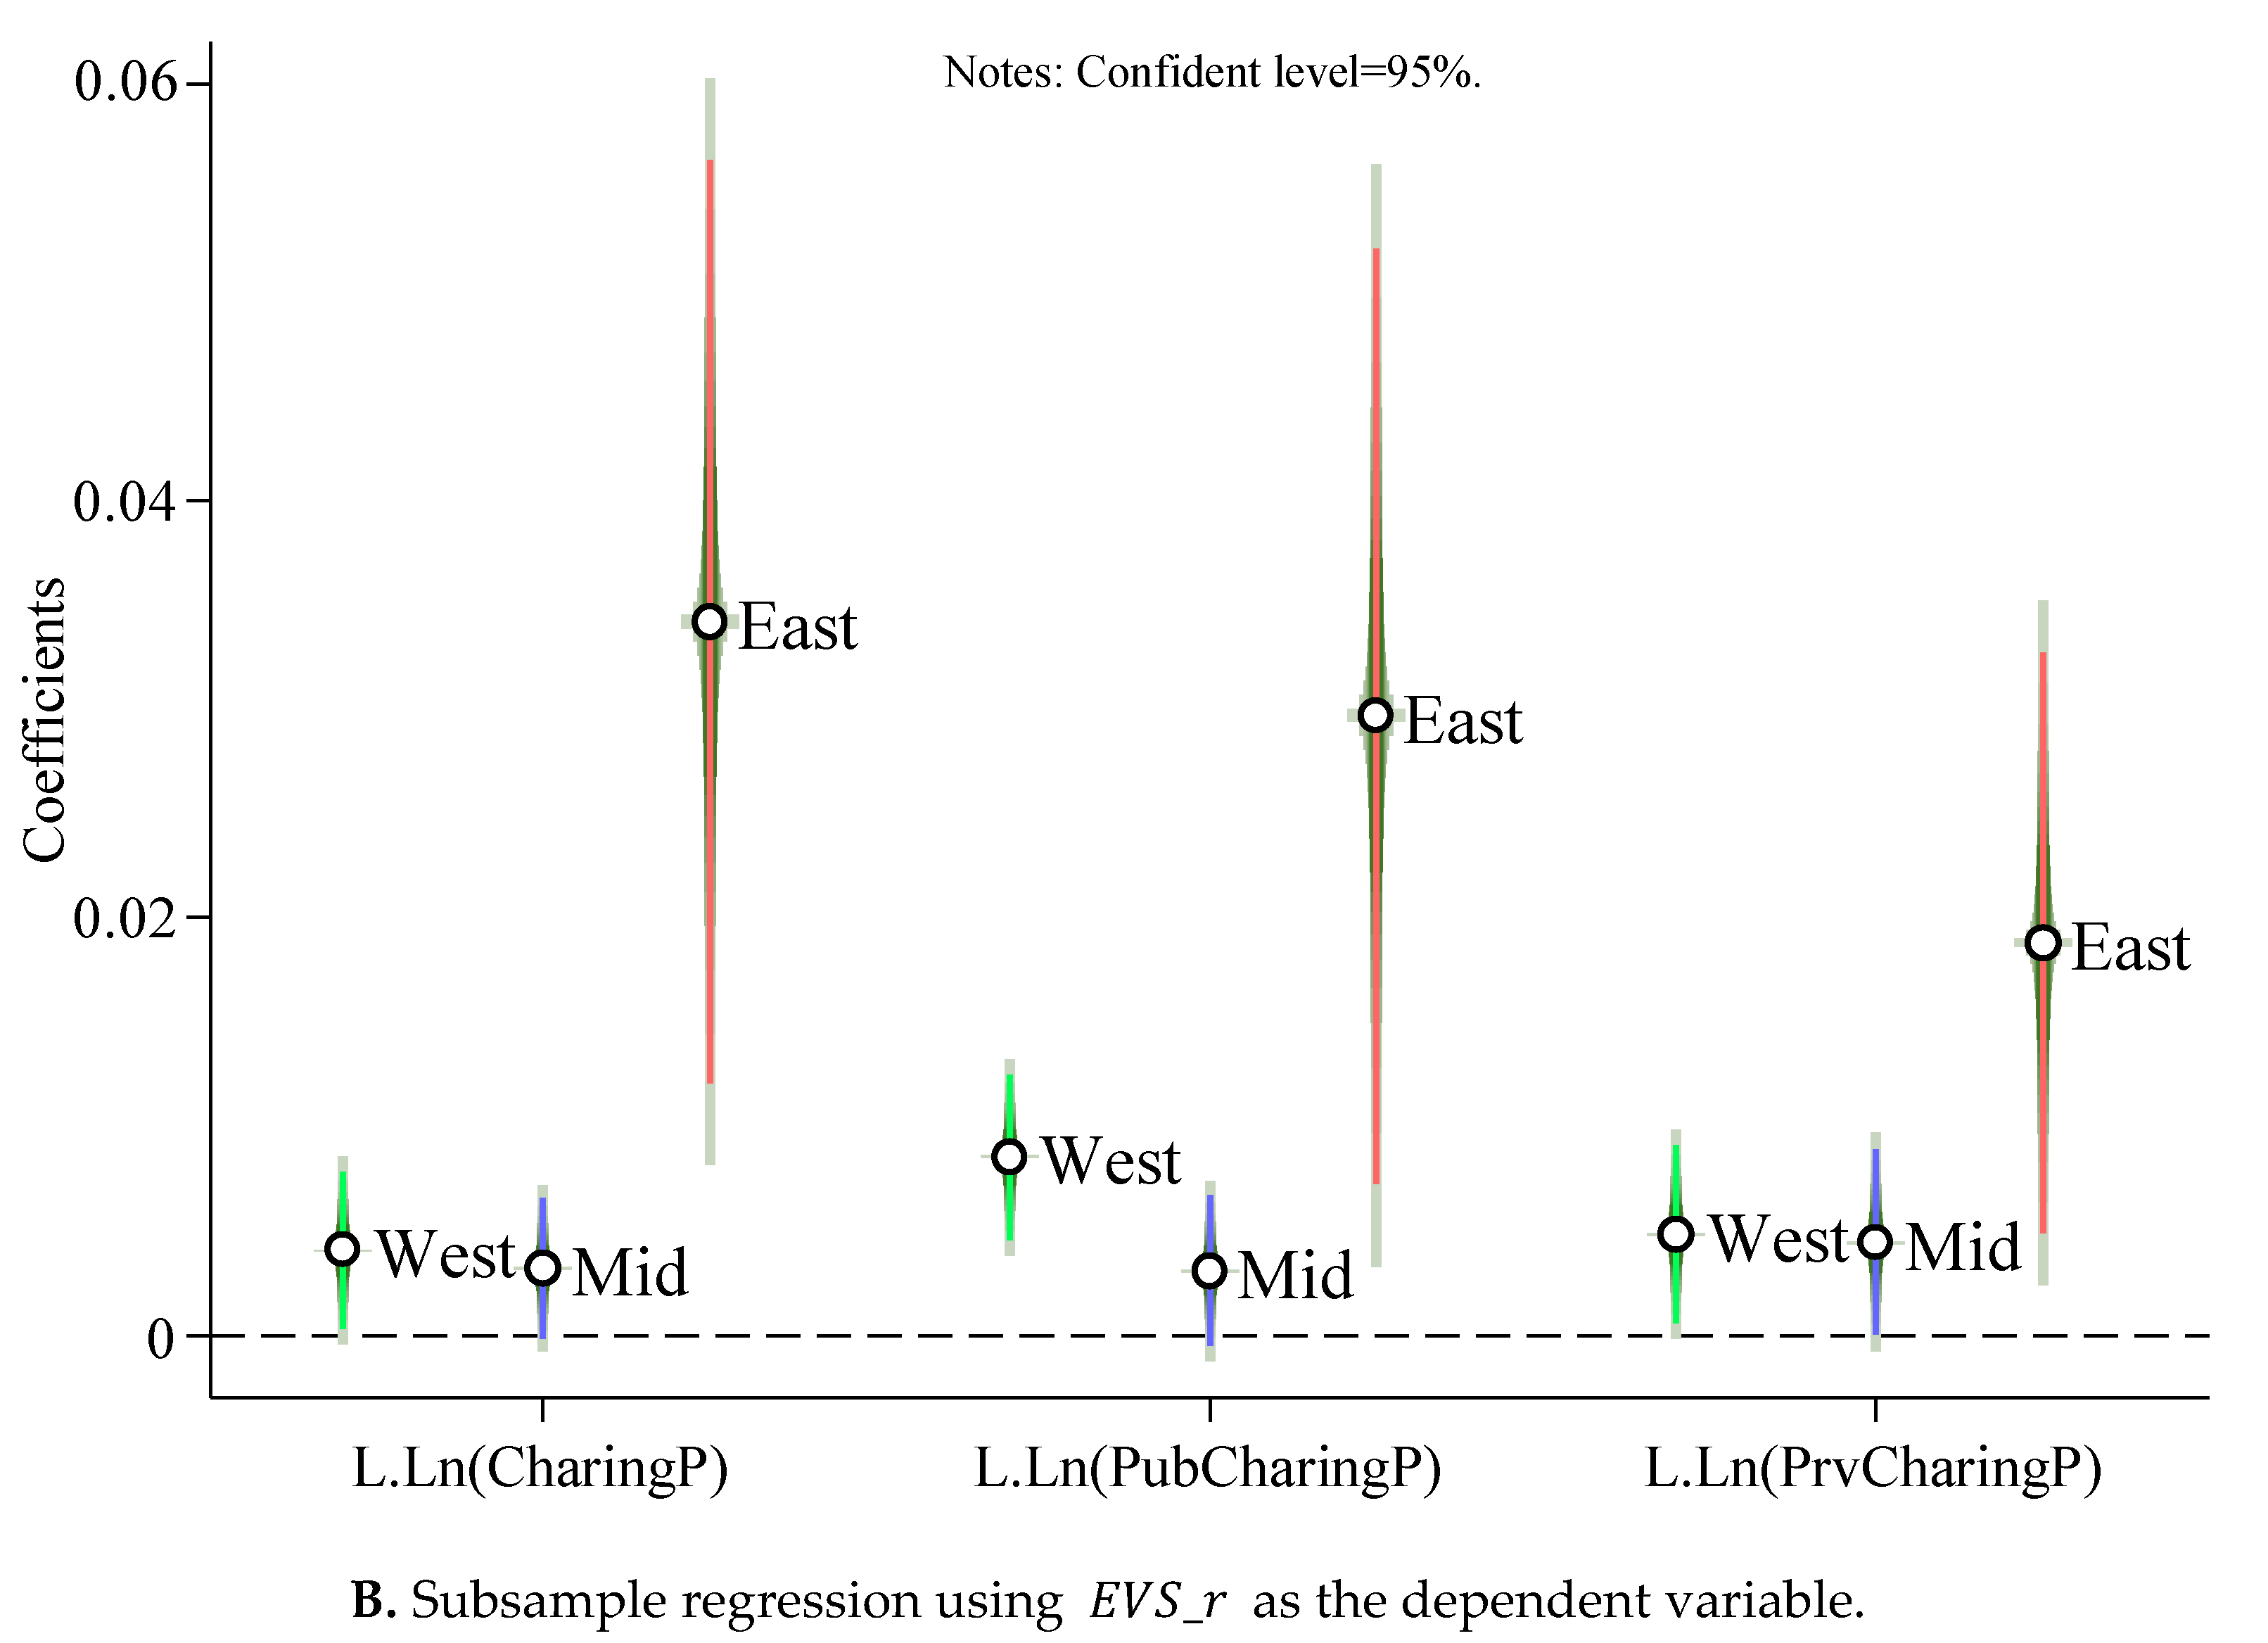
The impacts of public charging piles on the demand for EVs may be different in different regions due to the unequal population density and EV-to-pile ratios in China. We thus reran the regressions for subsamples in different regions, i.e., Eastern China, Mid China, and Western China, to investigate the heterogeneity.
There are 12 provinces and municipalities in Eastern China, namely, Liaoning, Beijing, Tianjin, Shanghai, Hebei, Shandong, Jiangsu, Zhejiang, Fujian, Guangdong, Guangxi, and Hainan. Nine provinces are in Mid China: Heilongjiang, Jilin, Shaanxi, Inner Mongolia, Anhui, Henan, Hunan, Hubei, and Jiangxi. The other 10 provinces and municipalities are in Western China: Chongqing, Sichuan, Yunnan, Guizhou, Xizang, Shanxi, Gansu, Qinghai, Ningxia, and Xinjiang.
Figure 1 plots the coefficients. The dependent is
in Panel A and
. in Panel B. The first important conclusion that could be drawn from
Figure 1 is that the subsample regression results are comparable with our baseline results that the number of public charging piles had significantly positive effects on the EV sales and sales rate in all regions.
In addition, by contrast, the impacts of the availability of public charging piles were much more significant and larger in magnitude in Eastern China than those in Mid and Western China. That means that in Eastern China, the insufficient public charging piles would have more severe restrictions on the demand for EVs. That is intuitive because the population density is larger and the economy is more developed in Eastern China, which means the per capita parking spaces are fewer and the demand for public parking and charging is larger.
The findings in this section reveal the heterogeneous impacts in different regions. More importantly, they also suggest that with the EV sales increasing as well as the private charging piles being saturated, the impact of the public charging piles would be more significant and larger in magnitude. The full regression result tables are available upon request.
4. Barriers to the Availability of Public Charging Piles
4.1. Questionnaire Survey
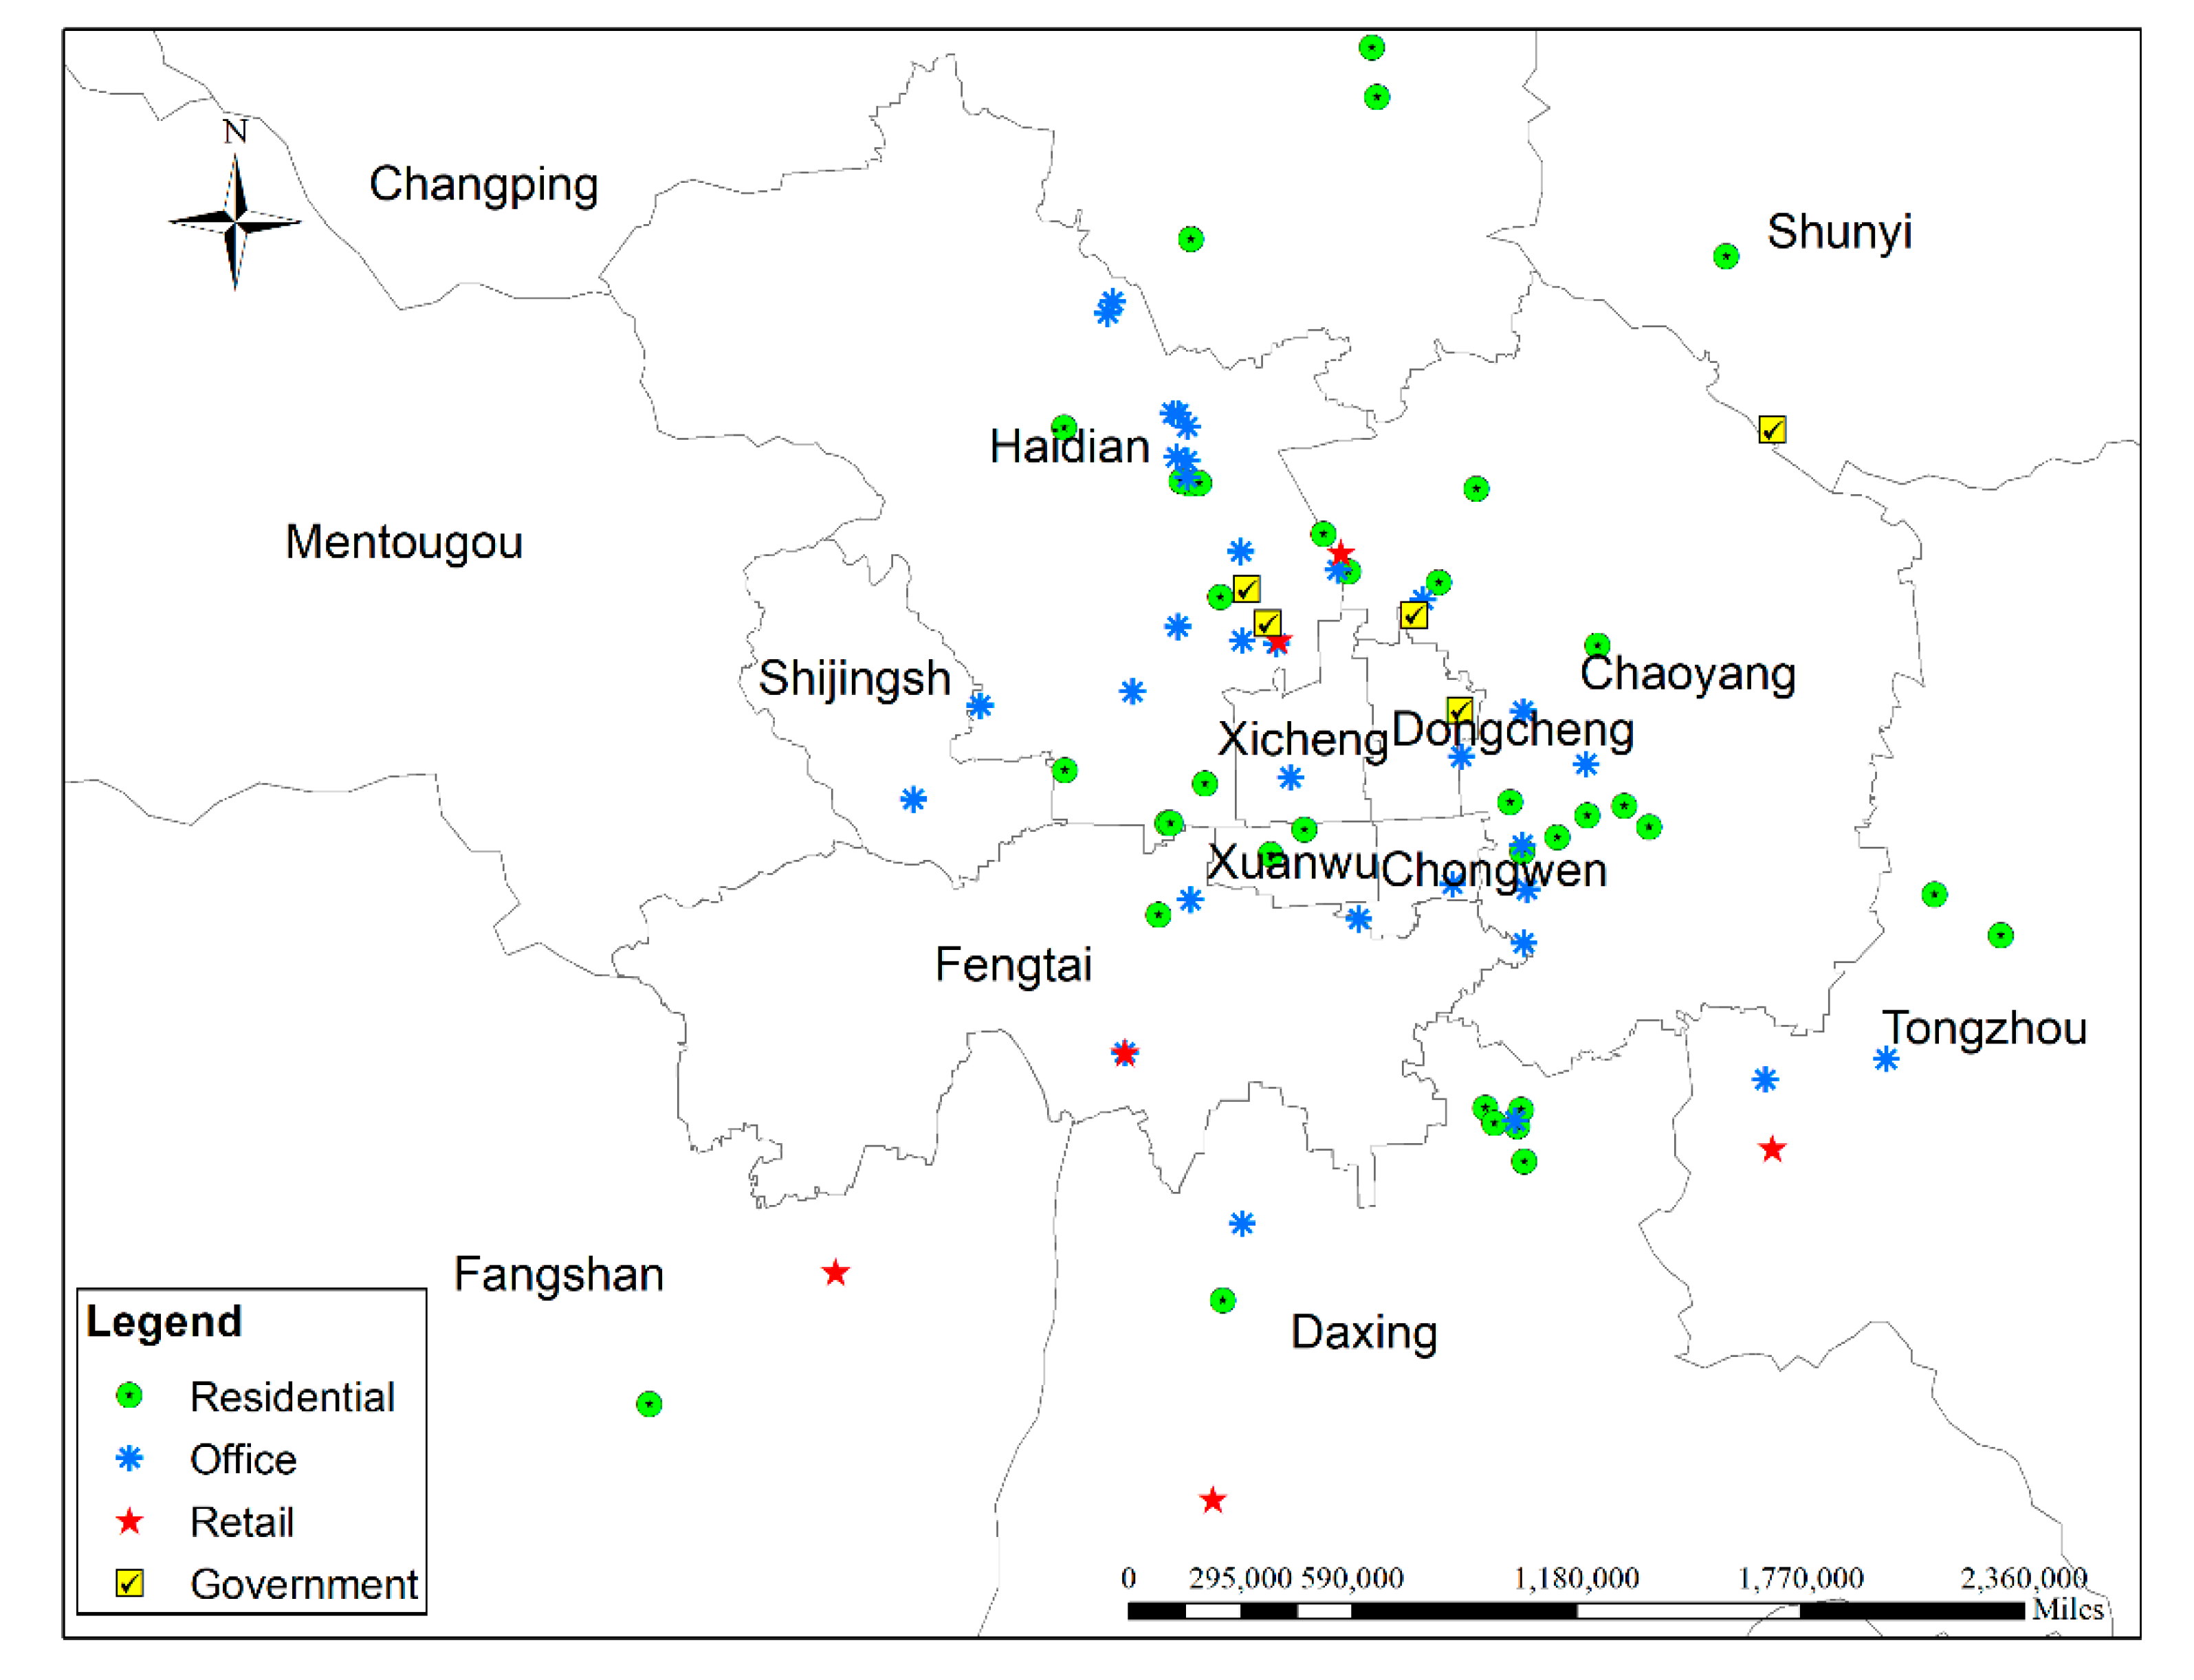
To explore the barriers to the installation and operation of public EV charging piles, we organized a field survey in Beijing, China. As discussed in the last section, the demand for electric vehicles is more sensitive to the availability of public charging piles in cities in Eastern China, among which Beijing may rank on top, as private parking spaces and private charging points are in extremely short supply. Understanding the challenges Beijing faces when installing public EV charging piles would provide important implications for other provinces and cities and the country as a whole.
The survey was conducted in several phases. In the first step, the sample scale was decomposed into four categories, namely, residential communities, office buildings, retail buildings, and government communities. Second, the name list of all communities or buildings in each category was collected. In the third step, the communities or buildings that were not suitable for the research were excluded. For example, as public charging piles are more needed in the inner-city districts, communities in the suburbs (i.e., Chanping district, Yanqing district, Mentougou district) were not included in the survey. In addition, we needed to interview the manager of the PMC for each community with the help of the Beijing Property Management Association (BPMA); therefore, we only considered the communities that had membership in the BPMA. In the last step, samples were randomly selected in each category for the field survey. Finally, hundreds of communities and buildings were selected, and 101 of them answered our survey. Others did not answer our survey for several reasons, and the most common one was that the PMC manager was not available for the interview.
The 101 samples were representative and randomly selected, including 46 residential communities, 39 office buildings, 10 retail buildings, and 6 properties of government and public institutions in 13 Beijing districts.
Figure 2 shows the spatial distribution of these properties.
For each community, we collected four aspects of information related to the construction and operation of public charging piles by interviewing the manager of the PMC: first, the parking spaces; second, the electric distribution system; third, the PMCs’ acceptance and factors that affect their willingness to install and operate the public charging points in their communities; and fourth, the stakeholders’ acceptance of the installation of the public charging points in their communities.
Given the different features of the four types of communities that would affect the availability of the public charging piles, the survey questions were designed differently. For example, for the “stakeholder”, it indicated the residents in the residential communities, the workers in the office buildings, the consumers in the retail buildings, and the owner or the government institutions in charge of the government communities. The detailed questionnaires are available upon request.
4.2. General Acceptance
In the first step, we investigated the PMC managers’ acceptance of the EV charging pile construction. The survey question was, “Do you think it is feasible to install public charging piles in your community for now?”
Table 4 reports the general attitudes of the PMC managers towards the installation of public charging piles in their communities. Thirty-four percent of PMC managers of the residential communities and 33% of PMC managers of the government communities held that public charging pile installation was infeasible. That number for the office buildings and the retail buildings was 8% and 20%, respectively.
However, for the office buildings and the retail buildings, the installation of charging piles was mostly “conditionally feasible”. For the office buildings, 60% of PMC managers held that the type of parking spaces determined the feasibility of the installation of charging piles, and reconstruction of the parking spaces was necessary for the installation. Similarly, 40% of PMC managers thought reconstruction of the parking spaces was necessary for the retail buildings.
The installation of public charging piles was totally feasible for only 32% of the office buildings and 40% of the retail buildings and over 60% of the residential and the government communities.
Therefore, it is more feasible to install the public charging piles in the residential and the government communities given the current situation. However, the office buildings and retail buildings have a higher potential to be the place to install the public charging piles after breaking down the barriers.
4.3. Barriers to the Availability of Public Charging Piles
We then investigated why the PMC managers held that it was “infeasible” to understand the obstacles for PMC managers to accept the installation of charging piles in over 30% of residential and government communities. We also evaluated the possibility of improving the parking space conditions to install more charging piles in the office and retail buildings.
Four aspects of barriers were considered, including the parking spaces, the electric power system, and the willingness of PMCs and other stakeholders.
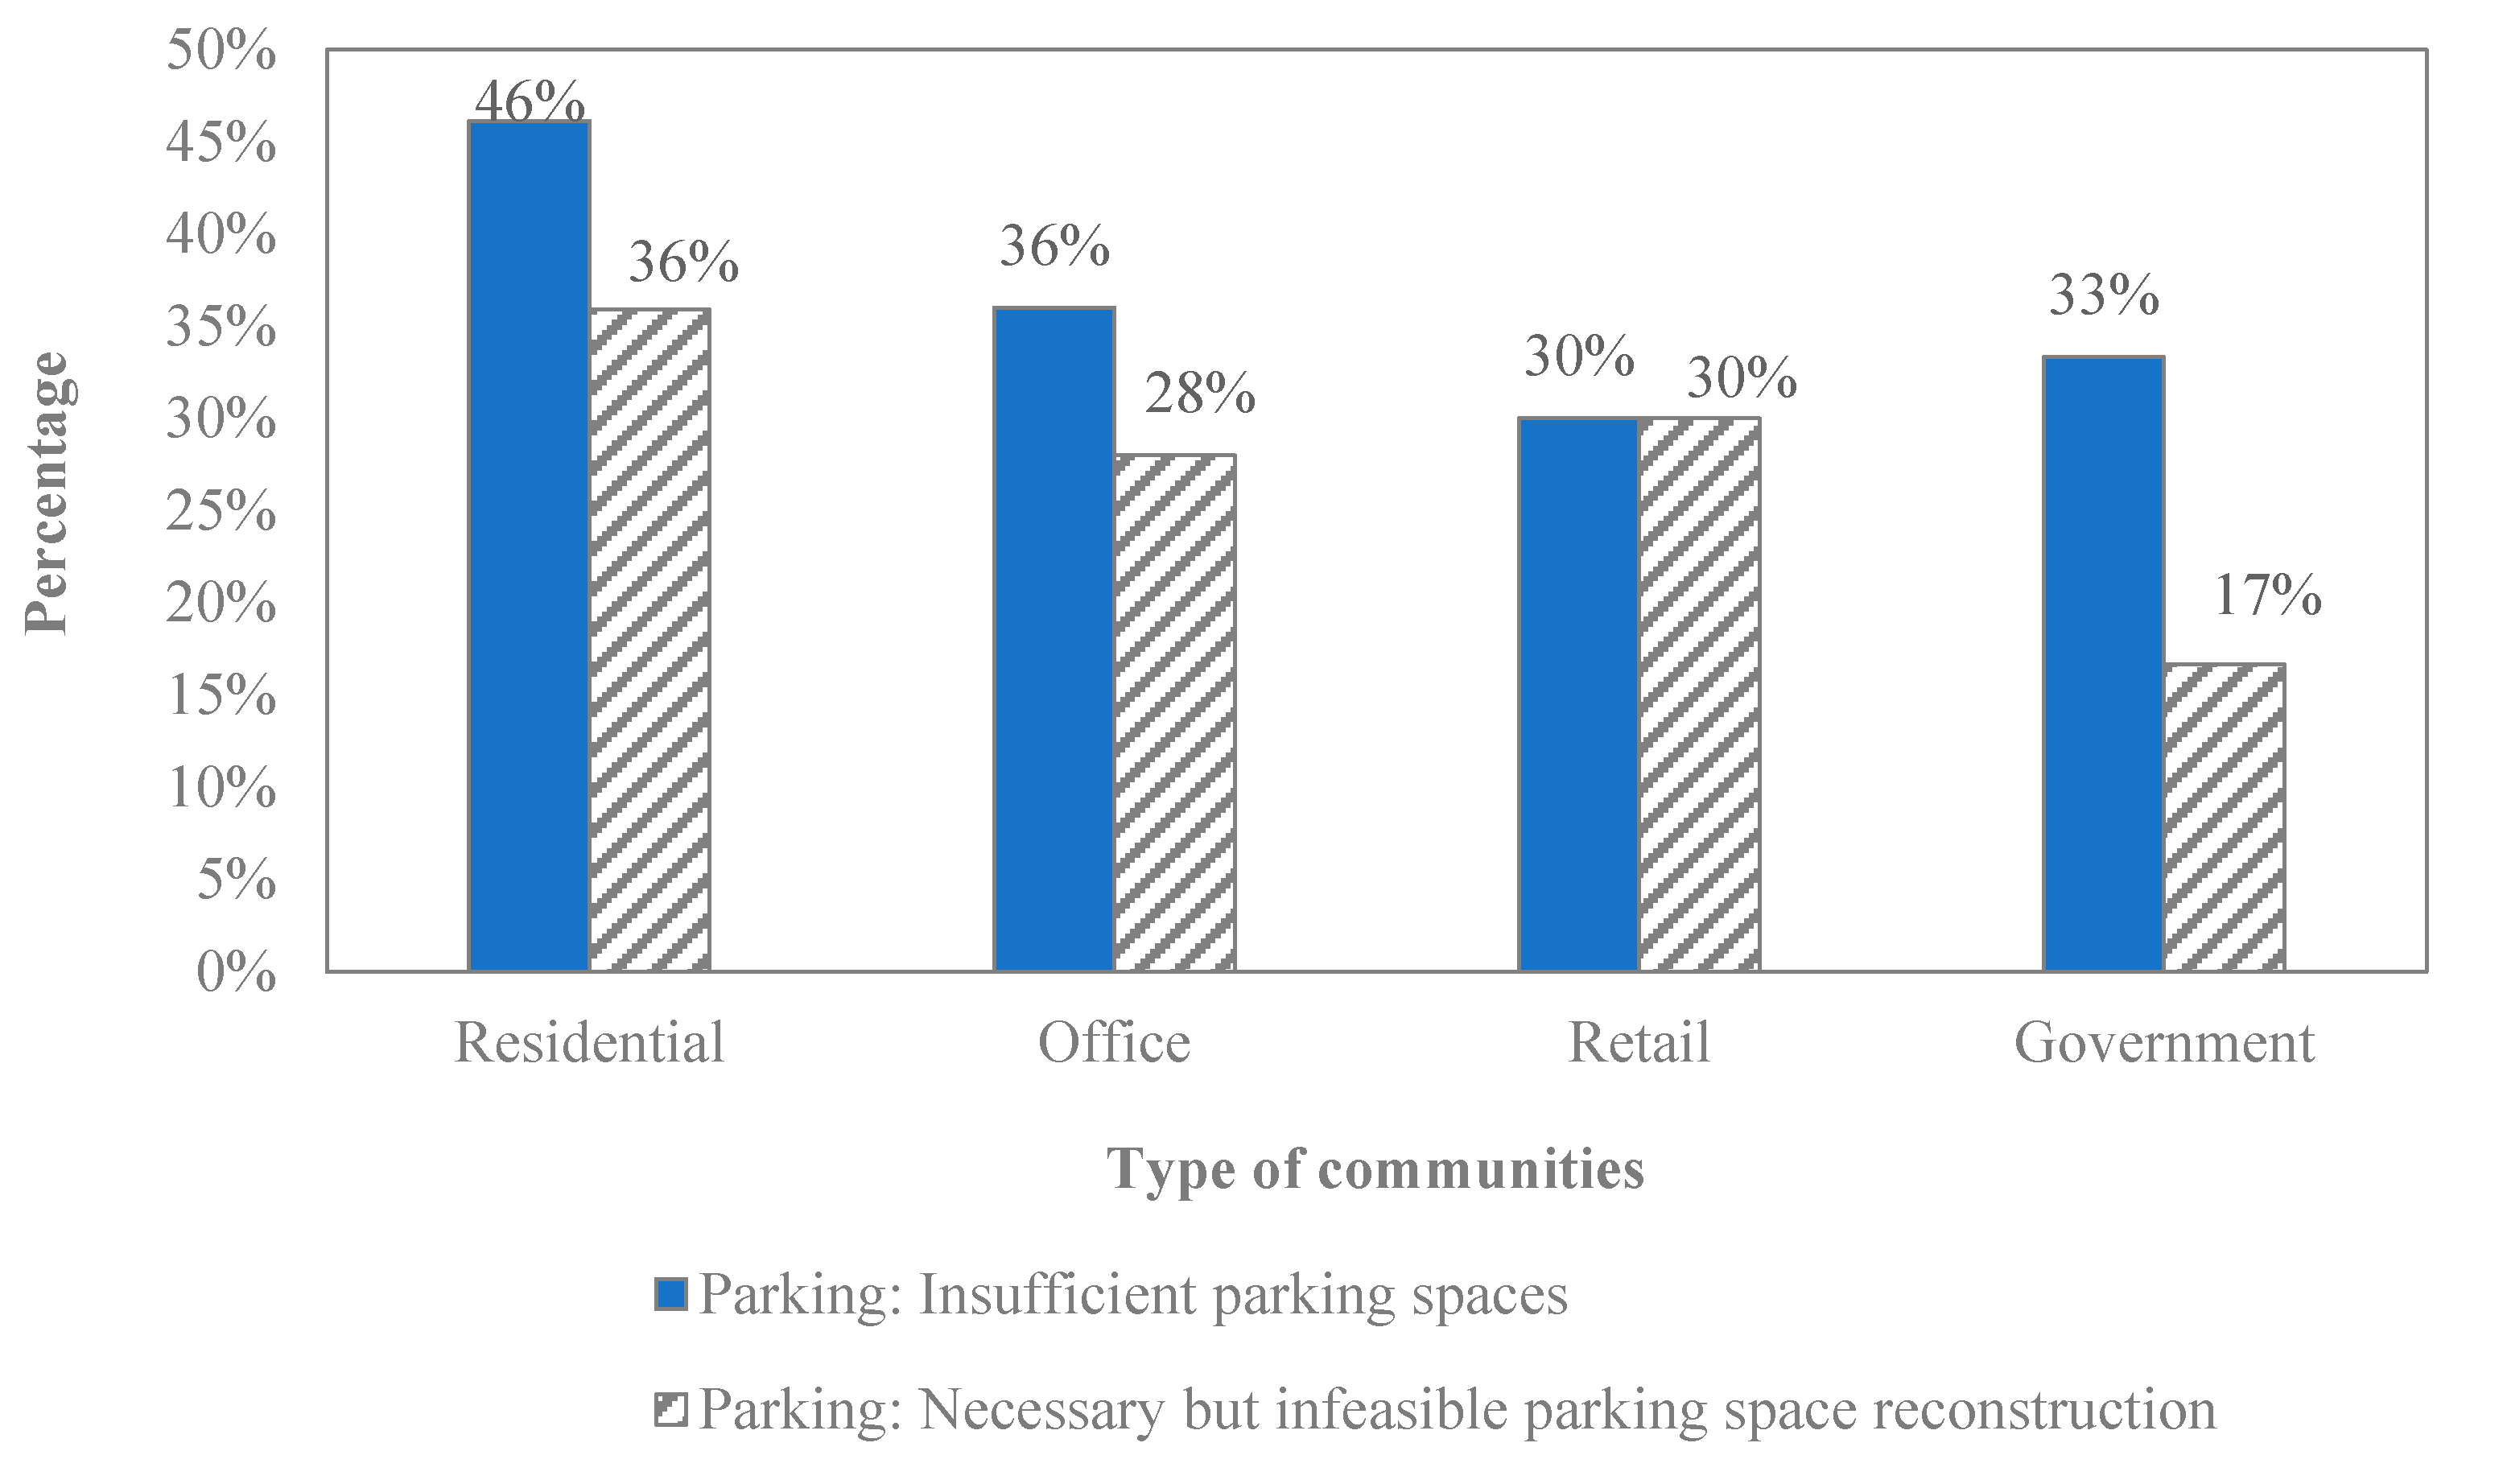
4.3.1. Parking Spaces
Two barriers related to the parking spaces would be a concern for installing the public charging piles. First, the parking spaces are always fully occupied. Insufficient parking spaces mean there is no space to install the charging piles, in particular the public ones. Second, reconstructing the parking space is necessary for the charging piles’ installation, but it is economically or technologically infeasible.
As shown in
Figure 3, over 30% of all types of communities were faced with the obstacle of insufficient parking spaces, and that number was as high as 46% for the residential communities. Worse still, parking space reconstruction was infeasible for 36% of residential communities and about 30% of office and retail buildings. That situation was better for the governmental communities, of which only 17% were faced with the obstacle of infeasible parking space reconstruction.
In comparison, residential communities were most constrained by parking spaces. On average, 40% of all communities were faced with the barrier of limited parking spaces, and 31% of the other communities, although they had enough parking spaces, had the obstacle of infeasible parking space reconstruction.
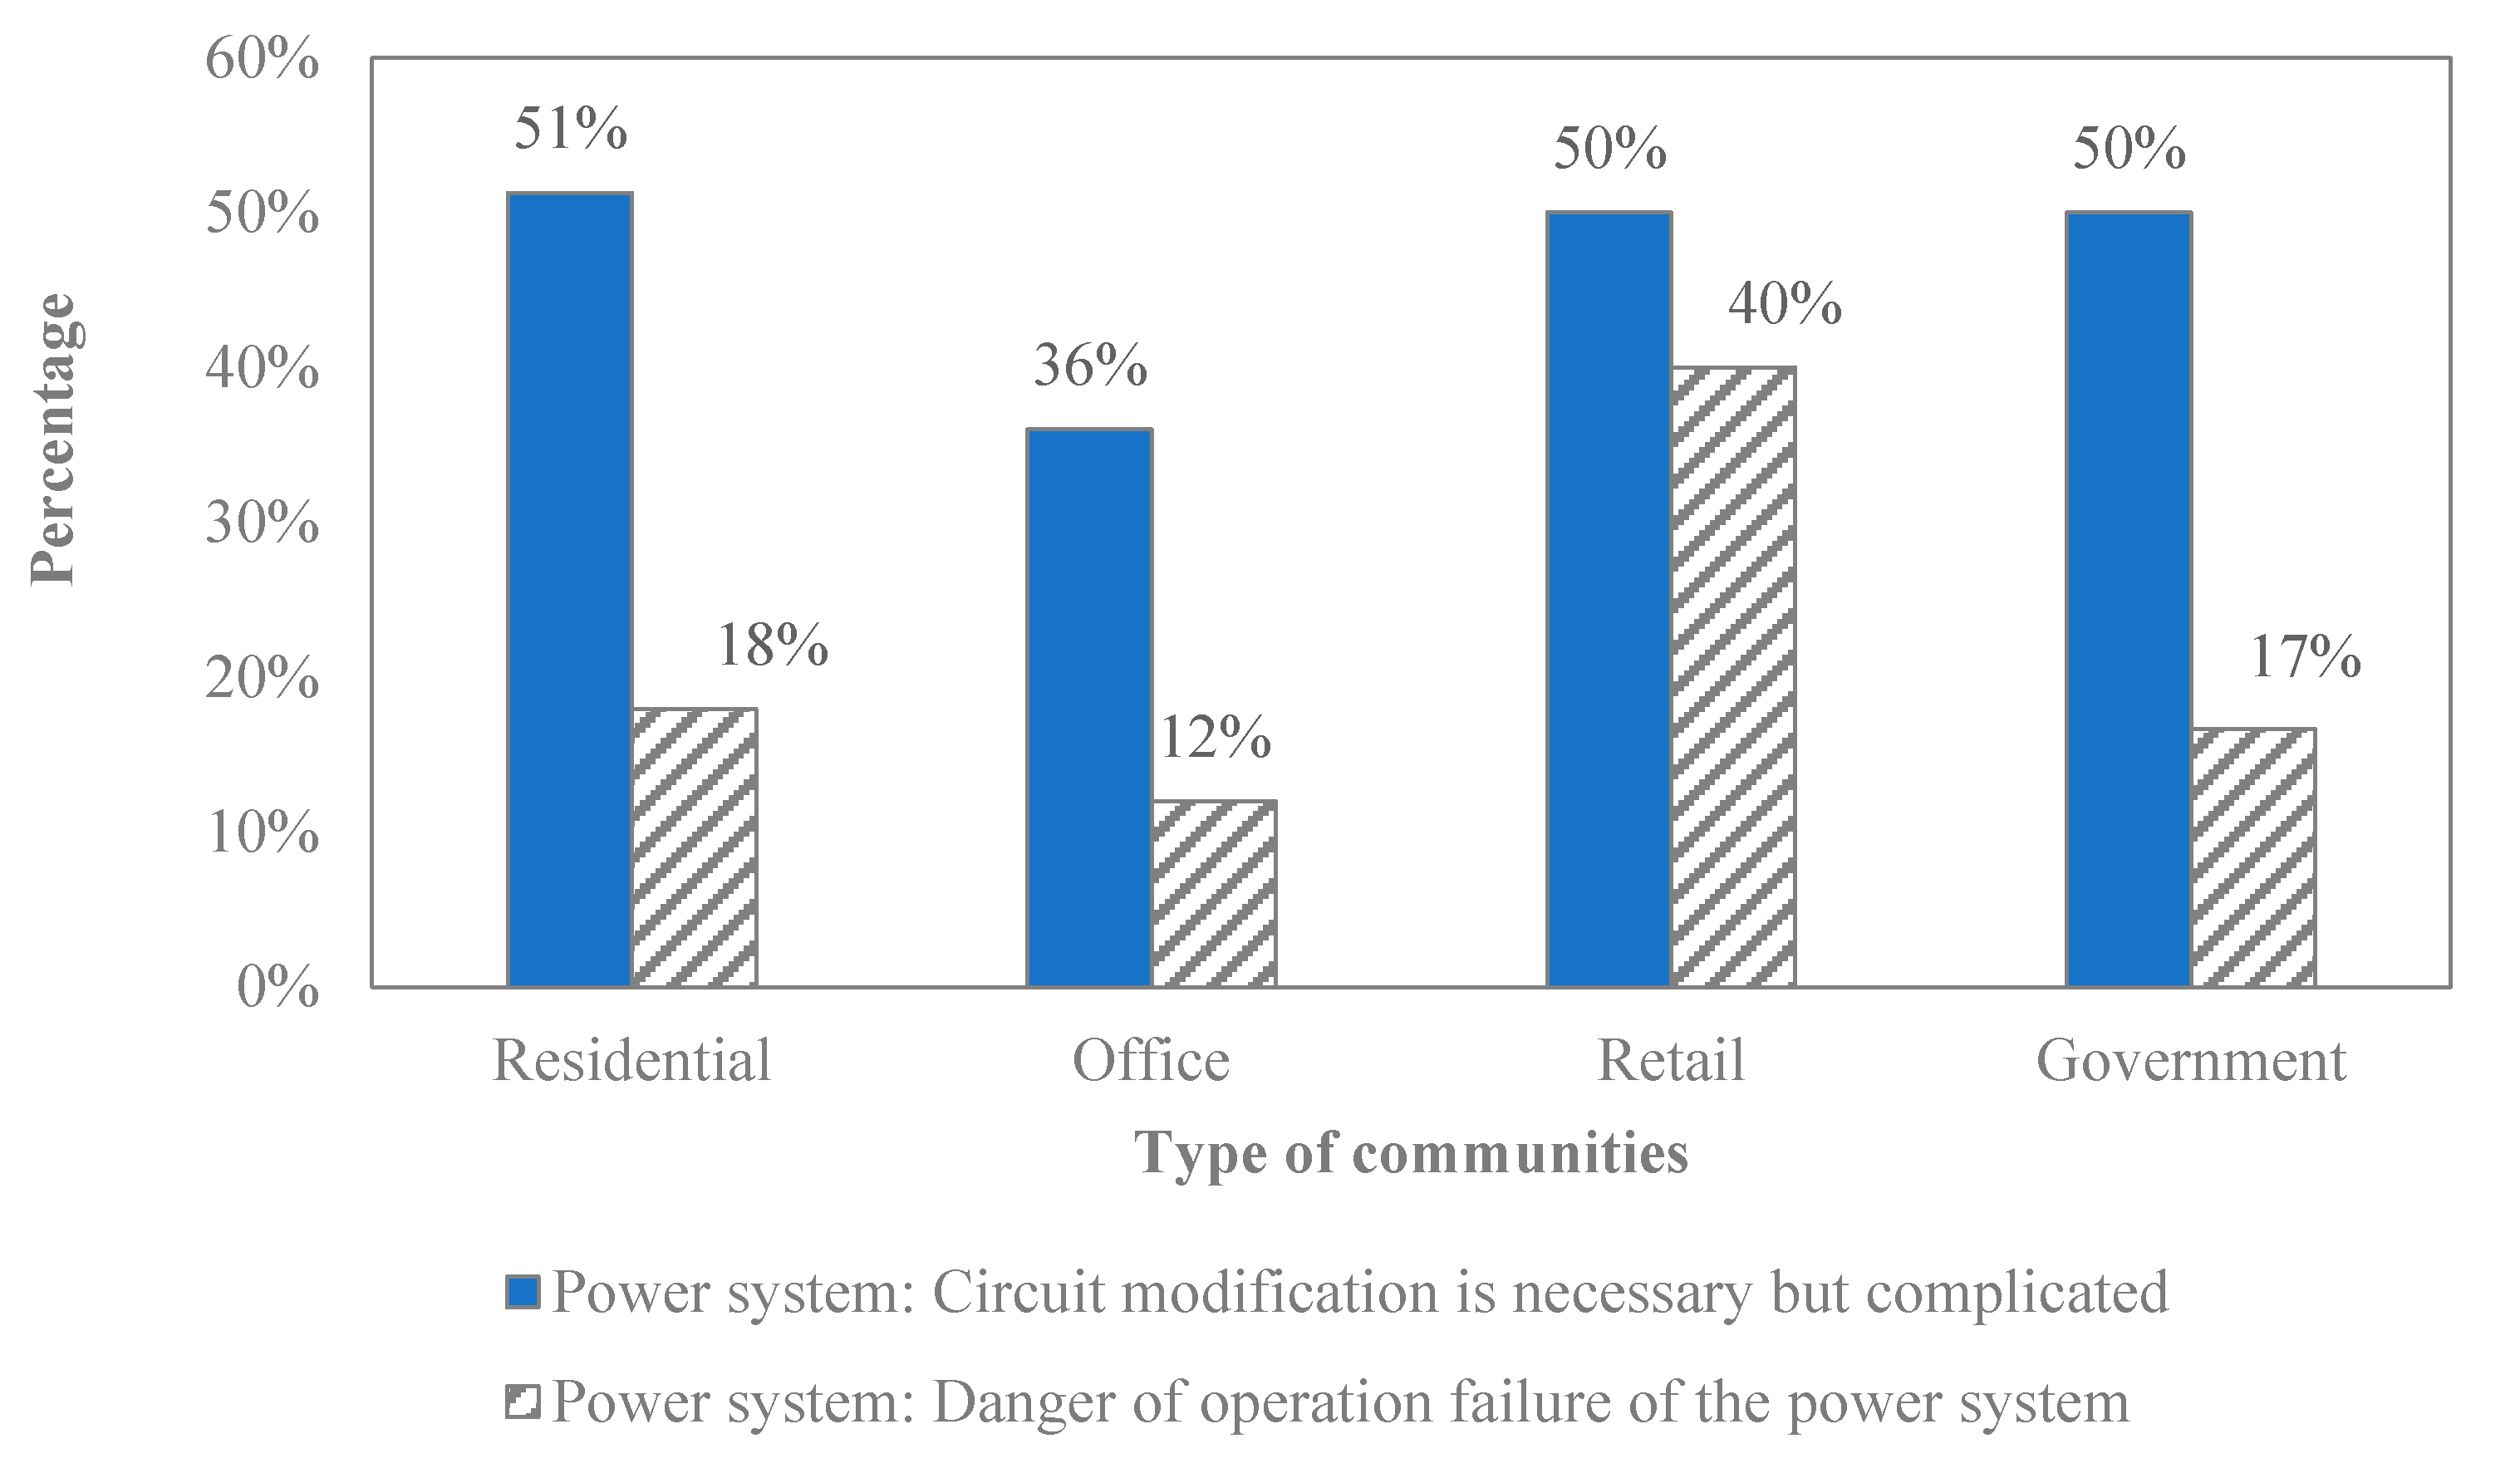
4.3.2. Electric Power System
A stable electric power system and some circuit modifications are also necessary for the operation of public charging piles. Our survey results show that, for 36% of the office buildings and about 50% of other communities, circuit modification was necessary but complicated, which is one barrier for the operation of public charging infrastructure (
Figure 4). In addition, for 40% of the retail buildings, there was another barrier: operating the public charging piles may cause the operation failure of the power system.
In comparison, the retail buildings were most constrained by the electric power system. On average, 45% of all communities were faced with the barrier of necessary but complicated circuit modification, and 18% of them were also faced with the barrier of the unstable power system.
4.3.3. Willingness of PMC
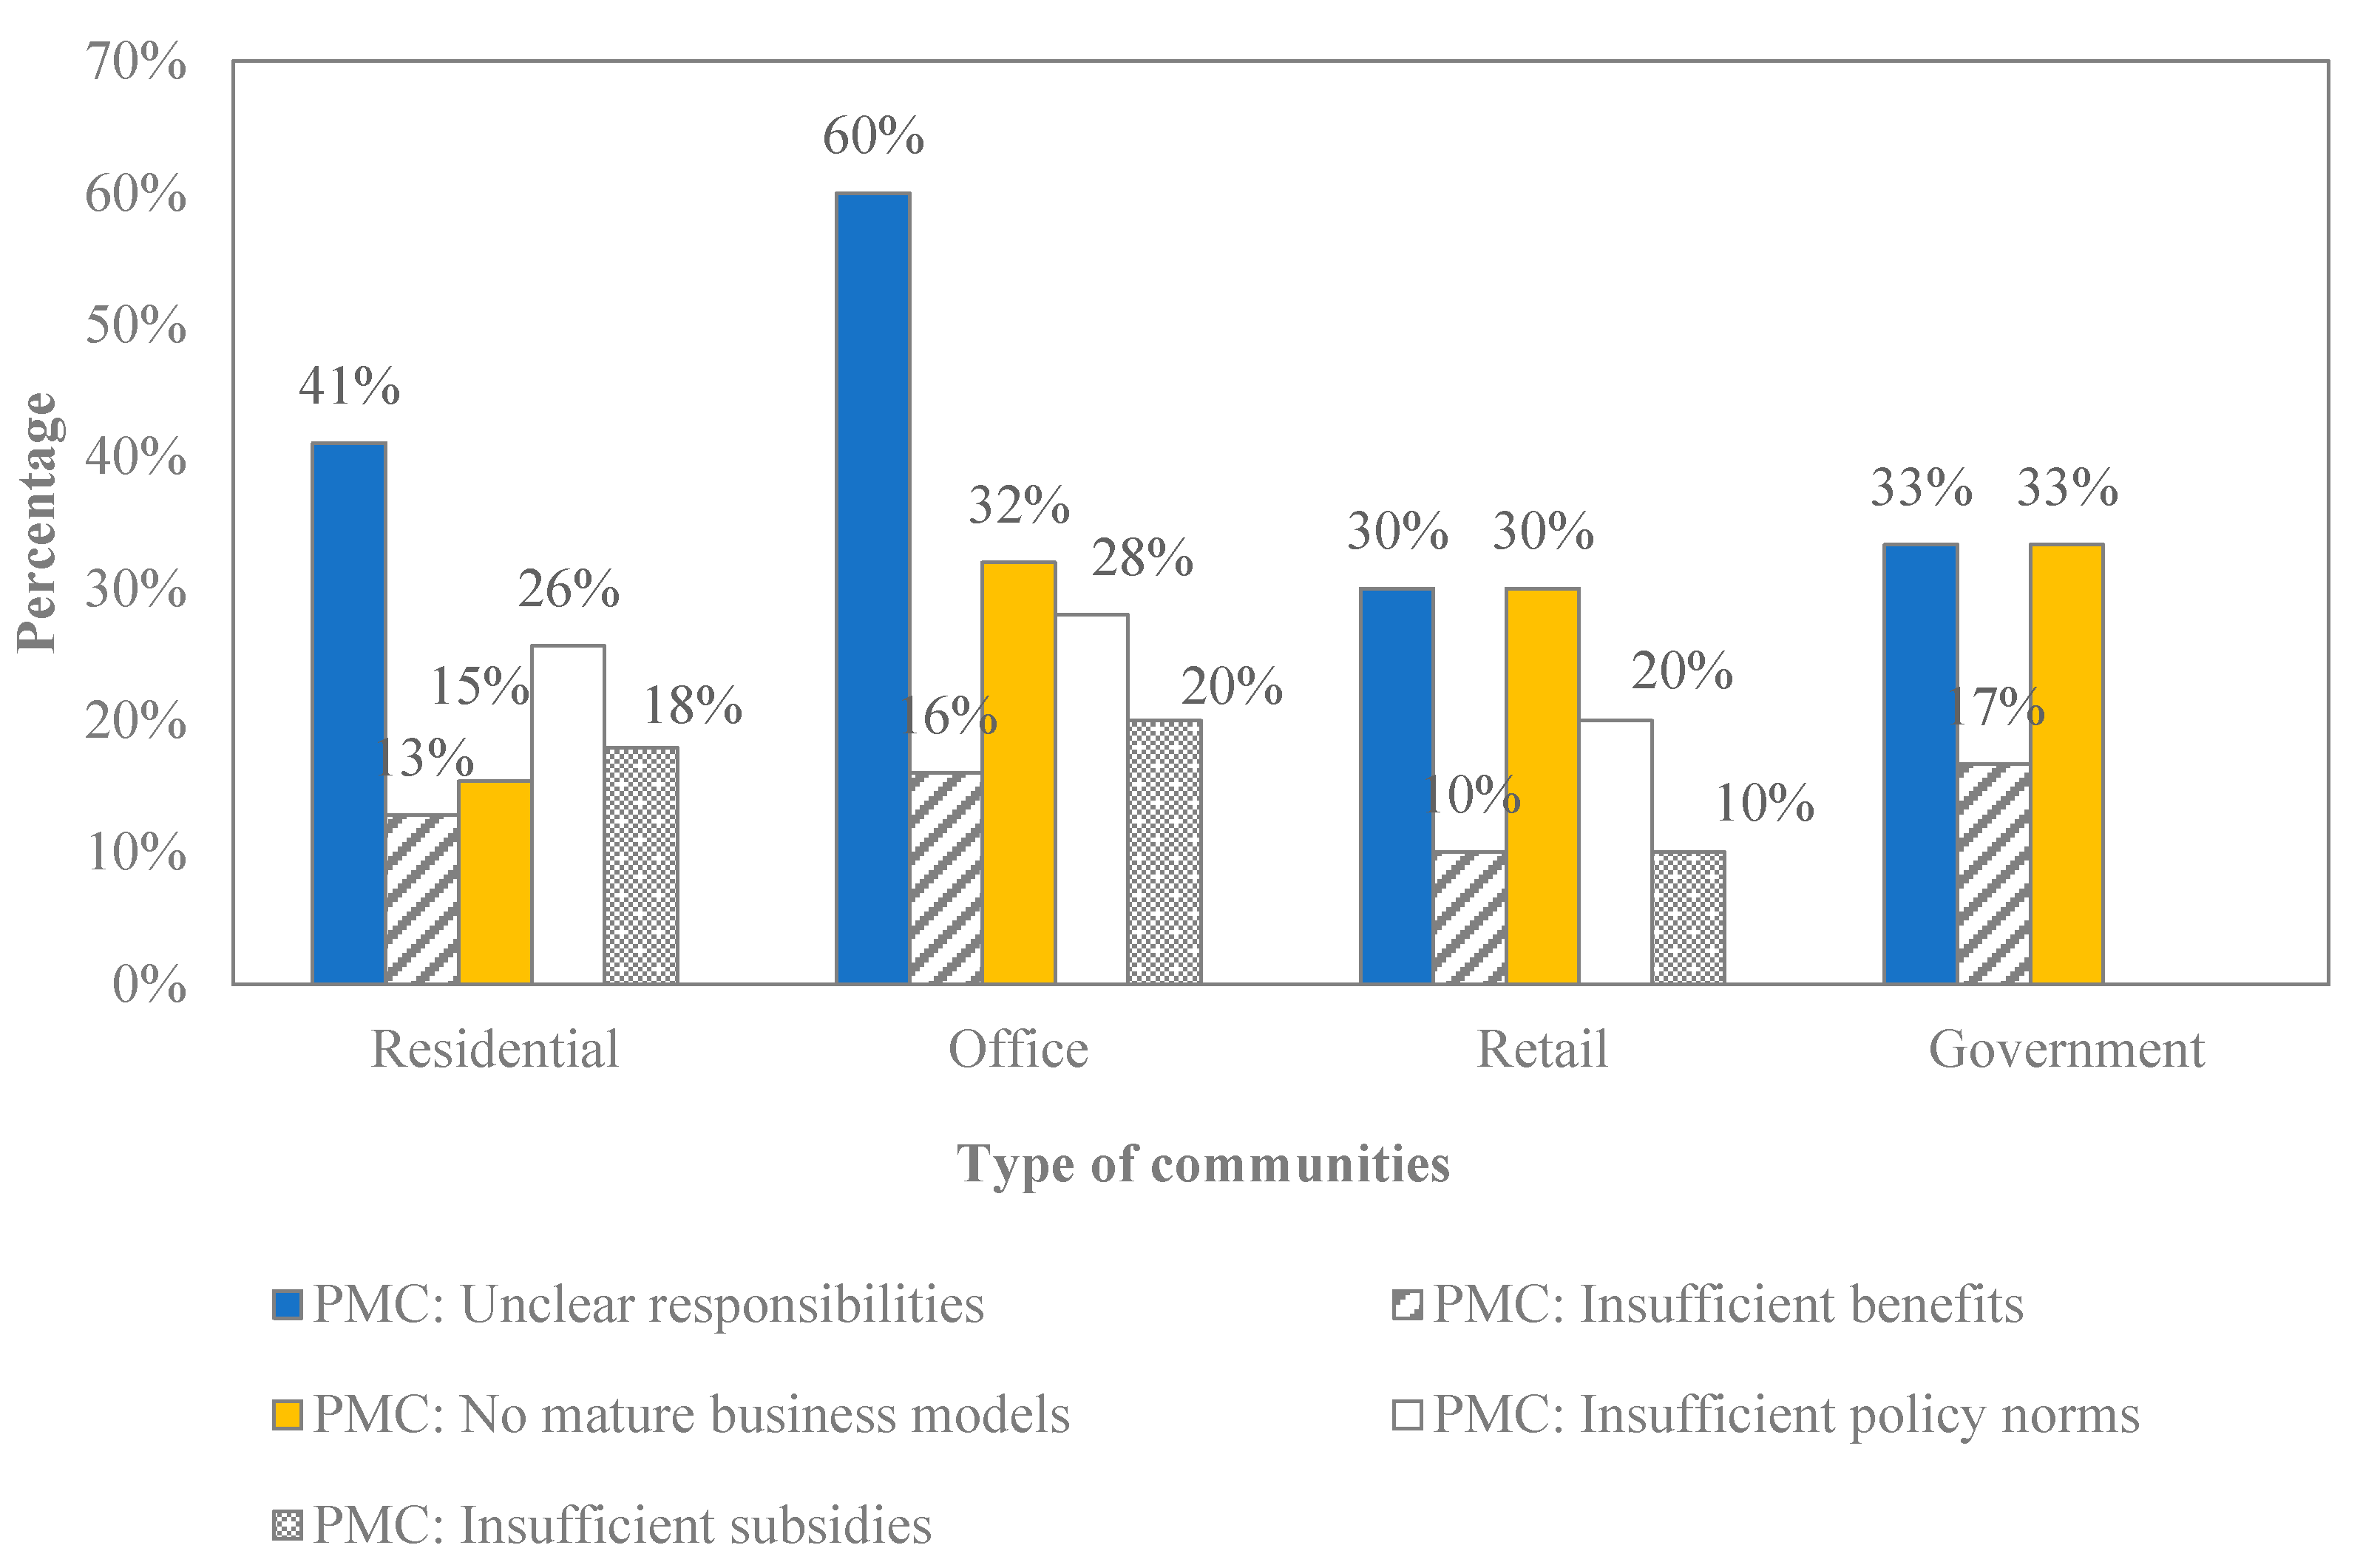
The willingness of the property management company to act in concert with the construction and operation of the public charging piles is also important. Therefore, we set several questions in the survey to study the factors that affect the willingness of the PMCs to participate. Five barriers for PMCs were considered, namely, unclear responsibilities, insufficient benefits, no mature business models, inadequate policy norms, and limited government subsidies.
As shown in
Figure 5, for all types of communities, “unclear responsibilities” was the most important reason that restricted the cooperation and participation of PMCs. The PMCs of 41% of residential communities, 60% of office buildings, 30% of retail buildings, and 33% of government communities worried about the unclear responsibilities. “No mature business models” ranked second. The PMCs of 15% of residential communities and about 30% of other communities were unwilling to participate in the operation of public charging infrastructure because there were no mature business models. “Insufficient policy norms” was also an important concern for PMCs of 26% of residential communities, 28% of office buildings, and 20% of retail buildings, but the PMCs of government communities did not worry about it. Less than 20% of PMCs worried about insufficient benefits and limited government subsidies.
In comparison, the office buildings were most constrained by the unwillingness of PMCs. On average, 46% of all communities were faced with the barrier of unclear responsibilities for PMCs, and 24% of all communities also had the obstacle that there were no mature business models for PMCs. Therefore, clearly defining the responsibilities of PMCs in the construction and operation of the charging infrastructure is the most important solution to encourage the PMCs’ participation, in particular for the office buildings. Mature business models are important, too.
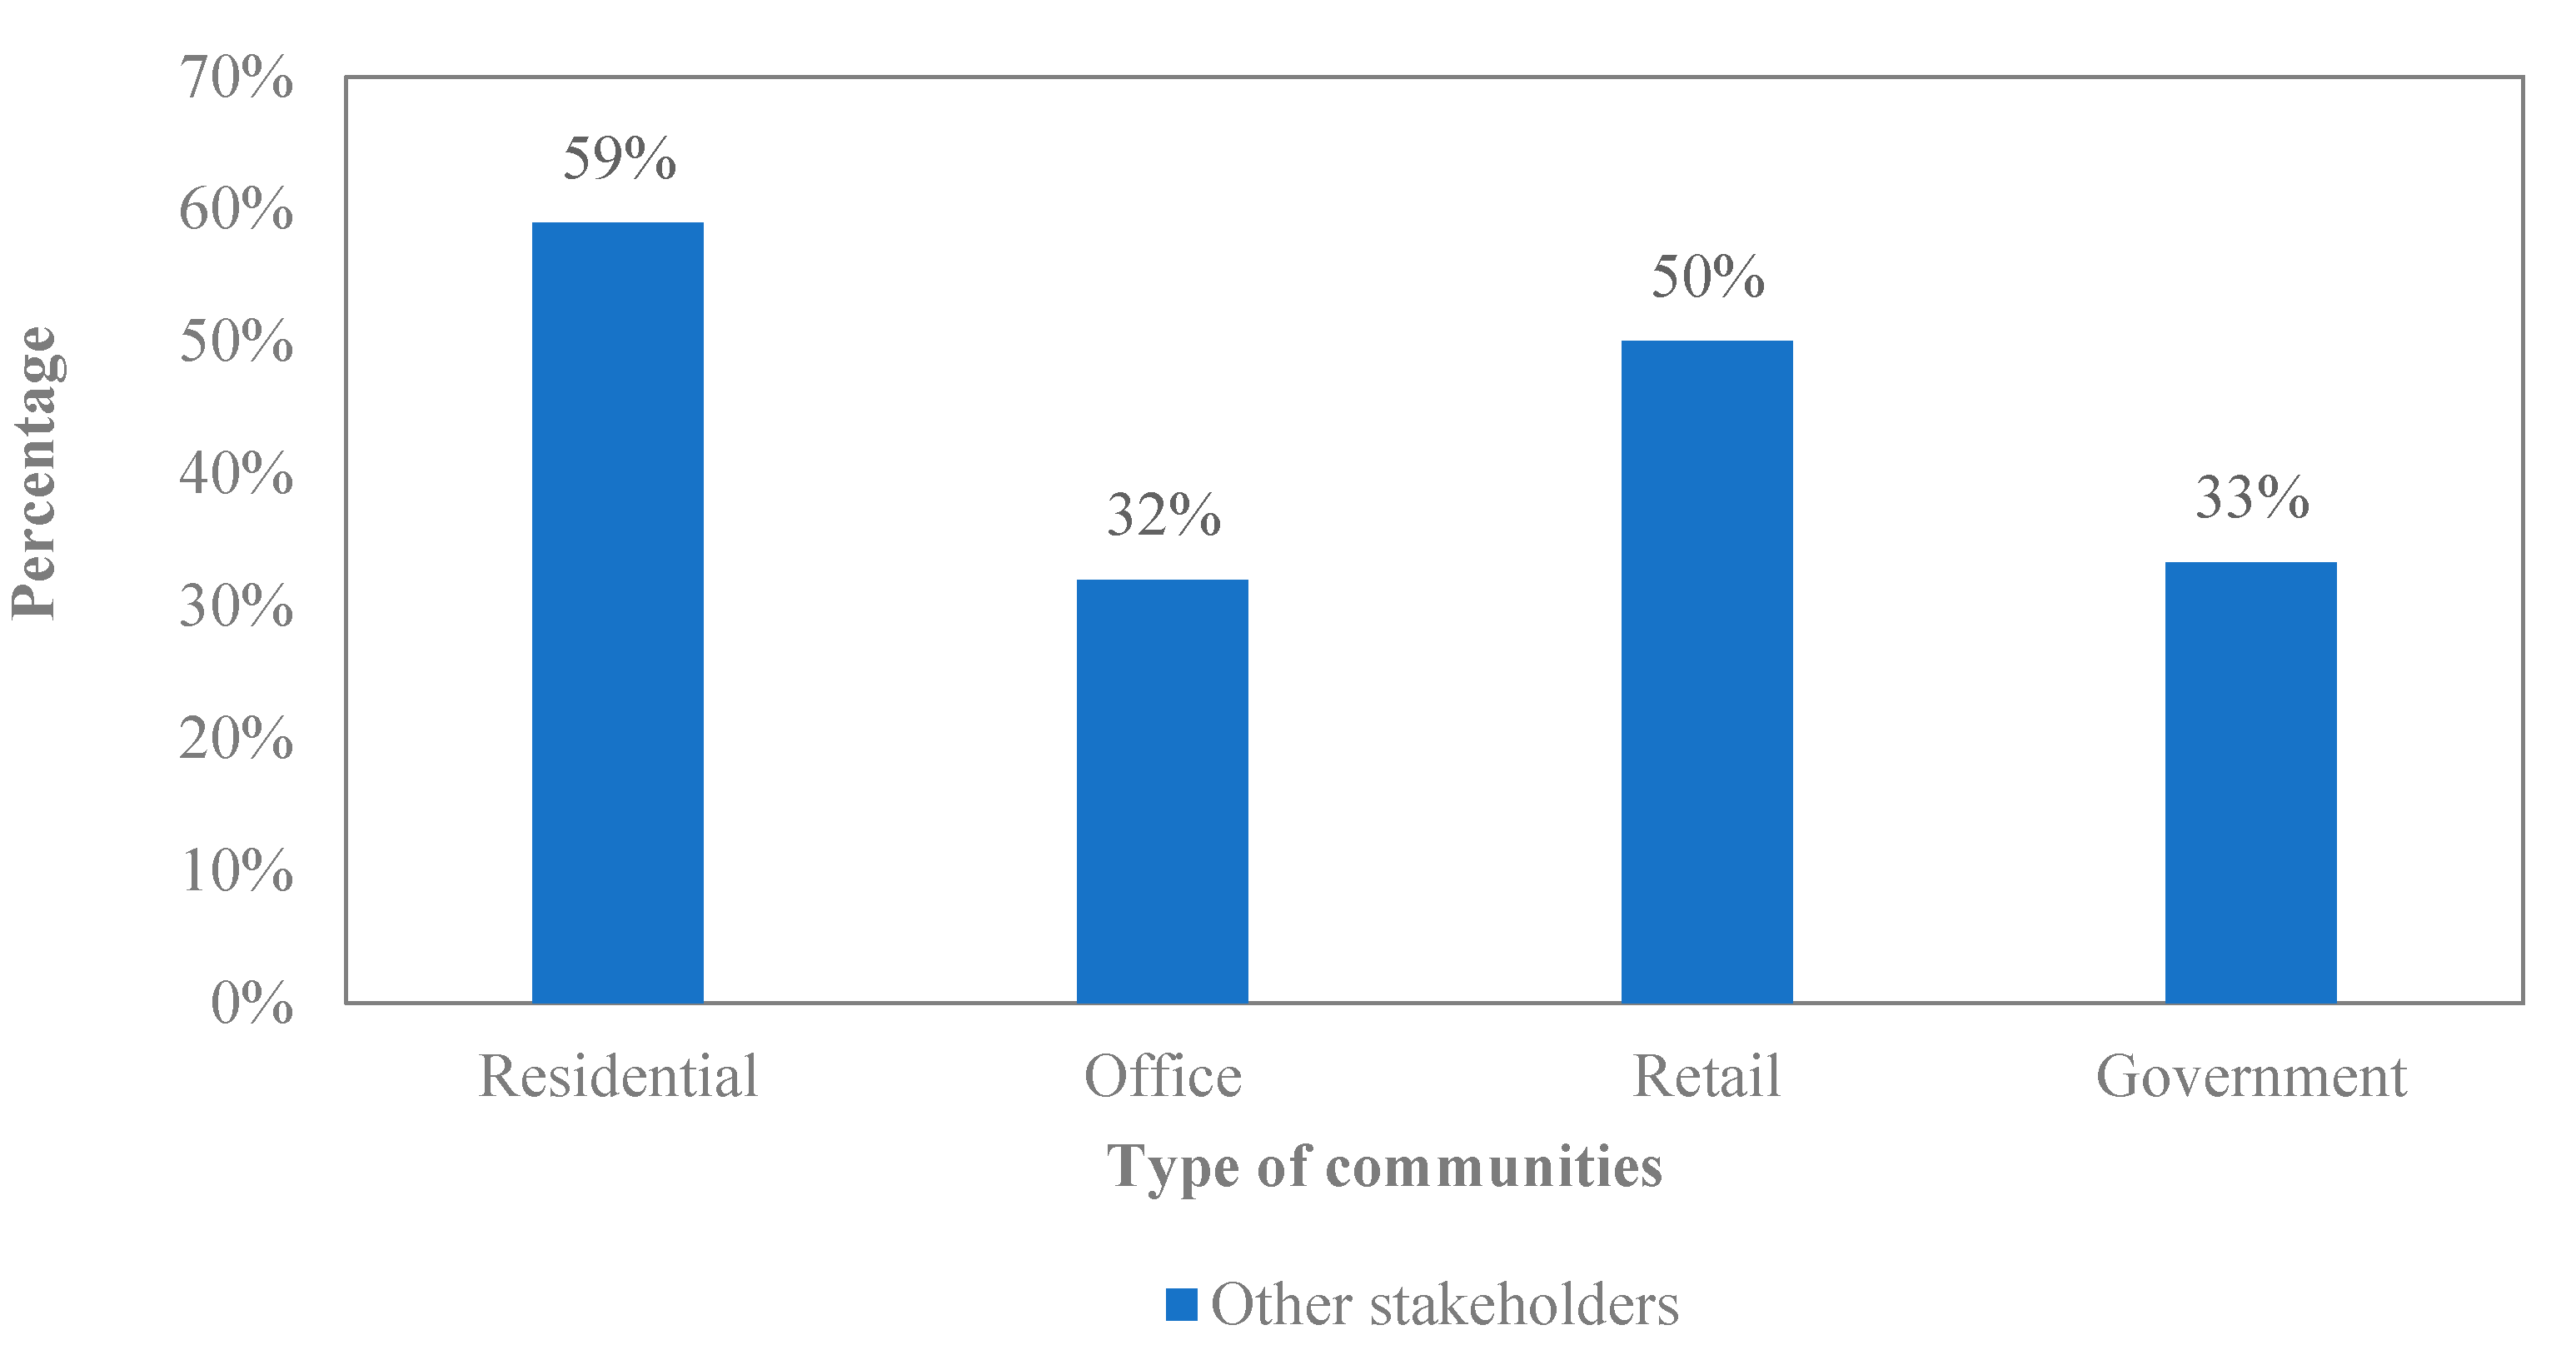
4.3.4. Willingness of Stakeholders
The “stakeholder” indicates the existing users of the parking spaces of the community, including the residents in the residential communities, the workers in the office buildings, the customers in the retail buildings, and the owner or the government institutions in charge of the government communities.
The barriers related to the stakeholders are different for different types of communities. For the residential, office, and government communities, as the public charging piles may be opened to outside users, the permission of the existing parking spaces’ users is essential. Therefore, we investigated whether their objection would be a barrier for the public charging piles’ construction.
In retail buildings in our survey, the ratio of vehicles with a parking time that was less than three hours reached 60% according to our survey. Therefore, we investigated whether the high mobility of the parking space users was a barrier to their demand for public charging piles in the retail buildings.
As shown in
Figure 6, according to the PMC manager, the construction of public parking piles would be blocked by the residents in 59% of residential communities. That was also an obstacle for about one-third of office buildings and government communities. Fifty percent of retail buildings were faced with the problem that the customers’ parking times were too short to charge their vehicles.
On average, 46% of communities were faced with the barrier related to the existing parking space users.
4.3.5. Summary
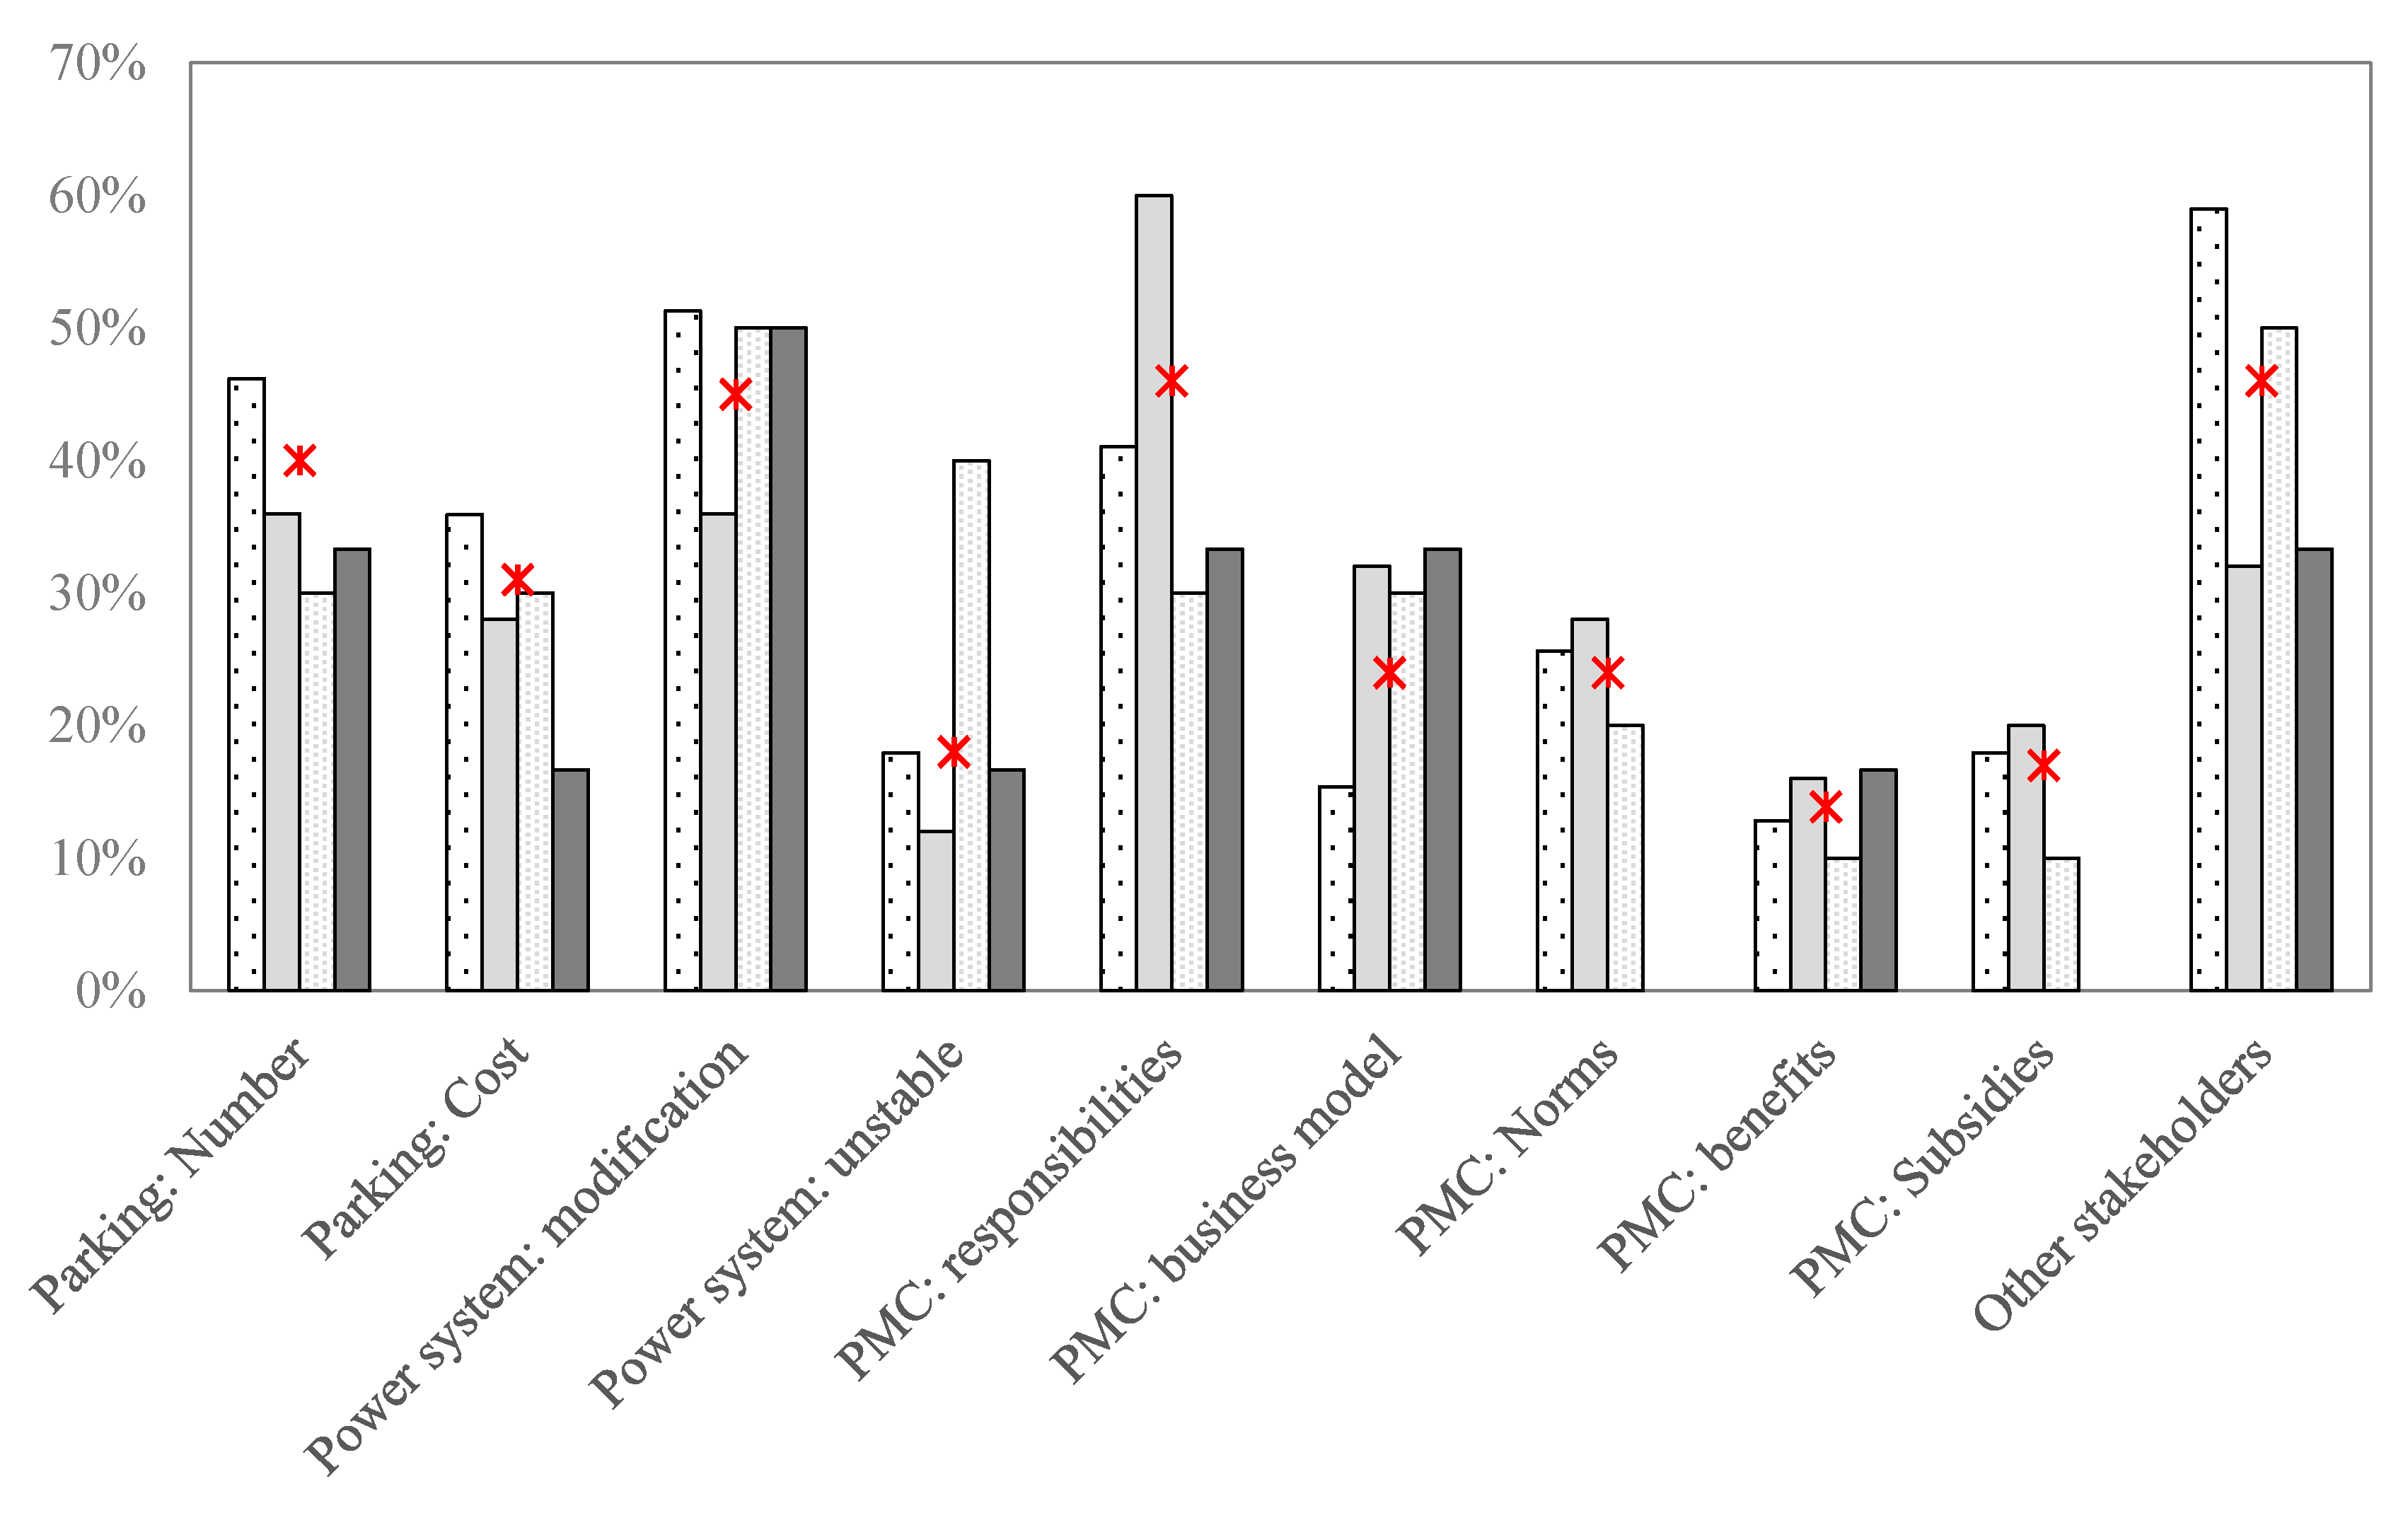
We summarize the survey findings in
Figure 7. Limited parking spaces, complicated circuit modification, unclear responsibilities for PMCs, and the objection or the high mobility of existing parking space users were the top four barriers to the supply of public charging piles.
Specifically, the objection of the existing residents was the most critical barrier for residential communities, the unclear responsibilities for PMCs were the most critical barriers for office buildings, and the complicated circuit modification and the high mobility of customers were the most important barriers for retail buildings. Complicated circuit modification was the most important barrier for government communities.
5. Conclusions
In this paper, we estimated the impact of the public charging pile availability on EV sales using panel regression analysis based on data from China. We found that insufficient public charging piles would significantly limit the demand for and sales of electric vehicles. One standard deviation change in the number of public charging piles would cause about a 13% standard deviation change in the EV sales rate in the next month. That impact would be more significant and larger if the public charging piles were built up for specific users or in developed regions where private parking spaces are limited.
We further investigated the barriers to the availability of public charging piles using a field survey conducted in 101 communities in Beijing, China. The top four barriers were limited parking spaces, complicated circuit modification, unclear responsibilities for PMCs, and the objection or high mobility of existing parking space users. Though cities in Western China may not have encountered such severe barriers as those in Beijing, the Beijing results remind all cities to consider the sufficiency of parking spaces, the feasibility of circuit modification, and the cooperation of PMCs and other stakeholders when providing more public charging piles, with different emphasis for different types of communities.
The findings in this paper provide important implications for EV industry development in China. First, providing more public charging piles is important to increase the sales of electric vehicles. In addition, the residential, office, retail, and government communities have different advantages and obstacles. It is more feasible to install the public charging piles in the residential and the government communities. However, measures to solve the objections of the existing residents are needed for the residential communities, and technical measures to guarantee the stable power system are necessary for installing charging piles in the government communities.
Though it is less feasible to install the public charging piles in office and retail buildings, they have a higher potential to be the public areas for charging infrastructure in the future. As for office building properties, the major barrier is the property management companies’ concern about the responsibilities they should take. Therefore, the government should clearly define the rights, responsibilities, and interests of the property management companies of the office buildings with respect to the public charging piles’ construction and operation. As for retail properties, the too-short parking time of the customers restricts their demand for EV charging, but we cannot exclude retail properties from the places for public charging infrastructure installation. DC fast-charging piles, which can sharply reduce the charging time, are the best fit for the retail properties to fulfill the demand of customers to charge their electric vehicles when shopping.


