1. Introduction
Egypt’s rural areas are predominantly located in Upper Egypt governances, with 40% of the Egyptian population living in this region, of which 60% live below the poverty line and 80% live in extreme poverty [
1]. The country’s poorest 1000 villages are located in three governorates in Upper Egypt, with 74% of the households in these villages considered food insecure [
1,
2]. Upper Egypt is suffering from severe poverty, high unemployment rates, low-quality education systems, and inadequate distribution of resources. The rural region in Upper Egypt is characterized by a high unemployment rate of 16% among youth, while 70% of young women are jobless and female illiteracy rates are more than double those of males [
3]. The Upper Egyptian population relies on subsistence agriculture, as more than 55% of employment in this region is agriculture-related, which represents 28% of all jobs in this region [
4]. Agricultural communities in the rural regions of Upper Egypt are subject to unresolved and challenging issues, including food insecurity, water scarcity, climate variability, and unsustainable livelihoods. Guaranteeing availability and access to food is vital, particularly in developing countries, and can be enhanced in a number of different ways. Local food reserves have been promoted by different organizations and small producer federations, with their objectives being to increase farm incomes and food security.
Special attention has been given to the horticultural value chain, since horticultural production is the main source of rural incomes in Upper Egypt. In 2018, fruit production in Egypt amounted to 15.2 million tons cultivated from 674 thousand hectares. In the same year, 238 thousand hectares of land were cultivated to produce 15.6 million tons of vegetables [
5]. The main vegetable crops are beans and green beans, potatoes, tomatoes, musk/mixed melons, peas, onions, garlic, peppers, cucumbers, and leafy vegetables, while the main fruit crops are strawberries, citrus, grapes, mangoes, bananas, and olives.
Export markets are large and growing within the horticulture value chain. Egypt has acquired experience selling fresh horticulture crops to international markets, concentrating primarily on the EU, the Gulf region (a Middle Eastern alliance), and Far East countries [
6]. Egypt’s export value and volumes of fresh horticulture crops have seen dramatic increase over the past 10 years. The northern part of Egypt has the biggest volume share of exports, while Upper Egypt’s exports comparatively account for smaller amounts [
7]. The early production of Egyptian fresh produce is given a high chance to access the largest market windows to capture the market opportunities between northern (on-season) and southern (off-season) hemisphere supplies. Moderate environmental conditions in Upper Egypt allow for crop production in Egypt and other foreign markets earlier in the year compared to other geographic areas. Add to this comparatively inelastic demand, scarcity of supply from other markets, and year-round market demand, and the export prices of the chosen goods increase during Upper Egypt’s growing season. This has led to excellent opportunities for Upper Egypt’s horticulture growers.
This paper is focused on fresh table grapes, green beans, and green onions specifically. Egypt has gained experience exporting table grapes specifically to different markets, with a particular focus on the Gulf region, EU, and Far East markets. Both the value and volume of Egypt’s fresh table grape exports showed a significant increase in the last decade, with the export quantity increasing from 54 thousand tons (59.586 million USD) in 2007 to 130 thousand tons (237.354 million USD) in 2017 [
6]. Nevertheless, the table grape exports mostly come from the northern part of Egypt. Grape exports from Upper Egypt enjoy excellent consistent growth and face very little or no shadow window competition, which increases the rates for selling prices. In recent years, Egypt has also gained experience exporting green beans to different markets. The EU market is the largest importer of Egyptian grapes. In 2007, the export quantity of green beans was 31 thousand tons (19.543 million USD), which increased to reach 42 thousand tons (46.165 million USD) in 2017 [
6]. The highest volume of Egyptian green bean exports mostly comes from north Egypt (Ismalia, Giza) and Middle Egypt (Fayoum and Beni Suef), with little focus on Upper Egypt. When it comes to green onions, the UK market specifically has been growing for Egypt, and other EU markets are also a destination for green onions. Egypt exported 566 thousand tons (207.238 million USD) of green onions in 2017, compared to 201 thousand tons (36.024 million USD) in 2007 [
6]. Upper Egypt enjoys moderate weather conditions that allow to harvest the green onion almost 10–20 days earlier than in other geographical areas in Egypt and other countries. Green onions exported from Upper Egypt face very little or no shadow window competition. The shadow window competition of green onions from Upper Egypt is very low resulting in excellent growth rates for selling prices and, similar to table grapes and green beans, these products fit nicely with consumption habits and consumer preferences.
Improving agricultural productivity in the rural areas in Upper Egypt is important and needed in order to improve farmer incomes and livelihoods. Agriculture in Upper Egypt is characterized by unsustainable practices, meaning environmentally unfriendly farming practices and a lack of market intelligence. Securing a sustainable supply chain means meeting environmental and economic drivers. The Advanced Marketing and Agribusiness Logistics project (AMAL) [
8], through a carefully structured partnership with the Horticultural Export Improvement Association (HEIA), aims to establish inclusive value chains for horticulture in Upper Egypt, which includes smallholder farmers with high-value export markets. For this purpose, this study focuses on the potential socio-economic impacts of transitioning from traditional farming and marketing practices in Upper Egypt to modern export/high-end market-oriented production through improving the use of market intelligence and logistics. To assess the significance of the positive financial and sustainable economic impacts of the proposed interventions—a cost–benefit analysis (CBA) and risk analysis using the Monte Carlo simulation technique—have been carried out, with a focus on three horticulture value chains (table grapes, green beans, and green onions). The proposed intervention activities are divided across four components: (i) Improving conservation farming practices; (ii) improving access and use of market intelligence and facilitating value chain linkages; (iii) catalyzing market-oriented production practices; and (iv) organizing and strengthening producer organizations. Activities under those components will be implemented in close coordination to ensure the sustainability of these interventions. These activities will complement infrastructure, such as the perishable terminals, facilitate the integration of smallholder farmers into commercial horticulture production systems, and position the Center of Excellence as an information and service hub in Upper Egypt. The proposed interventions target improving the livelihoods and creating sustainable socio-economic aspects of 4300 households in rural region Upper Egypt, including smallholder farmers, unemployed youth, women, entrepreneurs, and landless laborers, by building their capacity to integrate with high-value commercial horticulture markets. We employ a market-driven approach to increase smallholder incomes by sustainably intensifying their productivity; improving the ability of value chain stakeholders to interpret and respond to market signals; enhancing the marketing of products; and facilitating commercially oriented linkages between value chain actors. Securing a sustainable and reliable supply chain means meeting the environmental and economic drivers of sustainability. The proposed interventions address both by supporting resiliency in the horticulture supply chain through production efficiency, crop diversification, and reliable end markets; and by mitigating the impact on the environment by introducing climate-smart agriculture practices. The proposed intervention supports the horticulture value chain through working with producer organizations (e.g., farmers’ associations and cooperatives), which serve as a vehicle to reach farmers for field training and also work with them directly to provide organizational development training to strengthen their organizational capacity to better serve their members and their trading partners. Furthermore, the interventions will support farmers through production training that focuses on production efficiency and post-harvest processing. The small farmers will be supported by experts in different fields, including field preparation, selecting high-yield seed varieties with a tolerance to drought and salinity, irrigation management, fertilizer and pesticide use management, handling, and post-harvest processing. Through the cascade training model, each master trainer will train field representatives who will provide training and visit farmers regularly. Making these improvements will allow the local production to become export-grade horticulture crops, and the efficiency and reduced negative impact on the environment makes this improved production a valuable investment.
Recent research has suggested the use of a CBA approach to determine whether the socio-economic returns from certain interventions and investing in any sector will significantly improve the sustainable livelihood condition of the target community in the short run following an intervention’s completion [
9,
10,
11,
12]. In addition, ensuring sustainability in terms of having a decent living standard and making improvements to livelihoods requires analysis of the socio-economic condition in the long term, as the current rural community improvement debate shows. For this purpose, the aim of this socio-economic research is to evaluate the interventions’ financial viability and sustainability from an equity point of view for the stakeholders along the value chain (farmers, exporters, and the HEIA). The CBA is based on assumptions as identified throughout this publication and upon information, data, and findings gathered from secondary [
13,
14,
15] and primary sources (focus group interviews with associations, farmers, exporters, input suppliers, and HEIA members). The study carried out a comprehensive CBA for the fresh table grape, green bean, and green onion value chains, focusing on the following outcomes: Opportunities and comparative advantages for smallholder farmers to graduate from traditional markets into sustainable, high-end, export-quality value chains; the risks associated with the selection of specific value chains; the potential impact on smallholder farmers in terms of employment, return on investment, and sustainable profitability; sustainable social and nonmonetary impacts on youth employment and gender empowerment. The interventions will enable Upper Egypt produce growers to benefit from high value export chains. This inclusive value chain approach will create significant financial and economic benefits for the farmers, input suppliers, exporters, service providers, and the community as a whole.
2. Literature Review
Rural areas in less developed countries account for more than two-thirds of the world’s poor and food insecure communities [
16,
17,
18]. Furthermore, the rural communities in these countries face increasingly challenging environments shaped by internal and external drivers, such as climate change, instability, agricultural market shocks, and fast-changing societal demands [
19,
20,
21,
22]. Improving rural communities’ livelihoods requires combining both experience and knowledge with adjusting to external and internal conditions according to available resources [
23,
24,
25]. Poverty and vulnerability are endemic in the rural regions of developing countries. When these aspects are combined with the low and unstable incomes obtainable from local agricultural sectors, and with low levels of social security, the result is internal and international migration from rural regions [
26,
27].
There are many studies which have addressed the contribution of agriculture to social and economic development in rural regions. A study by Musolino [
28] finds evidence of the significant role of farming in improving the social and economic conditions in rural communities. Research by Di Iacovo [
29] indicates that improving agricultural practices could be considered an approach used in rural development to enhance community livelihoods. There is a critical need for agricultural intensification and increasing crop production to support the livelihoods of farmers and rural populations without adverse environmental impacts [
30,
31]. A field research study by Musolino [
32] assesses whether investments in the agri-food chain could be one of the best investment options rural areas. Research results reveal that investments in the agri-food sector in rural regions are economically viable through the efficient use of the available resources, even if they are few.
Transforming rural regions to become more developed and sustainable requires improvements to be made, particularly for youth [
33,
34,
35,
36]. Work by Diao [
37] and Dorosh and Thurlow [
38] studies the role of agriculture in rural Africa development. They suggest that, although there are challenges faced by African countries, some evidence shows that improving the agricultural sector in the rural regions of these countries may lead to successful economic transformations. Other studies, however, confirm that an inclusive rural transformation in Africa that increases agricultural productivity, marketable surpluses, and employment opportunities in the agricultural industries all to lead to an improved rural economy, but also help to reduce poverty and food insecurity in the urban regions [
39,
40,
41,
42,
43,
44,
45,
46].
Zahran [
47] explored the factors that need to be improved in order to enhance agricultural sustainability, as well as economic performance, in the rural regions of Egypt. They found that there is a lack of infrastructure and an absence of the role of the intermediary organizations to transfer the knowledge from the labs to the field. Furthermore, the linkages of contracting and public–private partnerships are missing, and interactions are required to improve the farming practices and thus improve the rural livelihoods. More recently, the government and international donors have strongly intervened to improve the position of the agriculture sector in Upper Egypt. For example, the Egyptian government decided to improve the horticulture value chain by improving the agricultural practices for 40 thousand hectares of small farms, given that moving towards high-value crops, i.e., vegetables and fruits, leads to improving rural economies and enhancing livelihoods [
48,
49,
50,
51,
52].
Farmers in rural areas must have a return on their production investment that meets their families’ household needs, thus any intervention and investment proposed to improve their livelihood should be socially and economically evaluated before implementing them. Many empirical analyses have assessed the worth of agricultural investments by conducting comparisons of the costs and benefits involved. A cost–benefit analysis (CBA) is commonly used to study the economic feasibility of significant interventions [
53], i.e., to improve agricultural practices by relying on conservation practices and good agricultural practices (GAP). A CBA is a useful method for analyzing the socio-economic perspective of a current situation and then comparing the results with a prospective initiative aimed at improving community welfare [
54]. Boardman [
55,
56] defines a CBA as a socio-economic evaluation in monetary terms of the policy impacts on all societal members’ welfare. A CBA is an essential tool for estimating the input costs and revenue from the produced outputs to detect a project’s economic impact. Basically, through a CBA, we can conduct a comparative analysis of the current state-of-the-art and the projected value that could be generated by certain proposed activities. Therefore, a CBA is a method that assesses whether an initiative’s investors are using their resources efficiently and the potential scenarios of using these resources more efficiently [
53].
CBAs are based on Gittinger’s [
57] farm investment analysis (FIA) theorem, which studies the use of resources and outputs produced through efficient use of these resources by focusing on four broad categories: Land, labor, production, and finance. FIAs assess farm budgets by estimating cash inflows and income generation during the interventions, then the results of the net benefits of the proposed interventions can be compared with the current situation. Thus, farmers can determine whether implementing projected activities will improve their incomes and whether they should replace their current activities. The main goal of Gittinger’s [
57] study was to examine the socio-economic impacts of agricultural investments on rural communities’ abilities to attract and extend investments in the agricultural sector. Ayodele et al. [
58] used CBA to appraise the socio-economic potential of cultivating pepper by small farmers in Nigeria. Research results indicate the pepper production is profitable and has significant social-economic viability.
Elias et al. [
9] conducted a CBA of agricultural interventions to improve the extension services of major crops (maize, wheat, and teff) that were targeted by agriculture services in north-west Ethiopia to discover which crop(s) to invest in. Results imply that maize would be highly efficient to invest in compared to teff and wheat. Jenkins et al. [
10] used a CBA to evaluate the financial and socio-economic benefits of adopting best agricultural practices to enhance the value chains of cowpea, groundnut, maize, and soybeans in Nigeria. They found evidence that the agricultural interventions could improve farmers’ incomes, but also that further improvements are required to diversify farmers’ incomes, i.e., livestock husbandry and/or non-farm employment, and move them above the poverty line threshold. Focusing on Malawi’s rural communities, a study by Kagin et al. [
59] assessed the evidence on policy options aimed at enhancing the coordination and coherence between social protection and agricultural programs that increase agricultural production and productivity, reduce poverty, and improve livelihoods. They used rural-economy-wide impact simulation methods and a CBA as well. Their results imply that the agricultural programs show direct impacts on recipient households and may also create spillovers of positive profit and output that impact the group of non-targeted households.
Using a CBA, Sgroi et al. [
60] evaluated the economic and financial aspects of organic versus conventional farming in Sicilian lemon orchards in the Mediterranean region. Results imply a significant sustainable economic and financial impact of organic farming compared to conventional farming. Moreover, a study by Kuwornu et al. [
61] evaluated the financial viability of certified organic pineapple production and marketing in the Eastern and Central Regions of Ghana. Results show that certified organic pineapple production in the Central Region is highly efficient and financially viable compared to the Eastern Region of Ghana.
Finizola e Silva and Van Passel [
12] have examined whether climate-smart agriculture through the use of aquaponic planting systems in the semi-arid regions of Brazil can reduce food insecurity and generate income for the beneficiaries. Their results show that aquaponic systems have a strong potential to increase the beneficiaries’ income and improve food security in Brazilian semi-arid regions. Furthermore, using a CBA, Bosma et al. [
62] studied the financial feasibility of producing fish and vegetables through aquaponic systems in the Philippines. The authors found evidence that investing in these types of aquaponic systems would be significantly costly and not feasible. Xian et al. [
63] also used a CBA to investigate the net benefits of the Chinese government’s Grain for Green program. Their results found that the implemented program is not economically feasible.
Samariks et al. [
13] used a CBA to evaluate the financial benefits of reducing the impact of wind damage during rotation periods through applying silvicultural measures in young, pure, planted Norway spruce stands. Results imply that the financial benefit is higher for planting in windier (coastal) regions than the moderate thinning regions.
A research article by Khan et al. [
11] assessed the socio-economic impact of the government of Pakistan’s ‘Billion Tree Tsunami’ afforestation program in the province of Khyber Pakhtunkhwa through the use of a CBA. They argue that implementing this program in the community of the target region will result in a high economic impact with increasing social sustainability. Work by Wang et al. [
64] also relies on a CBA to evaluate the cost-effectiveness of various agricultural conservation practices in Southeast China and select the best practices that would generate profits. Results show that the most cost-effective practice is closing hillsides for afforestation, then forest fertilizing, followed by planting trees and grass.
A group of studies have also used CBAs to measure the economic consequence of intervention projects focused on water programs [
53,
65,
66,
67,
68,
69]. Work by Locatelli et al. [
70] assesses the economic impact of green infrastructure (GI) using a CBA that includes several benefits related to urban drainage in the Spanish cities of Barcelona and Badalona. Results reveal that the net present value of the GI is always positive, meaning GI has economic potential in the targeted urban regions. Empirical research by Chuchird et al. [
71] studies the financial and economic returns of the adoption of three irrigation technologies (water wheel, water pump, and weir) using a CBA by comparing these three technologies. The water wheel irrigation technology is shown to have the highest financial and economic return compared to other technologies.
CBAs can be categorized as ex-ante (prospective) and ex-post (retrospective) [
55,
56,
72]. An ex-ante CBA can be conducted to help make a decision before implementing one or several projects. Therefore, an ex-ante CBA attempts to answer the question of whether or not applying a project or activities will enhance the efficient use of resources and create profit [
8,
73,
74,
75,
76,
77,
78,
79,
80,
81].
An ex-post CBA, on the other hand, is applied after a project or activity has been completed. It can assess whether or not an applied project improves the use of the allocated resources and evaluate what has been achieved by the project [
82,
83,
84,
85,
86,
87,
88,
89,
90,
91]. This research study follows the methodical approach of an ex-ante CBA, which can be applied as a primary and fundamental analytical frame to assess the socio-economic impact of the proposed interventions.
3. Materials and Methods
The financial and socio-economic modeling was applied using a computer model for feasibility analysis that was carefully verified and checked by UNIDO (COMFAR III Expert®). This package is widely used by UN organizations, the World Bank, the International Trade Centre (ITC), The International Fund for Agricultural Development (IFAD), and many other organizations for its reliability, consistency, and accuracy for preparing bankable and large economic investment analyses. @RISK 6 Professional® was used to conduct a risk analysis using the Monte Carlo simulation technique. This technique can estimate and track potential future scenarios mathematically and objectively, as well as the possibilities and risks associated with each scenario. The macroeconomic parameters and the budgets of detailed crop enterprises have been applied to create working tables of revenue prices, inflation indexes, production and revenue, direct operational costs, investment costs, and working capital.
All of the above have been prepared in real and nominal prices, followed by the preparing of the cash flows from a total investment point of view, both nominal and real. The economic indicators of inflation, exchange rates, import/export duties, and export support programs were collected from relevant national and international sources. Detailed cash enterprise budgets with and without the intervention were collected through intensive interviews and focus group assessments in the target production areas in Upper Egypt (Luxor, Sohag, Qena, and Aswan); interviews were conducted with farmer organizations; produce value chain actors; HEIA members; and the United Nations International Trade Statistics Database (COMTRADE) [
14] (Free On Board (FOB) prices).
Figure 1 and
Figure 2 show the methodology that has been used for the financial and economic analysis in order to define the content of the CBA schematically represented.
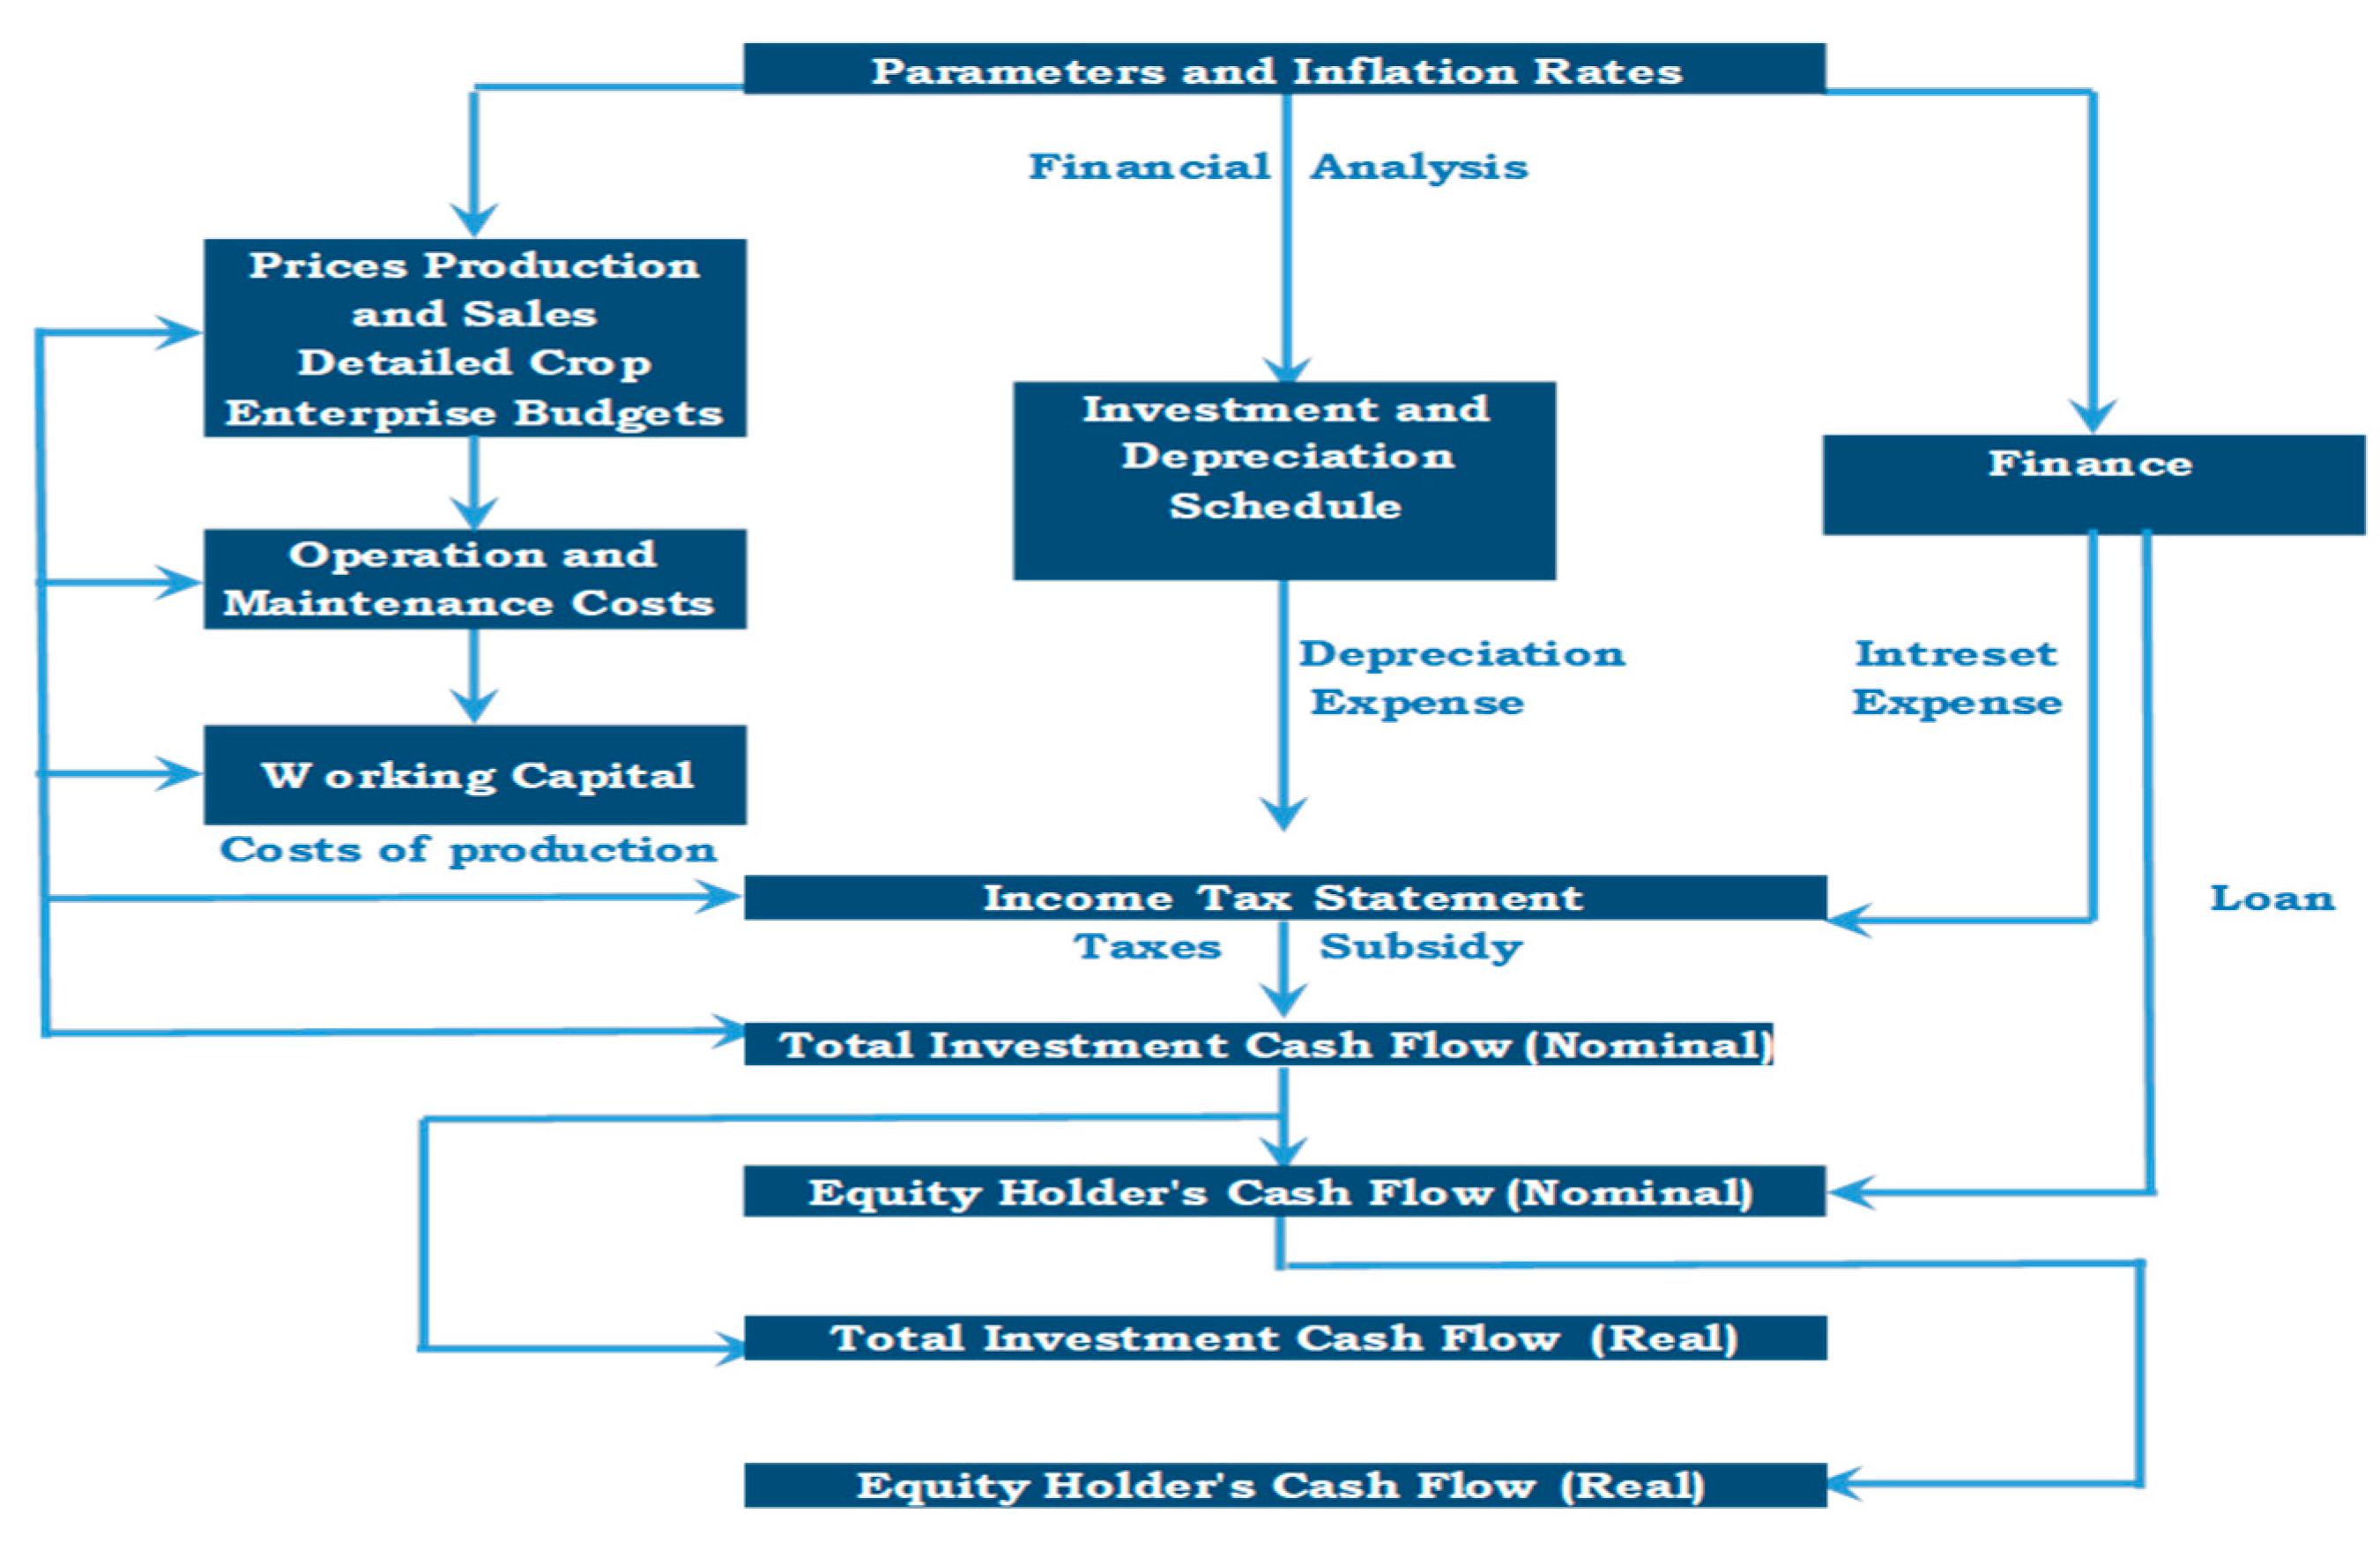
Figure 1 describes the financial modeling of proposed interventions for the targeted value chains’ financial and economic viability. Detailed crop enterprise budgets and macroeconomic parameters (
Figure 1) are used to construct the working schematic. These parameters include inflation index, revenue prices, production and revenue, direct operational costs, working capital, loans and interest expense, and investment costs. These are subject to the income tax and tax subsidy prepared in nominal and real prices after the cash flows have been prepared—the real and the nominal total investment point of view—to obtain the real and the nominal equity holder’s cash flow.
The number of target farmers is shown in the inter work plan in
Table 1. It describes the increase in productivity per feddan for the target farmers as a result of implementing the proposed interventions. After two years of interventions, the production will be increased to 8, 7, and 8 tons per feddan, and the exportable yield will be increased by 2.1, 1.8, and 2.1 tons per feddan. After three years of interventions with the same target farmers and the same space of land, the exportable yield will continue increasing to 4, 2.8, and 3 tons per feddan for grapes, green beans, and green onions, respectively. This indicates that the proposed interventions will improve the production quality to meet the quality standards required by international markets.
The net present value (NPV) is widely used; it covers all quantifiable costs (direct and indirect), as well as the expected direct and indirect benefits [
12,
92]. The NPV is calculated for inflow/outflow with and without the interventions on real and incremental bases. Given the (20-year period, cash flow) pairs (
,), the NPV is calculated by:
where
is equal to (
),
and
are the benefits and costs at each year
,
R0, are summed up to a negative cash flow,
is the discount rate at 12%, and
= 20 years, which is the analysis period.
The internal rate of return (
) is calculated on the basis of the standard analysis, where the IRR on an investment is the “annualized rate of return,” which renders the NPV (both positive and negative) of a given investment equal to zero [
12]. The IRR is calculated as follows:
For the planning horizon, the analysis is applied for a period of 20 years for the interventions and the United States dollar (USD) is used as the measurement reference currency. The local currency Egyptian pound (EGP) is converted into USD and a 12% social discount rate is used for the analysis purpose.
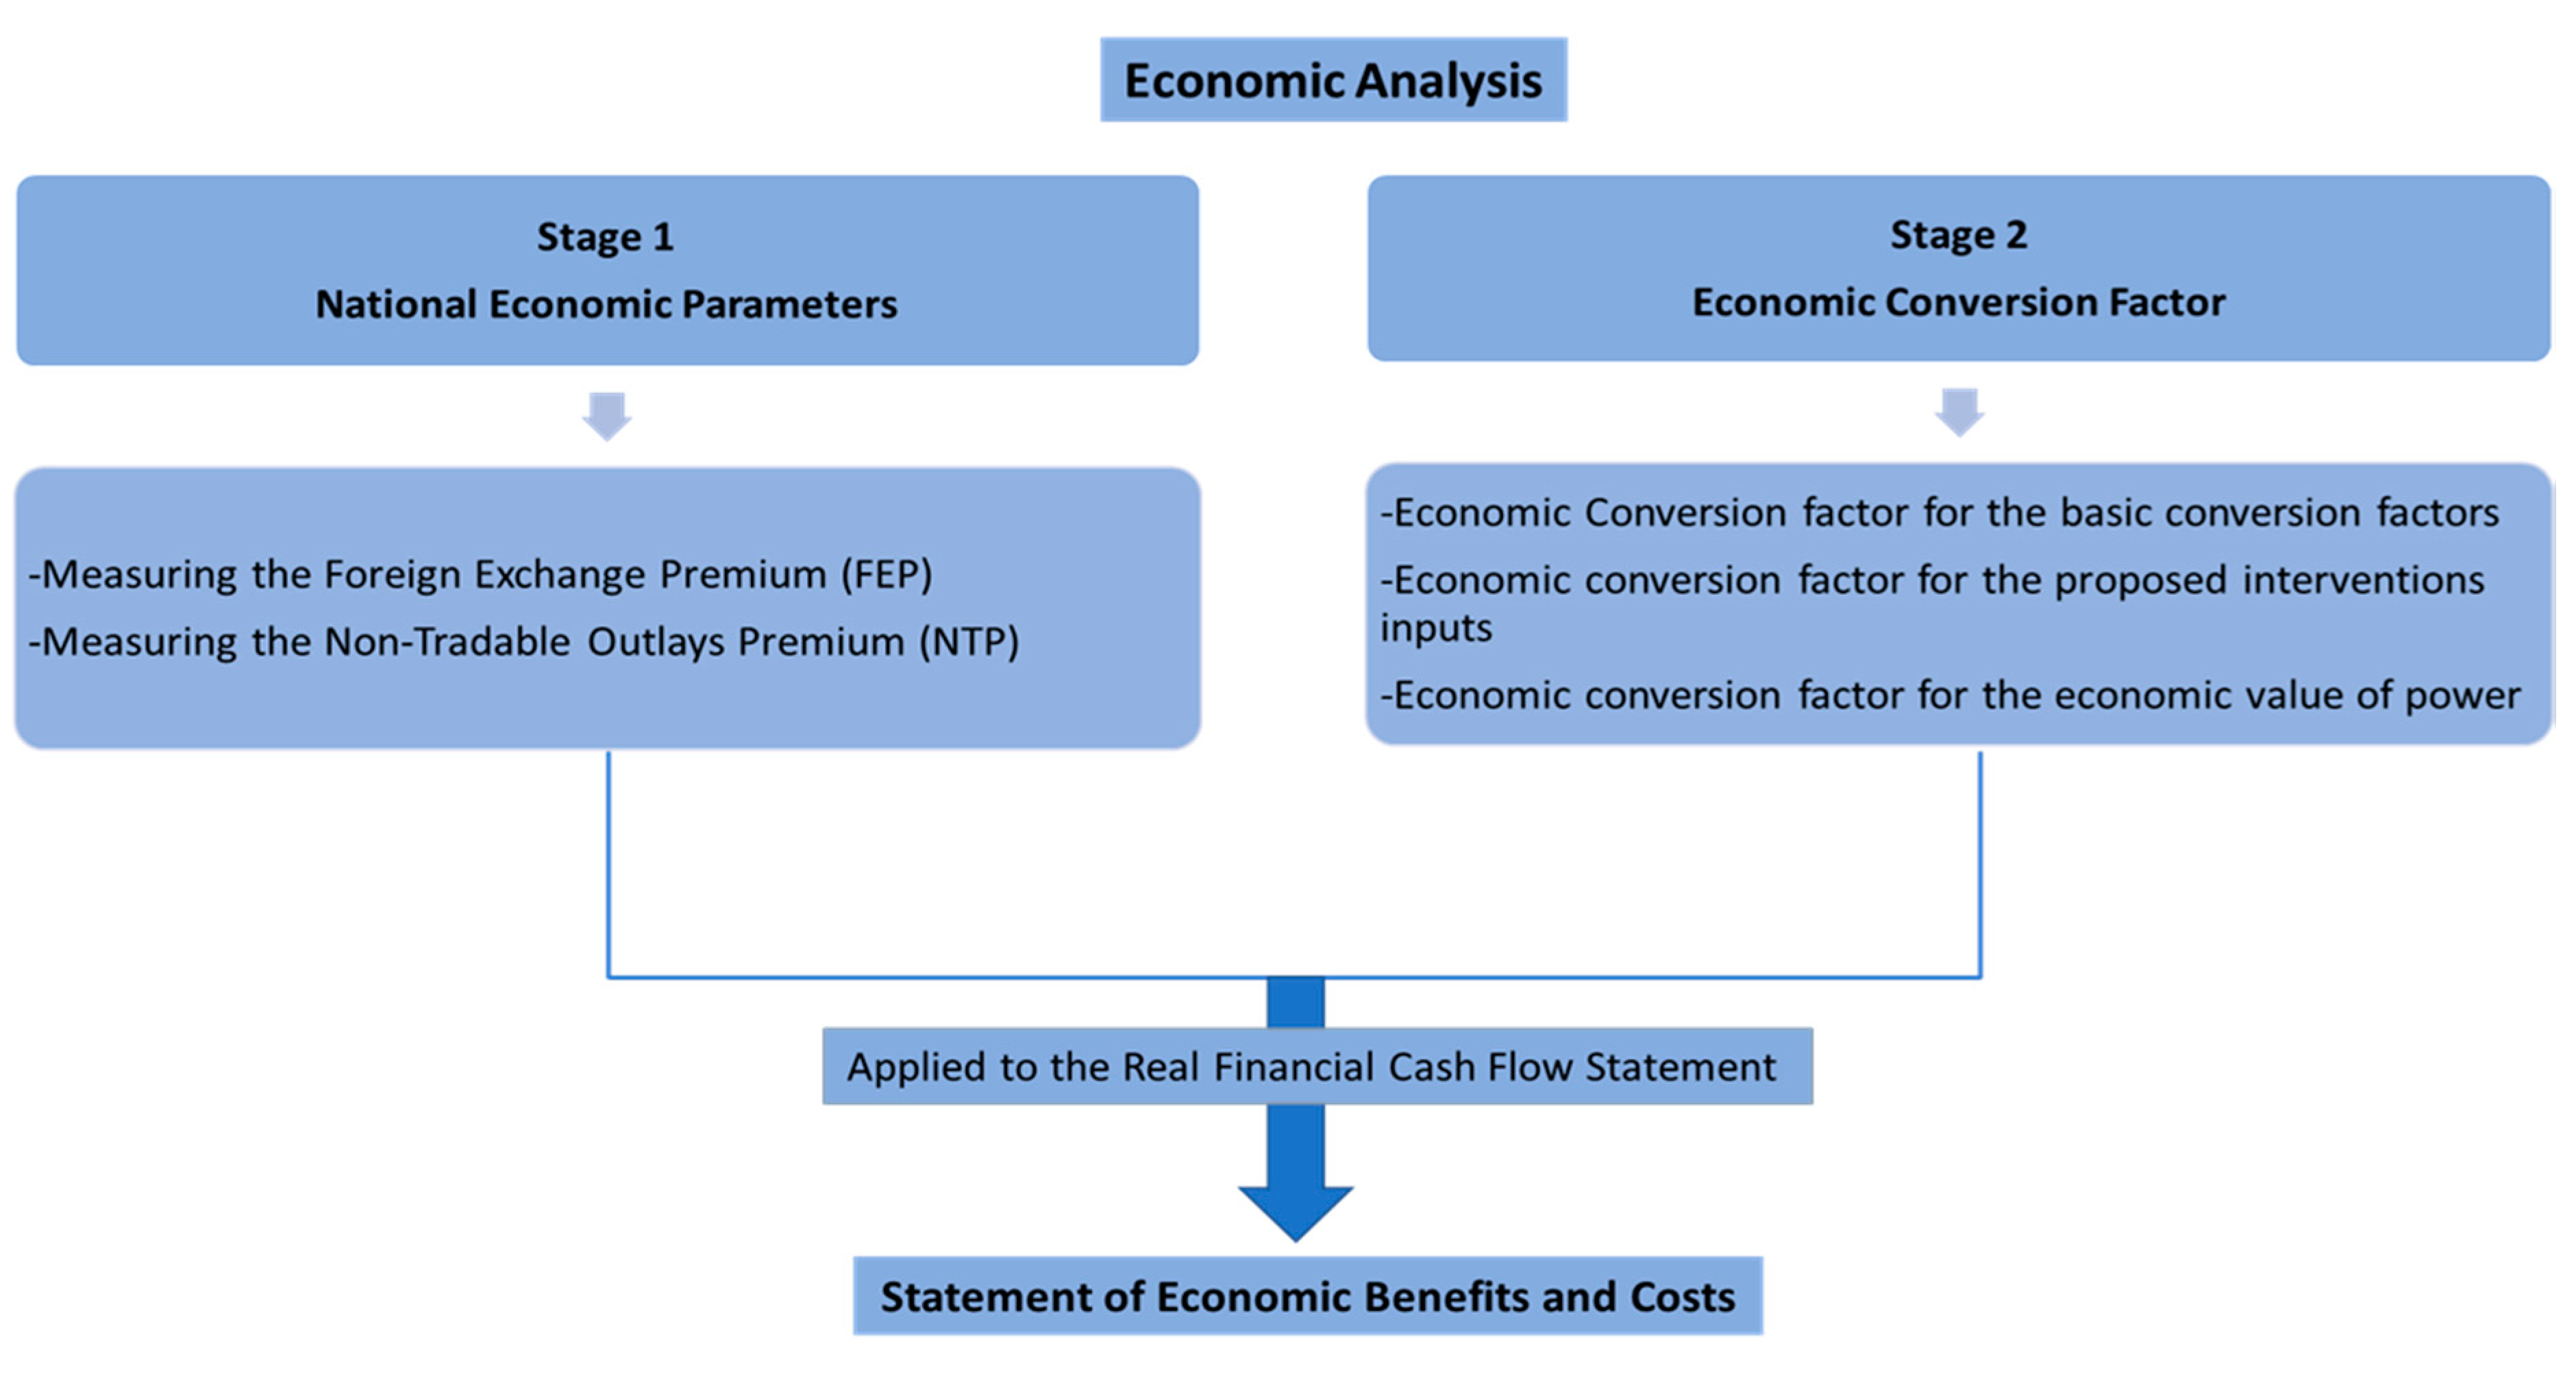
For the working capital, 30 days coverage (the turnover coefficient is equal to 12) is assumed for inventory, cash in hand, accounts receivable, and accounts payable. The Government of Egypt (GOE) provides 8–9% export support, and a 10% sales tax is assumed whenever applicable. The economic analysis followed the standard methodology as in
Figure 2. The economic analysis can be estimated through two-stage estimation processes. The first stage consists of measuring the foreign exchange premium (FEP) and the non-tradable outlays premium (NTP). The FEP and NTP depend on a variety of variables, including Egyptian imports, Egyptian exports, indirect taxes, export and production subsidies, export incentives, and other inequalities of the country’s external trade. Together with the economic discount rate, these variables are the main national parameters required to complete an accurate and consistent economic analysis of investment interventions (
Figure 2). The economic conversion factors are estimated in a second stage for the basic conversion factors, the proposed interventions inputs (e.g., operation cost, skilled and unskilled labor, and working capital), and the economic value of power.
The foreign exchange shadow price, or the ‘FEP,’ can be calculated by taking into account all the economic welfare effects induced by market fluctuations that interfere with the movement of supply and demand of tradable and non-tradable products. The economic influence depends on both the nature of the goods and services fluctuations in the markets and the source of the funds. Together, the aggregate effect of two business activities produces the FEP, which could be expressed as follows:
where
is the funds’ proportion that is sourced domestically,
is the funds’ proportion that is sourced abroad,
is the shift in economic welfare from the twin activities of the domestic capital market and the spending of funds on tradable goods.
is the shift in welfare cost resulting from the sourcing of foreign capital market funds and spending these funds on tradable goods.
For funds expended on non-tradable goods, the NTP may be determined by economic welfare adjustments due to difference in supply and demand of services and goods, tradable and non-tradable, in the face of price fluctuations induced by taxes and can be specified as:
where
is the funds’ proportion that is sourced domestically,
is the funds’ proportion that is sourced abroad,
is the amount of shifting economic welfare as a result of the joint operation of sourcing funds obtained from the domestic capital market and investing those funds in non-tradable goods.
is the increase in economic welfare as a result of the procurement of funds obtained from the international capital market and what is then invested in non-tradable goods. Where the market for tradable goods is split into the market for importable goods and the demand (
) for exportable goods,
weighted average of the elasticity of importable demand will then be seen as
and exportable
with regard to the real exchange rate. That is
, where
and
are the share of the overall tradable market for importable and exportable goods, respectively. The elasticity of the compensated demand for tradable goods will be calculated through estimating the compensated own-price demand elasticity of tradable goods market
and the compensated cross-price demand elasticity of non-tradables
, with considering the shifting in the foreign exchange rate (Sallam and Osama, 2020). The relationship is estimated by:
This condition includes verification of continuity in farms operations. Likewise, the elasticity of supply of tradable goods
is equal to the supply elasticities weighted average of importable goods
and exportable goods
, which could be described as follows:
where
and
stand for the supply share of exportable and importable goods in total tradable goods, respectively. Thus, this relationship holds for the supply side:
There are several levels of general sales tax in Egypt.
Table 2 presents the calculation of taxes on international trade transactions, exports, customs and other import duties, and other taxes, as follows: The regular limit is 10% for taxable goods, while a lower tax of 5% is applied to foodstuffs and fertilizers. Given the general assumption that sales taxes should be transferred in full to final customers, the cascading effect arising from the absence of credit for business purchases of capital goods or tax deductions is expected to be distributed over final household spending expenditure in the form of higher goods and services costs. Following these assumptions, the effective general sales tax rates on both tradable and non-tradable goods can be calculated. The percentage of exclusions from the general sales tax for general business purposes is assumed to be about 52% and 74%, which is lower than the 60% and 85% taken for the simulations with a value added tax (VAT) system, that in the case of receiving a partial credit under the general sales tax. [
93].
Table 2 shows the calculation results of FEP and NTP for the purpose of this study. Results from estimating the shadow exchange rate (SER), the standard conversion factor (SCF), and the foreign exchange premium (FX) premium are presented in
Table 2 and can be calculated as shown in Equations (8)–(10) below:
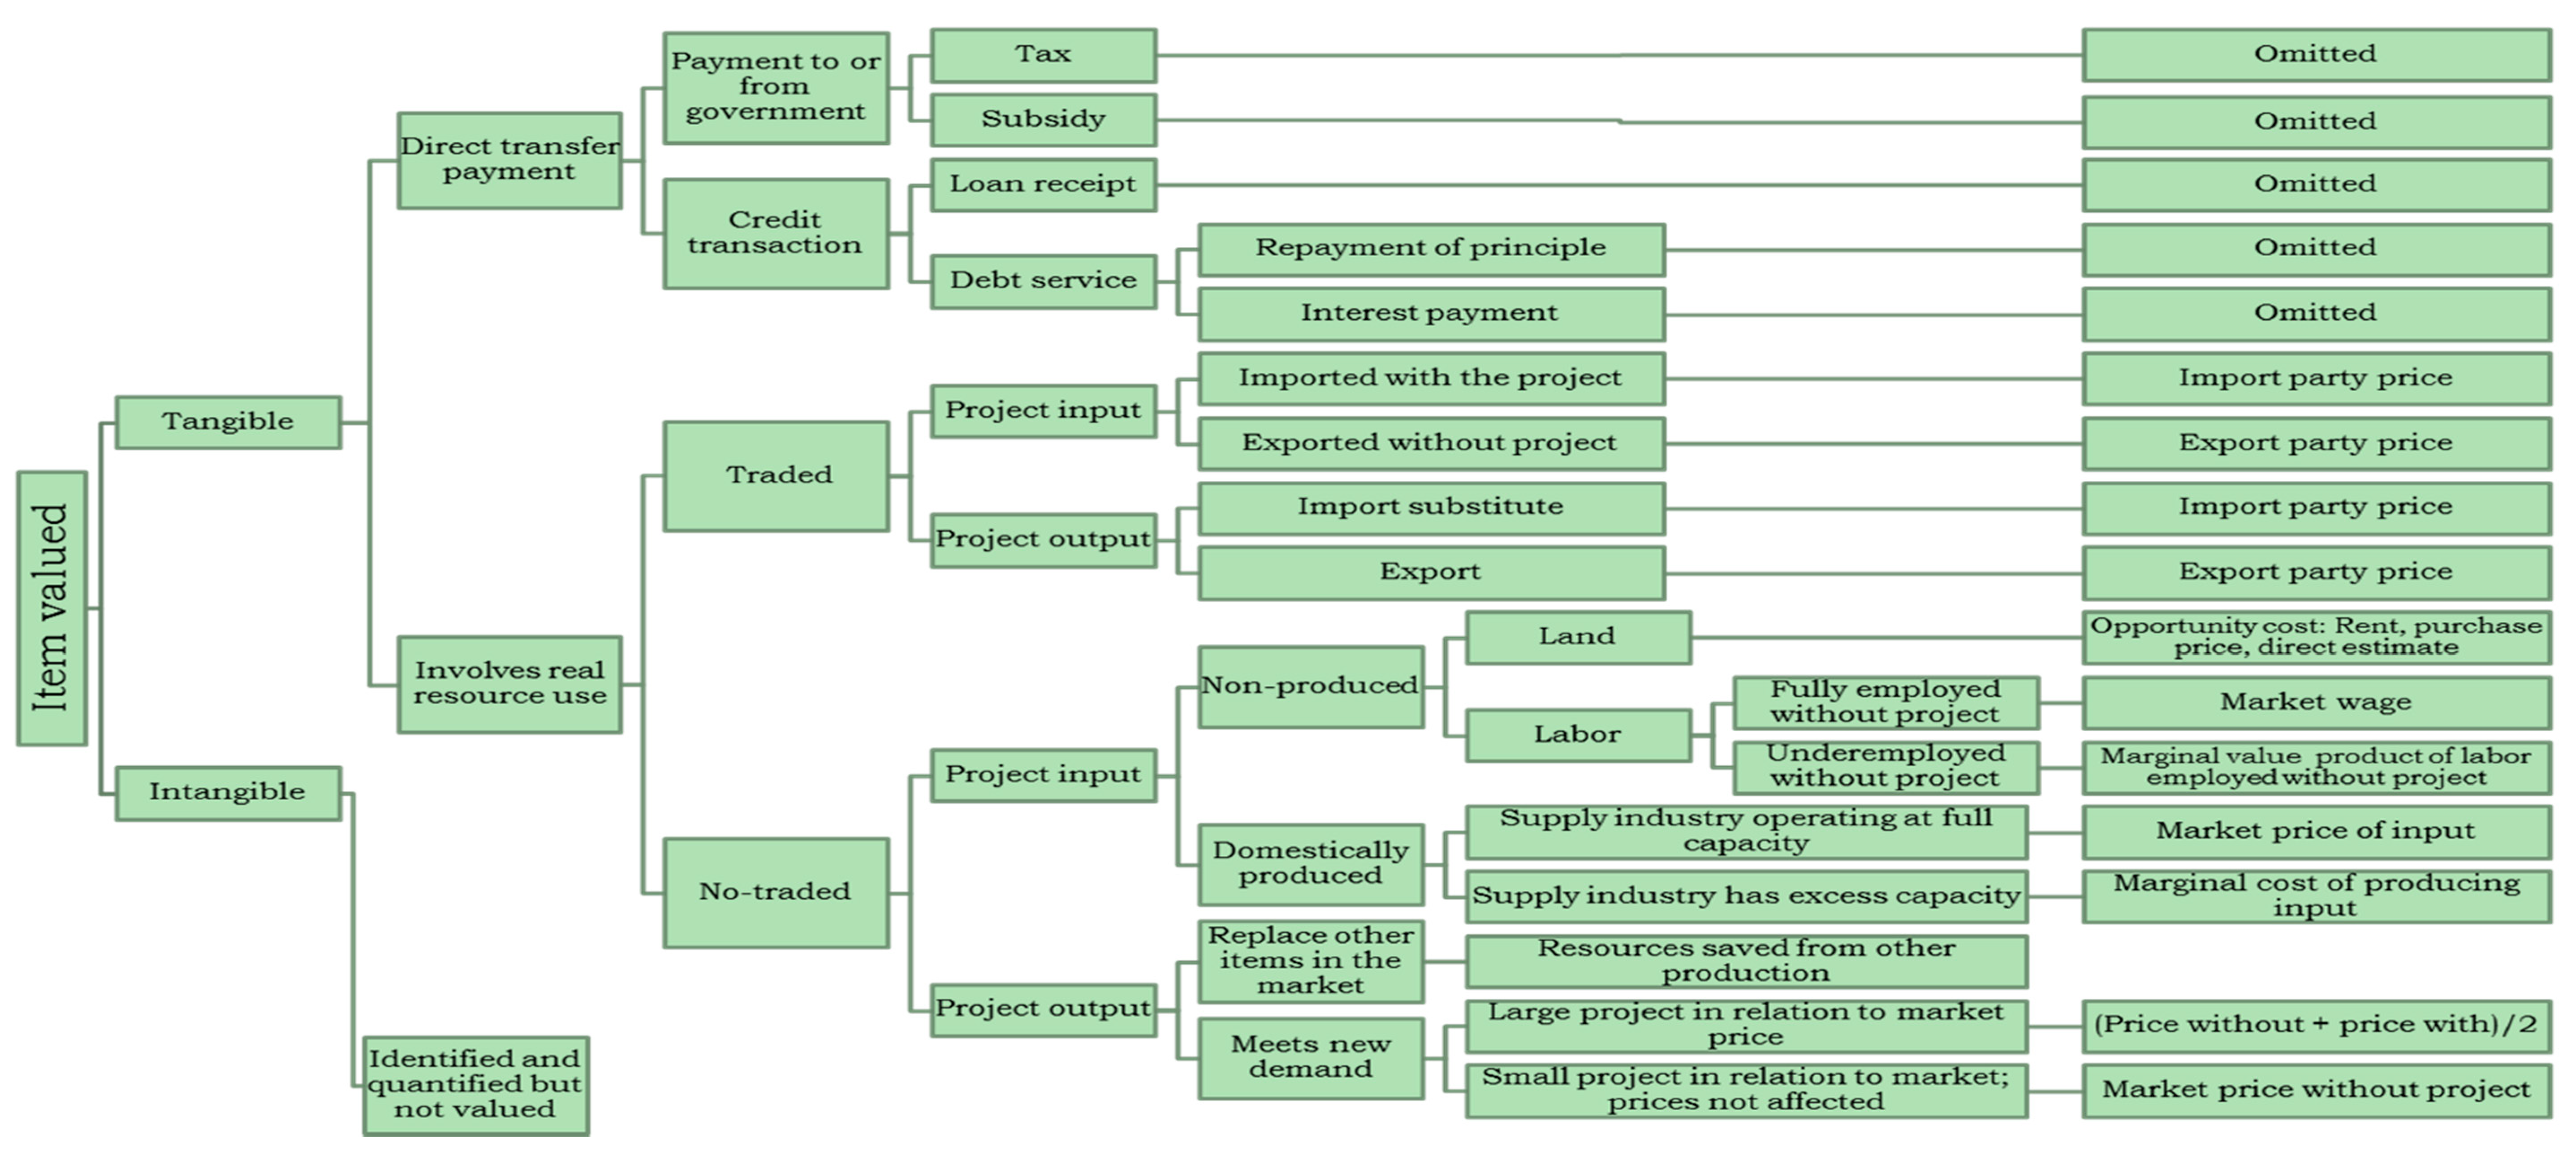
Financial prices for costs and benefits are converted into economic values, and they are adjusted to reflect the social values for the inputs and outputs of the interventions. The economic values have been calculated according to the decision tree shown in
Figure 3. This figure describes the two approaches used to determine the economic values. The first methodology is conducted assuming the economic values using the shadow price of foreign exchange; the value of traded goods is increased by the shadow price, which allows for the premium on foreign exchange resulting from distortions. The other methodology describes the shift in opportunity costs of real national income, which are converted from foreign exchange and using a conversion factor to the opportunity value cost in the use of non-traded goods. The financial prices of tangible goods are modified in three successive steps to reflect economic values: (1) Shift of the direct transfer payments; (2) shift of the price distortions in traded items; and (3) shift of the price distortions in non-traded goods and products.
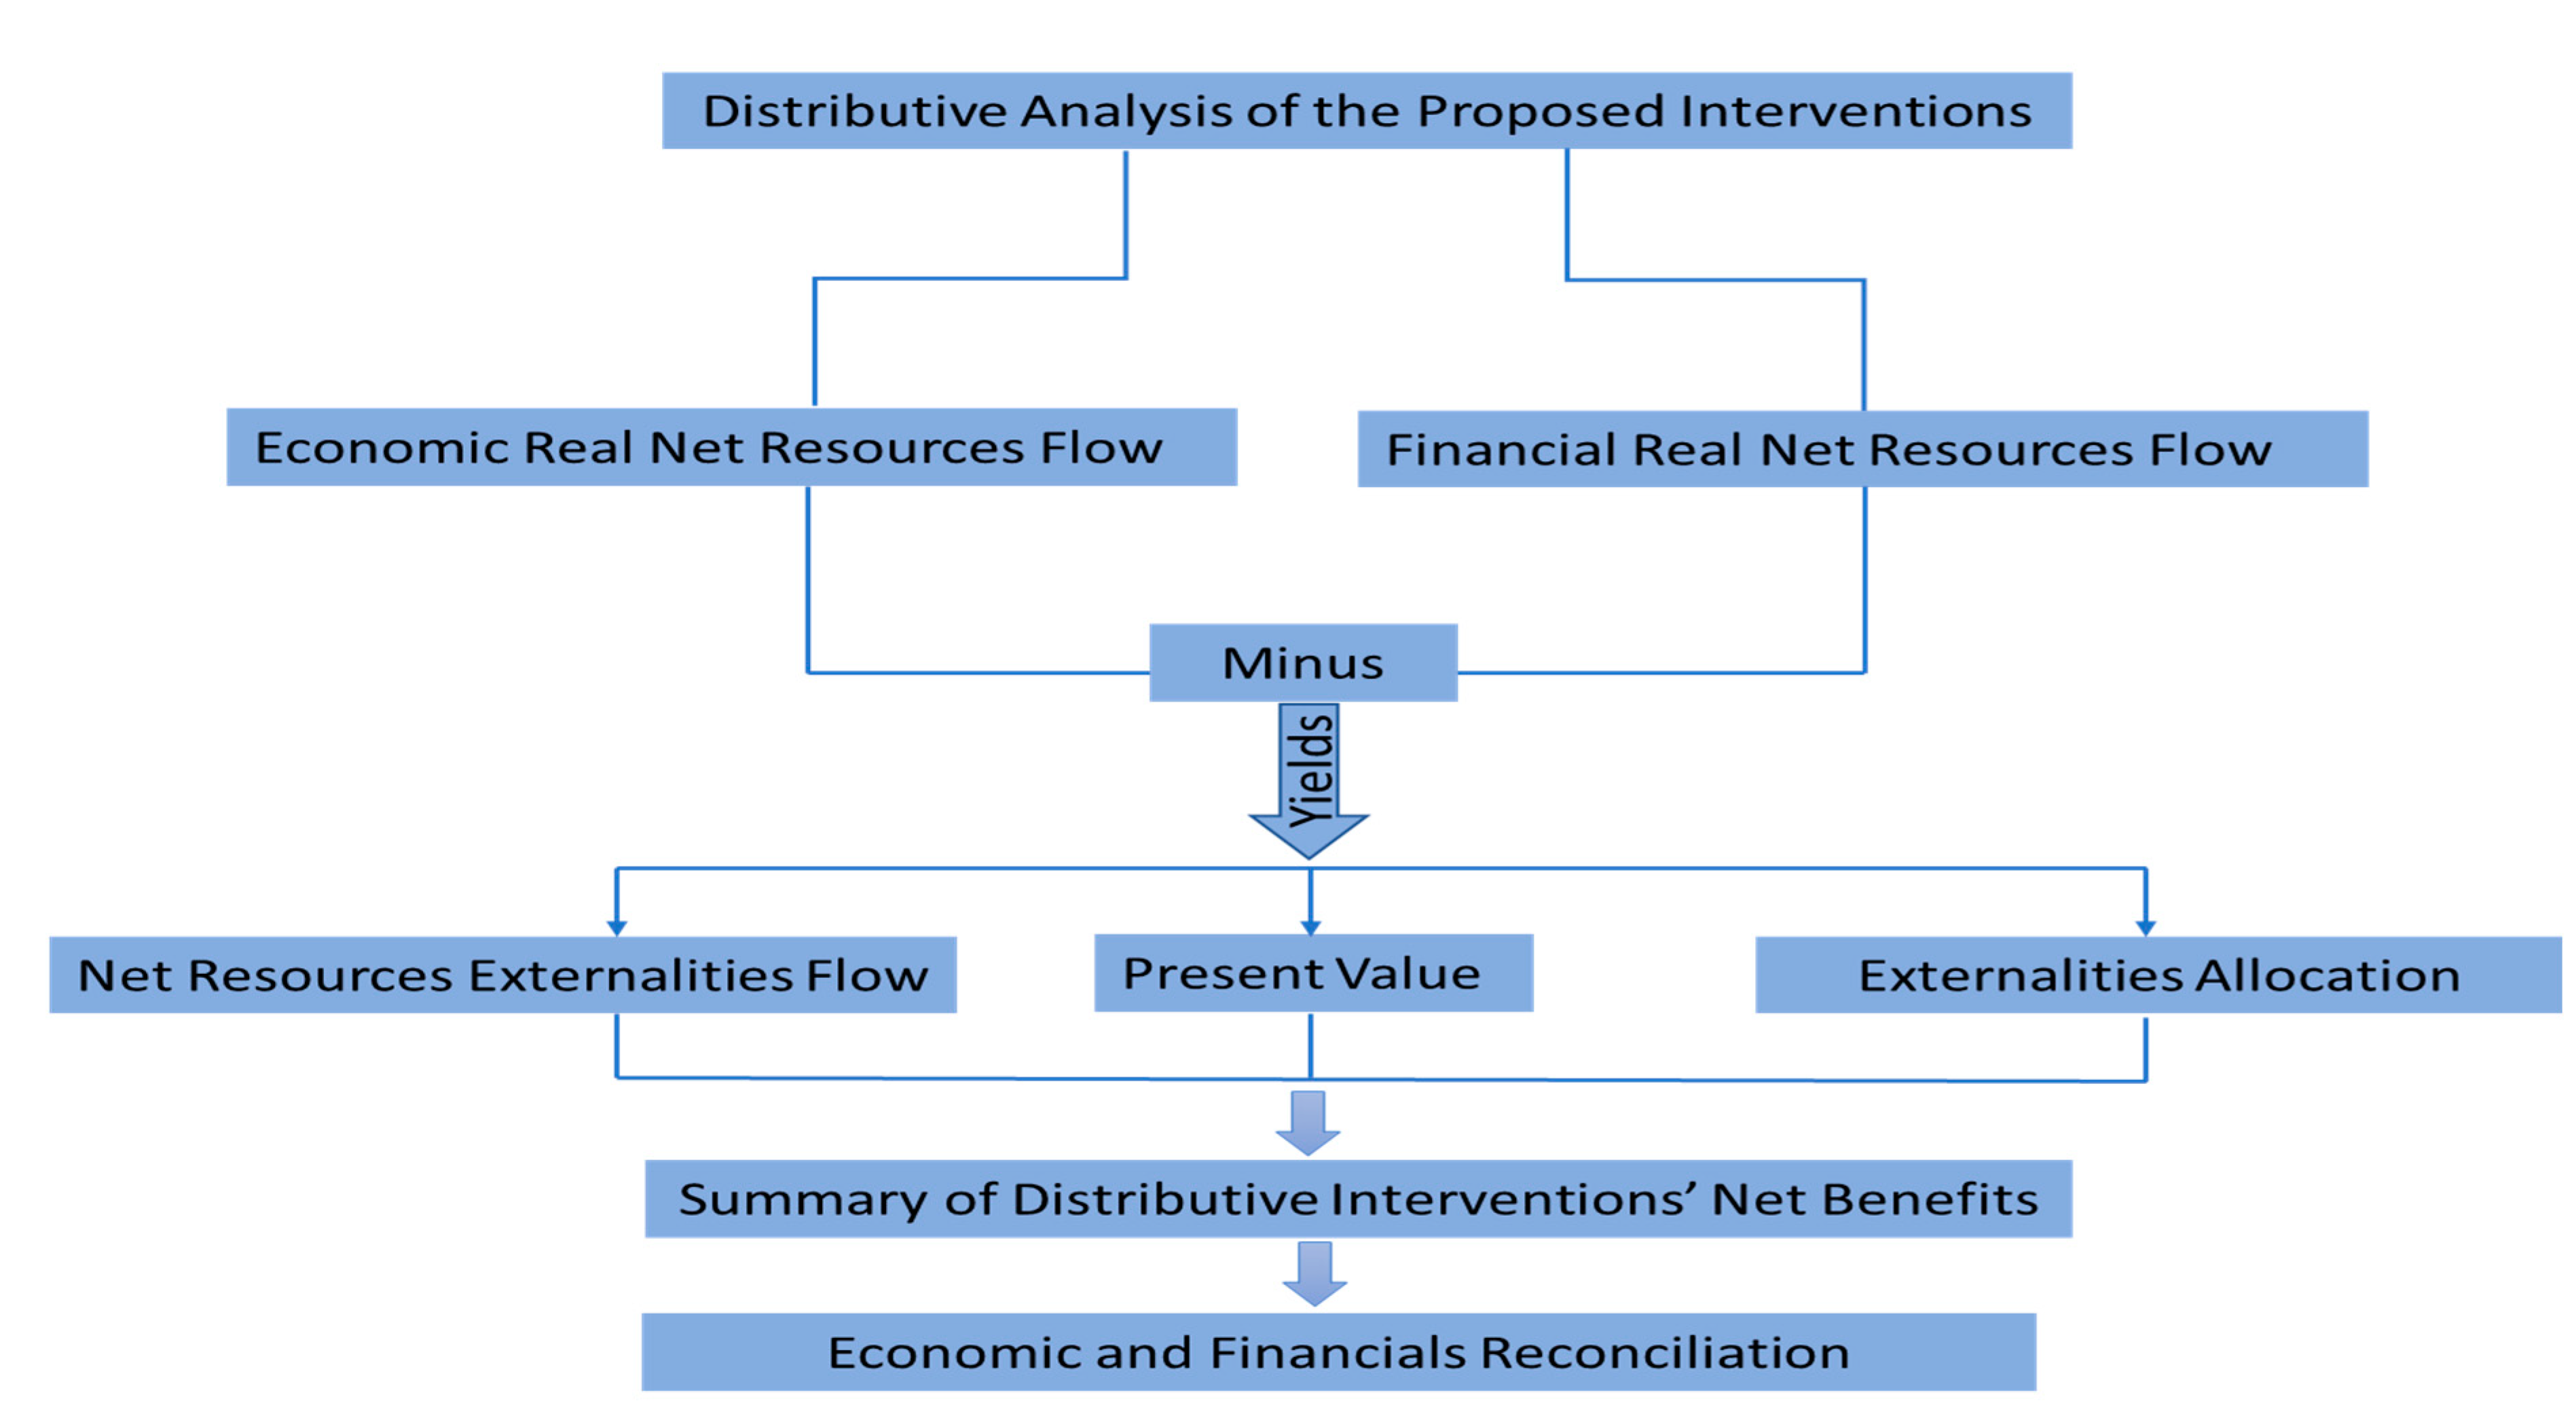
A distributive analysis of the project is conducted following five distinct steps indicated in
Figure 4: Identify the externalities and measure the net impact of the externalities in each market as the real economic values of resource flows less the real financial values of resource flow; measure the values of the various externalities throughout the analysis period and calculate their present values using the economic opportunity cost of capital; allocate the externalities across the various stakeholders of the project; summarize the distribution of the project’s externalities and net benefits according to the key stakeholders and actors in the target value chain; reconcile the economic and financial resource flow statements with the distributional impacts. Reconciliation of the economic externalities is determined by the following structure:
Reconciliation considers consumers (gain/loss in consumer surplus), labor, exporters, government (change in government tax revenues, the tariff charged that paid on the purchase of the goods, the government loss as a consequence of export subsidies, the foreign exchange used to buy the product, and inputs, which is called foreign exchange premium), and labor surplus.
Risk analysis and a risk-adjusted model are common types of risks facing any agricultural intervention. Risk is the potential for additional costs above the intervention cost model. Historically, agriculture intervention evaluation has tended to not adequately take risk into account.
Early use of skewed values in the budgeting cycle will contribute to real economic costs. The following steps are included in the risk analysis and mitigation strategies for this intervention:
- Step 1:
Identify the Risk: Both economic and technical risks are considered. The following strategies for risk estimates are considered: Information is gathered from well-designed focus groups in the target area, produce exporters with particular expertise in Upper Egypt, and the impacts of each risk are carefully quantified. The impacts of the identified risks are classified by effect and timing:
- Effect:
If a risk occurs, its effect on the interventions may result in cost increases, revenue reductions (yield and/or price), or delays, which may in turn also have cost implications.
- Timing:
The risks may influence the interventions at different times in the intervention cycle. Construction risk will usually impact the early-stage interventions. Consideration is also provided to the impact of the capital expenditure (CapEx) inflation (capital expenditure is the firms’ expenditure incurred to achieve potential profits by purchasing assets which will have a useful life beyond the tax year). Specification of all direct effects for each category of risk is considered with a specific focus on construction risk. Construction risk is a broad risk category, but there could be three direct impacts, or sub-risks: The cost of raw materials is higher than assumed; the cost of labor is higher than assumed; a delay in construction results in increased construction costs as an interim solution needs to be found.
- Step 2:
Estimate the likelihood of the risks occurring: There are certain risks whose likelihood is small, but since the effect would be high, the risk cannot be discounted as insignificant.
- Step 3:
Estimate the cost of each risk: By multiplying costs and probabilities, the cost of each sub-risk is calculated separately.
- Step 4:
Identify strategies for mitigating the risks: In this analysis, the most important part of the risk assessment and mitigation is considered by addressing each particular risk and the associated cost(s) of such mitigation.
- Step 5:
Construct the risk-adjusted intervention cost model: The base intervention cost model is risk adjusted as:
- Step 6:
Preliminary analysis to test affordability: As a preliminary assessment of the proposed interventions’ affordability, the risk-adjusted intervention cost model is compared with the interventions’ financial budgeting as estimated during the solution options analysis.
A sensitivity analysis is used to assess the responsiveness of the financial and economic model based on changes in the assumptions upon which the model was based. A full sensitivity analysis of the financial results of the base scenario of the interventions is carried out in terms of ±5%, 10%, 15%, and 20% of the recurrent input costs, fixed investment costs, and reduction in the expected sales prices of the interventions’ outputs.
4. Results
The total expenditure (cash outflows) and revenues (cash inflows) are described in detail in
Table 3, which classifies production based on: Export quality which is high-quality products that meet international standard requirements; high-end market quality classified as less quality products that could be sold to hypermarkets, for example, and cost less than the exported products; and the local market quality, classified as the lowest quality products that can neither be exported nor sold to high-end markets and sold at a lower price than the high-end market quality products. The net cash flows (gross net cash value) could be used as performance indicators of the proposed interventions. Results in
Table 3 indicate that, without interventions and under conventional farming, the overall gross net cash value per feddan are USD 89, 169, and 72 for table grapes, green beans, and green onions, respectively.
After three years of applying the proposed interventions, the gross net cash value is USD 3.355, 1.508, and 1.634 thousand for table grapes, green beans, and green onions, respectively. Although the overall costs with the intervention is higher than without the intervention, the returns are much higher with the intervention and improve the farming and marketing practices, which cover the costs and lead to a higher profit compared to that obtained from traditional practices. This implies that the interventions will enable Upper Egypt horticulture growers to benefit from the high-value export chains and receive a higher gross net cash value than without the intervention.
The main purpose of using financial analysis in
Table 4 (The Financial Net Present Value (FNPV) and the Financial Internal Rate of Return FIRR) is to use the forecasts of the cash flow of the interventions to estimate suitable net return indicators and evaluate the financial sustainability of the proposed measures. Without the interventions, for one Feddan, the financial net present value (FNPV) for growers’ investments in the table grape, green bean, and green onion value chains are USD 1.154, 1.158, and 1.132 thousand, while the IRR is 15%, 13%, and 13%, respectively. With interventions, the FNPV will increase to USD 16.600, 8.142, and 8.475 thousand and the FIRR to 42%, 56%, and 149% (
Table 4). This will generate real incremental financial benefits of USD 15.446, 7.984, and 8.343 thousand for table grapes, green beans, and green onions, respectively.
Real cash flows are presented in
Table 5 with interventions targeting of 921, 2.154, and 357 Feddan for table grapes, green beans, and green onions, respectively. If traditional practices continue, each farmer in the target production areas will earn, over the 20-year, a financial benefit of FNPV USD 1.010 million, 1.327 million, and 170 thousand in total for grapes, green beans, and green onions, respectively. However, this amount increases to USD 15.090, 22.690, and 4.244 million for grapes, green beans, and green onions, respectively, if the interventions are effectively implemented. Also, the FIRR shows increases reaching 112%, 72%, and 55% for grapes, green beans, and green onions, respectively. The FNPV and the FIRR are used to assess the future performance of the intervention in comparison to continuing with traditional practices. Results imply that the FNPV is always positive and the FIRR is higher than the applied discount rate. This implies that concentrating on enhancing the decision-making of the targeted value chain players and improving the exportability and logistics will lead to improving the sustainable financial performance for the smallholder farmers in Upper Egypt.
Real economic flows are calculated in
Table 5 by using appropriate conversion factors to adjust the financial cash flows from the total investment perspective. Total cash inflow is estimated based on the net sales, changes in account receivables, and salvage values. While cash outflow is estimated based on the direct and indirect cost, e.g., irrigation, land, and trellis system investment costs and all operational costs, including fertilizers, pesticides, land preparation, planting materials, fuel and lubricants, packaging materials, other operational costs, and labor costs. The economic resource flow has been calculated by multiplying the respective conversion factors by the line items of USD (real). The results of the incremental benefit show a high improvement in the targeted value chains with the application of the proposed interventions (
Table 5). As the incremental Economic Net Present Value (ENPV) (USD 16.112 million) is higher than the incremental FNPV (USD 14.080 million), The relevant stakeholders and actors along the grape value chain who obtaining marketing and logistical assistance will generate the total incremental economic benefit of USD 2.032 million (
Table 5). Laborers’ and farmers’ share of the incremental ENPV is USD 1.694 million, input suppliers’ real ENPV share is USD 228 thousand, and the government’s share is real ENPV USD 110 thousand since the government budget will be affected positively through different import tariffs and taxes on agriculture inputs.
For the green bean value chain, the incremental ENPV is USD 25.497 million, which is higher than the incremental FNPV (USD 21.363 million). This indicates that by improving the green bean value chain with the proposed interventions, the total incremental economic benefit will generate USD 4.134 million. Laborers’ and farmers’ share of the incremental is ENPV USD 3.660 million. The input suppliers’ share is real ENPV USD 334 thousand, and the government share is real ENPV USD 140 thousand. With interventions, the green onion value chain will be improved, which could generate a total incremental economic benefit of USD 262 thousand. Laborers and famers are the key beneficiaries of the interventions at the upstream value chain level with a share of the incremental ENPV USD 216 thousand. The share of the input suppliers is USD 27 thousand, and the government share is real ENPV USD 19 thousand. The targeted households in Upper Egypt will significantly benefit from the proposed intervention, since the real income for them would increase to reach USD 190 thousand, 1.084 million, and 185 thousand for grapes, green beans, and green onions, respectively.
Since the ENPV is positive and the EIRR is higher than the social discount rate, the proposed interventions for improving the horticulture value chain have a positive, sustainable economic return that uses less valuable social capital and resources to provide high social benefits for the rural community in Upper Egypt.
The impact of the interventions on employment (
Table 5) implies a real FNPV of USD 7.940, 4.946, and 1.913 thousand for unskilled labor and USD 1.458, 3.402, and 1.101 thousand for skilled labor. The employment impact of the interventions revealed real incremental employment opportunities at the farming level of 38.746, 18.155, and 3.616 thousand per person/year for grapes, green beans, and green onions, respectively.
The economic benefits of the interventions are subject to a sensitivity analysis assuming a number of variations between −20 and +20 with step 5% in real prices, operational costs, and exportable yields. The change range is 25–35%, 40–80%, and 35–65% for grapes, green beans, and green onions, respectively. The NPV would decrease by 47%, 40%, and 46% if there is a 5% decrease in the selling price. If there is a real increase of 5% in the operational costs, such as fertilizer, seeds, fuel, pesticides, labor, etc., the NPV will decrease by 46%, 45%, and 44%. The NPV will increase by 46%, 48%, and 46% for grapes, green beans, and green onions, respectively, if the exportable yield (ratio of an exportable production to total production per ton/feddan) increases by 5. These results imply that the decreases in selling prices or increases in the direct operational costs will not impact the activities and the intervention efficiency would have low economic and financial impact.
A risk analysis has been conducted using @RISK Professional 6 software and the results are shown in
Table 5. The simulation runs number used is 5.000. The following assumptions were made: Standard normal distribution with parameters
= 126% and
= 25% for fresh table grapes, fresh green beans, and
= 48% and
= 13% for green onions (
is estimated based on the sensitivity analysis results, while
is the minimum mean value, and, likewise, maximum scenarios). Results of the risk analysis for the fresh table grape, fresh green bean, and green onion value chains are: The mean value of EIRR
works out to 126%, 72%, and 48%; the standard deviation
25%, 18%, and 13%, respectively. The probability of a negative NPV and EIRR is almost 0%. These results indicate that the fresh table grape, fresh green bean, and green onion value chains enjoy limited risk for the farmers in the target area of Upper Egypt.
Generally speaking, the interventions are stable and can absorb several shocks without heavily affecting the financial and/or economic viability. This holistic value chain approach will create significant financial and socio-economic benefits for the growers, input suppliers, exporters, service providers, and society.
5. Discussion
Improving the agricultural sector in rural areas is necessary, particularly in developing countries, so the livelihoods of the poor can be improved. Evidence of the need for agricultural interventions to improve the sustainable socio-economic conditions in Egyptian rural communities has been found by Zahran et al. (2020). This study evaluates the socio-economic viability of the proposed agricultural interventions by using a CBA method. The proposed interventions are expected to yield favorable financial and economic results. Our results imply that the gross net cash value is much higher in the case of implementing the proposed interventions compared to implementing the traditional practices. This comes out to USD 3.355, 1.508, and 1.634 thousand per feddan with the interventions, while the gross net cash value is reduced to USD 98, 169, and 72 per feddan without the interventions for grapes, green beans, and green onions, respectively.
Without interventions, the FNPV for the growers’ investments in the target value chains is USD 1.10 million, 1.327 million, and 170 thousand and the FIRR is 15%, 13%, and 13% for grapes, green beans, and green onions, respectively. With interventions, the FNPV will increase to USD 15.090, 22.690, and 4.244 million and the IRR to 112%, 72%, and 55% for grapes, green beans, and green onions, respectively. The statement of the economic externalities revealed an ENPV of USD 16.112, 25.497, and 4.336 million, which is higher than the FNPV and generates externalities of NPV USD 2.032 million, 4.134 million, and 262 thousand for grapes, green beans, and green onions, respectively.
Growers and laborers are the key beneficiaries of the interventions at the upstream value chain level. The share of the growers and laborers is an ENPV of USD 1.694 million, 3.660 million, and 216 thousand and the input suppliers’ ENPV is calculated at USD 228, 334, and 27 thousand. The government budget will be positively affected through different import tariffs and taxes on agriculture inputs, while it will negatively affect the export subsidy program as a result. The net results of the positive and negative impacts will result in a net positive impact estimated at USD 110, 140, and 19 thousand for grapes, green beans, and green onions, respectively.
Sensitivity analysis was conducted for the economic benefits of the interventions assuming 20% increases/decreases in real prices and investment and operational costs. The range of change of the EIRR is 25% to 65% for the three selected value chains. The interventions can withstand a fairly large variety of changes without impacting their economic or financial viability. According to our risk analysis, applying a Monte Carlo simulation method, we found that the probability of negative outcomes is 0% for the proposed interventions. The evidence of the impact of the interventions on employment is found by creating real incremental employment opportunities at the farming level of 38.746, 18.155, and 3.616 thousand persons/year—of which 10.847, 5.539, and 1.377 thousand were women employment opportunities—for the grape, green bean, and green onion value chains, respectively.
These results are consistent with Jenkins et al. [
10], Musolino et al. [
32], Mittal [
48], and Kagin et al. [
59], who found that the agricultural interventions related to the efficient use of agricultural inputs (e.g., introducing new seed varieties, managing the use of soil, water, and chemicals); improving farming and the capacity building of farmers’ organizations; and market intelligence could all to lead to increases in farmers’ profitability and enhance their sustainable socio-economic circumstances. These findings are in contrast to some studies, such as Diao et al. [
37] and Dorosh and Thurlow [
38], who found little evidence that agricultural interventions can lead to fostering livelihood improvements in the rural regions of developing countries.
6. Concluding Remarks
Export markets of the selected value chains (table grapes, green beans, and green onions) are large and growing, particularly for the EU, Gulf countries, and Far East markets. Egypt already has experience exporting fresh produce to various markets. The Egyptian fresh horticulture crop export values and volumes showed a dramatic increase over the last years. Even though Upper Egypt has the largest market windows for fresh produce with moderate weather conditions that enable harvest earlier than other geographic areas in Egypt and other countries, most exports currently come from the northern part of Egypt. Agricultural interventions that convert the existing traditional farming and marketing practices in Upper Egypt to modern export/high-end market-oriented production through improved use of market intelligence and logistics is entirely justified financially as well as economically. To examine the sustainable socio-economic impact of applying the proposed interventions and activities, a comprehensive CBA combining sensitivity and risk analysis through a Monte Carlo simulation method was applied. The key objective of these interventions is to allow Upper Egypt to compete more efficiently in foreign markets by reducing the time-to-market costs and bringing much-needed supply chain infrastructure to the region. Our analysis results have repeatedly proven the significance of the positive financial and economic impacts of the interventions. The interventions will enable Upper Egypt horticulture growers to benefit from high-value export chains. This holistic value chain approach will yield to significant financial and socio-economic benefits for the growers, input suppliers, exporters, service providers, and society.
All of the selected value chains are financially and economically viable. Target value chains were ranked according to marketing opportunities, financial and economic returns, required equity capital, and risk associated with individual value chains. The green bean value chain is ranked number one, followed by table grapes and green onions, in that order. Overall, the proposed interventions are viable from financial and socio-economic perspectives for sustainable livelihoods. They are low risk and have a low probability of negative returns from the value chain actors’ point of view, and if we add the economic benefit to society, the probability of negative returns to the economy becomes almost zero. Therefore, it is recommended that these interventions are implemented.
The present research could be extended in different ways. The estimation for further models could supplement the present estimation results, such as performing a Life Cycle Analysis (LCA) and using technical efficiency methods to identify the processes that cause the most significant environmental and socio-economic problems along the agri-food value chain. Thus, it could be possible to overcome the identified shortcomings by introducing more efficient agricultural practices and serving to design sustainable and environmentally friendly value chains in the agricultural sector. Furthermore, the same analysis could be applied in different countries that have the same social and economic conditions (e.g., Tunisia, Algeria, Morocco, and Sudan) to evaluate the potential of improving the socio-economic circumstances in rural areas by implementing the same proposed interventions and investing in the agricultural sector to improve production and ensure operational compliance with international standards.


