Article

Towards Developing a New Model for Inclusive Cities in China—The Case of Xiong’an New Area

1
Faculty of Civil Engineering and Geosciences, Delft University of Technology, Stevinweg 1, 2628 CN Delft, The Netherlands
2
Erasmus School of Law & Rotterdam School of Management, Erasmus University Rotterdam, Postbus 1738, 3000 DR Rotterdam, The Netherlands
3
Institute for Global Public Policy, Fudan University, Shanghai 200433, China
4
Shenzhen Institute of Building Research Co., Ltd., Shenzhen 518049, China
5
Department of Public Policy & School of Energy and Environment, City University of Hong Kong, 83 Tat Chee Avenue, Kowloon, Hong Kong SAR
*
Author to whom correspondence should be addressed.
Sustainability 2020, 12(15), 6195; https://doi.org/10.3390/su12156195
Submission received: 15 July 2020 / Revised: 20 July 2020 / Accepted: 25 July 2020 / Published: 31 July 2020
(This article belongs to the Section Sustainable Urban and Rural Development)

Abstract

:
Along with unprecedented urbanization in the last few decades, cities have experienced rapid social and economic transformation in China. A major challenge facing urban authorities in the immediate future is how to plan and govern cities such that they can serve as inclusive systems where everyone is enabled and empowered to fully participate in and contribute to socioeconomic life. A first step towards realizing this is to conceptualize an integrated framework that allows analysts and decision-makers to delineate, evaluate, and guide the development of these cities towards inclusiveness. In this study, we conducted a conceptual analysis of urban inclusiveness and then proposed a multidimensional framework for the evaluation of inclusive development. This is followed by the presentation of the case of Xiong’an, for which inclusive development indicators (IDIs) were selected. By comparing the state before the establishment of Xiong’an with its current development progress, and analyzing the area’s management structure and policy measures, the inclusive development challenges are identified. Subsequently, suggestions are given on how to direct Xiong’an toward higher levels of inclusiveness, including offering equal access to public services and employment opportunities, preserving environmental health and sustainable use of natural resources through waste recycling, and encouraging public participation in decision-making to bring higher levels of inclusion within reach.

1. Introduction

Over the past 40 years, China’s GDP growth per annum has averaged at nearly 10 percent, making it the fastest sustained expansion by any major economy in history [1,2]. This has enabled more than 800 million people to elevate themselves out of poverty, while the urbanization rate has increased by 42.68 percent (from 17.92% to 60.60%) [3]. However, in this same period China’s social Gini coefficient climbed from 0.2 to 0.468, which is much higher than the average level of the OECD countries [4]. To promote urbanization and industrialization, many special economic zones (SEZs) have been established to concentrate investments and the labor force within designated areas with more flexible management systems. Some SEZs have developed into world-class metropolises, population and economy-wise. High urban densities reduce transaction costs, make public spending on infrastructure and services more economically viable, and facilitate generation and diffusion of knowledge, all of which are important factors for growth. However, this magnificent growth also generated issues of immigration, transport and congestion, environmental pollution, and uneven distribution of resources [5,6]. Given these circumstances, the World Bank and Development Research Center of the State Council of China published a joint report ‘Urban China: Toward Efficient, Inclusive, and Sustainable Urbanization’ in 2014, officially advocating the idea of inclusive urbanization and urban–rural integration [7].
On April 1st 2017, Xiong’an New Area (simplified as Xiong’an from here on) was announced to be the first National New Area as the “Millennium Plan, National Event” by the State Council and the Central Committee of the Communist Party of China. It has become the third new special zone with “national significance” after Shenzhen SEZ and Shanghai Pudong New Area. Shenzhen SEZ was the economic development test field planned by Deng Xiaoping in the context of economic reforms, which has driven the rapid development of the Pearl River Delta. The construction of the Pudong New Area in Shanghai since 1993 was the vehicle of Jiang Zemin’s reform and drove the development of the Yangtze River Delta. Xiong’an New Area, as the No.1 project in the Xi Jinping era, connects the Silk Road Economic Belt and the 21st-century Maritime Silk Road with the Guangdong–Hong Kong–Macao Greater Bay Area. It will drive the development of the Beijing–Tianjin–Hebei economic triangle in Northern China. As a new generation SEZ, Xiong’an aims to alleviate the big-city problems in cities next to it, such as Beijing and Tianjin, and eventually become a national model for sustainable and inclusive development in China. In the process of urbanization, Xiong’an will be facing many challenges, such as demographic structural changes, industrial transformation, high-speed infrastructure development, and intensified pressure on natural resources. How can economic prosperity be realized while promoting the sustainable use of environmental resources and meeting the diverse demands of urban dwellers? Answering that question is the key to achieving long-term inclusive development goals for Xiong’an.
The literature on ‘inclusive development’ and ‘inclusive growth’ has attracted a growing amount of attention; the term has even become a new mantra in national and regional policy. This was caused by the driving role cities play in economic and political development [8,9,10] and the consequences of the huge gap in living standard between groups in society with different characteristics that could potentially lead to exclusionary practices (such as income, occupation, gender, race, ethnicity, etc.), which come along with growing urban prosperity [8,11,12,13,14,15]. Researchers have already proposed a variety of frameworks/models and indicators to evaluate the progress in generating inclusive development. One of these is the Inclusive Growth Framework built by the International Monetary Fund, which outlines the key features of inclusive growth and focuses on the interaction between growth and poverty, and growth and inequality [16]. Another one is the Inclusive Development Index developed by World Economic Forum, which measures how countries perform on 11 dimensions of economic progress within three pillars: growth and development, inclusion, and intergenerational equity—sustainable stewardship of natural and financial resources [17].
There are, however, some limitations that may jeopardize the applicability and accuracy of these frameworks/models. For example, some frameworks primarily focus on income inequality but fail to take into account other dimensions of inequality, such as pollution and access to basic services. Specifically, tracking the inclusive development of cities like Xiong’an in developing countries is even more challenging. First, the area is still in a very early stage of the urbanization process, with overall low economic development. Its development has always been aimed at achieving economic growth, limiting the availability of historical data on social and environmental aspects. Second, due to local talent and resource constraints, there is a gap between the formulation of top-level policies and local implementation. Third, with the ongoing rapid urban development, the understanding and acceptance of inclusiveness is to be constantly updated, which will affect the process of regional inclusive practices.
This study aimed at describing the way in which positive changes can be made, sustained, and built upon towards inclusive urban development. The focus, therefore, was on Xiong’an as it will serve as an example of China’s high-quality development with world-leading economic and social indicators and a modernized governance system. We built a framework for inclusive urban development that shows the initial states, government plans and policies, and the on-going progress. This article is composed in the following manner.
The remainder of this contribution is structured as follows: after the present introduction, Section 2 will provide our conceptualization of urban inclusiveness and present the theoretical foundations for our set of evaluation indicators. Then, Section 3 describes the evaluation framework, the area under study, and indicator selection and data collection methods localized for the area. Following this, Section 4 displays our empirical findings for Xiong’an on its various indicators for inclusive development. In Section 5, the gap between the status quo and the policy goals for inclusive development are discussed. Finally, Section 6 draws conclusions and proposes policy recommendations.

2. Theorizing and Conceptualizing “Urban Inclusiveness”

The early research related to urban inclusiveness mainly paid attention to the reduction of urban poverty and regarded the vulnerable urban poor as the main target for assistance. Scholar drafted an empirical review of inclusive city development in the book “The Inclusive City: Infrastructure and Public Service for the Urban Poor in Asia” [18], which proposed increasing the participation of the poor in public decision-making, and strengthening infrastructure governance to realize inclusive development in Asian cities [19,20,21]. Afterwards, the concept of urban inclusiveness was broadened, since it became obvious that urban dwellers had not equally benefitted from urban growth in many aspects other than income. In developing countries like South Africa, despite significant progress made since the end of apartheid, education levels among black and colored South Africans remain low, which remains a key driver of poverty and inequality, thus perpetuating a legacy of racial divide [22,23,24]. Even in wealthier nations in North America and Europe, inclusive prosperity remains a crucial policy problem of ever growing importance that needs to be resolved: certain groups (such as white, male, better educated residents) tend to be more competitive in the job market and enjoyed higher standards of living [25,26,27]. Energy-intensive production mode and population-dense living patterns in urban areas contributed to high levels of pollution and climate change [28,29]. The unequal distribution of urban infrastructures led to gaps in people’s accessibility to basic services [30,31], which created urban spatial segregation. Over the past decade, more and more research institutions and policymakers have focused on exclusion and inequality issues of urban development, with a broader focus on immigration, employment, education, welfare, disability, gender inequality, racial inequality, and access to green areas and clean air in cities [32,33,34]. In 2001, the inclusive city was defined by UN-Habitat as “a place where everyone, regardless of their economic means, gender, race, ethnicity, or religion, is enabled and empowered to fully participate in the social, economic, and political opportunities that cities have to offer” [35]. In 2017, the ADB expanded the definition to bring in an operational focus: “an inclusive city is built on (i) all stakeholders involved integrated urban planning; (ii) knowledge and information sharing; (iii) public participation and contribution; (iv) mechanisms to ensure an adequate standard of living to the vulnerable population; (v) geographical and social mobility; (vi) business environment and pro-poor financing services; (vii) resilience to global environmental and socioeconomic shocks and threats [36,37,38]; and (viii) mechanisms to ensure the sustainable use of its resources” [39].
As inclusive urbanization covers multiple dimensions of urban development, scholars focus on two fundamental questions—inclusive of whom and inclusive of what in cities? Some research has identified challenges in inclusive urban development through the lens of women’s safety and mobility [40]. Some has focused on improving accessibility of basic services for the vulnerable as a way to build inclusive cities [41,42]. Some emphasized the employment and social benefits of migrants [43], while others regarded access to land and affordable housing for different income groups as a criterion for urban inclusiveness [44]. China’s traditional mode of urban development relies on the high proportion of land concession revenues as local government finance, which has led to a sharp rise in land and housing prices, making it difficult for rural residents and migrants to adapt to urban social life and enjoy equal access to urban public services [45].
Given this context, we defined urban inclusiveness as a city’s ability to offer sufficient public services (such as public transportation, housing, education, and health care), ecosystem services (such as clean water, air, and green land) and personal development opportunities (such as employment and skill-based training) to all dwellers regardless of identity, including gender, race, age, religion, location, caste, ethnicity, occupational status, and disability status [46,47,48]. An evaluation framework and related indicators will be developed in the next section, based on the above definition and its specific localization for Xiong’an.

3. Methods and Materials

3.1. Evaluation Framework for Urban Inclusiveness

According to our research on the conceptualization of an inclusive city, in this section, an evaluation framework was developed to investigate the various factors and status of a city’s development, regarding the triple bottom line of economic prosperity, social equity, and environmental quality [49]. In addition, such urban development is also expected to reflect the spatial transformation and chronological evolution of cities, and should also take into account the city’s resource context and institutional structure [50].
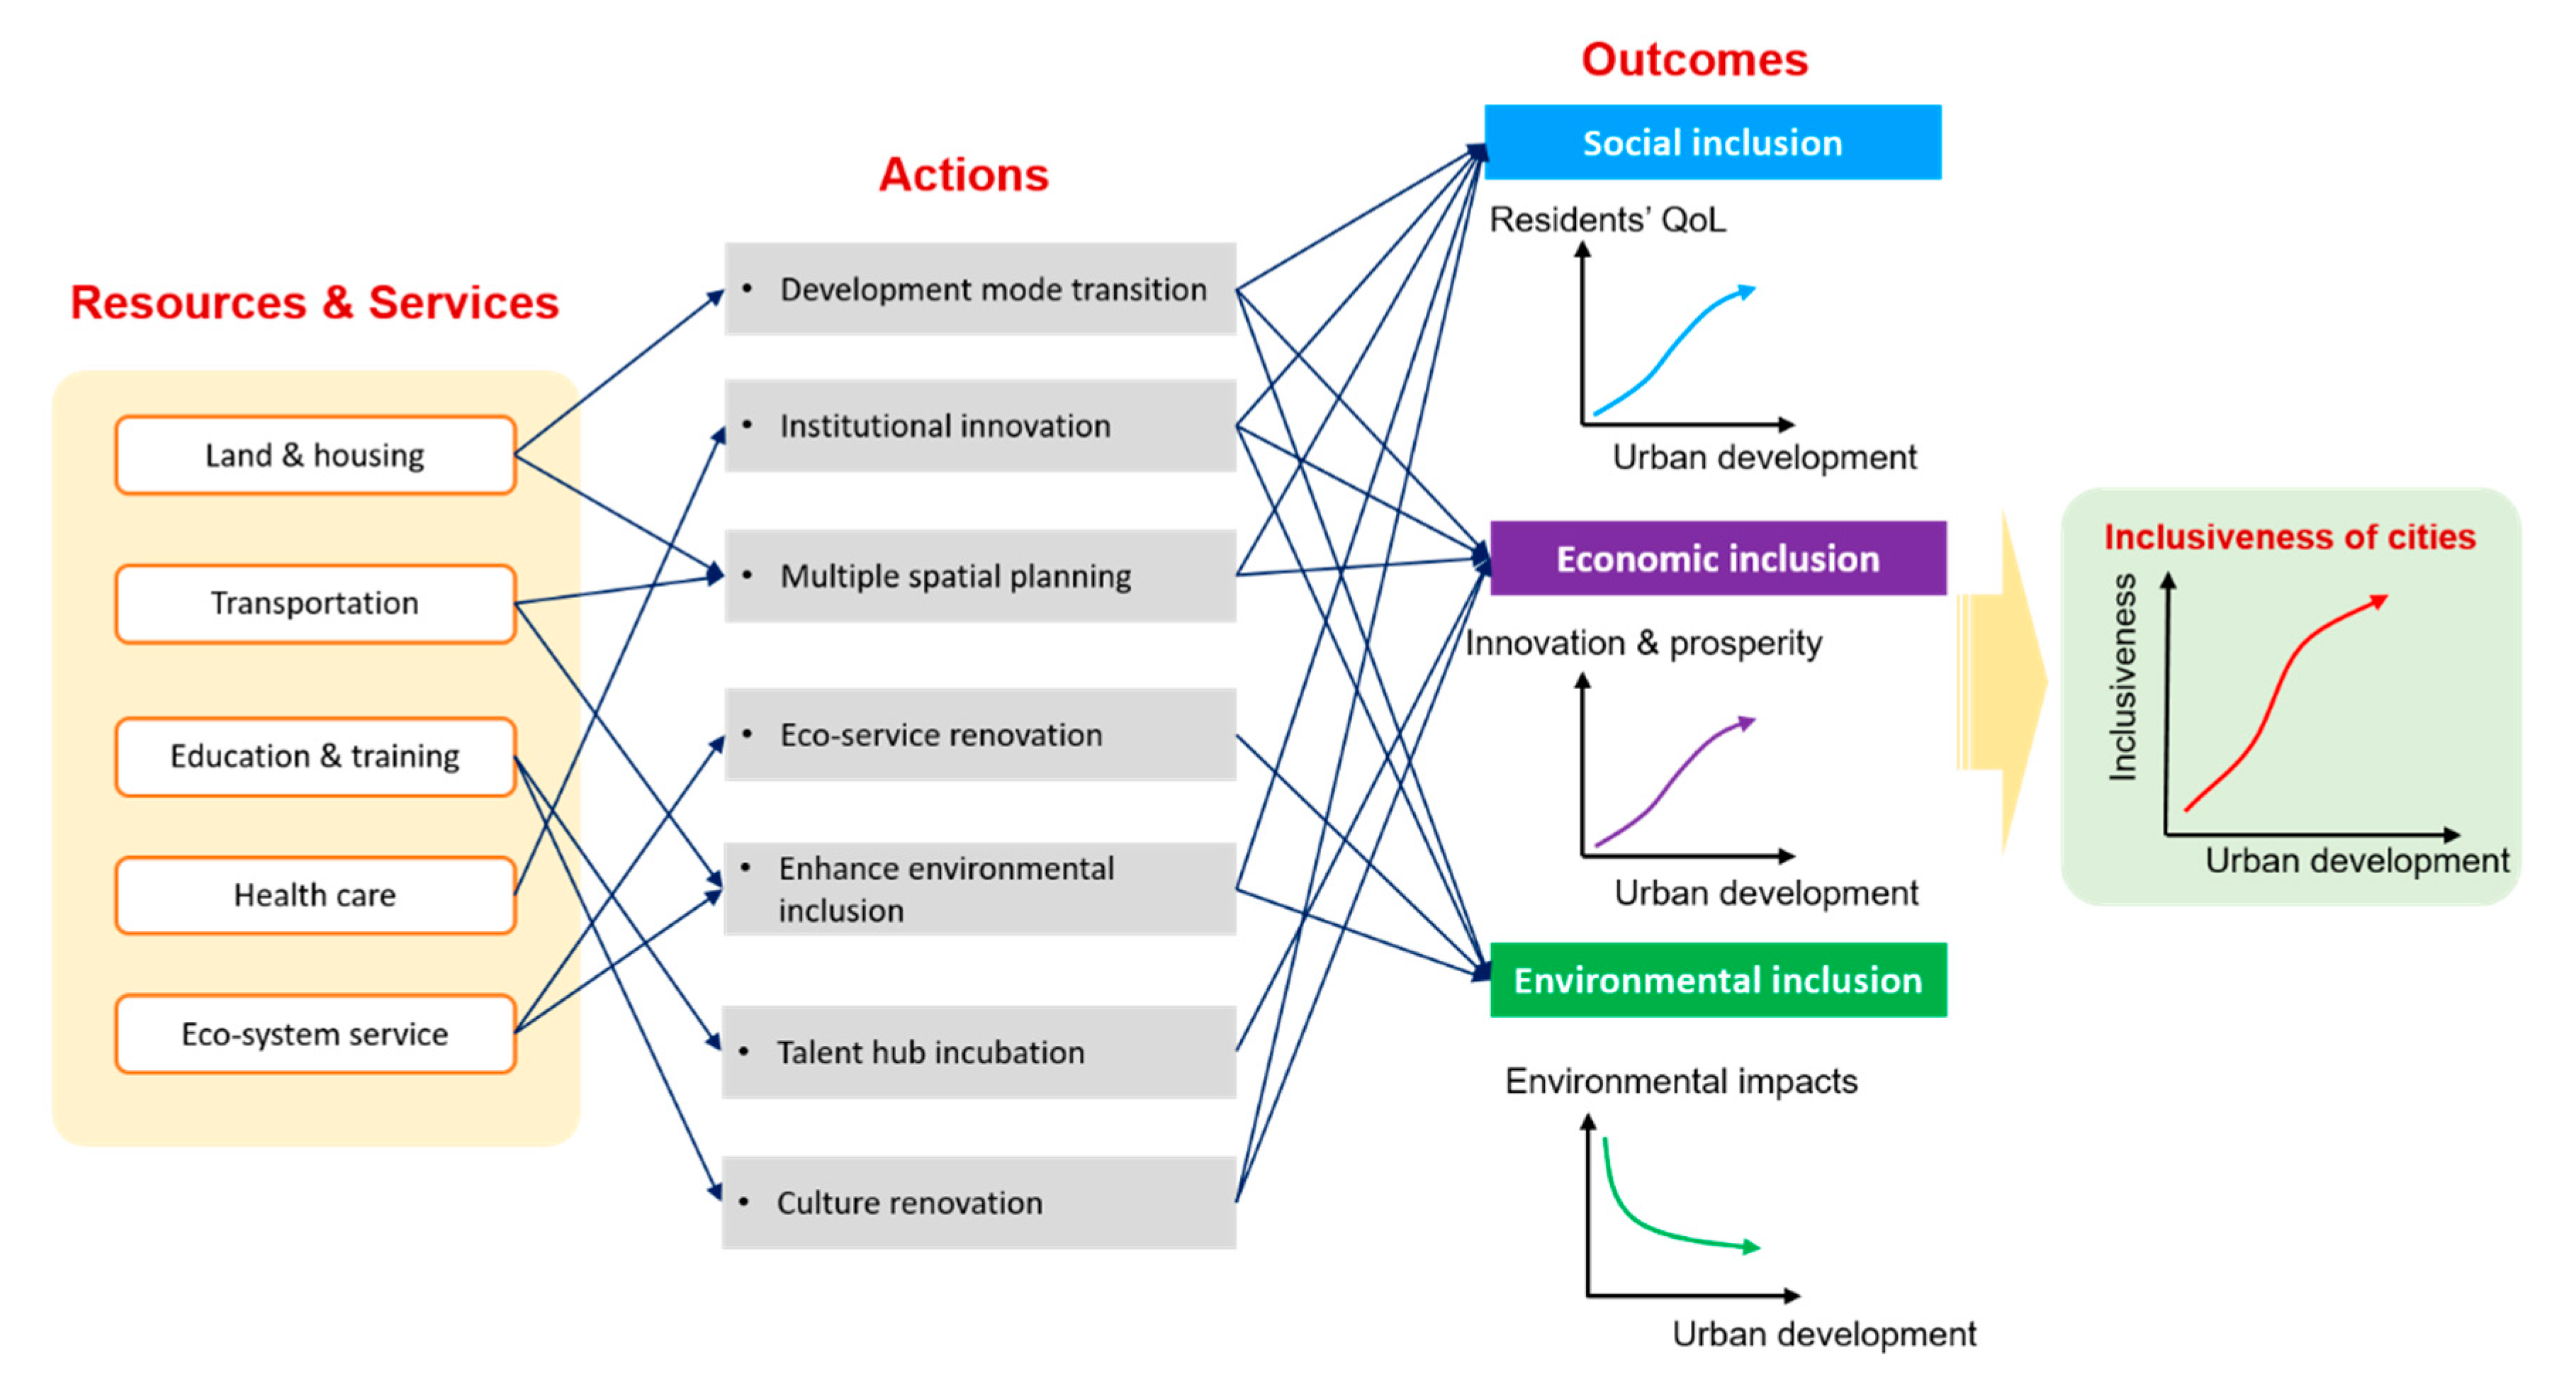
Accordingly, the RSDO-ST (resource and service, drivers, and outcomes of city’s inclusive development from spatial dimension and time dimension) model was designed to grasp and evaluate cities’ inclusive development process (Figure 1). The model combines the inclusive urban development (IUD) approach designed by the Asian Development Bank to articulate and define the dimensions of the existing urban context and to map the key stakeholders in the urbanization process [51], and a causal network-based framework (the enhanced drivers–pressures–states–impacts–responses framework—eDPSIR framework) that focuses on the logical inter-relation of indicators [52]. The IUD approach provides a tool for identifying resources and key drivers within city development from various aspects, while the eDPSIR framework can uncover the dynamic relations between them and sort out the spatial and chronological changes and outcomes.
The first component, resources and services, in this model refers to the basic and most important social and economic infrastructure, as well as natural resources in cities, including land and housing, transportation, education and training, healthcare, and ecosystem services [53]. It identifies the existing urban realities as the foundation and predicts the ability of meeting future demands.
Drivers are a crucial component in addressing the engine of urban development. First, in many countries, governments have crucial influence or even a leading role in the process of urbanization, so it is imperative to map the governance and institutional structure for a good understanding of policies and standards. Second, population growth is an inevitable trend accompanying urbanization and industrial transformation, as well as a key factor stimulating the demand for urban services. Demographic changes and cultural integration are major opportunities, as well as challenges, in the construction of inclusive cities. Third, the development of new technologies, such as 5G, the Internet of Things (IoT), and big data, have promoted the integration of urban networks and improved the accuracy and efficiency of urban services.
The third component—outcomes—in the RSDO-ST model is addressed in three aspects: social inclusion, measured by residents’ quality of life (QoL); economic inclusion, led by high-tech innovation industries and high-end service industries; and environmental inclusion, reflected in ecological harmony that ensures the harmonious coexistence between the natural environment and human activity.
These components will be analyzed in both the spatial and time dimensions. In the spatial dimension, the inclusive city can be achieved through the intelligent distribution of resources and services in the city. “Intelligent distribution” is a concept widely used in electricity supply networks: real-time network simulation and performance analysis are conducted to provide decision support for system operators to adjust the input to energy and distribution management systems, coping with variable voltages and frequencies, in order to offer more flexible, sustainable options to customers with different needs [54]. Similarly, in the RSDO-ST model, intelligent distribution is organized by drivers, and the output would be equal, with sufficient and diversified allocation and integration of urban resources and services. Turning to the time dimension, the model will be applied to tracing the process, through which resources and services in cities are promoted and attributed by drivers and chronologically generate social, economic, and environmental inclusion in cities.

3.2. Overview on Xiong’an

To test the feasibility of the proposed evaluation approach, we selected Xiong’an, a new planned area by top-down strategy in China, as the laboratory.
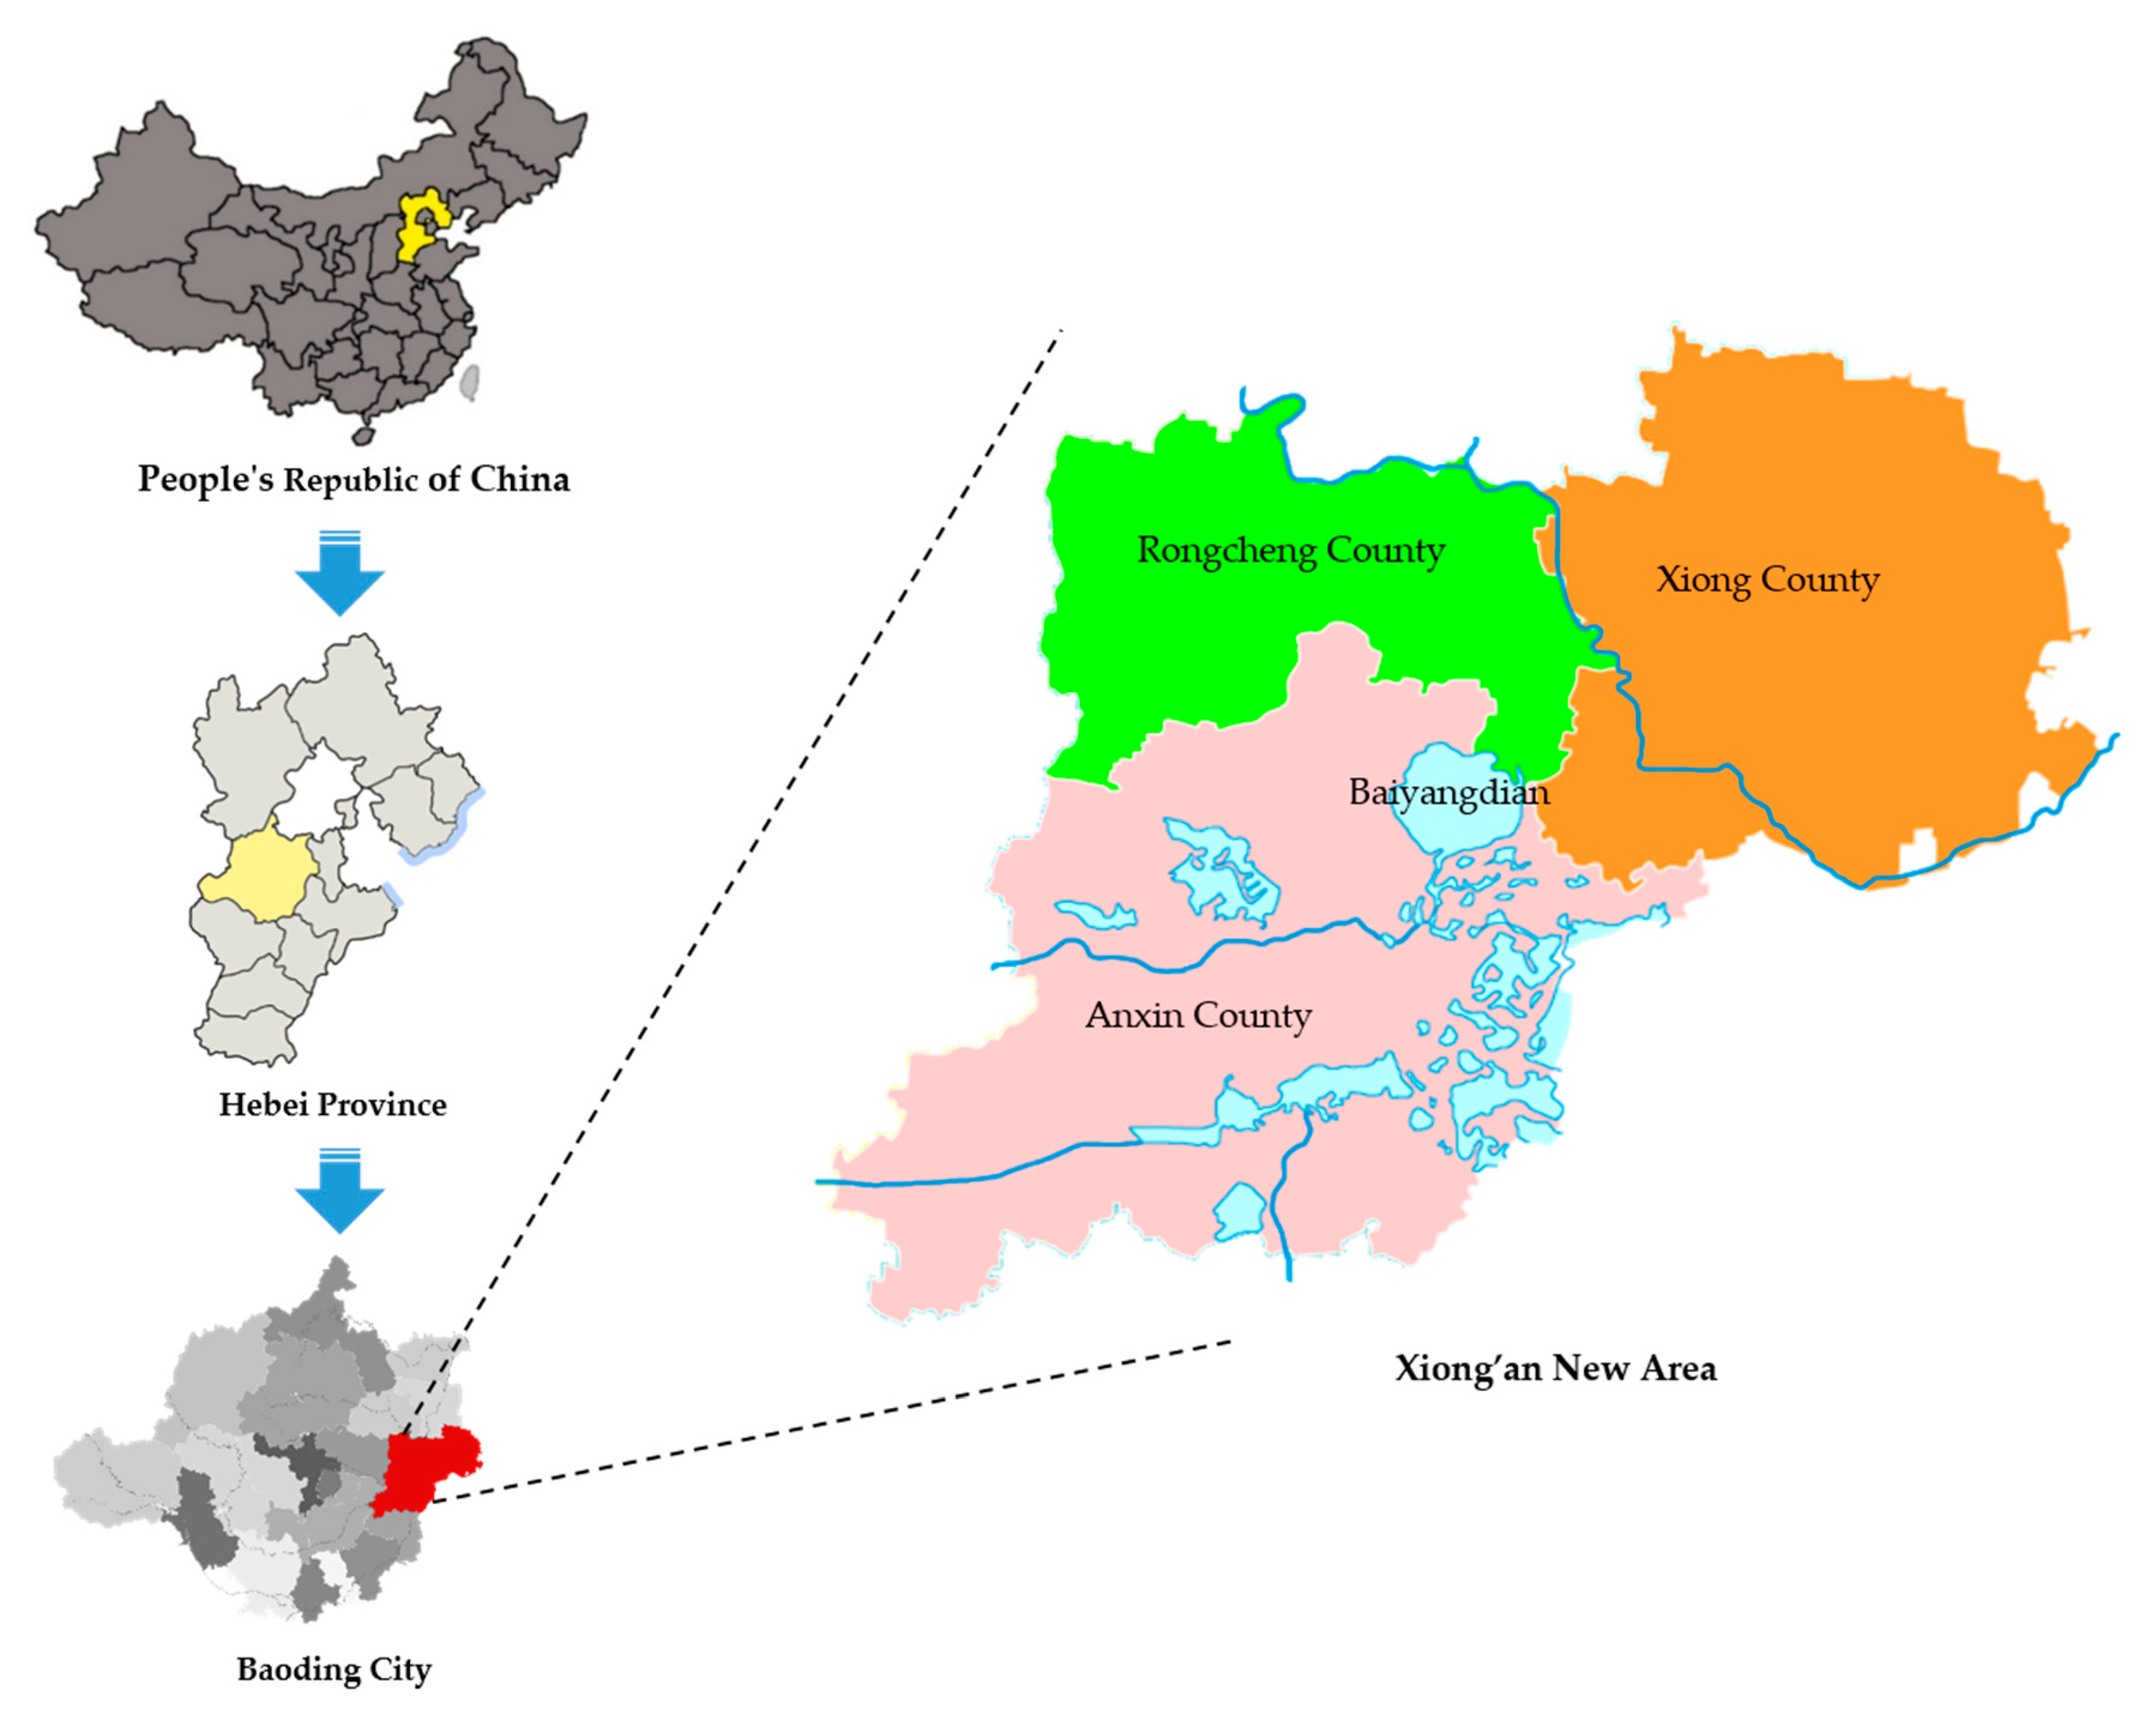
Xiong’an is located in Hebei Province, 105 km Southwest of Beijing, 105 km West of Tianjin, and 50 km east of downtown Baoding, with a population of 1,407,100 in June 2017. It consists of three counties—Xiong County, Anxin Country, and Rongcheng County, as well as more than 60 villages (Figure 2 illustrates its geographic information).
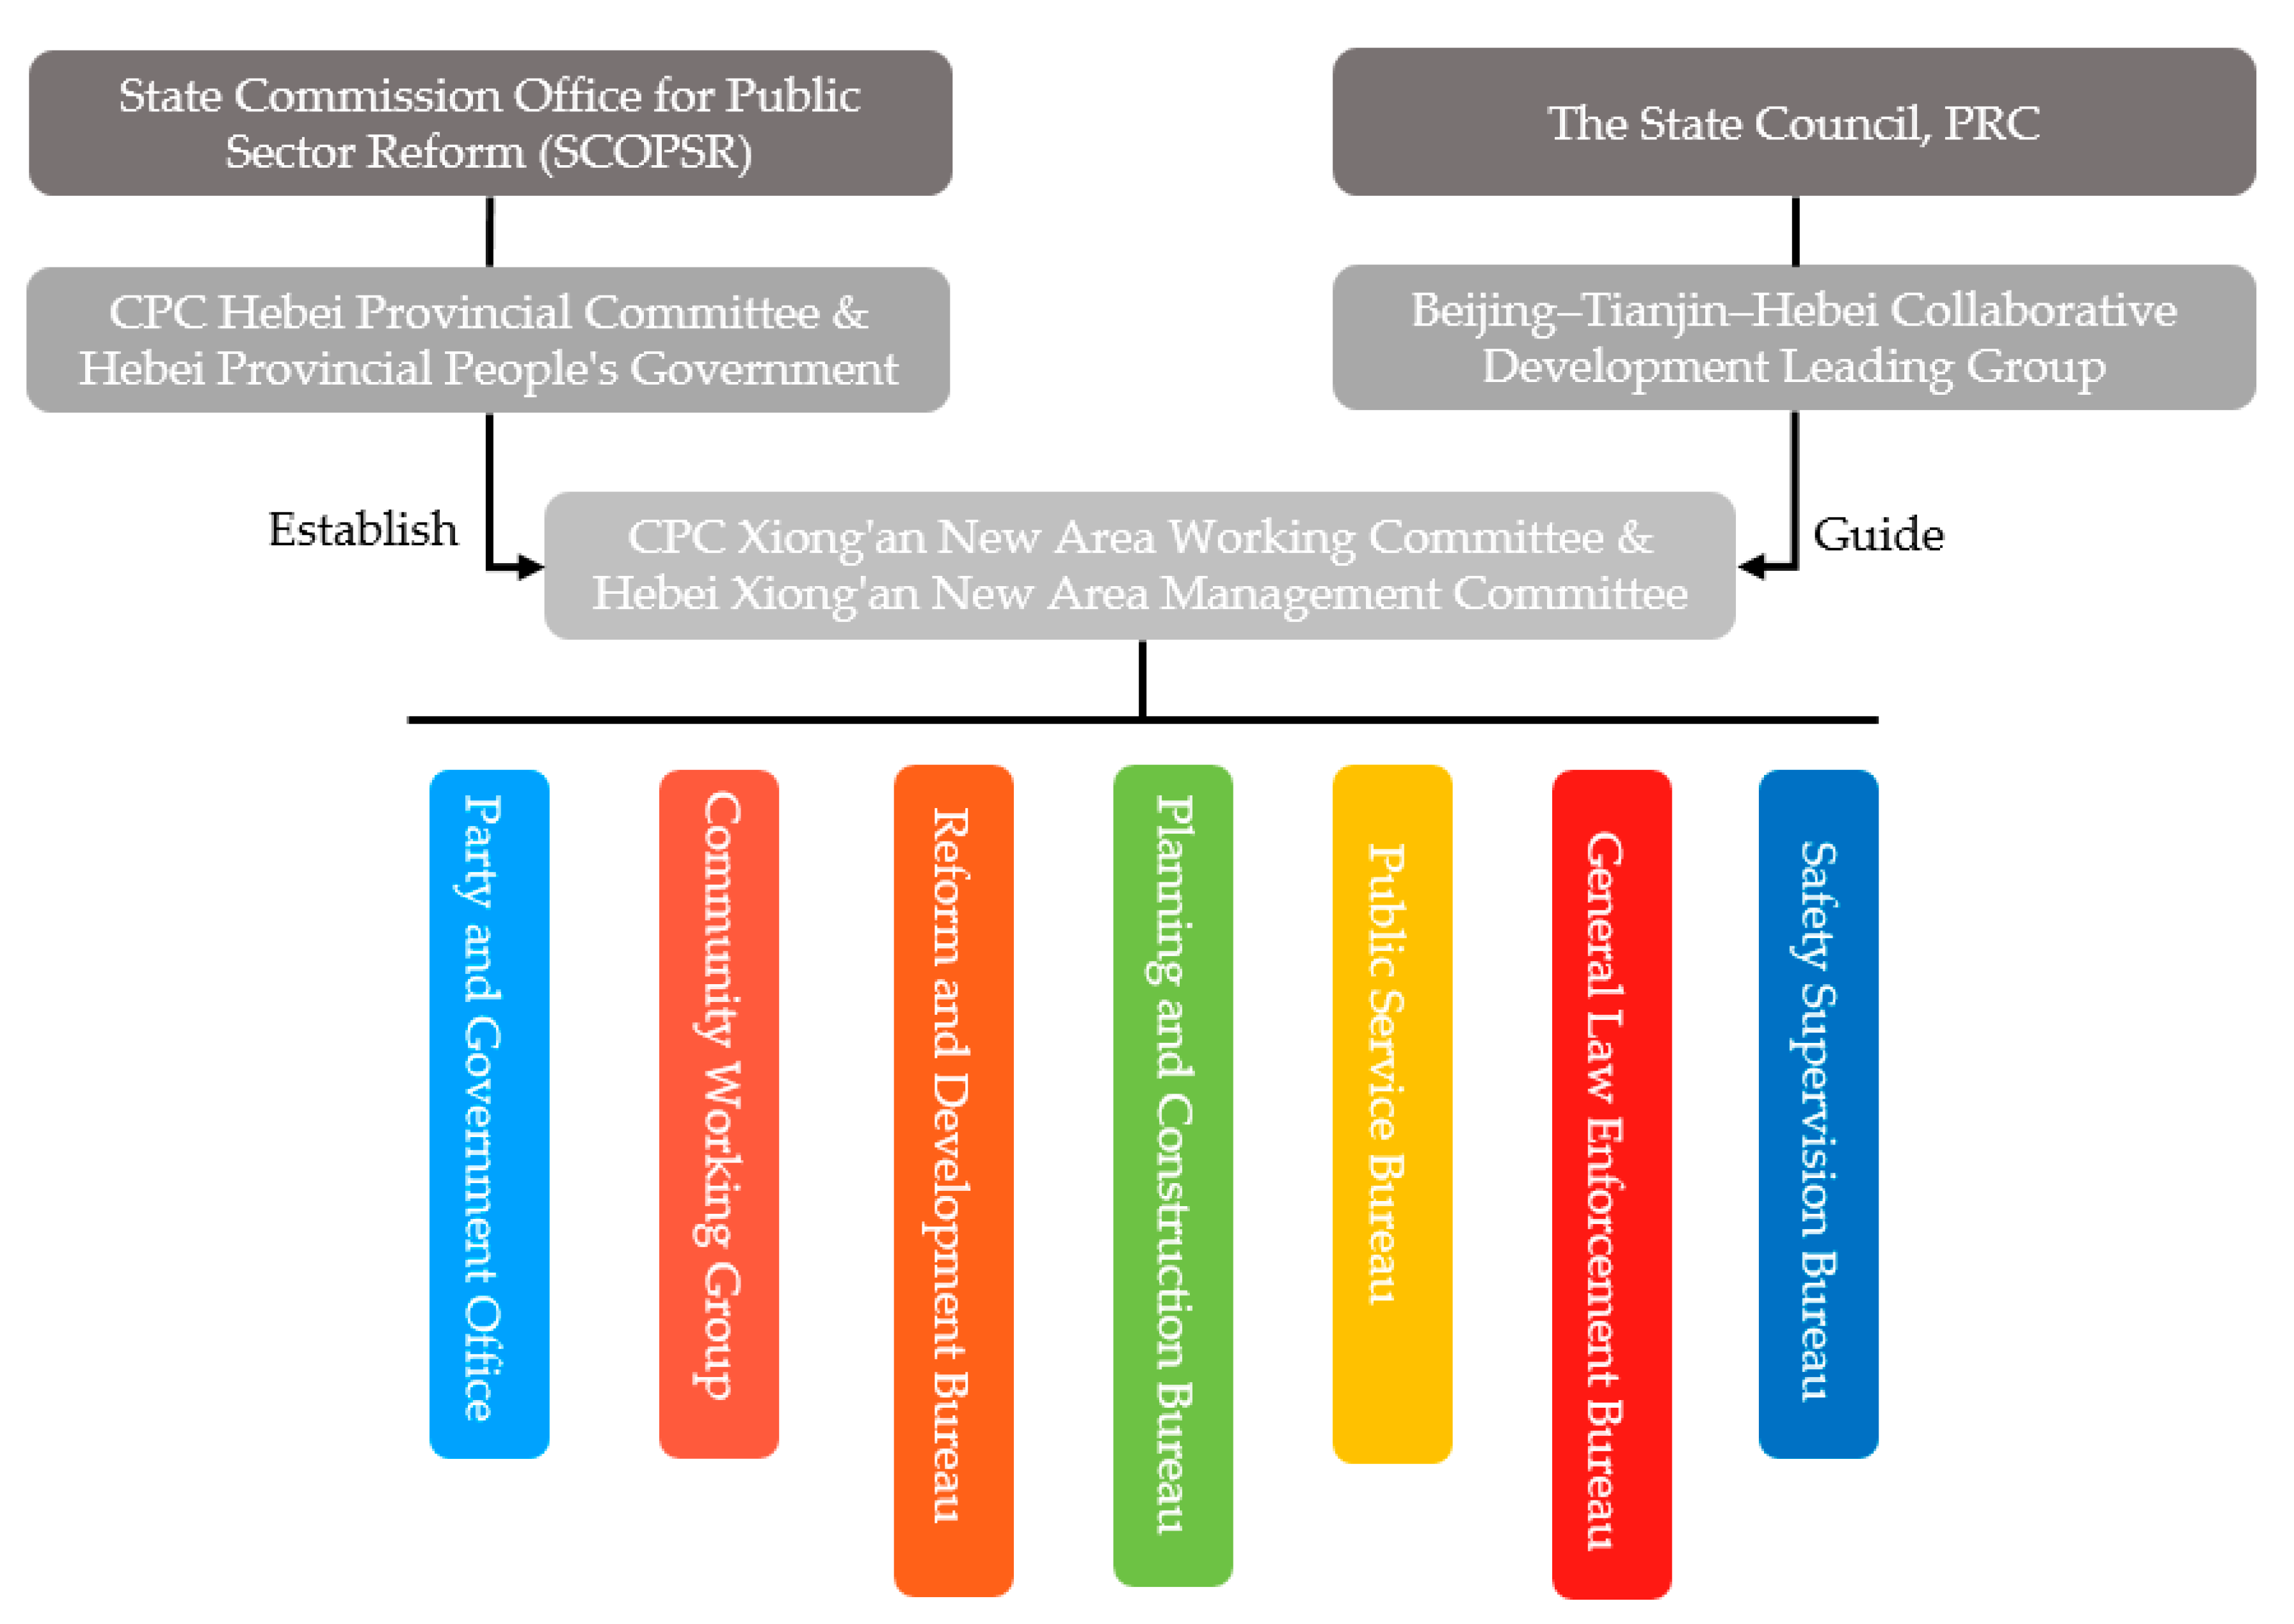
On 1 April 2017, the Central Committee of the Communist Party of China (CCCPC) and the State Council issued a decision of the establishment of Xiong’an New Area. On 21 June 2017, the State Commission Office for Public Sector Reform (SCOPSR) announced it had set up the CPC Xiong’an New Area Working Committee and the Hebei Xiong’an New Area Management Committee. These two committees were organized by CPC Hebei Provincial Committee and Hebei Provincial People’s Government and guided by the State Council and the Beijing–Tianjin–Hebei Collaborative Development Leading Group (Figure 3). They are responsible for leading and coordinating the comprehensive development and construction management in Xiong’an, as well as in charge of the surrounding areas.
The main function of Xiong’an is serving as a development hub for the Beijing–Tianjin–Hebei (Jing-Jin-Ji) economic triangle. In addition, according to the ‘Hebei Xiong’an New Area Plan Outline’ [55], noncapital functions of Beijing are expected to be relocated here, including some state-owned enterprises, government agencies, and research and development institutions. At present, the urbanization rate of Xiong’an is relatively low (42%), and the regional economy is even weaker than the average level of Hebei Province [56].
Before the establishment of Xiong’an, the region was a typical northern Chinese rural area where agriculture and manufacturing were the pillar industries. Under the national “ecological civilization” strategy, Xiong’an has been redefined as a “1,000 Year Plan of National Significance”, which is expected to accomplish seven major tasks to realize an inclusive and sustainable urban transition. Such actions and contributions are illustrated in Figure 4 under the RSDO-ST model framework.
(1)
Development mode transition: transforming the model of driving economic growth through urban competition to build a new model of synergistic development of the Beijing–Tianjin–Hebei city cluster, with Xiong’an as the engine;
(2)
Institutional innovation to be more inclusive: using economies of scale and specialization as two key strategies to relocate noncapital functions of Beijing, including high education institutions, health institutions, financial institutions, corporate headquarters, and high-tech industries;
(3)
Multiple spatial planning: utilizing Xiong’an’s advantage as a newly designed area to promote spatial planning considering multiple characteristics—combining the factors of topography, climate, history, and culture—to design the urban functional areas of Xiong’an;
(4)
Eco-service renovation: rehabilitating the Baiyangdian ecosystem and increasing the forest covered area to reach 70 per cent blue–green space;
(5)
Enhancing environmental inclusion: to forward environmental system innovation, via creating green and low-carbon production lifestyles and operational models for urban construction, and encouraging green transportation, smart power supply systems, and recycling-based sanitation systems;
(6)
Talent hub incubation: introducing innovative talents to develop high-tech industries and to build an international first-class innovative city;
(7)
Cultural renovation: promoting cultural creation and tourism development with traditional Chinese culture.
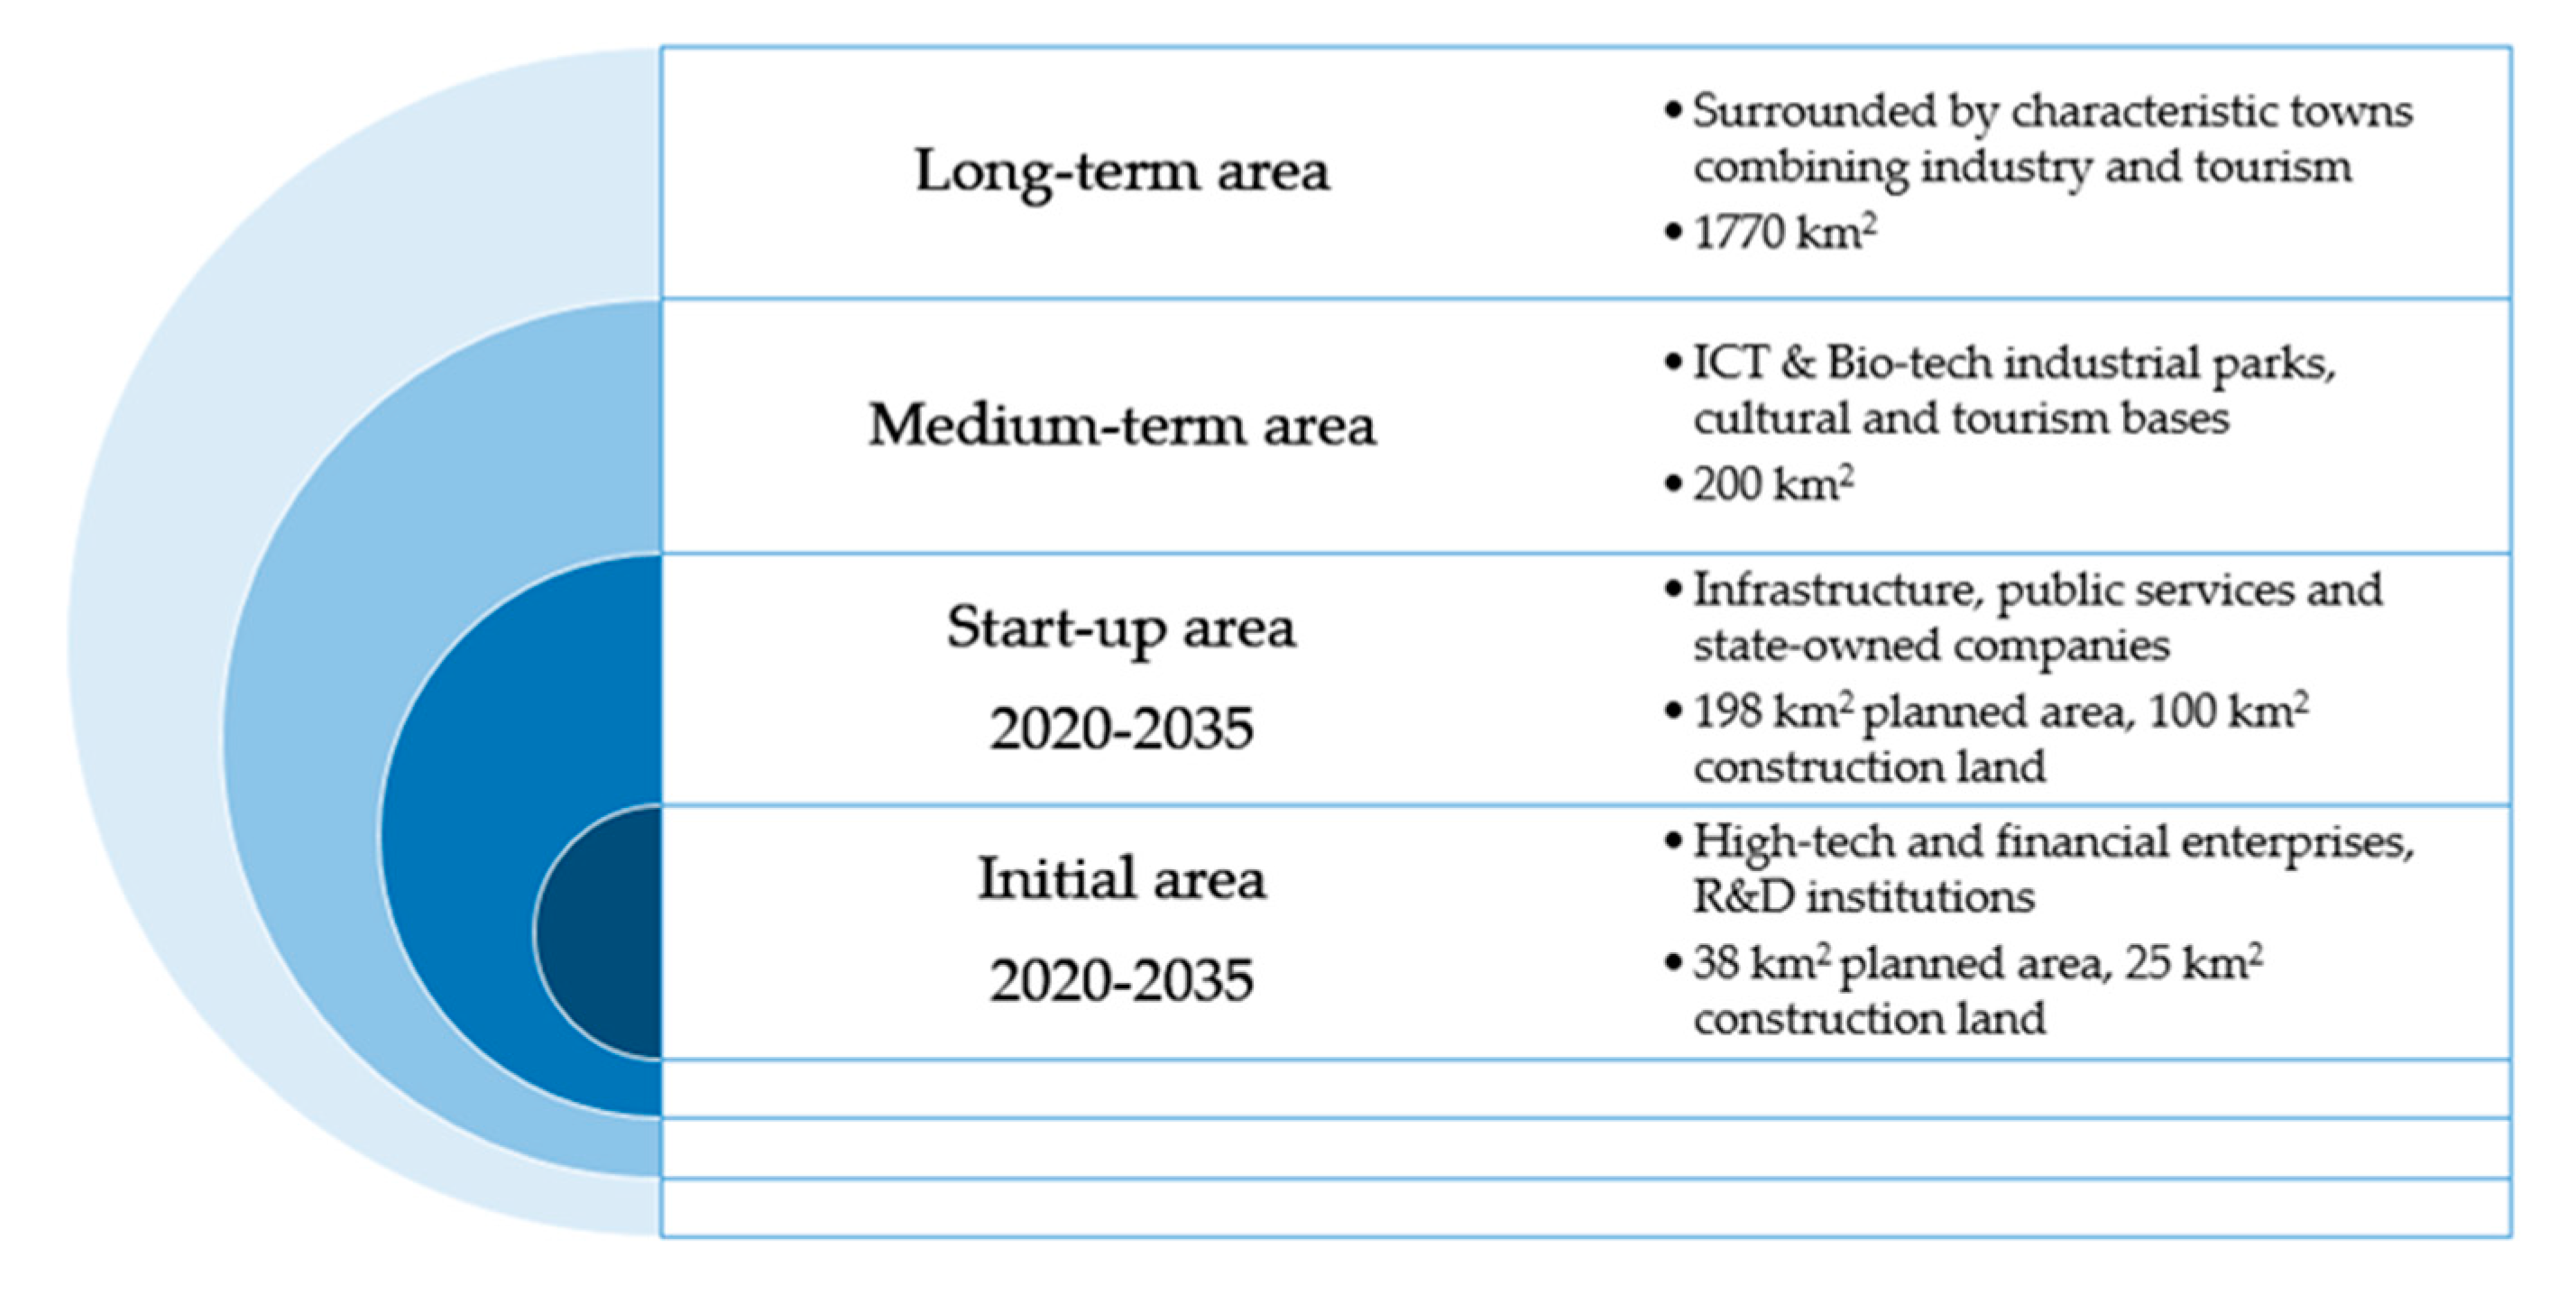
The development of Xiong’an is basically planned at four levels: the initial area, the start-up area, the medium-term area, and the long-term area (Figure 5). According to the ‘State Council’s Master Plan for Hebei Xiong’an New Area (2018–2035)’ [57], “Xiong’an Quality”, which is green, low- carbon, informational intelligent, livable, competitive, influential, and harmonious, is expected to be realized by 2035 and play an important role in leading China’s high-quality development, becoming a new engine of the modern economic system. In general, to build Xiong’an is an approach to explore a new model of optimized development in densely populated areas and to restructure the urban layout in the Beijing–Tianjin–Hebei area.

3.3. The Inclusive Development Indicators (IDIs) Selection for Xiong’an

The RSDO-ST model, composed of the IUD approach and the eDPSIR framework, provides a tool for identifying resources and key drivers in urban development. It uncovers the dynamic relations between these two kinds of elements and sorts out the spatial and chronological consequences of their interactions.
Following the IUD approach [51], first a preliminary scoping description of Xiong’an was undertaken, including an analysis of its location and its role in the national urban system, through data gathering and mapping based on the master plan. Second, the institutional structure and the policy and regulatory context were presented to evaluate the capacities to plan, fund, and maintain the urban area. Third, the quantitative and qualitative baseline information of the region was compiled to assess the initial economic, environmental, and social state of the city. At a final stage, the gaps and challenges on the path towards inclusive urban development were identified.
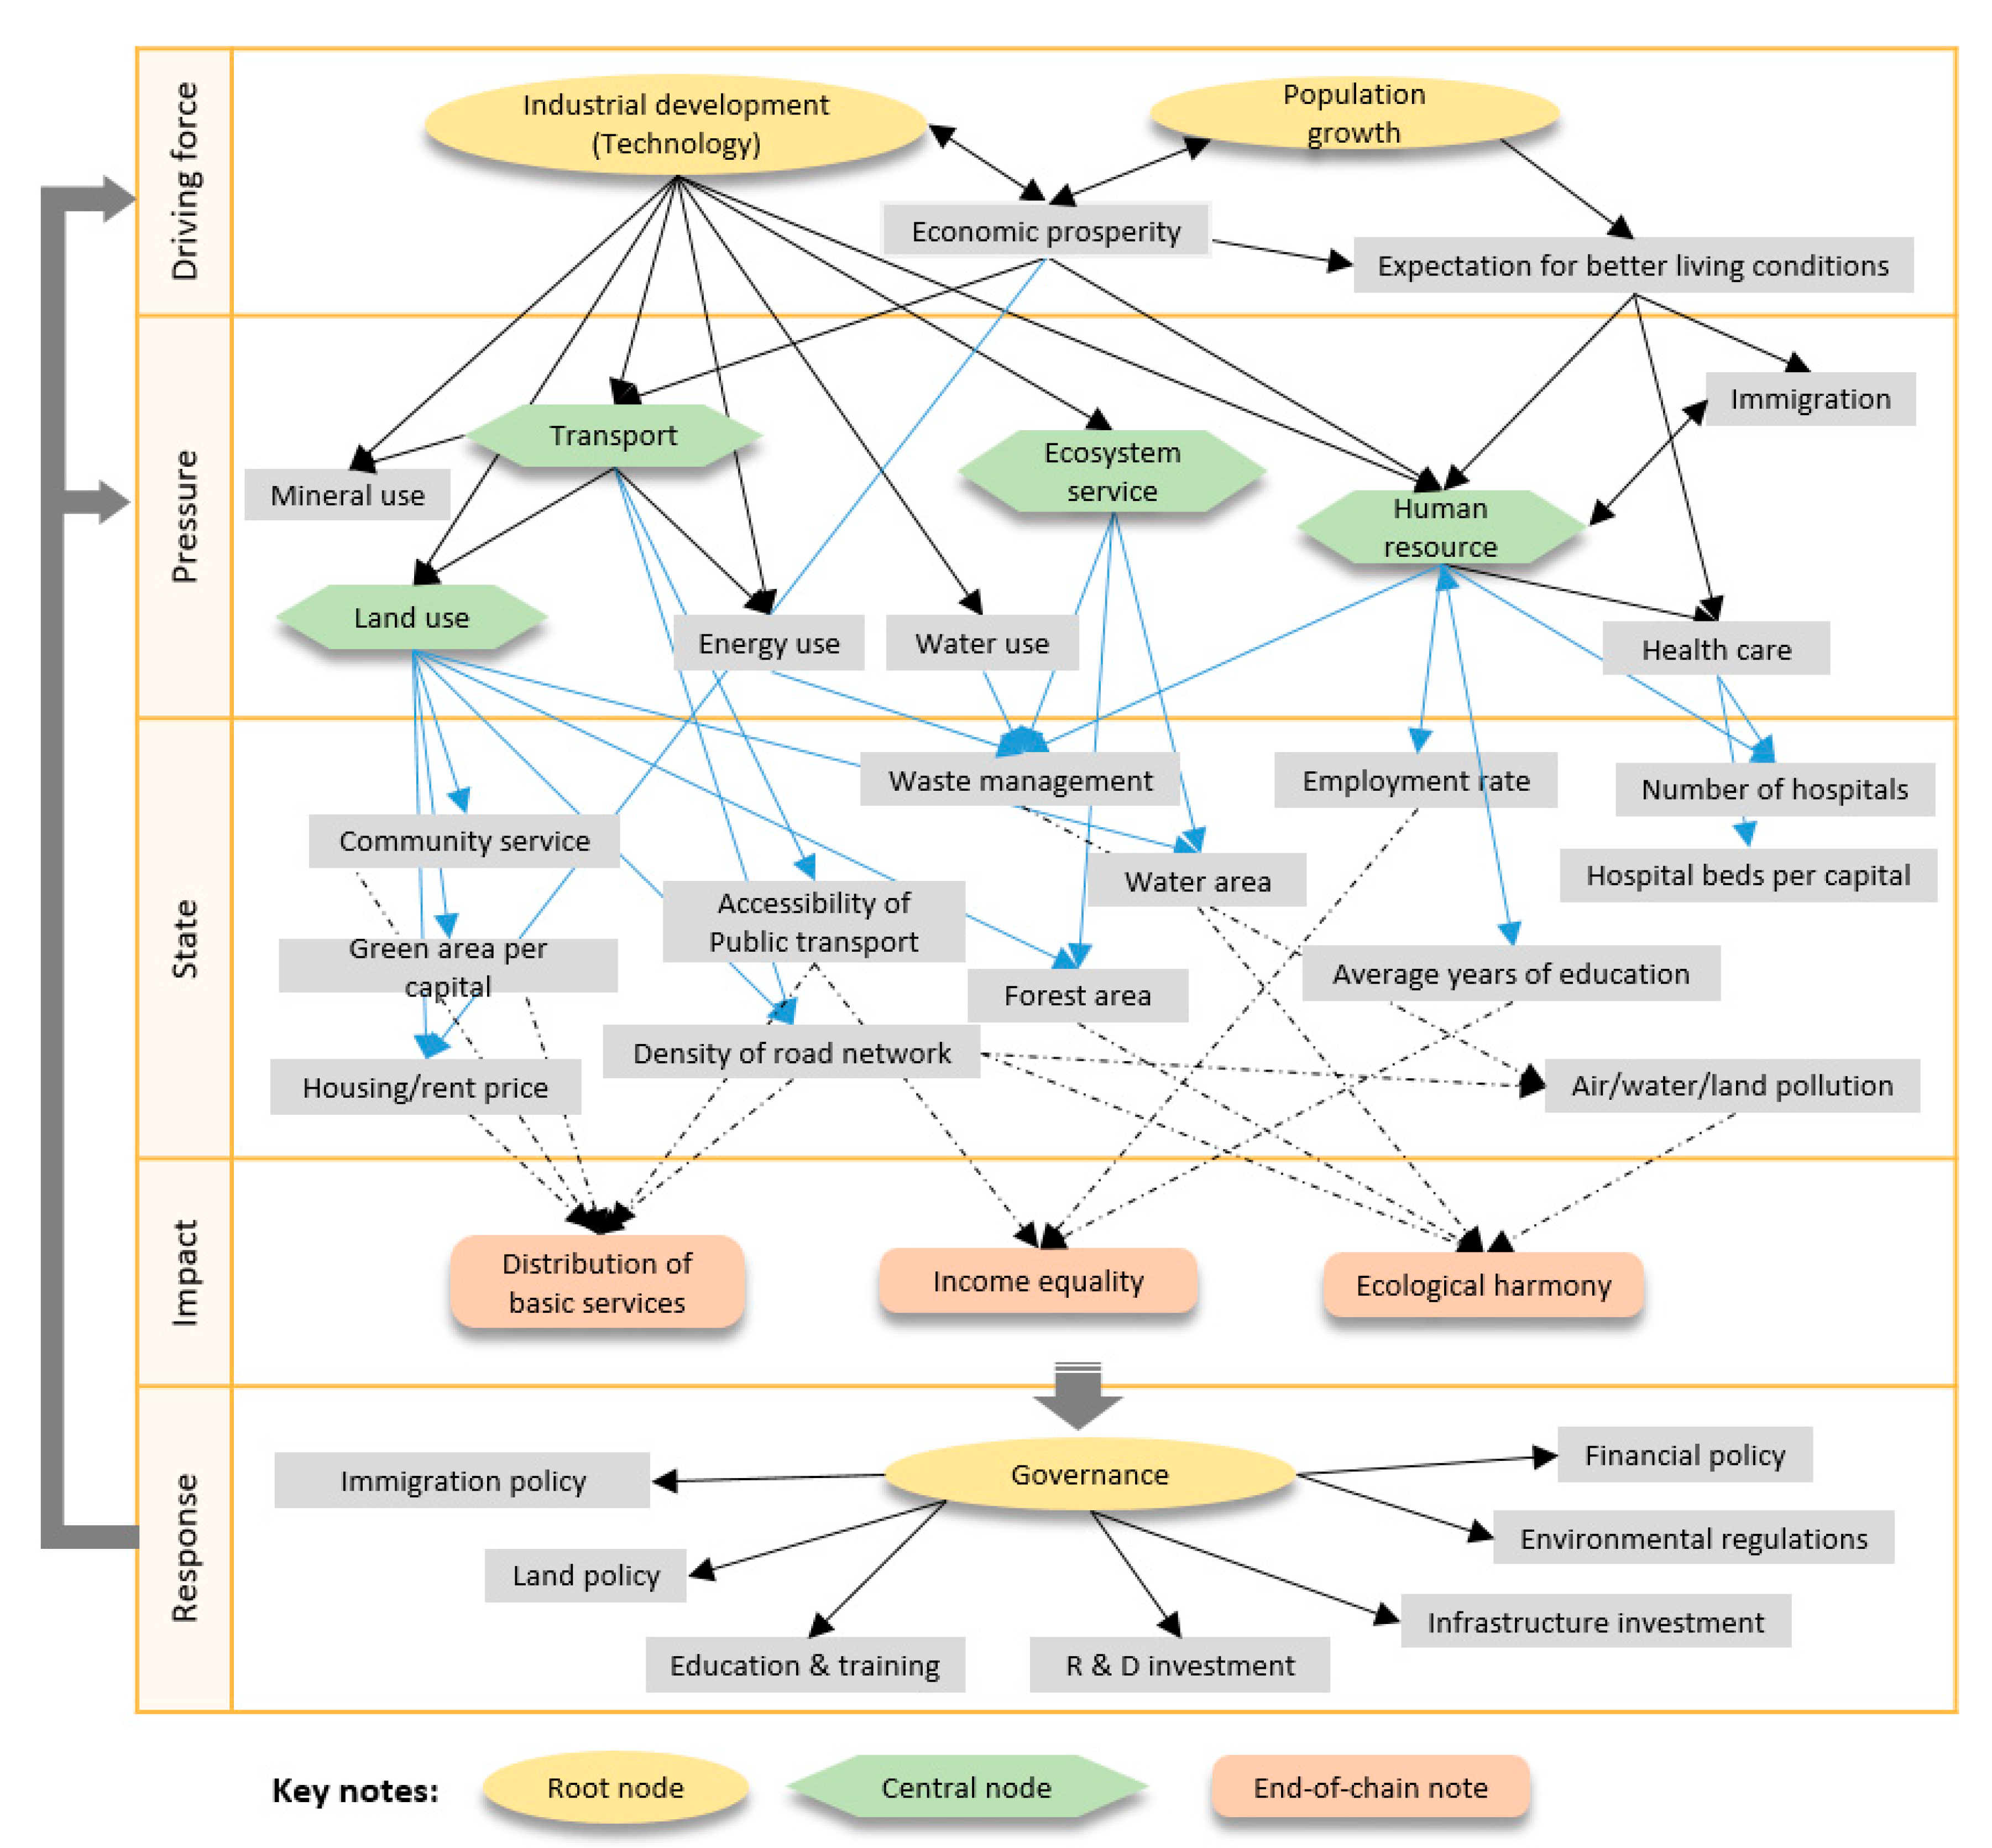
Based on the eDPSIR framework [52], a causal network of Xiong’an’s development was constituted to structure the selection of IDIs. In general, population growth and industrial development are driving forces that exert pressure on the urban services and ecosystem, which leads to changes in the state of infrastructure distribution and carrying capacity of the natural resources. In turn, these changes have an impact on social inclusiveness and environmental sustainability, which may elicit a governance response that feeds back into the driving forces and pressures. There are three kinds of key nodes as vital components in the causal network. Root nodes are nodes that have many outgoing arcs (the arcs diverge from these nodes), which are typically the source of many environmental problems. Central nodes are those nodes that have many incoming and/or outgoing arcs (converging and diverging arcs), because they are all influenced by a number of factors and, in turn, influence a series of other indicators. End-of-chain nodes typically have multiple incoming arcs (the arcs converge at these nodes) that bring together a number of longer chains, which are typically those nodes where the (often indirect) effects of multiple pressures become visible.
Given this framework, the selection of IDIs for Xiong’an followed a two-step process. For step 1, IDIs were collected from the literature, including journal articles, reports, and official statistical resources that covered the social, economic, and environmental aspects, as a pool of IDIs. For step 2, the indicators in the pool were further selected based on the regional characteristics, development orientation and expected objectives of Xiong’an, especially the main indicators of ‘Xiong’an 2035 Planning’, published by the management body of Xiong’an (Appendix A). At the same time, taking into account the availability of data for some of the indicators and the continuity of data over time, the key indicators for inclusive urban development in the categories of land and housing, transportation, education and training, and ecological services were finalized.

3.4. Data Collection

In order to measure Xiong’an’s inclusive development progress along the time dimension, the data collection of indicators included three stages: (1) historical data before the establishment of Xiong’an in 1st April 2017; (2) policies, measures, and projects implemented during the past three years; and (3) up-to-date progress data as of April 2020. The inclusive development analysis of Xiong’an’s spatial dimension focused on the distribution of the transportation network and the improvement of the natural environment. The sources of the various types of data at different time points are shown in Table 1.

4. Results

4.1. The Causal Network of Xiong’an IDIs

The causal network of Xiong’an’s IDIs is shown in Figure 6. Given the context that Xiong’an is a government-led national project, in order to summarize the multiple factors that drive regional urbanization, as well as their impacts on regional inclusiveness, the key nodes and indicators were chosen as follows:
  • The root nodes that have been chosen are population growth, industrial/technology development, and governance, which are the drivers of urbanization. Population growth and technological progress have contributed to regional economic prosperity, and these two factors have further attracted immigrations to live and work in order to obtain better living conditions. These elements drive urban development, while at the same time creating many resource, environmental, and social pressures.
  • The central nodes are land use, transport, ecosystem service, and human resources, which are directly influenced by the root nodes and lead to changes in the state of urban inclusive development. Meanwhile, driving forces also induce pressures on mineral use, energy use, water use, healthcare, and immigration, and then shape the state indicators.
  • The state is represented by measurable indicators drawn from local statistical resources corresponding to the pressures.
  • The end-of-chain nodes are distribution of basic services, income equality, and ecological harmony, typically where the effects of multiple pressures become visible. These impact elements demonstrate the stages and progress of inclusive urban development.
  • Response measures are taken to eliminate negative impact on the states of the city due to pressures, in this case led by governance, and are represented by the following indicators: immigration policy, land policy, education and training programs, research and development investment, infrastructure investment, environmental regulations, and financial policy. These policies, investments, and programs are countermeasures for mitigating pollution, promoting sustained economic growth, and guaranteeing high living standards for local residents as well as immigrants.

4.2. Xiong’an’s Inclusive Development Process

Based on the selected IDIs for Xiong’an and its causal network for inclusive development, this section analyses the improvement of social and economic infrastructure and restoration of the ecological resources in Xiong’an in the period April 2017 to April 2020, supported by a series of innovative policies. Since demographic change and high-tech industries are the key drivers of Xiong’an’s future development, the analysis focused on urban infrastructure services including housing, transportation, education, and training, which are closely related to talent acquisition and integration, as well as the ecological resources needed for industrial development. Although one of the IDIs “health care” was not analyzed in detail, it should not be overlooked that there is a very large gap between the level of medical facilities in Xiong’an and its long-term development goals. By means of comparison, Beijing currently has 265,000 medical staff for its 21.5 million resident population; the long-term population of 2 million people in Xiong’an would require 24,000 medical personnel, but the current number of medical personnel in Xiong’an is only 3419, leaving a shortfall of more than 20,000 medical people in the coming years [62].

4.2.1. Land and Housing

Initial State

The built-up area of Xiong’an is 34.4 km2, only accounting for 1.94% of the planned total area (1770 km2). In 2017, the resident population of Xiong’an was 1,407,100 and the urbanization rate was 42%, which is lower than that of Hebei Province (55.01%), and far behind that of Beijing (86.5%) [56]. In China, a major institutional contributing factor to rural–urban inequality is the household registration (Hukou) system. Local governments in China bear 85% of the costs for public facilities and services [63], thus, they use Hukou as a migration management tool to determine an individual’s access to public services, including housing, transportation, health care, education, and employment. Thus, local urban dwellers and well-educated new urban immigrants tend to occupy the best residential areas in cities, creating high-end urban living quarters, while rural dwellers and low-income outsiders cannot afford the upgraded urban services and have to live in the urban periphery or in industrial areas, ultimately creating spatial segregation and social exclusion.

Innovative Policy for Land and Residential Area Development

According to the Plan Outline [55], Xiong’an will be a test field for exploring innovative land acquisition and home purchase systems in China, where individual housing will be mainly held in shared ownership and large-scale development of commercial real estate is strictly prohibited. In China, there is a widely practiced fiscal policy called ‘land finance’, referring to the fact that land use rights are assigned by local governments to developers in return for the payment of land conveyance fees and taxes for financing local infrastructural developments, which leads to a heavy reliance of local governments on land leasing revenue or land conveyance fees as a source of local revenue [64]. Revolutionarily, Xiong’an set the principle of ‘No Land Finance’, which means the local government will no longer implement one-time land acquisition compensation, but instead compensate a certain amount per area per year and convert land resources into stocks. So that the government and residents can become the “shareholders” of the city. Other stakeholders involved in urban construction, such as real estate developers, use their different resources (funds and technology) as input elements for urban development, and ultimately share the benefits. To a certain extent, Xiong’an is committed to designing a new urbanization dividend distribution mechanism. Second, most of Xiong’an’s newly built houses will be shared property houses, that is, the government and buyers will jointly bear the housing construction funds. When the house buyer sells the property, the government buys it back, so the house buyer can only obtain the realization of the amount of their own assets. Therefore, the rapid rise in house prices caused by market speculation will be suppressed. For those immigrants wishing to buy houses in Xiong’an, there will be a multidimensional point measuring an individual’s personal score in terms of compliance with the law, moral character, social contribution, public service activities, and green lifestyle behavior. Residents with high points also get priority for social services. In addition, additional matching policies and financial support is foreseen to attract high-tech enterprises and skilled immigrants for the establishment of talent special zones.

Status Quo of the Housing Market

In the past three years, nearly 10,000 energy-intensive and high-emission enterprises have been shut down in Xiong’an in order to reduce environmental pressure. Meanwhile, high-tech, financial and Internet companies settled down and drove up commercial rents, resulting in extremely high operation costs that small and medium-sized local business owners could no longer afford. In terms of residential real estate, a large number of speculators poured into Xiong’an when it was announced to be the national area on 1 April 2017, resulting in sharp increase of real estate prices overnight. Consequently, on 2 April 2017, the county governments implemented an emergency order indicating that both formal and informal real estate transactions were immediately suspended. On June 2017, on the basis of the original restriction order, the strict “five freezes” policy was also initiated in the fields of planning, land, household registration, real estate transactions, and project construction. Until May 2019, Xiong’an began to introduce supporting policies to provide subsidies to the owners of dwellings that were on the list to be demolished, and other personal houses could resume construction. Still, other frozen projects are suspended until new relevant policies are introduced.

4.2.2. Transportation

Initial State

Before 2017, the transportation system in Xiong’an lagged behind that in surrounding big cities such as Beijing and Tianjin. There was only one horizontal Tianjin–Baoding high-speed railway crossing Xiong’an, and the Baiyangdian station and Baigou stations were all at a certain distance from the central areas in the three counties. Relatively speaking, the expressway network in Xiong’an is more adequate, with the Rongcheng–Wuhai Expressway (G18) going in the horizontal direction, and Beijing–Hong Kong–Macao Expressway (G4) and Daqing–Guangzhou Expressway (G45) in the vertical direction. Some sections of the arterial roads in Xiong’an are still tertiary highways, with problems of pedestrian–vehicle mixing, narrower roads, and low safety levels; these are not suitable for high speed, high density, and long-distance traffic. Overall, Xiong’an’s transportation system just met the administrative and demand requirements at the county level. Considering the national positioning of Xiong’an, there is a big gap between the current status of the transportation system and future needs.

Policies and Programs

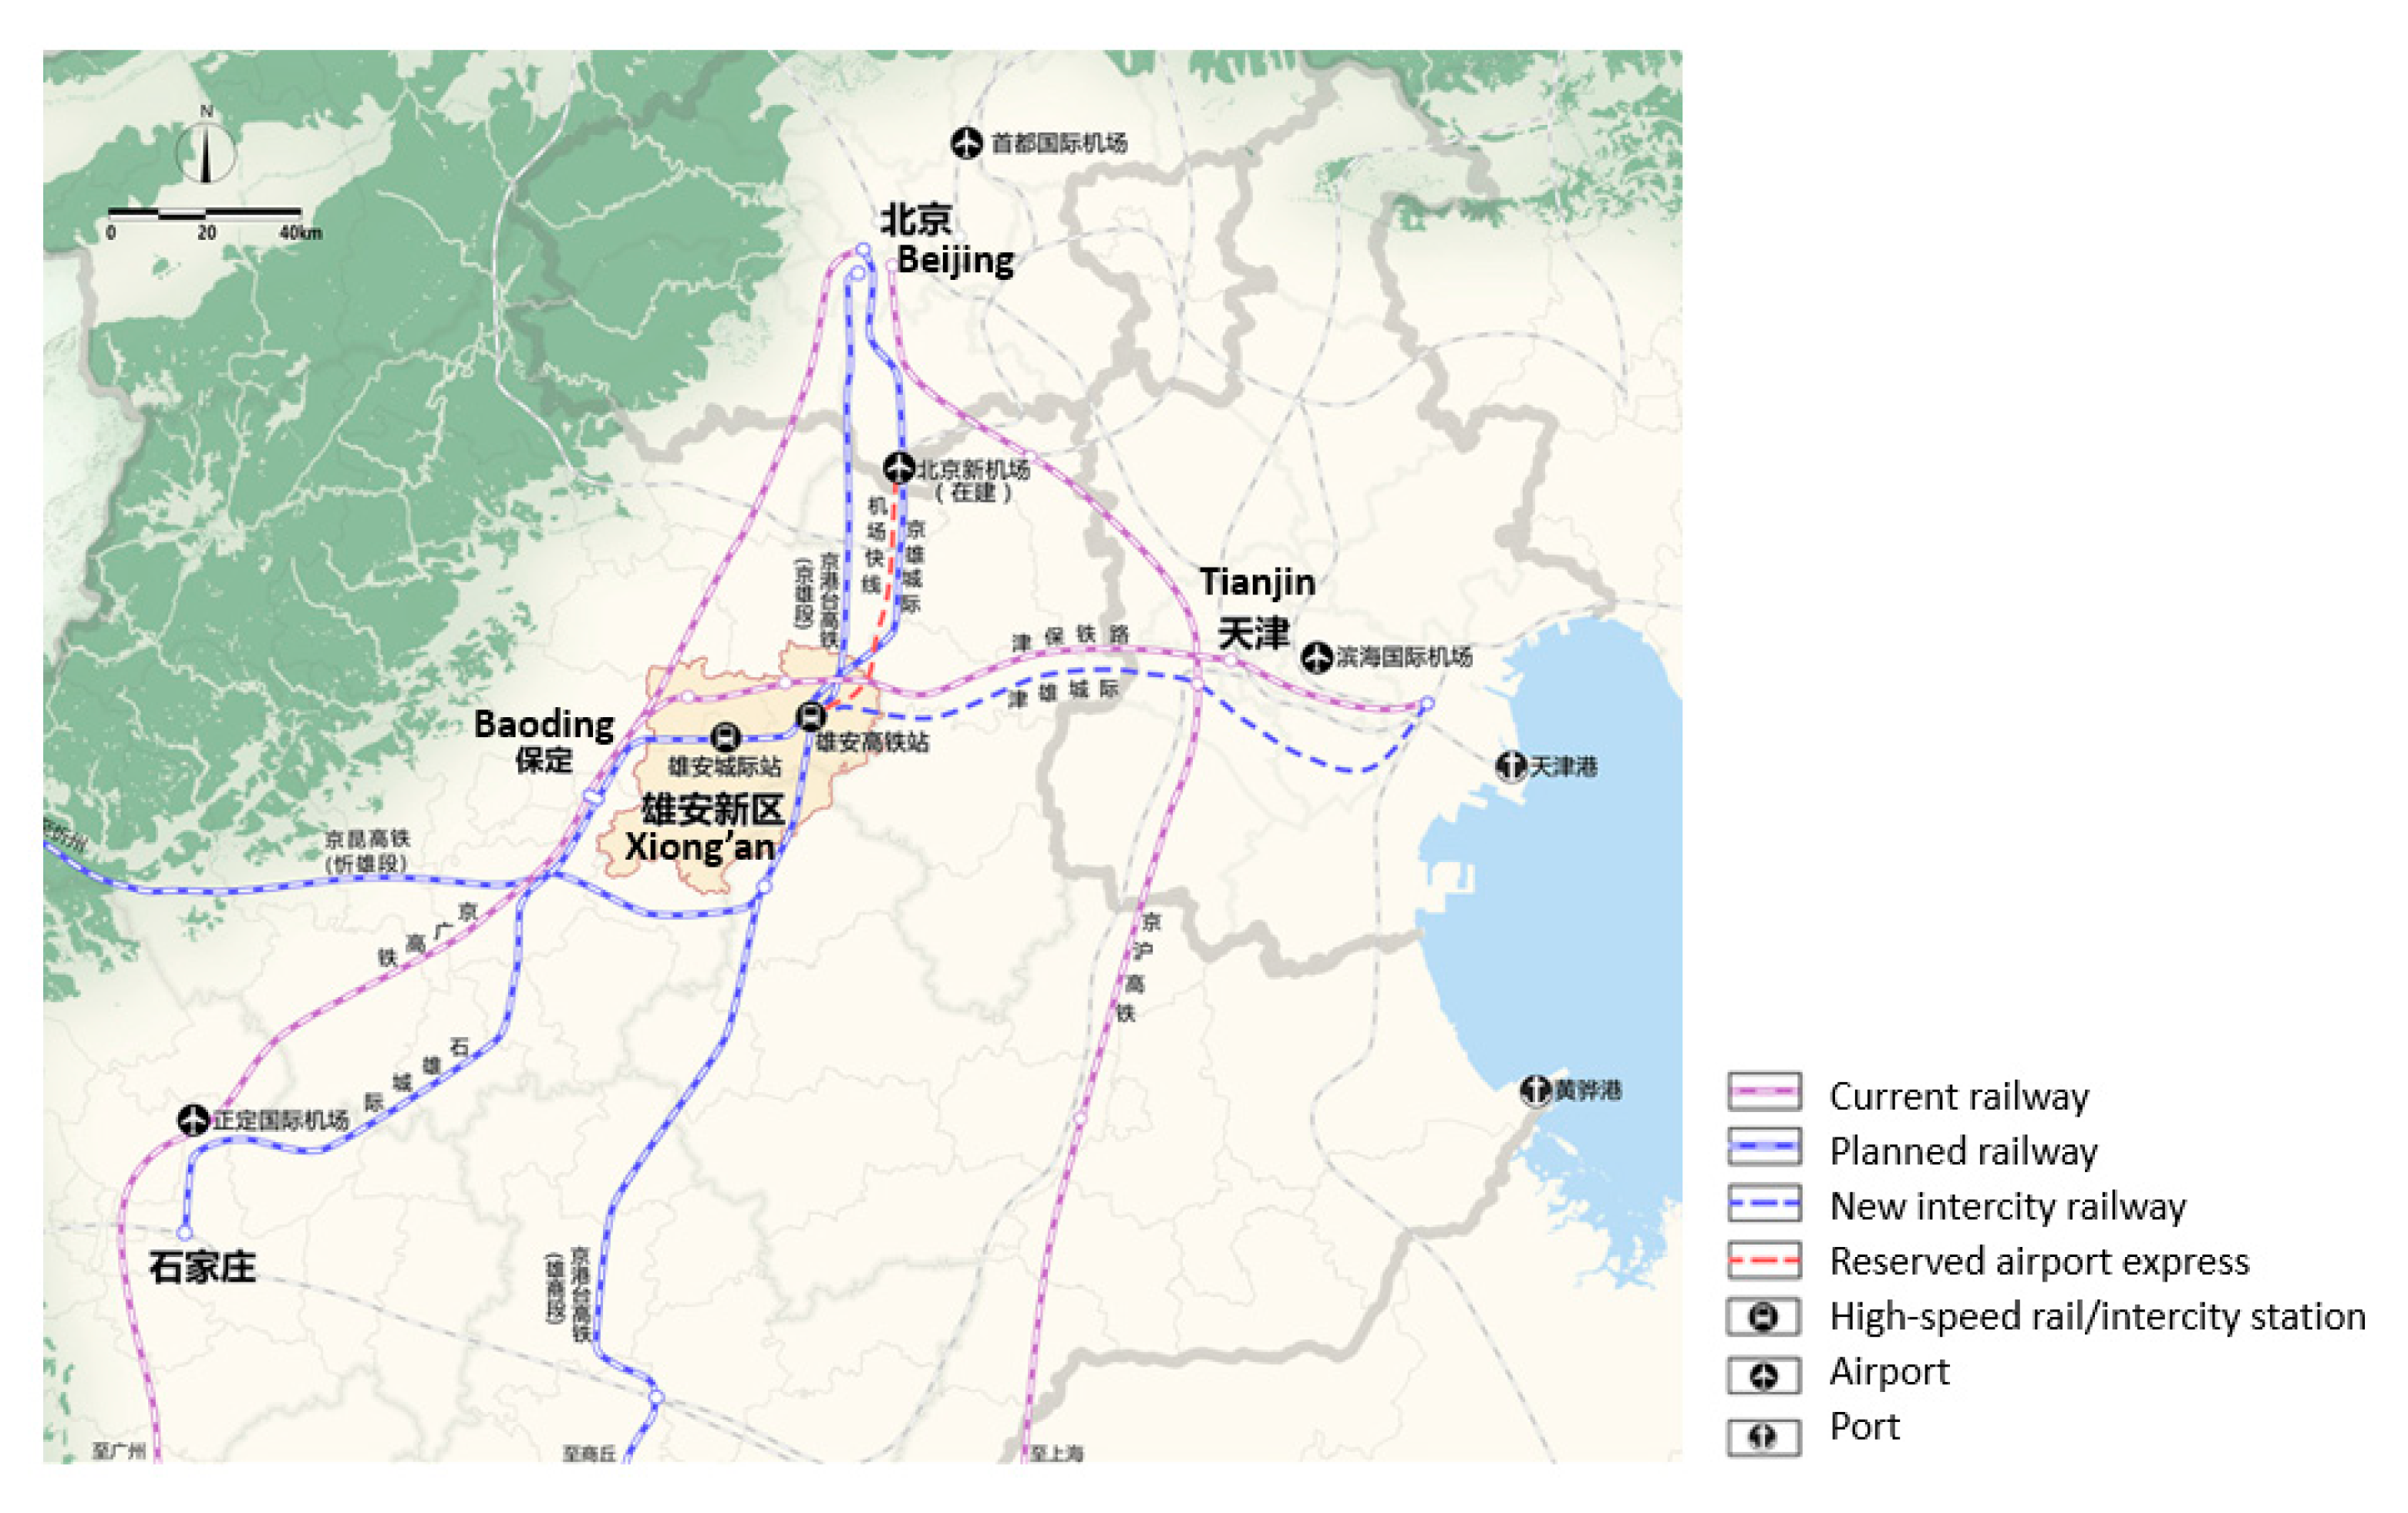
According to the Plan Outline [55], Xiong’an will build a convenient, green, and intelligent comprehensive transportation network. First, based on the existing railway lines and two high-speed railway stations, Xiong’an will build the “four verticals and two horizontals” high-speed railway network (Figure 7), with two newly designed high-speed railway stations (Xiong’an Station and Xiong’an West Station) to realize a direct connection with core cities Beijing and Tianjin. After the completion of the railway network, it will only take 20 min from Xiong’an to Beijing Daxing International Airport, 30 min to Beijing and Tianjin, and 60 min to Shijiazhuang.
Within Xiong’an, various subway lines, bus rapid transit (BRT), and express roads between the core area and the surrounding villages are planned; the density of the arterial road network and landscape road network in the start-up area will be 10–15 km/km2. Separate greenways for cycling and walking will be designed as a safe and comfortable slow-traffic system, to encourage a “public transport + bicycle + walking” travel pattern and reach 90% of the modal split. With ICT such as Internet of Things, mobile Internet, and artificial intelligence, an instantaneous response and intelligent decision-making transport system will be constructed.

Up-to-Date Progress

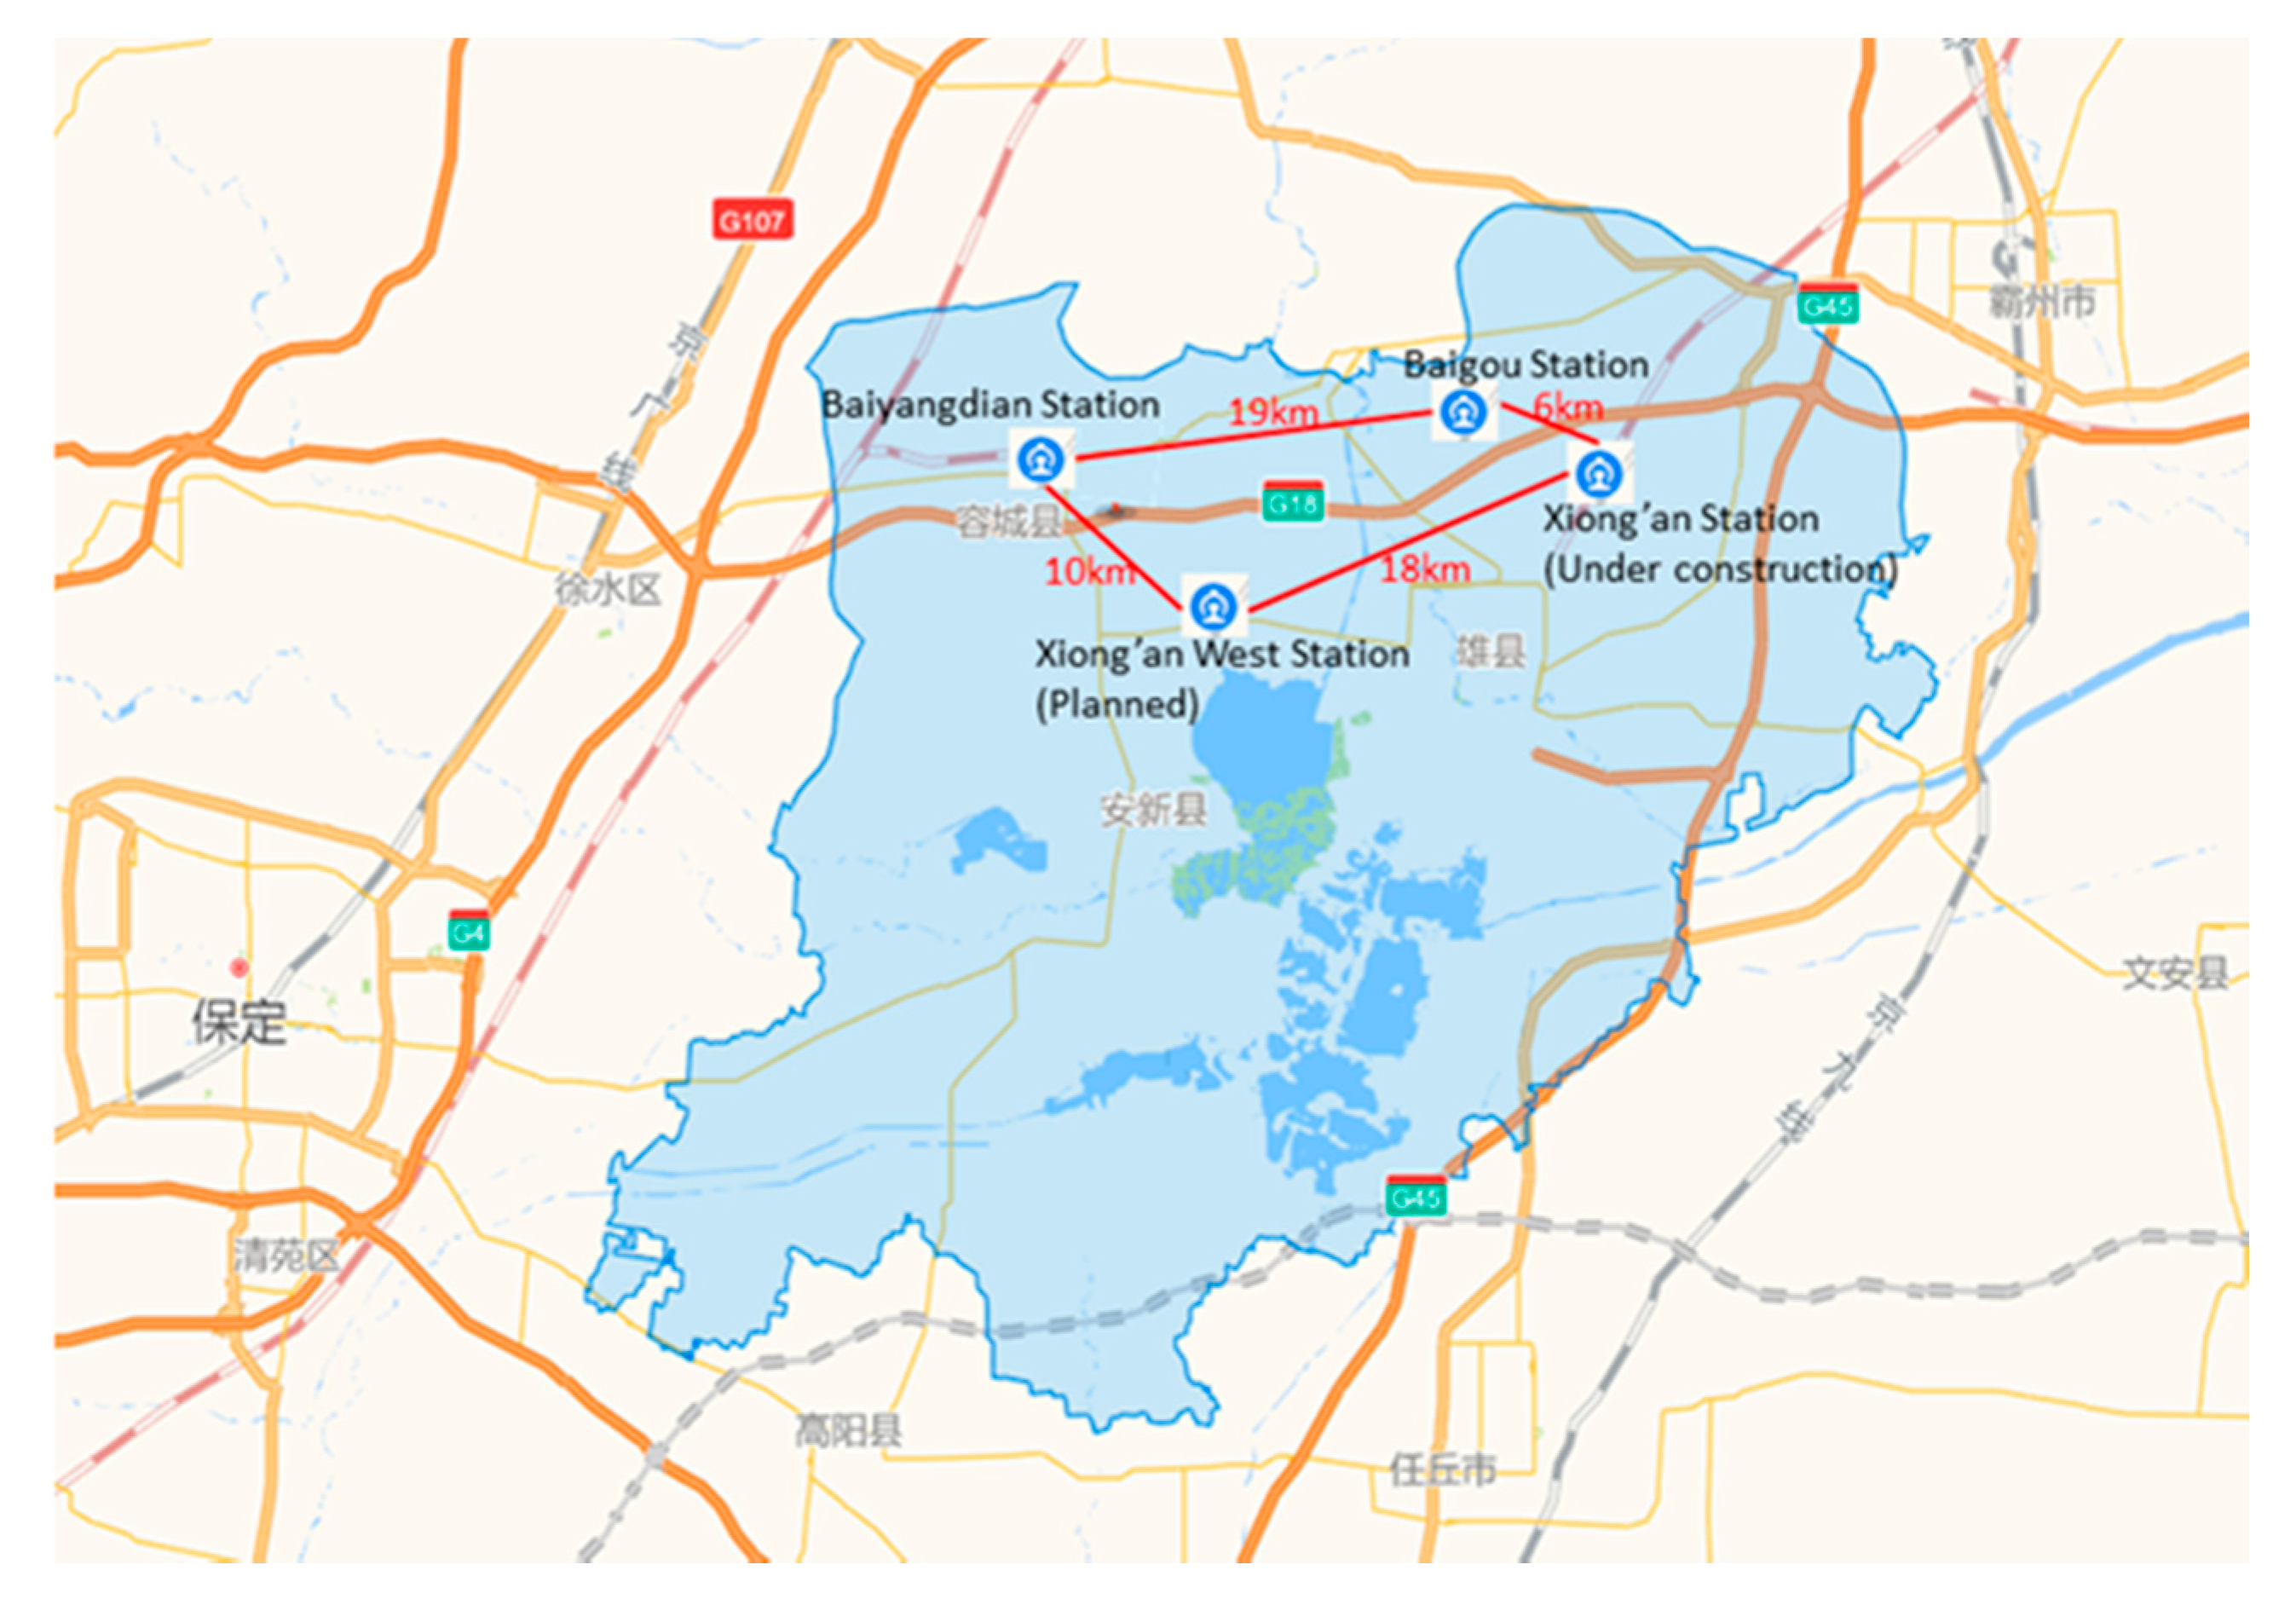
After three years of development, the integrated transport system in Xiong’an has begun to take shape, especially the railway system within the region and the supporting facilities in the surrounding area. In 2018, the construction of the Beijing–Xiong’an Intercity Railway officially started. The total length of the trunk line is 92.4 km, and there are five stations with a total investment of 33.53 billion yuan. In the same year, the construction of the Xiong’an High-Speed Railway Station officially started, with a total construction area of about 470,000 m2, planned to become the largest high-speed railway station in Asia. Together with Baiyangdian Station, Baigou Station, and the planned Xiong’an West Station, Xiong’an will become the densest region for high-speed railways in the world (Figure 8). This can further improve the Beijing–Tianjin–Hebei regional railway network and realize the 30 min traffic circle between Xiong’an, Beijing, and Tianjin, and the 60 min traffic circle in Hebei Province. In September 2019, Beijing Daxing International Airport, located 50 km away from Xiong’an, was officially put into operation, allowing the annual passenger throughput of 100 million passengers.

4.2.3. Education and Training

Initial State

Before 2017, the population growth rate, population density, and education levels of Xiong’an were lower than the average level of Beijing–Tianjin–Hebei Region. At the end of June 2017, the permanent population of the three counties in Xiong’an was 1.0471 million, with a growth rate of 3.42% in the past five years. The population of Anxin County and Xiong County even slightly declined in 2012 and 2013. At the same time, the permanent population of Beijing, Tianjin, and Hebei increased by 10.70%, 19.56%, and 3.33% from 2010 to 2015 [58]. From the perspective of education level, statistics in 2015 showed that the proportion of junior high school education background and below in Xiong’an was 78%, that of high school was 15%, and that of college and above was 7% [58]. This stands in stark contrast with the fact that nearly 40% of the Beijing population has college degrees and above, one fifth of them have undergraduate education, and nearly 5% have graduate education.

Education and Employment Support Policies

The long-term planned population of Xiong’an is 2 million to 2.5 million, and the population density will be 1000 to 1250 people per square kilometer. To promote the transformation of local residents from farmers to new industrial employees, the “10 Plans to Enhance Employment and Entrepreneurship in Xiong’an” was put forward in 2020 [59]. This will gather resources from industry, education, and research to build various community colleges including vocational colleges, continuous education colleges, and elderly education colleges. At the same time, Xiong’an will create a batch of high-level kindergartens, primary and secondary schools, and a world-class Xiong’an University. In 2035, the proportion of public education investment in regional GDP is supposed to reach 5%, and the average years of education is supposed to increase to 13.5 years.

Up-to-Date Progress

After the establishment of Xiong’an, the total population of Xiong’an in October 2019 increased by 9.43% and the proportion of floating population in Xiong’an has increased by 31.15% compared with 2018. Accordingly, the resident population with higher education (including university education and undergraduate education) increased by 9.7%, and the floating population with higher education increased by 26.4% compared to 2018, indicating that Xiong’an is more and more attractive to immigrants [60].

4.2.4. Ecological Services

Initial State

Xiong County is rich in geothermal, oil, and mineral water resources, with a geothermal area of 320 km2 and reserves of 82.178 billion cubic meters, and an annual output of 300,000 tons of oil and 18 million cubic meters of natural gas. Clay and sand for manufacturing are the two main types of mineral resources discovered in Rongcheng County. Anxin County has more than 350 km2 and 15 billion tons of geothermal resources. In addition, the largest wetland in North China, Baiyangdian, with nearly 6.67 km2 of wetland is located in Xiong’an. In 2015, the land cover types of Xiong’an were mainly cultivated land, settlements, and wetlands (including waters), accounting for 90% of the total area. However, the local surface water of Xiong’an was very limited and the groundwater resources were overexploited [61].

Protective Policies and Measures

To support the low-carbon development of Xiong’an, the China Geological Survey launched the largest geological survey activity in China since 2017. The geothermal and mineral resources of Xiong’an will be reassessed as a scientific basis for establishing energy plans. In addition, the 2018–2035 Master Plan [57] pointed out that Xiong’an will protect and restore wetland, water resources, forests, and farmland to build an integrated living community. To protect Baiyangdian wetlands, forests, and other ecological spaces, Xiong’an will build ecological buffer zones between urban areas to achieve the 70% blue–green rate. In the process of urbanization, the scale of construction land should be strictly controlled within 530 km2 and the cultivated land account for 18% of the total area. At the end of 2019, the first permanent water conservancy project “Yellow Pump Station” was completed, and the Yellow River water was introduced to Baiyangdian, with an annual replenishment of 110 million cubic meters, ensuring that Baiyangdian wetland became an important and stable water source in Xiong’an.

Up-to-Date Progress

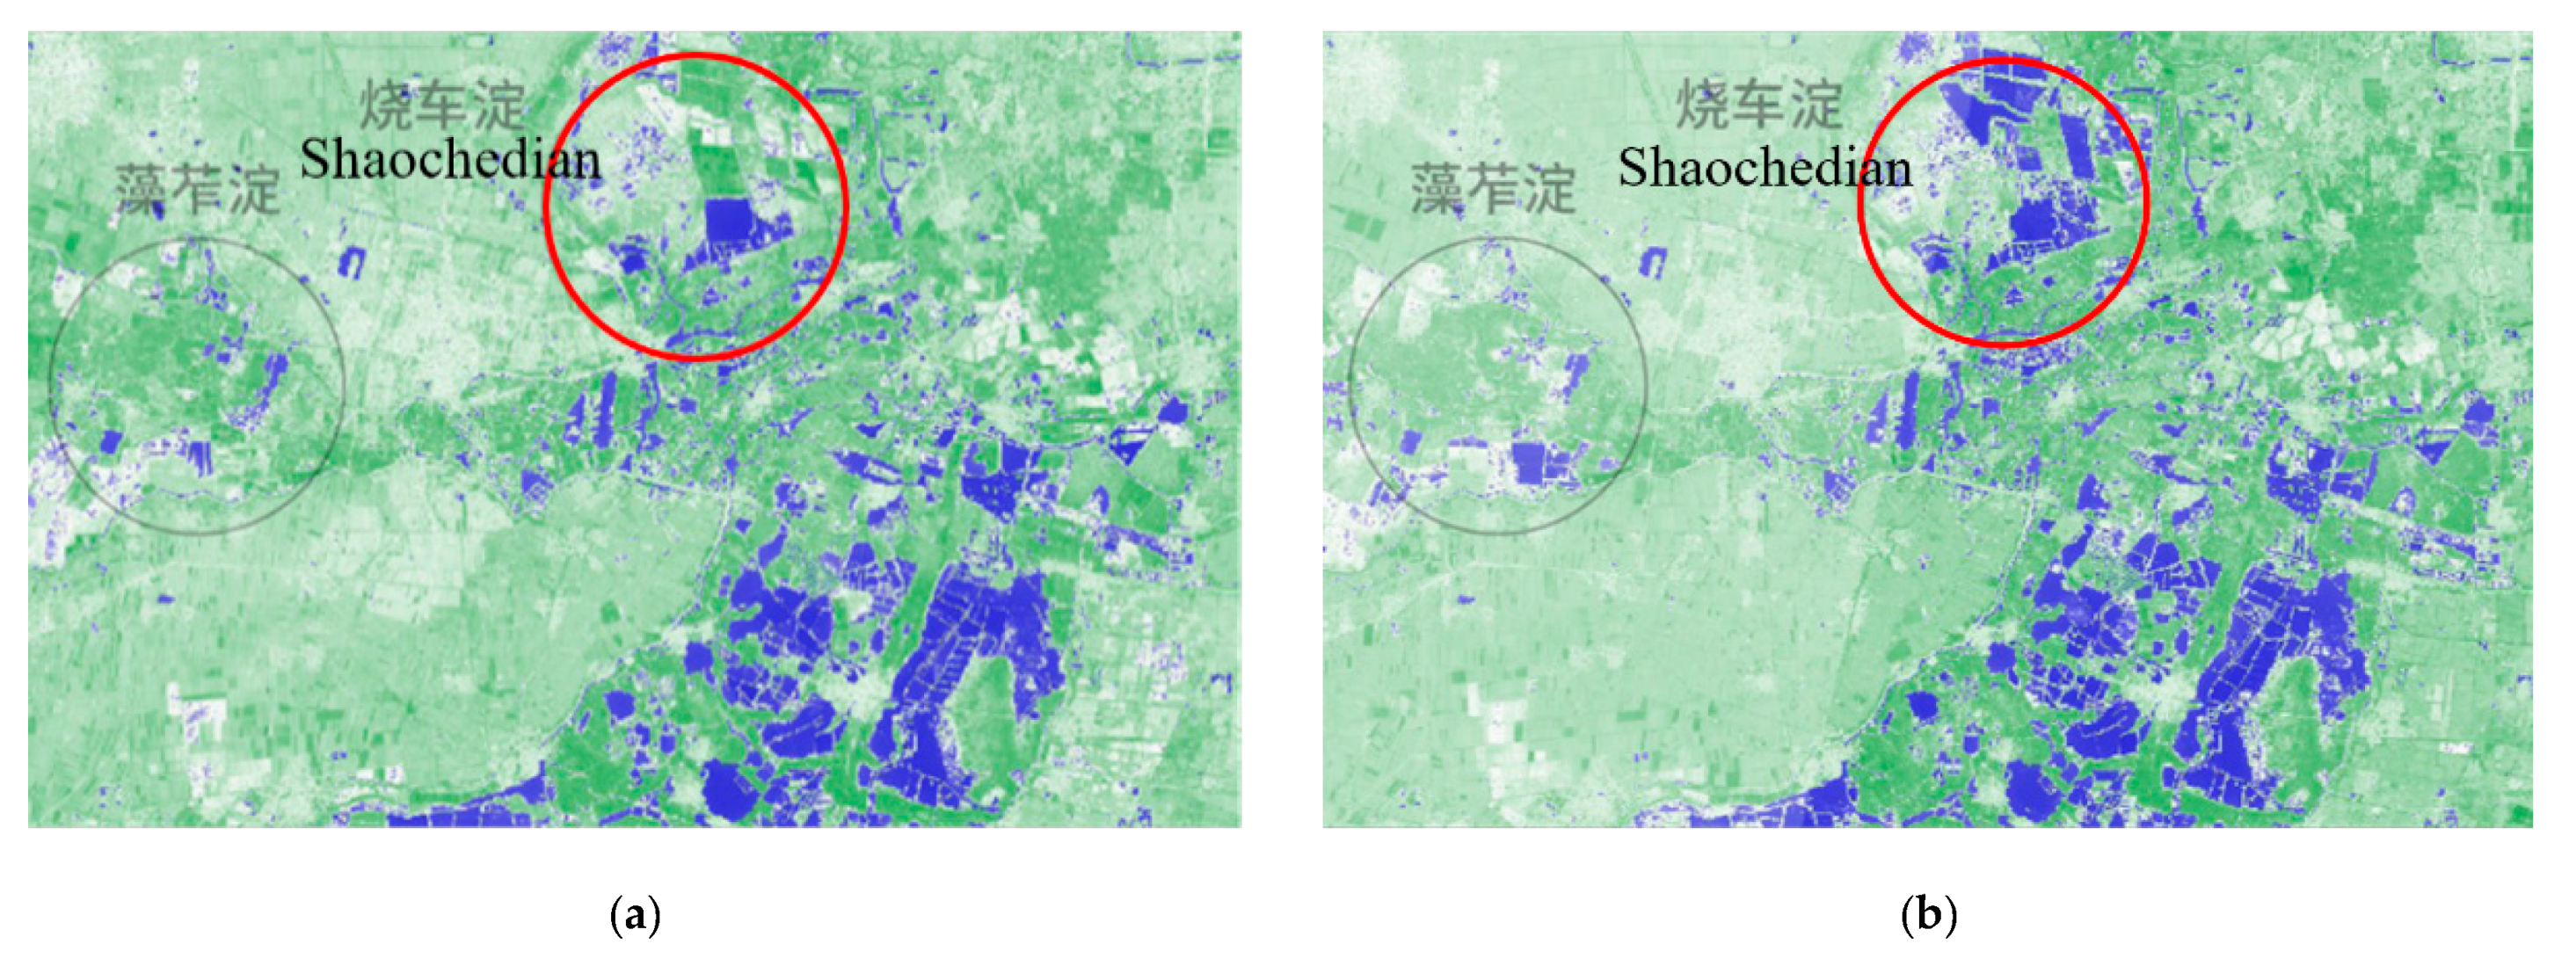
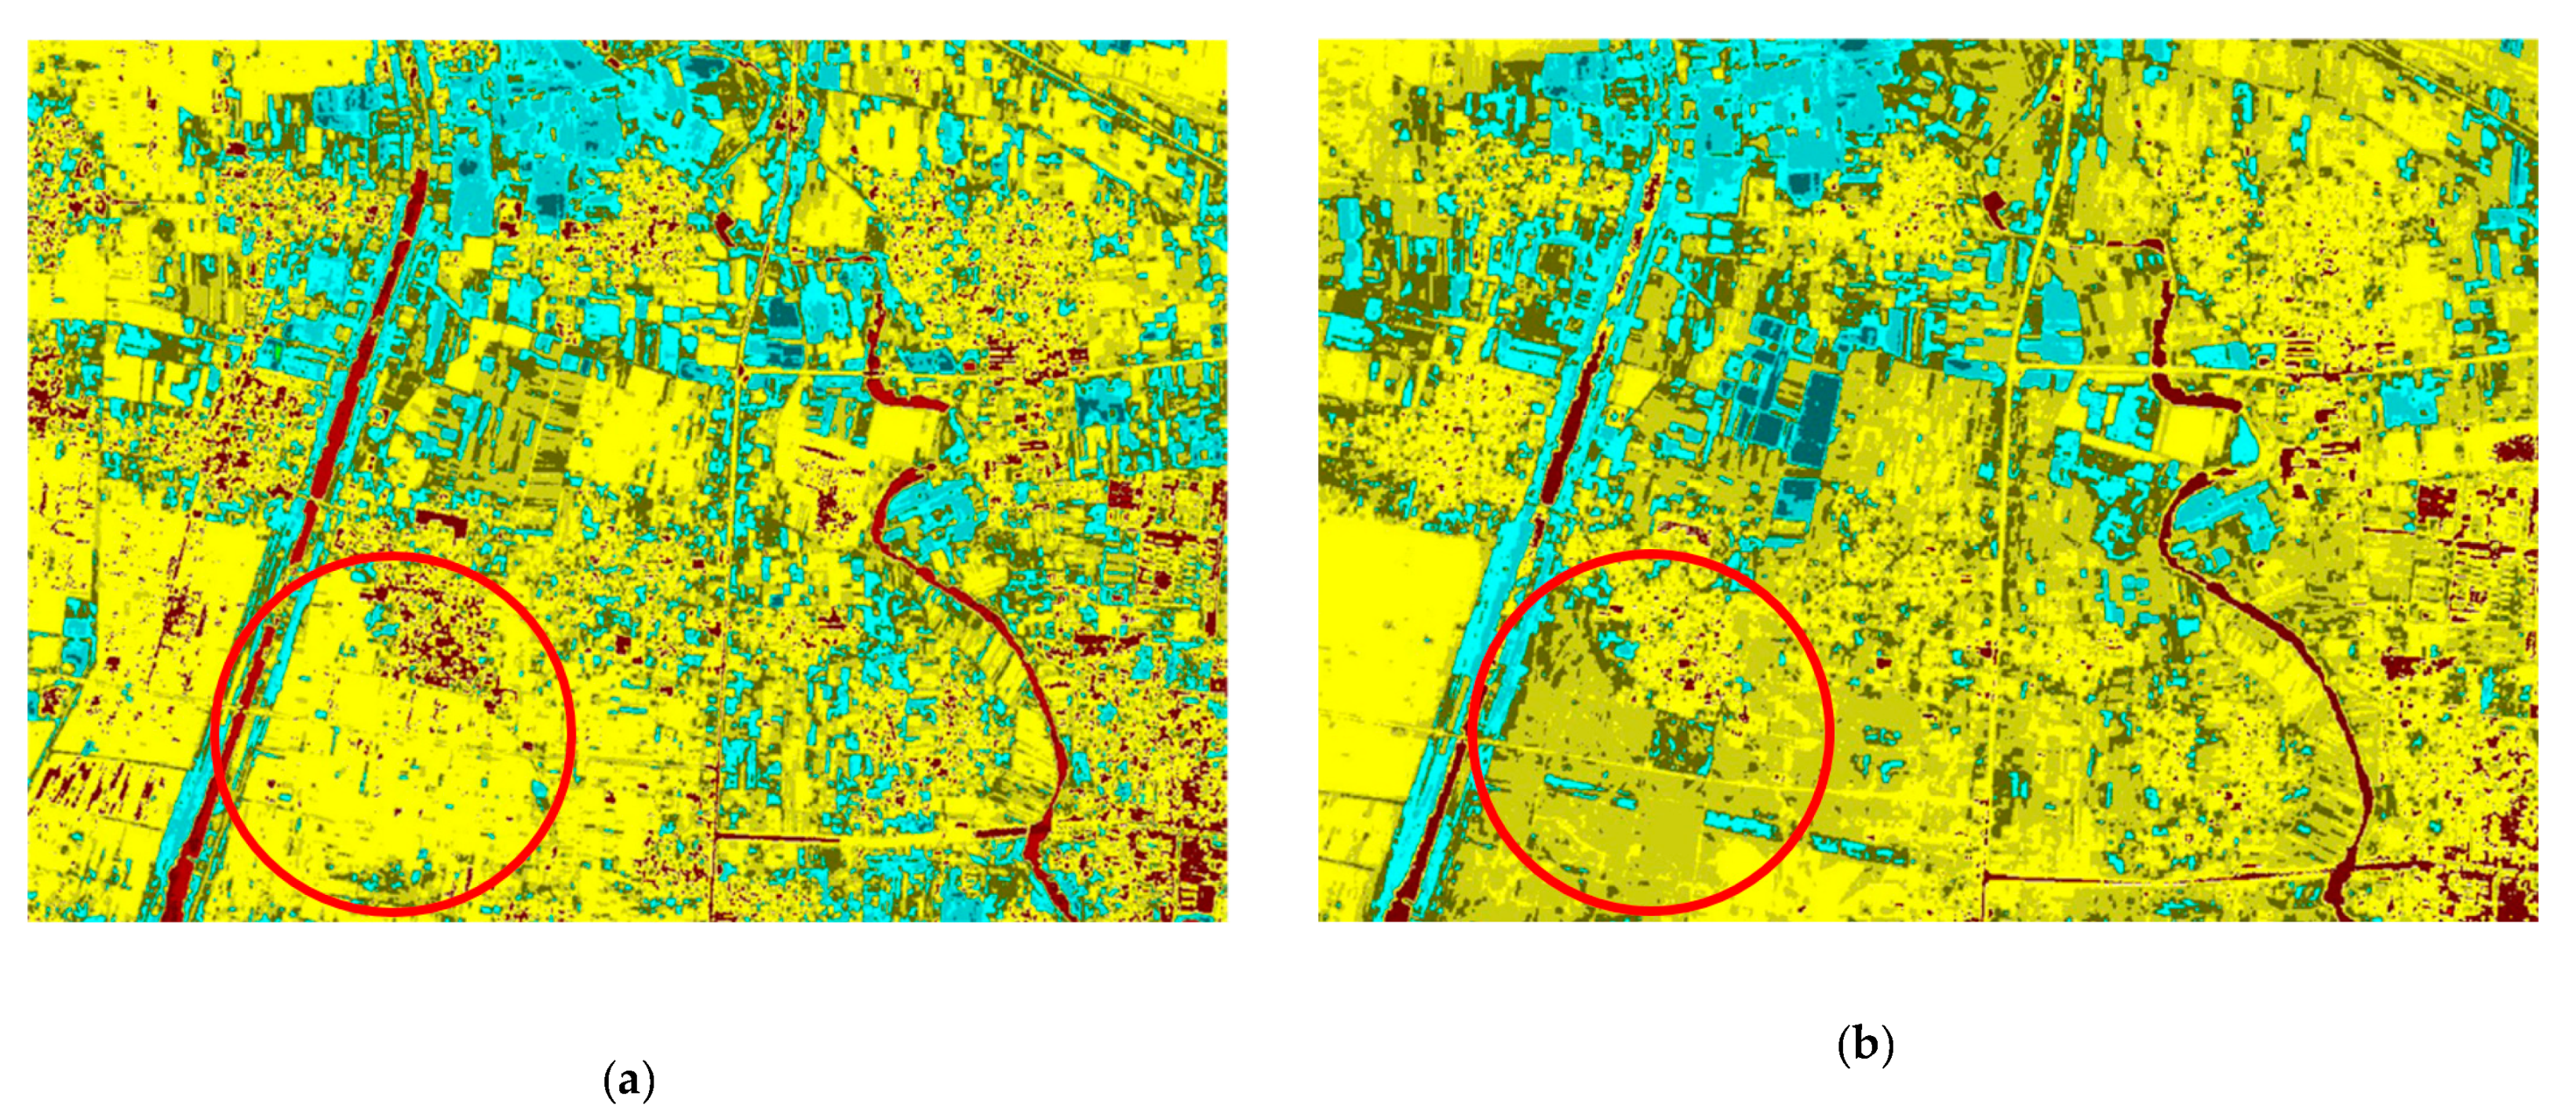
The preliminary survey results in June 2019 showed that the hydrothermal geothermal resources in Rongcheng were in good shape, with an annual recoverable amount equivalent to 37,100 tons of standard coal and a total heating capacity of about 3 million square meters. Therefore, Xiong’an will build a multienergy complementary elastic supply system based on geothermal energy to improve the energy supply stability. According to the 2019 Big Data Report of Xiong’an [60], the hydrology and vegetation coverage in Xiong’an have been significantly improved. Compared with June 2017, the water area of Baiyangdian increased by 24.05% until June 2019. The water area in Shaochedian, the core area of future Xiong’an, increased by 89.21% (Figure 9) [60]. In November 2017, Xiong’an launched the “Millennium Forest” program to increase vegetation cover from 11% to 40% to form ecological buffer zones between urban areas. According to the remote sensing image data, the vegetation coverage of Xiong’an has expanded obviously in the past two years. In particular, the vegetation-covered area in Daqinghe has increased by 29.17%, and the vegetation covered area on the east side of Rongcheng County has increased by 30.21% (Figure 10) [60].

5. Discussion

Under the direct central government leadership, with supporting policies and strong financial impetus, Xiong’an is expected to urbanize rapidly, sharing the burden of the surrounding big cities. Through institutional optimization and attraction of high-tech talents, it is planned to be the engine of regional development and a model of China’s ‘city of the future’ in its long-term development. However, due to demographic changes, industrial restructuring, infrastructure upgrades, and limited carrying capacity of ecological resources, Xiong’an may face several economic, environmental, and social inclusion challenges.

5.1. Fairness of the New Land Policy and the Housing Purchase System

Land finance policy has played a very important role in the historical process of China’s reform and opening up. Over-reliance on land finance, coupled with the mismatch between local financial power and administrative power, has made land finance an important source of revenue for many local governments to meet the huge capital needs of urban construction. The consequences are gradually coming to the fore, such as mass conflicts in the process of land acquisition and demolition, and rapidly rising property prices, especially in first- and second-tier cities. At present, the housing stock in Xiong’an is far from adequate to meet the needs of the future population. Under the policy of ‘No Land Finance’ and the business model of farmers participating in urban construction with land as shares, the interests of local farmers will be closely linked to regional development and last long-term. For immigrants, on the one hand, public rental housing will guarantee their basic housing needs; on the other hand, the points-based housing system will control housing prices. However, how it can be ensured that the benefits of urban development are equitably distributed among governments, farmers, and developers remains to be further clarified. At the same time, ensuring that people with different educational and professional backgrounds benefit equitably from the points-based home purchase system is also to be considered.

5.2. Matching Public Services with Diverse Needs

Through the construction of Asia’s largest high-speed railway station, road, and bridge network and BRT lines, combined with 5G network, artificial intelligence, block-chain, Internet of Things, and other high-technologies, Xiong’an will greatly improve the capacity to transport passengers and goods and form a half-hour economic circle with Beijing, Tianjin, and Hebei. However, the layout of transport infrastructures tends to shape the spatial distribution of urban economic clusters, leading to high-speed development in one area due to aggregated economies, and lagging development in other areas, eventually resulting in fragmented urban development. In addition, high-level public services come at high charges, and therefore the diverse needs and consumption capacities of different income groups need to be evaluated. At the same time, for the design of service facilities the ability of people in different age groups and educational backgrounds to accept new technologies is to be taken into consideration.

5.3. Social Integration Issues and Employment Pressure

At the beginning of Xiong’an’s construction, a number of contaminating enterprises and real estate trading institutions were closed down, while a large number of scientific research institutions, administrative institutions, and technical and financial enterprises were introduced. In the long run, this will promote a rapid upgrade of the Xiong’an industry and drive regional economic development and employment. A series of education centers and vocational training institutions will also help cultivate local talents and bring in immigrant talents. In the short term, however, the current population in Xiong’an is composed of farmers and employees of small- and medium-sized enterprises, most of whom have a low level of education and vocational skills. Against the background of high operation costs for the original enterprises and the expropriation of agricultural land, the difficulty of their staying in the local area and/or staying employed cannot be ignored. Indeed, of the 2 million inhabitants in the long-term plan, Xiong’an is expected to garner the best talents from around China and the world; immigrants and indigenous people may therefore face problems of spatial segregation, competition for resources, and cultural clashes in the future. The governance system and public service design in Xiong’an are challenged to meet the diverse needs of a population with different educational backgrounds, perspectives of life experiences, and professional orientation.

5.4. Ecological Protection and Resource Allocation

Xiong’an has abundant land, minerals and water resources. Its main water source, Baiyangdian Wetland, has been a stable source of production and operates under strict control. However, current per capita water resources in Xiong’an are below 300 cubic meters. According to internationally recognized standards, when annual water supplies drop below 1,000 cubic meters per person, the population will face water scarcity, and below 500 cubic meters even “absolute scarcity” [65]. With the increase in population density and the further expansion of industrial production, Xiong’an’s production and domestic water use will largely depend on the South-to-North Water Diversion Project. Therefore, it is urgent to develop high value-added innovative industries that can afford such high-cost production of water to achieve better economic benefits. In terms of geothermal extraction, it is necessary to establish a complete dynamic monitoring system to protect groundwater resources and support the sustainable development of geothermal resources. In general, improvements need to be made in two ways to achieve the effective use and rational distribution of ecological resources: on the one hand, applying the circular economy concept to build material and energy networks for waste recovery and resource recycling at the corporate and social levels; on the other hand, applying nature-based theory for urban planning, making full use of natural resources such as wetlands and geothermal energy to meet residents’ basic living needs, while providing more convenient and diversified green spaces for public activities.
Finally, as a summary and vision towards future, Xiong’an is and will be leading in many aspects with top-quality infrastructure, new land policies, a different resident permit system, and abundant natural resources. However, the path to becoming an inclusive city is not without obstacles, and there is a high risk of social segregation emerging if current policies do not change. For instance, the point-based housing qualification seems easier to acquire for the well-educated creative class, in disregard of the housing needs that local farmers and factory workers have. Moreover, the advanced transportation facilities are mainly designed to meet the needs of high-income groups commuting frequently between Xiong’an and surrounding big cities. The high prices accompanying high-quality services are often unaffordable for locals and low-income immigrants. High-tech service facilities may cause the elderly and low-educated citizens to encounter difficulties in actual use. In order to protect water and soil, a large number of polluting enterprises were shut down on the original site of Xiong’an. It will be complicated for the local workers to adapt to new knowledge-intensive enterprises, at least in the short run.
To avoid issues of social exclusion in Xiong’an, the government should promote a series of “people-centered” policies that enable all citizens to have equal access to public services, regardless of their resident permit, level of education and work experience. Firstly, since local farmers and workers are more likely to be excluded from new types of employment due to processes of industrial upgrading, local government should provide affordable employment training and educational resources to them. Secondly, in the planning of infrastructure, attention should be paid not only to advanced facilities, but also to the affordability and convenience of all users. Thirdly, in order to reach a consensus on the concept of inclusive development, governments should gradually transform the traditional top-down decision-making process into a more balanced bottom-up and top-down interaction model. Which means, governments can widely consult with local communities involved in particular projects before making decisions.

6. Conclusions

As ‘a model city of the future’, Xiong’an is a lab for experimenting how people-centered, inclusive, and sustainable development in China can be realized. In this study, we offer a conceptual analysis of urban inclusiveness. Then, a multidimensional framework for assessing urban inclusiveness was designed. As measured by the selected IDIs, Xiong’an is building the world’s densest high-speed rail network and integrated urban rapid transit network with 5G, and plans to build an international smart medical center and education center. In terms of governance reform, for the first time in China, Xiong’an will replace the original household registration system with a points-based housing-purchase system to attract immigrant talents; at the same time, the one-time land acquisition compensation will be abolished, and a new strategy enabling farmers to invest in land and profit from urban development in the long term will be adopted. In order to achieve sustainable development, Xiong’an has raised the forest coverage rate from 11% to 40% through the “Millennium Forest” program, restored the main water source Baiyangdian Wetland, and conducted a large-scale survey of the mineral and geothermal resources.
The RSDO-ST model presented in this study provides a comprehensive framework for assessing the inclusiveness of urban development and it is a useful tool for guiding the selection of IDIs. It can assist urban planners and policymakers in making decisions on urban infrastructure investments and developing targeted policies. However, our analysis is not without limitations: we only did field research in the early stages of the construction process, when policies were still open to revision and improvement, and many projects had just been approved. Inclusive development is a long-term process of continuous adaptation based on regional characteristics and incremental adjustments. Follow-up research should monitor new developments in Xiong’an. With the help of technological advances the accuracy and availability of urban system data (e.g., traffic flow data, satellite remote sensing data, social network data, wearable device data) can be improved, which makes the selection of indicators in the RSDO-ST framework broader and more complete, thereby improving the continuity and accuracy of inclusive urban assessment and policy adjustments in response.

Author Contributions

Z.L. conducted the data collection and wrote the text as the main author. M.D.J. conceived of the idea of the research, made the structure, and edited the text. F.L. offered data resources and completed data verification. N.B. and M.H. supervised this research work and provided guidance. L.D. gave suggestions on the methodology and reviewed the text. All authors contributed significantly to this work by reading and editing. All authors have read and agreed to the published version of the manuscript.

Funding

This research was supported by [National Key R&D Program of China], grant number [2017 YFE0101700]. This work is part of the research program ‘Towards Inclusive Circular Economy: Transnational Network for Wise-waste Cities (IWWCs)’ with project number 482.19.608, which is partly financed by the Dutch Research Council (NWO). This research received support from the Erasmus Initiative for the Dynamics of Inclusive Prosperity (DoIP).

Conflicts of Interest

The authors declare no conflict of interest.

Appendix A

Main indicators of ‘Xiong’an 2035 Planning’ [57].
CategoriesIndicatorsGoals in 2035
Innovative intelligence1.1 The proportion of research & experimental development expenditures of the whole society in the regional GDP (%)6
1.2 The proportion of basic research funds in research & experimental development funds (%)18
1.3 Possession of invention patents per 10,000 people (pieces)100
1.4 Contribution rate of scientific & technological progress (%)80
1.5 Proportion of public education investment in regional GDP (%)≥5
1.6 The proportion of digital economy in GDP of urban areas (%)≥80
1.7 Contribution rate of big data in refined urban governance and emergency management (%)≥90
1.8 Intelligent level of infrastructure (%)≥90
1.9 High-speed broadband standardFull coverage of high-speed broadband wireless communications, Gigabit-level in households, 10 Gigabit-level in enterprises
Green ecology2.1 Proportion of blue–green space (%)≥70
2.2 Forest coverage (%)40
2.3 Proportion of cultivated land protection area in the total area of the region (%)18
2.4 Percentage of permanent basic farmland protection area in the total area of the region (%)≥10
2.5 Urban green coverage rate in start-up area (%)≥50
2.6 Per capita urban park area in the start-up area (m2) ≥20
2.7 The coverage of the 300 m service radius of the park in the start-up area (%)100
2.8 The total length of the backbone greenway in the start-up area (km)300
2.9 Water quality compliance rate of important water function areas (%)≥95
2.10 Total annual runoff control rate of rainwater (%)≥85
2.11 Water supply guarantee rate (%)≥97
2.12 Sewage collection and treatment rate (%)≥99
2.13 Utilization rate of waste water recycling (%)≥99
2.14 Green building standard compliance rate of newly built civil buildings (%)100
2.15 Annual average concentration of fine particles (PM2.5) (μg/m3)Atmospheric environmental quality is fundamentally improved.
2.16 Harmless treatment rate of domestic garbage (%)100
2.17 Utilization rate of urban domestic garbage recycling resources (%)>45
Well-being3.1 15 min community life circle coverage rate (%)100
3.2 Per capita construction area of public cultural service facilities (m2)0.8
3.3 Per capita public sports land area (m2)0.8
3.4 Average years of education (years)13.5
3.5 Number of beds in medical and health institutions (sheets/1000 person) 7.0
3.6 Population density in planned construction area (person/km2)≤10000
3.7 Road network density in start-up area (km/km2)10–15
3.8 Proportion of green transportation trips in the start-up area (%)≥90
3.9 Proportion of public transport in motorized travel in start-up areas (%)≥80
3.10 Service radius of public transportation station in start-up area (m) ≤300
3.11 Public transport service coverage rate of municipal road in starting area (%)100
3.12 Area of emergency refuge per capita (m2)2–3

References

  1. Dong, L.; Liang, H. Spatial analysis on China’s regional air pollutants and CO2 emissions: Emission pattern and regional disparity. Atmos. Environ. 2014, 92, 280–291. [Google Scholar] [CrossRef]
  2. Dong, L.; Liang, H.; Gao, Z.; Luo, X.; Ren, J. Spatial distribution of China’s renewable energy industry: Regional features and implications for a harmonious development future. Renew. Sustain. Energy Rev. 2016, 58, 1521–1531. [Google Scholar] [CrossRef]
  3. China NBoSo. Statistical Communiqué on the National Economic and Social Development of the People’s Republic of China; National Bureau of Statistics of China: Beijing, China, 2020.
  4. OECD: Income Inequality (Indicator). Available online: https://www.oecd-ilibrary.org/social-issues-migration-health/income-inequality/indicator/english_459aa7f1-en (accessed on 8 March 2020).
  5. Dong, H.; Fujita, T.; Geng, Y.; Dong, L.; Ohnishi, S.; Sun, L.; Dou, Y.; Fujii, M. A review on eco-city evaluation methods and highlights for integration. Ecol. Indic. 2016, 60, 1184–1191. [Google Scholar] [CrossRef]
  6. Stronks, K.; Ravelli, A.C.; Reijneveld, S.A. Immigrants in the Netherlands: Equal access for equal needs? J. Epidemiol. Community Health 2001, 55, 701–707. [Google Scholar] [CrossRef] [PubMed] [Green Version]
  7. World Bank, Development Research Center of the State Council The People’s Republic of China. Urban China: Toward Efficient, Inclusive, and Sustainable Urbanization; World Bank: Washington, DC, USA, 2014. [Google Scholar] [CrossRef]
  8. Harrison, J. Life after regions? The evolution of city-regionalism in England. Reg. Stud. 2012, 46, 1243–1259. [Google Scholar] [CrossRef] [Green Version]
  9. Storper, M. Keys to the City: How Economics, Institutions, Social Interaction, and Politics Shape Development; Princeton University Press: Princeton, NJ, USA, 2013. [Google Scholar]
  10. Lee, N. Inclusive growth in cities: A sympathetic critique. Reg. Stud. 2019, 53, 424–434. [Google Scholar] [CrossRef] [Green Version]
  11. Benner, C.; Pastor, M. Equity, Growth, and Community: What the Nation can Learn From America’s Metro Areas; University of California Press: Oakland, CA, USA, 2015. [Google Scholar]
  12. Plunkett, J. Growth Without Gain; Resolution Foundation: London, UK, 2011. [Google Scholar]
  13. Summers, L.H.; Balls, E. Report of the Commission on Inclusive Prosperity; Center for American Progress: Wahshington, DC, USA, 2015. [Google Scholar]
  14. Cavanaugh, A.; Breau, S. Locating geographies of inequality: Publication trends across OECD countries. Reg. Stud. 2018, 52, 1225–1236. [Google Scholar] [CrossRef]
  15. Espino, N.A. Building the Inclusive City: Theory and Practice for Confronting Urban Segregation; Routledge: Abingdon, UK, 2015. [Google Scholar]
  16. Kireyev, A.; Chen, J. Inclusive Growth Framework; International Monetary Fund: Washington, DC, USA, 2017. [Google Scholar]
  17. Samans, R.; Blanke, J.; Drzeniek, M.; Corrigan, G. The Inclusive Development Index 2018 Summary and Data Highlights; World Economic Forum: Geneva, Switzerland, 2018. [Google Scholar]
  18. Laquian, A.A.; Hanley, L.M. The Inclusive City: Infrastructure and Public Services for the Urban Poor in Asia; Johns Hopkins University Press: Baltimore, MA, USA, 2007. [Google Scholar]
  19. Sharma, D. Inclusive urban development: Role of institutions and governance. Int. J. Regul. Gov. 2010, 10, 91–102. [Google Scholar] [CrossRef]
  20. de Jong, M. From eco-civilization to city branding: A neo-marxist perspective of sustainable urbanization in China. Sustainability 2019, 11, 5608. [Google Scholar] [CrossRef] [Green Version]
  21. Lu, H.; de Jong, M. Evolution in city branding practices in China’s Pearl River Delta since the year 2000. Cities 2019, 89, 154–166. [Google Scholar] [CrossRef]
  22. Hanusch, M. Republic of South Africa Systematic Country Diagnostic: An Incomplete Transition Overcoming the Legacy of Exclusion in South Africa; World Bank: Washington, DC, USA, 2018. [Google Scholar]
  23. Burgard, S. Race and pregnancy-related care in Brazil and South Africa. Soc. Sci. Med. 2004, 59, 1127–1146. [Google Scholar] [CrossRef] [PubMed]
  24. Salisbury, T. Education and inequality in South Africa: Returns to schooling in the post-apartheid era. Int. J. Educ. Dev. 2016, 46, 43–52. [Google Scholar] [CrossRef]
  25. Steinberg, S. Occupational Apartheid in America: Race, Labor Market Segmentation, and Affirmative Action. In Without Justice For All; Routledge: Abingdon, UK, 2018; pp. 215–233. [Google Scholar]
  26. Phelps, M.S.; Prock, G.A. Equality of Educational Opportunity in Rural America. In Rural Education (1991): Issues and Practice; Deyoung, A., Ed.; Taylor & Frauncis Group: Abingdon, UK, 2017; p. 269. [Google Scholar]
  27. Redmond, P.; McGuinness, S. The gender wage gap in Europe: Job preferences, gender convergence and distributional effects. Oxf. Bull. Econ. Stat. 2019, 81, 564–587. [Google Scholar] [CrossRef]
  28. Dong, L.; Liang, H.; Zhang, L.; Liu, Z.; Gao, Z.; Hu, M. Highlighting regional eco-industrial development: Life cycle benefits of an urban industrial symbiosis and implications in China. Ecol. Model. 2017, 361, 164–176. [Google Scholar] [CrossRef]
  29. Dou, Y.; Luo, X.; Dong, L.; Wu, C.; Liang, H.; Ren, J. An empirical study on transit-oriented low-carbon urban land use planning: Exploratory Spatial Data Analysis (ESDA) on Shanghai, China. Habitat Int. 2016, 53, 379–389. [Google Scholar] [CrossRef]
  30. Dong, L.; Wang, Y.; Scipioni, A.; Park, H.-S.; Ren, J. Recent progress on innovative urban infrastructures system towards sustainable resource management. Resour. Conserv. Recycl. 2018, 128, 355–359. [Google Scholar] [CrossRef]
  31. Fransen, K.; Boussauw, K.; Deruyter, G.; de Maeyer, P. The relationship between transport disadvantage and employability: Predicting long-term unemployment based on job seekers’ access to suitable job openings in Flanders, Belgium. Transp. Res. Part A Policy Pract. 2019, 125, 268–279. [Google Scholar] [CrossRef]
  32. Ianchovichina, E.; Lundstrom, S. Inclusive Growth Analytics: Framework and Application; The World Bank: Washington, DC, USA, 2009. [Google Scholar]
  33. Spence, M. The Growth Report: Strategies for Sustained Growth and Inclusive Development; World Bank: Washington, DC, USA, 2008. [Google Scholar]
  34. Bian, Y.; Dong, L.; Liu, Z.; Zhang, L. A sectoral eco-efficiency analysis on urban-industrial symbiosis. Sustainabiliy 2020, 12, 3650. [Google Scholar] [CrossRef]
  35. UN-Habitat. Inclusive Cities Initiative: The Way Forward. Nairobi: UN Habitat. Available online: https://www.unhabitat.org/downloads/docs/2115_40209_inclusive_cities_WHD.doc (accessed on 20 March 2019).
  36. Luo, X.; Dong, L.; Dou, Y.; Li, Y.; Liu, K.; Ren, J.; Liang, H.; Mai, X. Factor decomposition analysis and causal mechanism investigation on urban transport CO2 emissions: Comparative study on Shanghai and Tokyo. Energy Policy 2017, 107, 658–668. [Google Scholar] [CrossRef]
  37. Luo, X.; Dong, L.; Dou, Y.; Liang, H.; Ren, J.; Fang, K. Regional disparity analysis of Chinese freight transport CO2 emissions from 1990 to 2007: Driving forces and policy challenges. J. Transp. Geogr. 2016, 56, 1–14. [Google Scholar] [CrossRef]
  38. Sun, L.; Li, H.; Dong, L.; Fang, K.; Ren, J.; Geng, Y.; Fujii, M.; Zhang, W.; Zhang, N.; Liu, Z. Eco-benefits assessment on urban industrial symbiosis based on material flows analysis and emergy evaluation approach: A case of Liuzhou city, China. Resour. Conserv. Recycl. 2017, 119, 78–88. [Google Scholar] [CrossRef] [Green Version]
  39. Xue, Y.; Xiang, P.; Jia, F.; Liu, Z. Risk Assessment of High-Speed Rail Projects: A Risk Coupling Model Based on System Dynamics. Int. J. Environ. Res. Public Health 2020, 17, 5307. [Google Scholar] [CrossRef] [PubMed]
  40. Whitzman, C.; Legacy, C.; Andrew, C.; Shaw, M.; Klodawsky, F. Building Inclusive Cities: Women’s Safety and the Right to the City; Routledge: Abingdon, UK, 2013. [Google Scholar]
  41. Hanson, J. The Inclusive City: Delivering a More Accessible Urban Environment Through Inclusive Design. In Proceedings of the Cobra 2004: RICS International Construction Conference, Responding to Change, Headingley, UK, 7–8 September 2004. [Google Scholar]
  42. Mackett, R.L.; Achuthan, K.; Titheridge, H. AMELIA: A tool to make transport policies more socially inclusive. Transp. Policy 2008, 15, 372–378. [Google Scholar] [CrossRef]
  43. Morissens, A.; Sainsbury, D. Migrants’ social rights, ethnicity and welfare regimes. J. Soc. Policy 2005, 34, 637–660. [Google Scholar] [CrossRef]
  44. Serageldin, M. Inclusive Cities and Access to Land, Housing, and Services in Developing Countries. In Urban Development Series Knowledge Papers No. 22; World Bank: Washington, DC, USA, 2016. [Google Scholar]
  45. Hu, W.; Wang, R. Which Chinese cities are more inclusive and why? Cities 2019, 86, 51–61. [Google Scholar] [CrossRef]
  46. Alessandria, F. Inclusive city, strategies, experiences and guidelines. Procedia Soc. Behav. Sci. 2016, 223, 6–10. [Google Scholar] [CrossRef] [Green Version]
  47. Broadhead, J. Inclusive Cities Inclusive Practices for Newcomers at City Level and Examples of Innovation from Overseas. Background Paper for the First Meeting of the Inclusive Cities UK Working Group; University of Oxford: Oxford, UK, 2017. [Google Scholar]
  48. Liu, C.Y.; Hu, F.Z.; Jeong, J. Towards inclusive urban development? New knowledge/creative economy and wage inequality in major Chinese cities. Cities 2019, in press. [Google Scholar] [CrossRef]
  49. Ekins, P.; Simon, S.; Deutsch, L.; Folke, C.; De Groot, R. A framework for the practical application of the concepts of critical natural capital and strong sustainability. Ecol. Econ. 2003, 44, 165–185. [Google Scholar] [CrossRef] [Green Version]
  50. Naik, S.; Ramola, Michael, L. Manual for Undertaking National Urban Assessments; Asian Development Bank: Mandaluyong, Philippines, 2016. [Google Scholar]
  51. Singru, R.; NaikLindfield, M.R. Enabling Inclusive Cities: Tool Kit for Inclusive Urban Development; Asian Development Bank: Mandaluyong, Philippines, 2017. [Google Scholar]
  52. Niemeijer, D.; de Groot, R.S. Framing environmental indicators: Moving from causal chains to causal networks. Environ. Dev. Sustain. 2008, 10, 89–106. [Google Scholar] [CrossRef]
  53. Rauniyar, G.; Kanbur, R. Inclusive growth and inclusive development: A review and synthesis of Asian Development Bank literature. J. Asia Pac. Econ. 2010, 15, 455–469. [Google Scholar] [CrossRef]
  54. McDonald, J. Adaptive intelligent power systems: Active distribution networks. Energy Policy 2008, 36, 4346–4351. [Google Scholar] [CrossRef]
  55. Hebei Provincial People’s Government. Hebei Xiong’an New Area Plan Outline (2018). Available online: http://www.xiongan.gov.cn/2018-04/21/c_129855813.htm (accessed on 8 March 2020).
  56. Zhenyu, Y.; Xingxing, F.; Zengbo, B. Problems and prospective analysis of the urbanization of Xiong’an New Area. Dev. Res. 2018, 3, 40–43. (In Chinese) [Google Scholar]
  57. National Development and Reform Commission, PRC. 2018–2035 Master Plan for Xiong’an New Area. Available online: http://www.xiongan.gov.cn/2019-01/13/c_1210036983.htm (accessed on 8 April 2019).
  58. Xiaoliang, H.; Deting, Y.; Xiaohong, M. Research Report on Population Development in Beijing (2018); Social Science Academic Press (China): Beijing, China, 2018. [Google Scholar]
  59. Hebei Xiong’an New Area Management Committee. Ten Plans to Enhance Employment and Entrepreneurship in Xiong’an New Area. Available online: http://www.xiongan.gov.cn/2020-03/10/c_1210508732.htm (accessed on 5 April 2020).
  60. Inc Baidu. Big Data Report of Xiong’an New Area. Available online: http://www.xiongan.gov.cn/2020-01/13/c_1210437343.htm (accessed on 15 March 2020).
  61. Ge, Q.; Yang, L.; Jin, F.; Zhu, H. Carrying capacity of resource and environment of xiongan new area: Evaluation, regulation, and promotion. J. Remote Sens. 2017, 32, 1206–1215. [Google Scholar]
  62. Hebei Xiong’an New Area Management Committee. Cooperation Agreement for Health Care Development in Xiong’an New Area. Available online: http://www.gov.cn/xinwen/2018-09/14/content_5322042.htm (accessed on 10 April 2020).
  63. Liu, Z. Institution and inequality: The hukou system in China. J. Comp. Econ. 2005, 33, 133–157. [Google Scholar] [CrossRef]
  64. Huang, D.; Chan, R. On ‘land finance’ in urban China: Theory and practice. Habitat Int. 2018, 75, 96–104. [Google Scholar] [CrossRef]
  65. UNESCO. The United Nations World Water Development Report 4: Managing Water under Uncertainty and Risk; WWAP (World Water Assessment Programme): Paris, France, 2012. [Google Scholar]
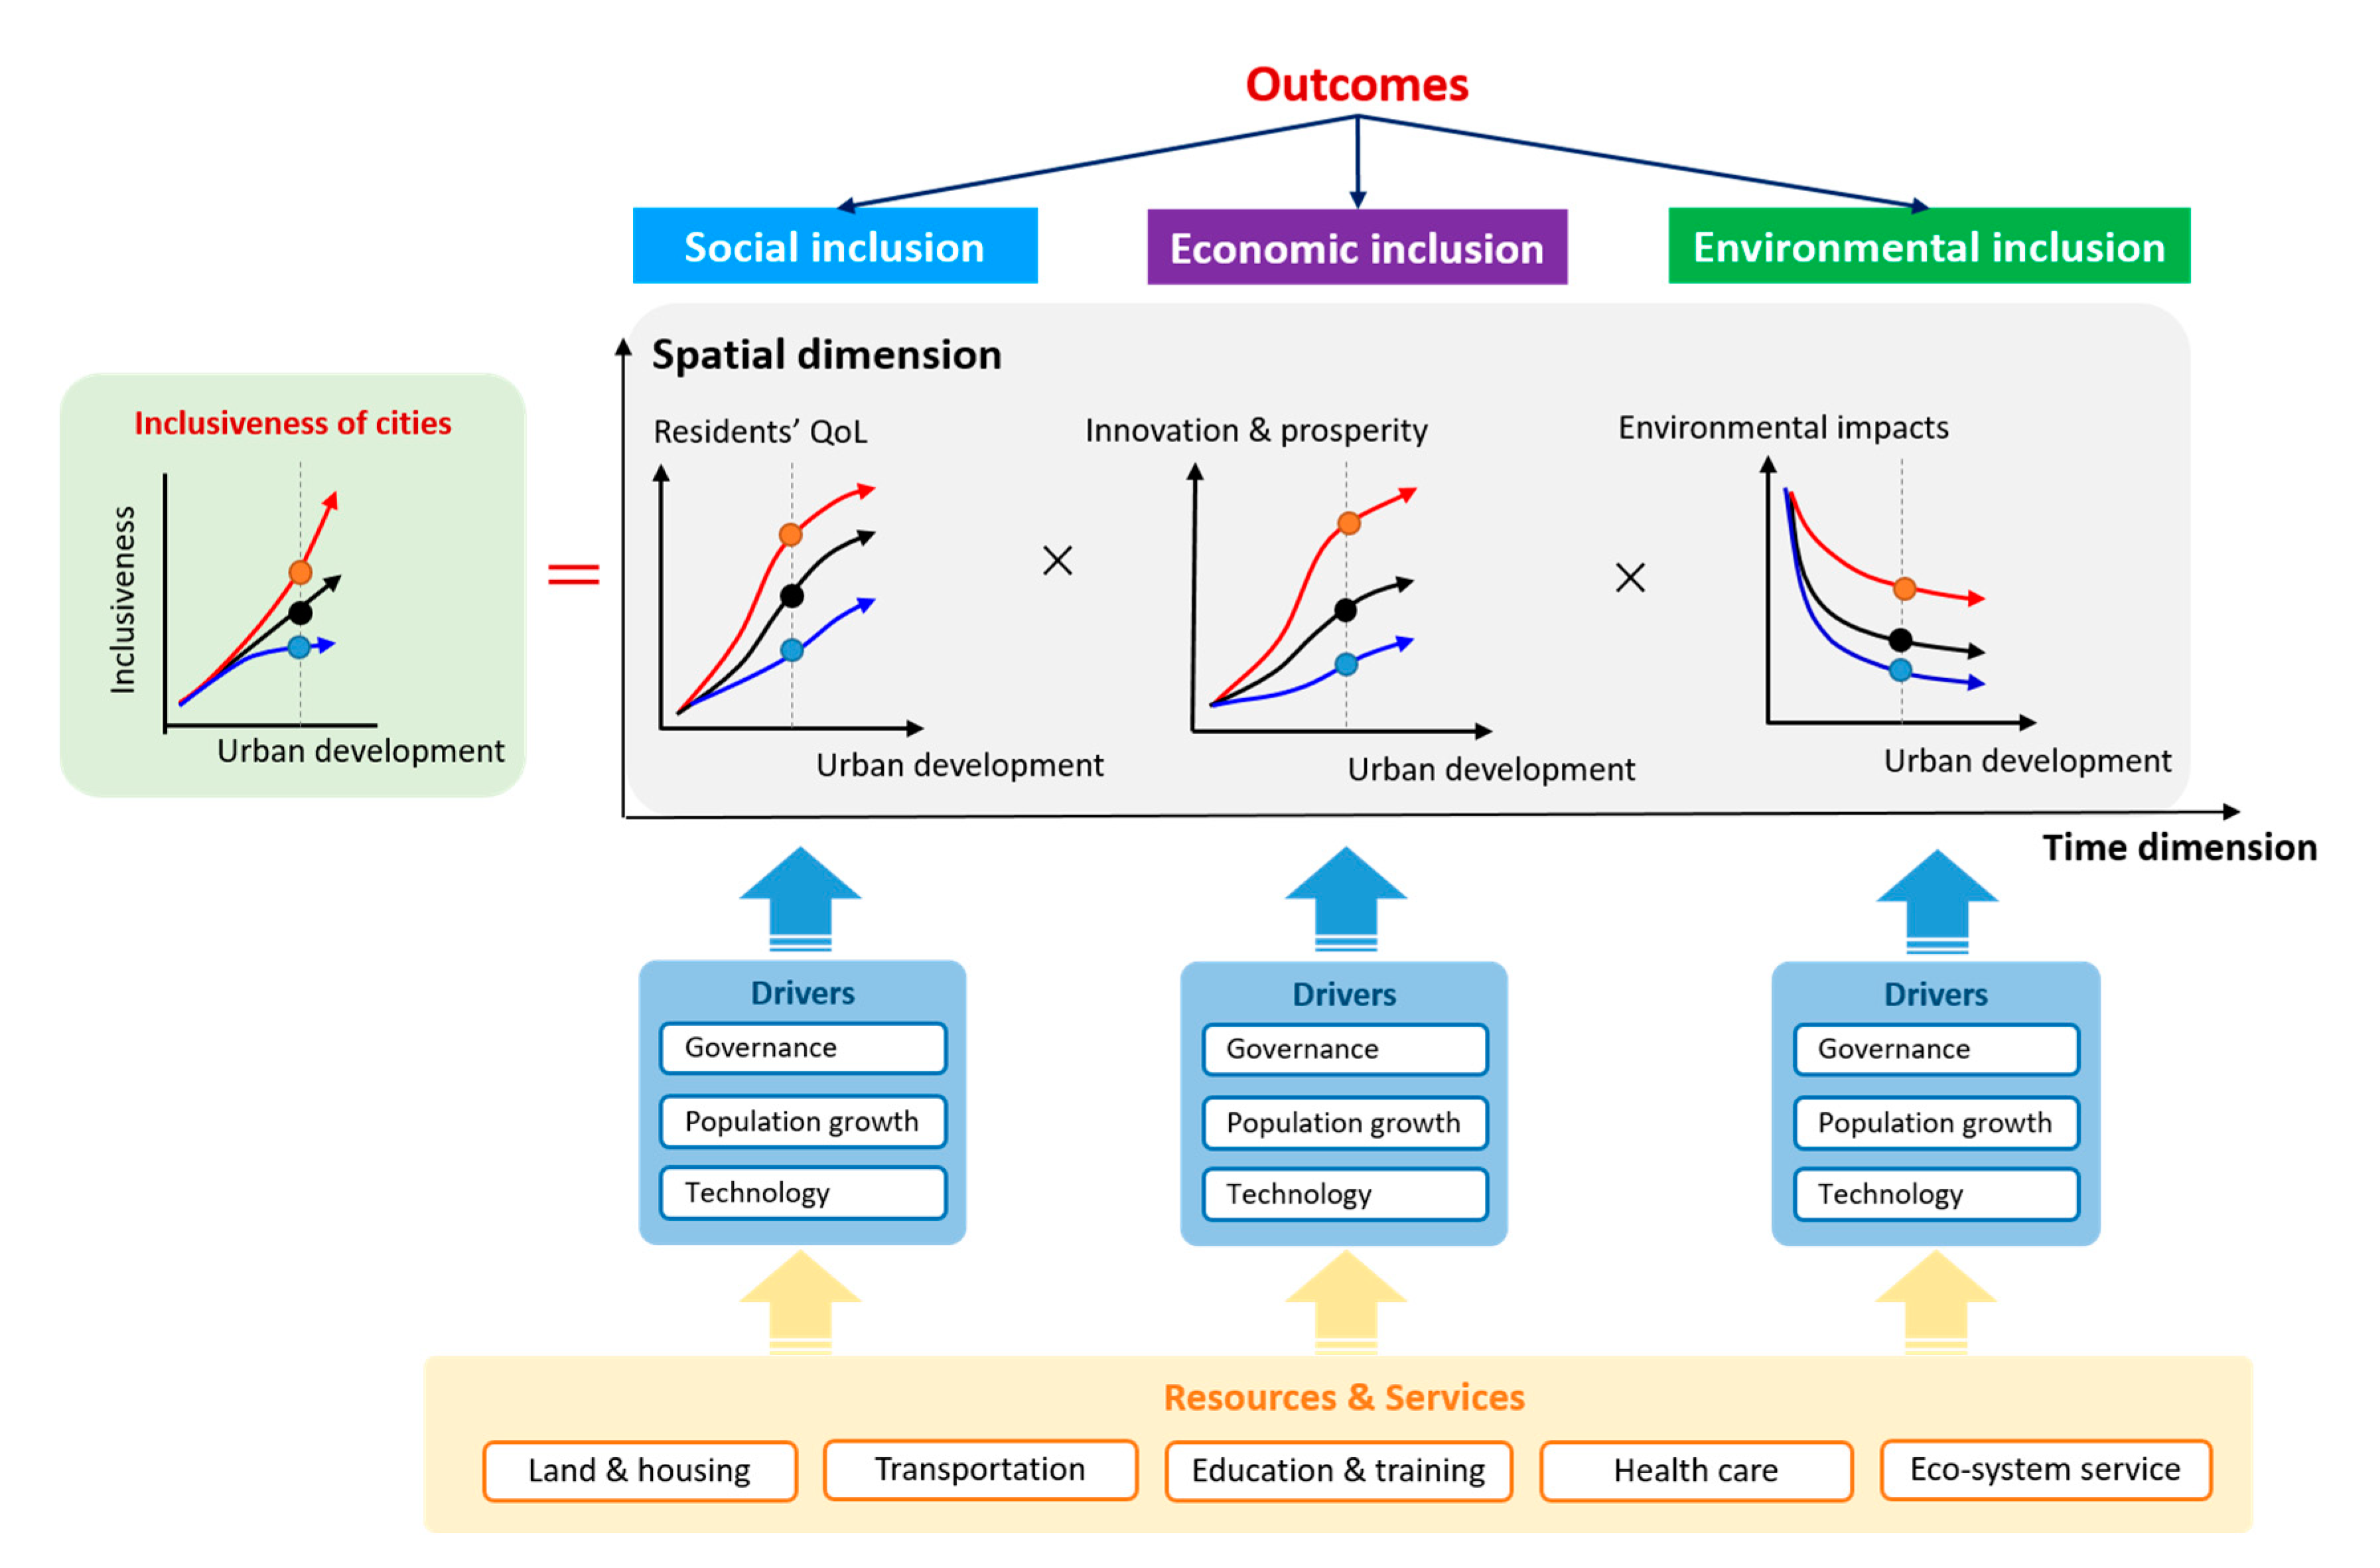
Figure 1. Resources and services, drivers, and outcomes of a city’s inclusive development, taken from the spatial dimension and time dimension (RSDO-ST) model.
Sustainability 12 06195 g001
Figure 2. Location of Xiong’an New Area.
Sustainability 12 06195 g002
Figure 3. Management organization of Xiong’an New Area.
Sustainability 12 06195 g003
Figure 4. Actions adopted in Xiong’an and their dependences under RSDO-ST model framework.
Sustainability 12 06195 g004
Figure 5. Four-phased development goals of Xiong’an New Area.
Sustainability 12 06195 g005
Figure 6. The causal network of Xiong’an’s inclusive development.
Sustainability 12 06195 g006
Figure 7. Regional railway planning of Xiong’an.
Sustainability 12 06195 g007
Figure 8. High-speed railway station distribution in Xiong’an New Area.
Sustainability 12 06195 g008
Figure 9. Comparison of the water area (blue area) of Baiyangdian. (a) June 2017; (b) June 2019.
Sustainability 12 06195 g009
Figure 10. Progress of the “Millennium Forest” project in Daqinghe (green represents the area covered by vegetation, yellow is the land area, and red is the water area). (a) June 2017; (b) June 2019.
Sustainability 12 06195 g010
Table 1. The sources of various types of data.
Type of DataInitial State before the Establishment of Xiong’anPolicies, Measures and Projects Implemented during the Past Three YearsUp-to-Date Progress
Land and housingLiterature review [56]Hebei Xiong’an New Area Plan Outline [55]Interviews with government officials conducted by mainstream Chinese media, including Xinhuanet and Chinanews
Transportation infrastructureXiong’an’s official websiteHebei Xiong’an New Area Plan Outline [55]Xiong’an’s official website
Demographic and educationBlue Book of Population in Beijing (2018) [58]Ten Plans to Enhance Employment and Entrepreneurship in Xiong’an New Area [59]Big Data Report of Xiong’an New Area [60]
Ecological servicesLiterature review [61]2018–2035 Master Plan for Xiong’an New Area [57]Big Data Report of Xiong’an New Area [60]