Article

Wake Region Estimates of Artificial Reefs in Vietnam: Effects of Tropical Seawater Temperatures and Seasonal Water Flow Variation

Department of Ocean Engineering, Pukyong National University, Busan 48513, Korea
*
Author to whom correspondence should be addressed.
Sustainability 2020, 12(15), 6191; https://doi.org/10.3390/su12156191
Submission received: 6 July 2020 / Revised: 29 July 2020 / Accepted: 30 July 2020 / Published: 31 July 2020
(This article belongs to the Section Sustainable Engineering and Science)

Abstract

:
From the perspective of saving energy of marine species and creating feeding areas, the wake volume of an artificial reef (AR) should be considered as a parameter in any wake region estimation. Wake regions of AR modules (reef ball, cylinder reef, and cube reef) and sets were numerically estimated considering tropical seawater temperatures and water flow variation in Vietnamese coastal waters. In addition, we considered an efficiency index (i.e., total wake volume per reef volume) and wake volume diagram (i.e., wake volume dependency on water flow direction) to characterize wake volumes. From the results, first, it was found that the effect of temperature on the wake volumes was minor in comparison with the effect of flow direction. It was also found that the optimum installation angles were 30° (reef ball and its set), 30° (cylinder reef and its set), and 0° (cube and its set) along the major flow direction. Second, it was found that the cylinder reef and its set were attractive because they generated the maximum wake volumes, regardless of seawater temperature. Thus, the module and set showed better average efficiency indices (9.28 for module and 6.81 for set) than the other cases. We found that the wake volume was dominant in the efficiency index and, accordingly, wake volume diagrams are sufficient to indicate the dependence on flow direction.

1. Introduction

Artificial reefs (ARs) are manmade underwater structures designed to mimic natural reefs for the protection and/or production of marine resources [1,2,3,4]. They have been deployed in various water conditions with specified purposes [5], and accordingly, their roles vary, such as enhancing fishing grounds (e.g., production of biomass [6,7]), conserving marine resources (e.g., anti-trawling and anti-illegal marine mining [2,8]), restoring coral reefs (e.g., seaweed substrates [9,10]), protecting from coastal erosion (e.g., erosion control and dissipation of wave energy [2,11,12]), developing recreational spaces (e.g., diving and surfing sites [13,14,15]), and advancing marine tourism (e.g., sightseeing [16]).
One of the investigations required is of the basic flow field within and around ARs, which is responsible for many of the beneficial ecological effects. For example, wake regions around ARs represent the major flow field characteristics, which can attract certain marine species by providing shelter, feeding and spawning grounds, rest areas, and temporary stopovers [17,18]. Thus, for AR design, it is important to determine the velocity intensity as well as the size of the wake region, which can be quantitatively measured in terms of wake volume, as initially proposed by Kim et al. [19] and extended by others [7,20,21,22]. Additionally, local ARs can promote an upwelling region, that is, a nutrient-enriched water column [23]. Yanagi and Nakajima [24] reported that zooplankton populations in the surface layer increased twofold upon installing an artificial reef (width: 45 m, height: 10 m). Kim and Shimasaki [25] discovered vertical flows originating from a deployed AR (width: 42 m, length: 112 m, height: 16–20 m). These findings highlight the significance of water flows around ARs and their characteristic measures (e.g., wake volume).
Vietnam (Việt Nam), a peninsular country in Southeast Asia, has a coastline 3260-km long, and its Exclusive Economic Zone covers more than one million km2 [26]. In Vietnam, ARs have been strongly encouraged by the Research Institute for Marine Fisheries (RIMF) for the last 15 years, which concentrated on coral growing on hard substrates (e.g., concrete ARs) in Binh Dinh Province [27,28], Quang Nam Province [29], and Cat Ba Island [30]. Nha Trang University implemented the installation of ARs in Ninh Thuan Province to protect, recover, and develop fisheries resources, using 200 cylinder reefs and 100 cube reefs [31].
However, research on and the application of ARs for marine fisheries in Vietnam are still limited because the previous projects focused primarily on the restoration of coral reef ecosystems over a short time and on a small scale [32]. Consequently, it is important to characterize the materials, types, and water flow interactions with ARs. Currently, the ARs in Vietnam are reef balls, cylinder reefs, and cube reefs, which have been installed in several places (e.g., Ninh Thuan Province) in which game fishing and tourist boats threaten endangered marine species, mangroves, and seagrass beds [32]. The ARs may help recovery from the environmental damage; however, a broad scientific investigation on the use of ARs is important to make the best use of them along the long coastline.
Vietnam is under the influence of a tropical monsoon regime, and the resulting physical changes to the sea environment are complex. Thus, water temperature and salinity vary according to season and location. For example, the medium sea surface temperature is usually 26 °C, ranging from 24 to 29 °C [33]. Owing to the complexity of terrain conditions and tidal effect, sea currents also show many changes, and the flow field is characterized by not only complicated directional but also seasonal variation. Thus, there is a need to investigate systematically environmental conditions and their interactions with Vietnam’s ARs and to pinpoint areas of demand in the research and development of ARs.
Because the wake region facilitates energy-saving zones for marine species and the deposition of sediments, nutrients, and bio deposits, the wake length or wake area was used as a quantitative measure of a wake region in previous studies (e.g., [34,35]). However, these measures are inadequate to capture all the features of a wake region, primarily due to their dependence on a reference plane [19,36]. In addition, although some studies used the wake volume as a quantitative measure, their studies were limited in AR modules [19], water flow dependency of an AR module [20,36,37], performance indices [18,21], and/or intensively stacked placement models [23]. In this study, we extended the wake volume concept to not only a flatly distributed placement model (AR set) of multiple AR modules but also the associated index (wake volume efficiency index) and diagram, considering tropical seawater temperature and seasonal water flow variation in Vietnam. In other words, according to current practices in Vietnam and the significance of water flows around ARs, we investigated reef balls, cylinder reefs, and cube reefs, the most common Vietnamese ARs, and their wake regions, considering tropical seawater temperatures and seasonal water flow variations. For the wake region estimation, first, wake volume measurements were made to represent the wake region estimation quantitatively in one figure by an element-based finite volume method (EbFVM). The wake volume was used to represent the wake region, referring to a counter flow region inside or behind the AR, induced by a vortex. Moreover, a 5 × 5 flatly distributed placement model (FDPM) of each AR set was constructed to determine its wake volume. Here, the FDPM indicates an AR placement model constructed by distributing ARs on a two-dimensional flat plane with even or uneven spacing. There are two other placement models, the “intensively staked placement model” (ISPM) and the “flatly concentrated placement model” (FCPM) [20,23,38]. However, we only considered the FDPM because of current AR practices in Vietnam. Second, tropical water temperatures (24, 29 °C) and water flow directions (0°, 15°, 30°, 45°) were considered to assess their effects on wake volumes. The maximum angle of 45° was selected due to the geometric symmetry of the target ARs. Finally, a so-called “wake volume diagram” was developed to represent the dependence [20,36] of wake volume on the flow directions for each AR. Additionally, the wake volume efficiency index and its diagram are discussed.

2. Materials and Methods

2.1. Target ARs and Environmental Conditions

The target ARs are a concrete reef ball (AR1), cylinder reef (AR2), and cube reef (AR3), as shown in Figure 1. Because relatively simple geometric structures, such as holes and voids, are sufficient to attract tremendous resources, these ARs have been built and tested in Ninh Thuan waters and have achieved good results in protecting fish stock [31]. The reef ball (AR1; Figure 1a) is an AR designed to restore ailing coral reefs and to create new fishing and scuba diving sites [39]. The AR1 is made in many sizes to mimic a natural reef. In this study, the geometric dimensions of the AR1 were based on the work of Nguyen et al. [40]: 1.0 m (diameter) × 0.8 m (height) × 0.08 m (thickness). The AR1 has 14 holes (diameter, 0.12 m) on the surface. The cylinder reef (AR2; Figure 1b) has dimensions of 1.0 m (diameter) × 1.0 (height) × 0.08 m (thickness) [40,41]. It has 24 holes (diameter, 0.15 m) on the surface. The cube reef (AR3; Figure 1c) has dimensions of 1.0 m (length) × 1.0 (width) × 1.0 m (height) [31,41]. It has a large void on each surface. These cylinder and cube reefs have been installed to protect fish stocks [32]. The geometric surface areas and volumes of the AR modules are provided in Table 1.
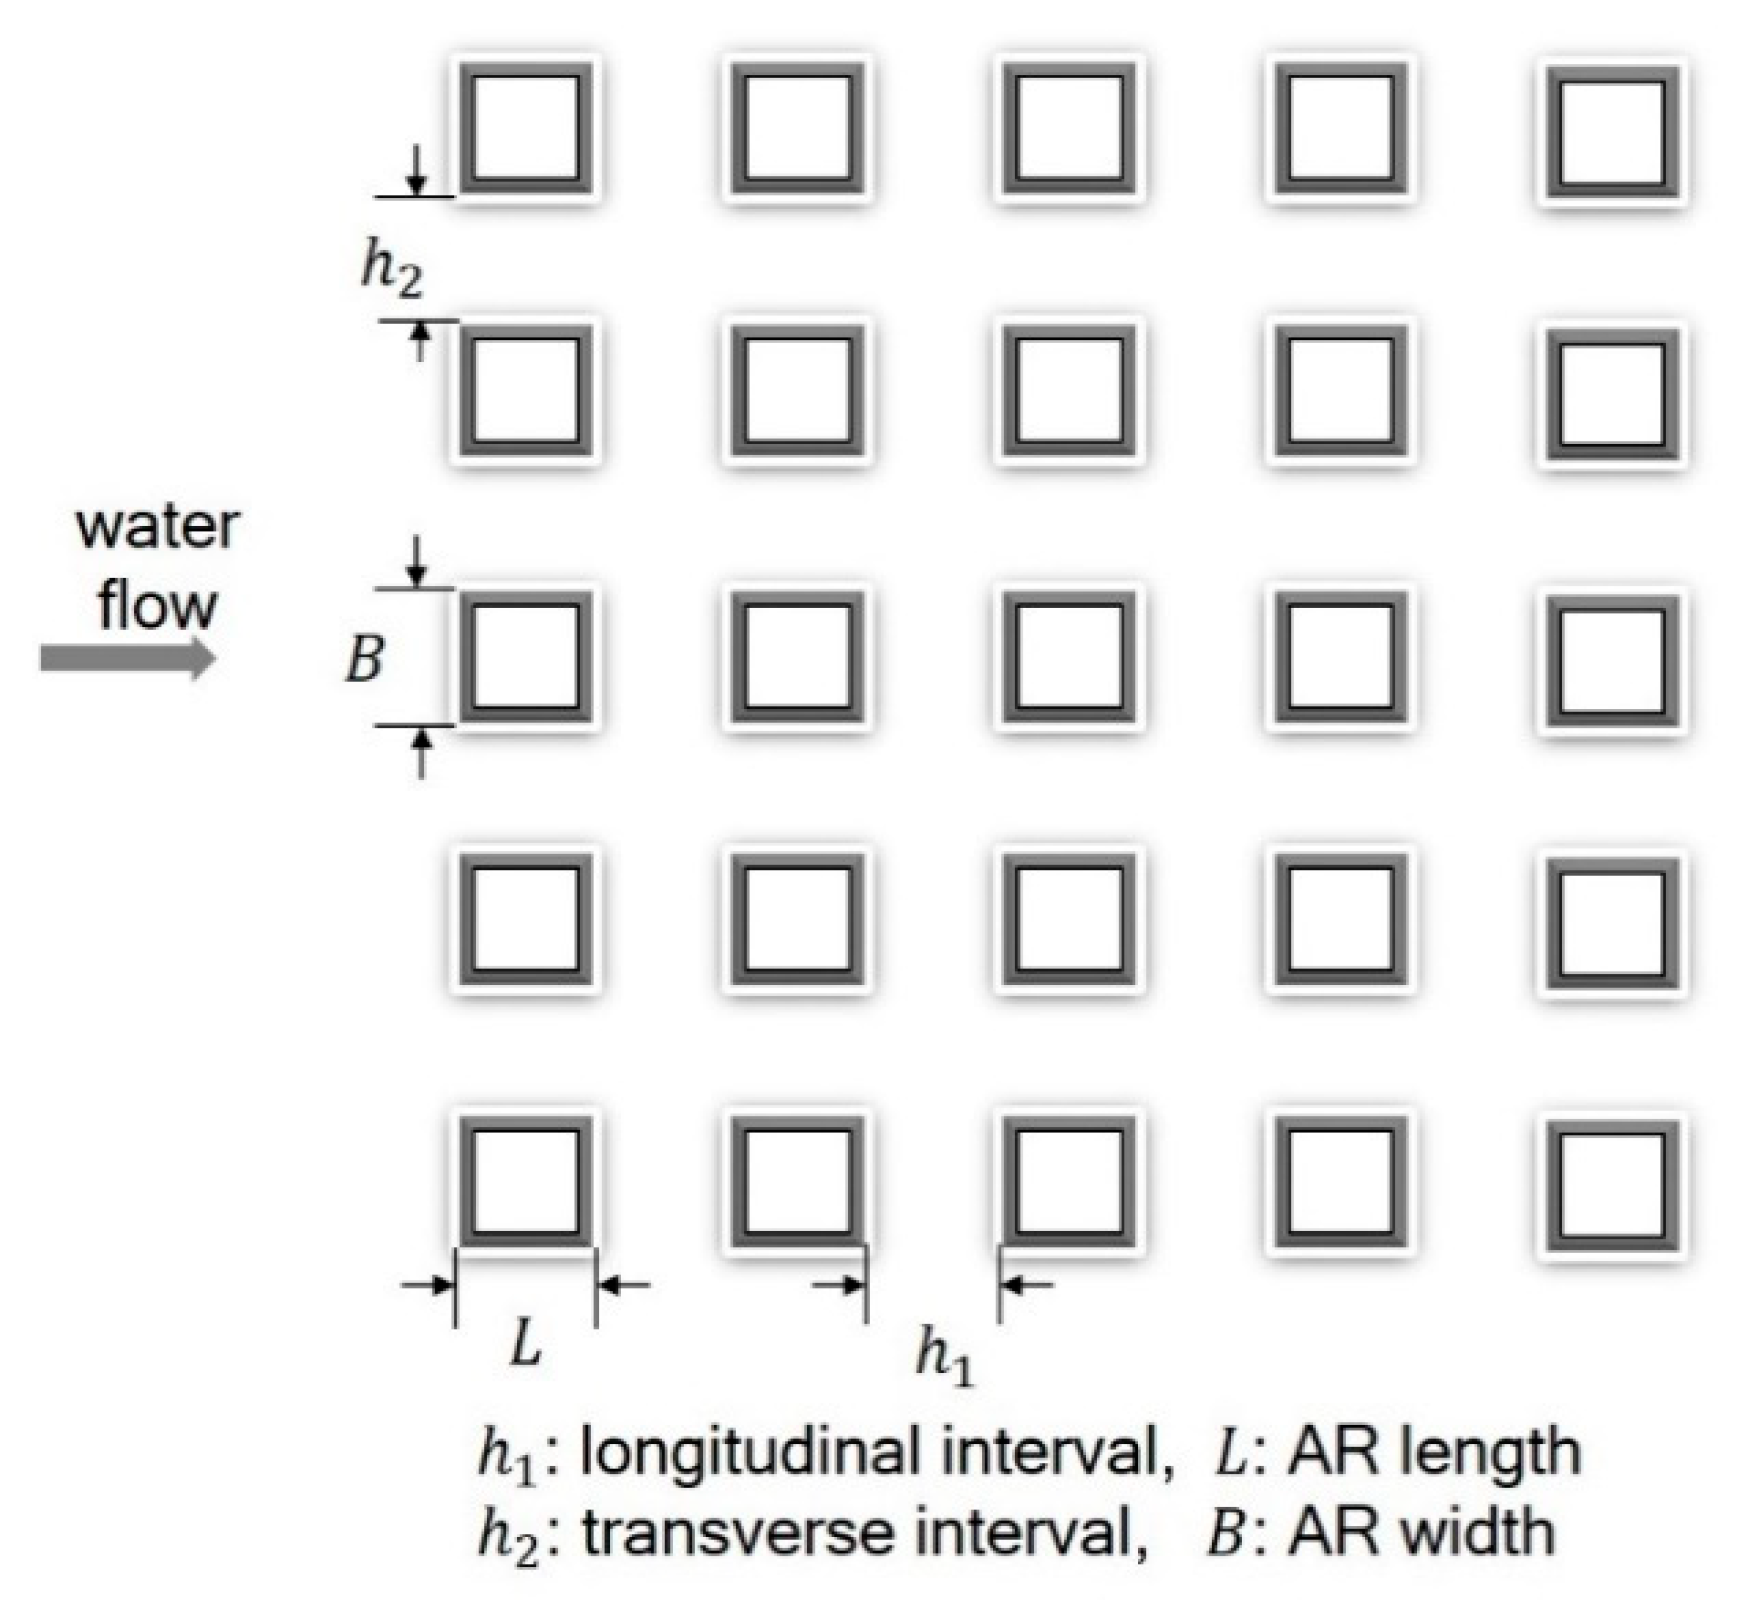
The three target AR sets were constructed as 5 × 5 FDPMs using 25 AR1s (reef balls), AR2s (cylinder reefs), and AR3s (cube reefs), as illustrated in Figure 2. These models are similar to ARs installed in the coastal waters of Ninh Thuan [31] and being installed in the coastal waters of Nha Trang. The distances between the reefs are all fixed, with h 1 = h 2 = 1.5 m for the longitudinal interval ( h 1 ) and the transverse interval ( h 2 ) normal to the water flow direction (Figure 2).
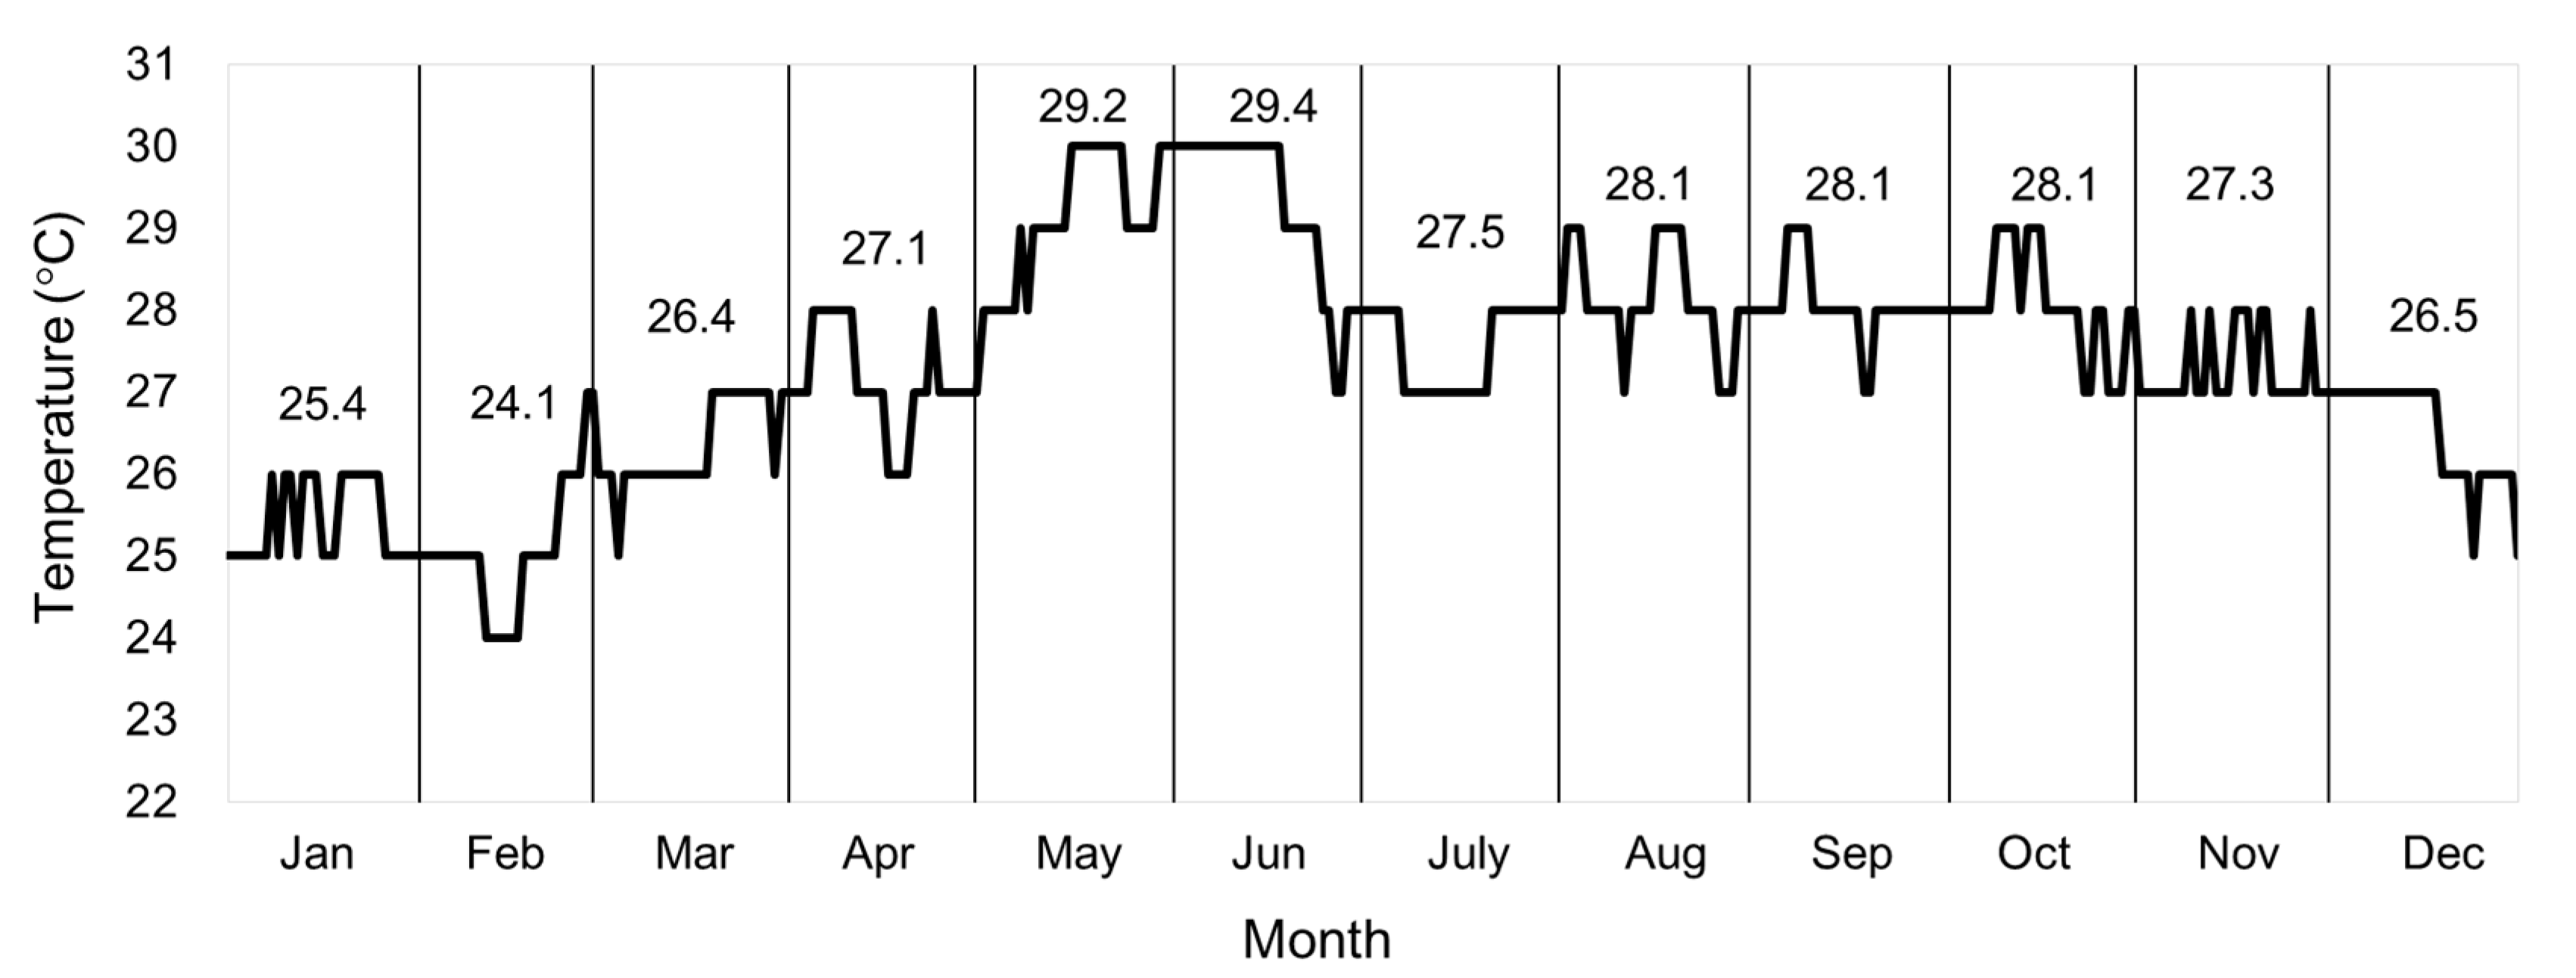
Nha Trang Bay, the target site, is an area included in the regional economic development strategy of Vietnam because of its natural conditions, transportation industry, fishing sites, and tourism. Considering the tropical monsoon climate, a relatively small variation in temperatures and large fluctuation in sea currents occur. The annual average temperature is 26 °C, and it ranges between 24 and 29 °C [33], as shown in Figure 3. Current ARs are located on the seabed, 15-m deep. Thus, the seawater temperature values are also based on this depth, following results measured using a profiling reflectance radiometer system (PRR-2600) from the Vietnamese Oceanographic Institute. To simplify calculations, seawater temperatures of 24 and 29 °C were considered. The salinity of 3.5%, recorded at a depth of 5 m of Nha Trang Bay [43], was also considered.
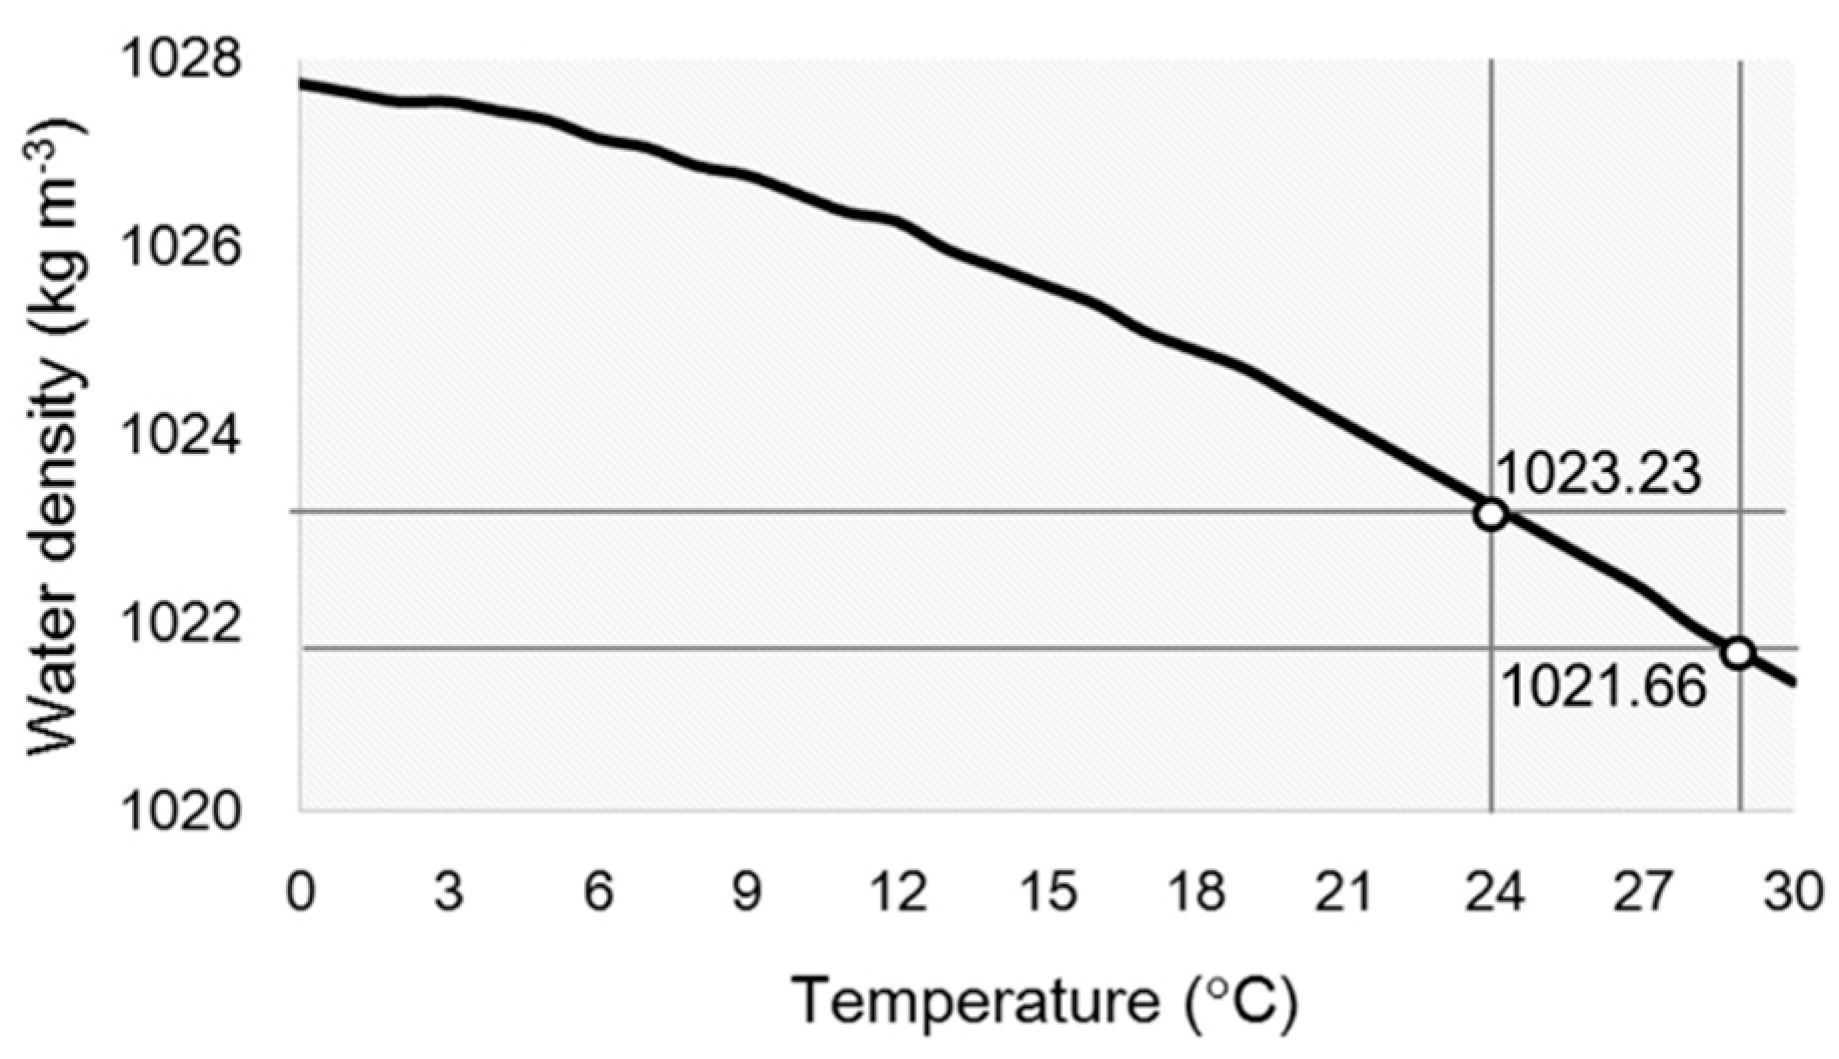
As the temperature increases, the space between water molecules increases, thus the density decreases. Because of water temperature variation, combinations of water temperature and density were considered. If the seawater temperatures are 24 and 29 °C [33], then the corresponding water densities are 1023.23 kg m−3 and 1021.66 kg m−3, respectively [44]. Figure 4 shows the density profile with temperature. Beyond the change in seawater temperature, the impact of changing flow direction (0°, 15°, 30°, 45°) was also considered to estimate the effect on wake volume. In contrast, the water flow velocity was fixed at 1 m s−1 primarily because the variation of water velocities (e.g., 0.5 to 8 m s−1) does not greatly affect wake volume size, according to Kim et al. [19] and Jung et al. [42].

2.2. Numerical Method

Computational fluid dynamics (CFD) is commonly used in engineering to address fluid dynamics problems. In this study, the numerical simulation analysis of flow fields around ARs was performed using the commercial ANSYS-CFX code with a segregated implicit EbFVM (Element-based Finite Volume Method) solver that features a standard k-ε turbulent model. The EbFVM has been effective in various engineering application such as airplanes, underwater pipelines, and artificial reefs (e.g., [19,34,35,45]) because it allows powerful mesh generation and wake volume adaptation. The method discretizes the analysis domain into sub-regions, and the governing equation is converted into algebraic equations and then iteratively applied to find a solution [46]. Thus, the value of each variable at nodal points over the domain is determined approximately. The first step involves discretizing the spatial domain using a mesh to construct finite volumes and, consequently, to conserve relevant quantities, such as mass, momentum, and energy.
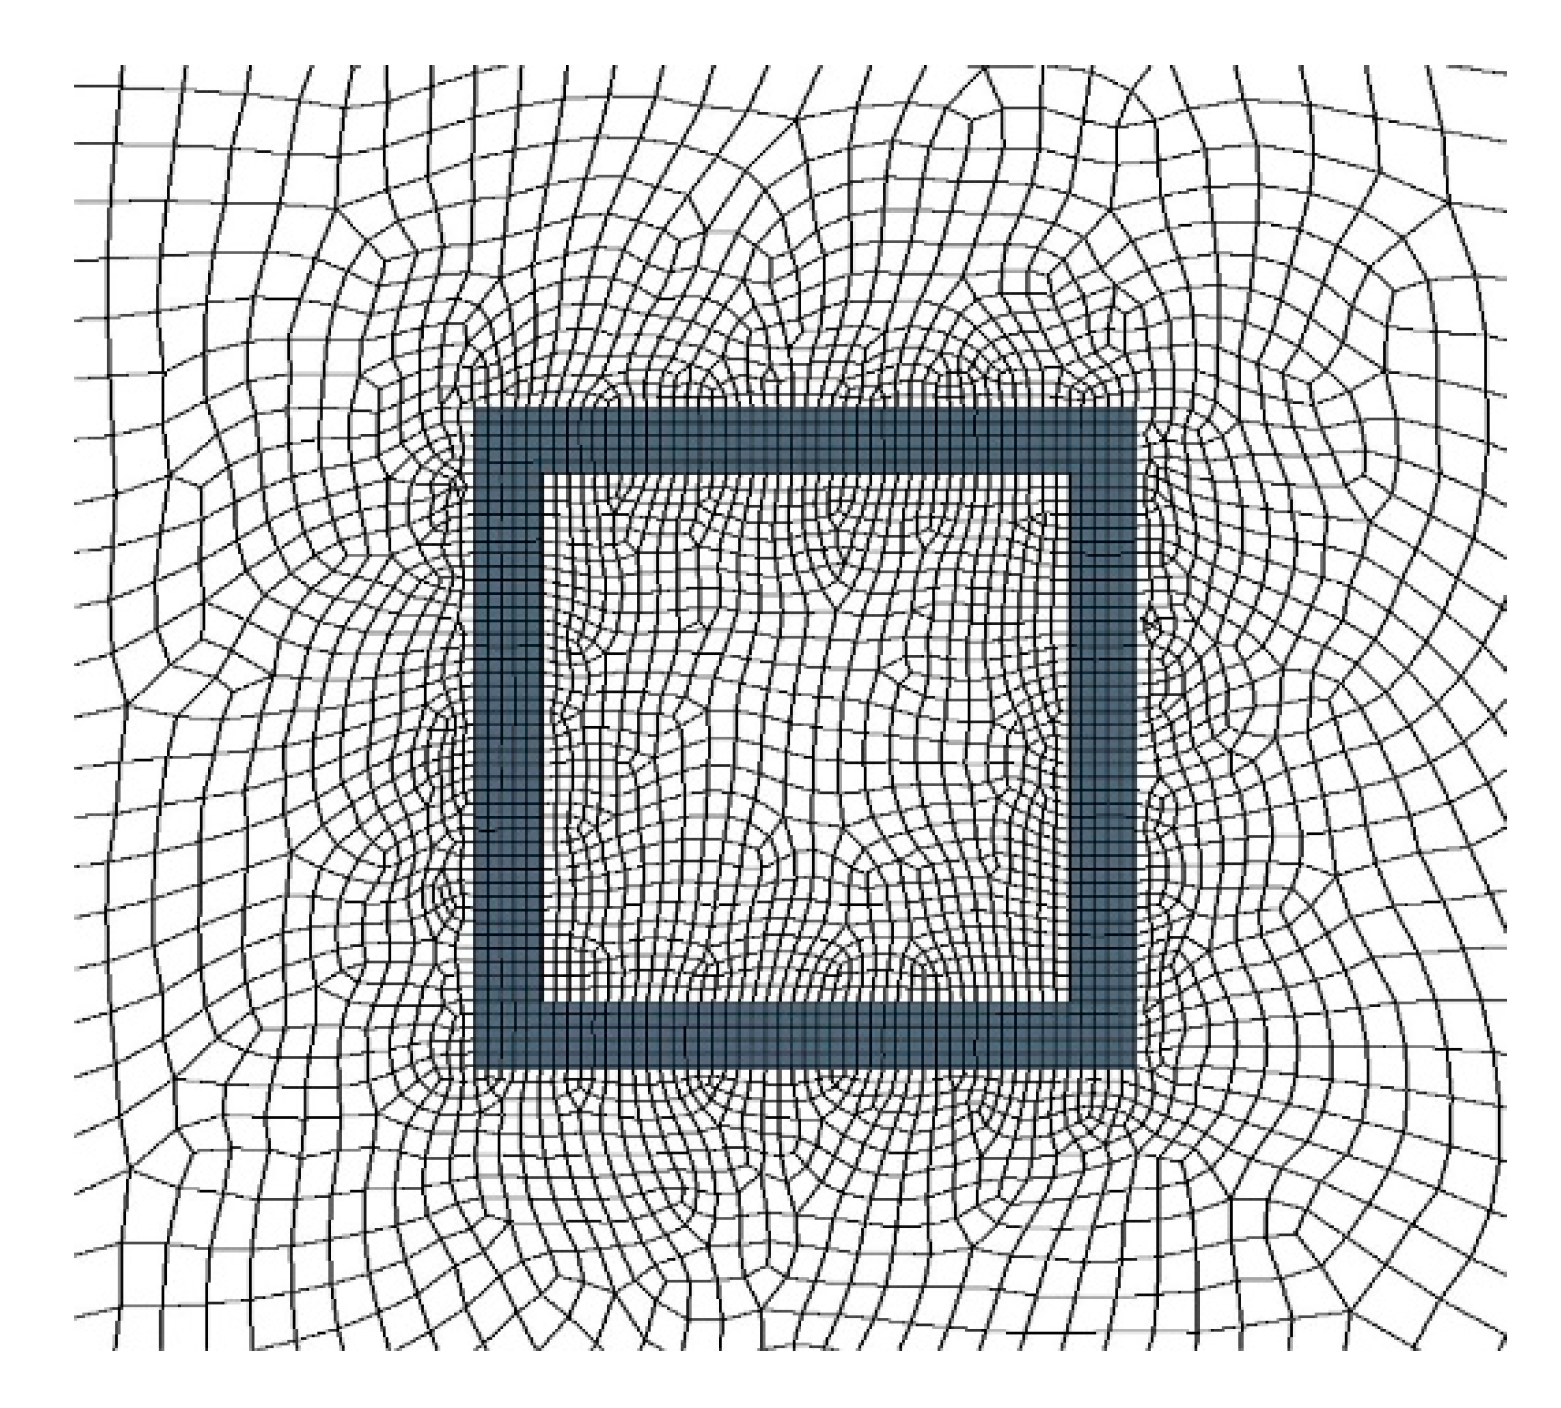
Regarding the numerical calculation for the ARs, this study used the Reynolds-averaged Navier–Stokes (RANS) equation. Thus, it was necessary to add a model for turbulence. Here, a two-equation method was chosen to resolve the ensemble average flow and to model the effects of turbulent eddies. In these equations, various instantaneous physical parameters are replaced by the time-averaged flow. In the numerical models, hexahedrons were mainly used as the element type, and the maximum element size near the ARs was limited to 10 or 20 mm, depending on the element location, and sequentially increased to 200 mm, in regions far from the module (e.g., see Figure 5).
Several appropriate assumptions were introduced to decrease the complexity of the numerical calculations for the three-dimensional turbulent flow fields around ARs as follows: (1) water was considered an incompressible, viscous, and Newtonian fluid; (2) isothermal flows existed in the water, regardless of heat exchange; (3) the water surface was modelled with zero shear force and the same speed as the incoming fluid (1 m s−1); and (4) the flow was in a steady state. The dynamic viscosity used was 8.899 × 10⁻⁴ kg m−1 s−1. As mentioned above, the seawater temperatures were 24 and 29 °C, and the relevant water densities were 1023.23 kg m−3 and 1021.66 kg m−3, respectively. The use of CFD in fluid flow simulations has increasingly been considered a reliable method recently. We used this approach to simulate the reef flow field under changes in seawater temperatures and flow direction.

2.3. Flow Domains and Boundary Conditions

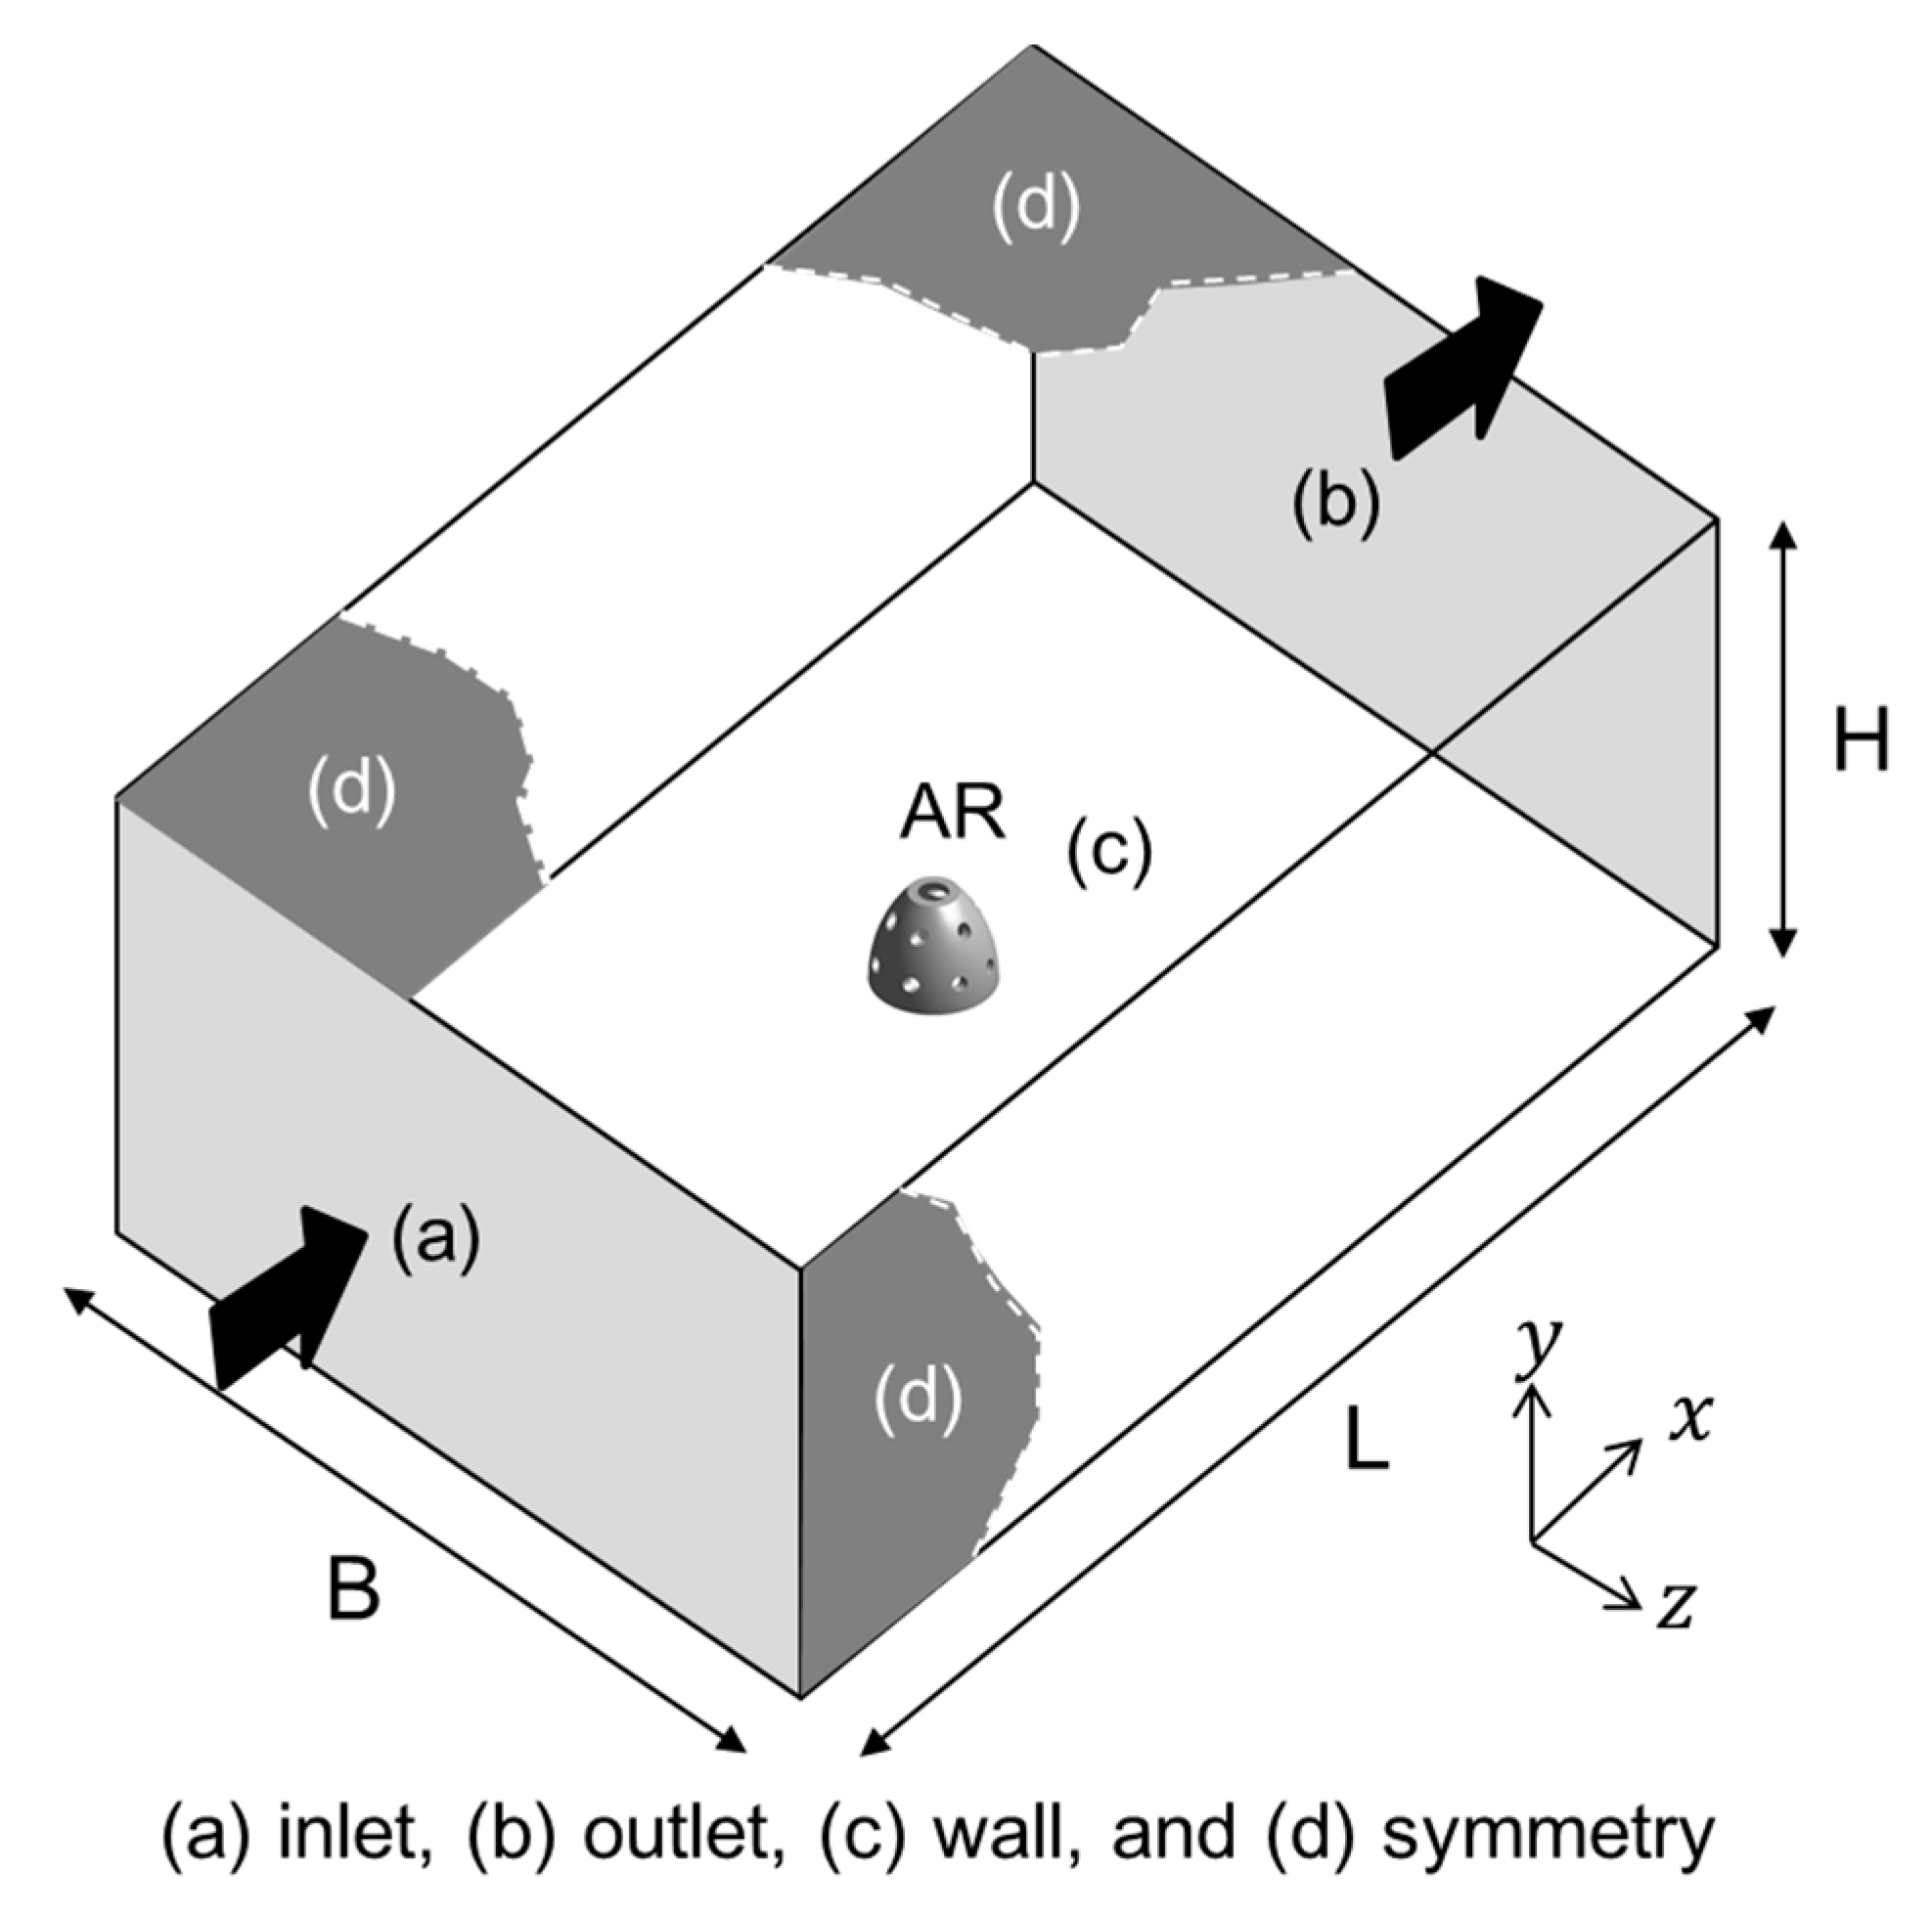
For the setting of boundary conditions (BCs) of the computational domain enclosing the ARs, the specifications of the related BCs and the geometry of the ARs are shown in Figure 6. To reduce the usage of grid points and the analysis time process, the dimensions of the domain size were based on geometric dimensions of the target reefs. Specifically, flow domains (L = 10 m, B = 10 m, and H = 5 m) were established for AR2 and AR3 and (L = 55 m, B = 55 m, and H = 5 m) for the AR2 set and AR3 set. Because of the differing geometric dimensions, the flow domains of the AR1 module and set have the same L and B variation as the previous two cases, except for the height (4 m) of the flow domain. The detailed boundary conditions were as follows: (1) the inlet velocity was 1 m s−1 (a general Vietnam flow speed), constituted stably at the left face (Figure 6a) of the computation domain; (2) the outlet was specified at the right face (Figure 6b) by assigning a zero-pressure gradient; (3) the non-slip boundary condition was enforced at the wall bottom (Figure 6c), meaning that the normal and tangential velocities were all zero at the wall; (4) symmetric BCs at the two sides and the top face (Figure 6d) were used to reduce the effect of the limited dimensions on flow analyses; and (5) smooth walls were assumed on the ARs to accommodate the viscous flow field calculation. The flow velocity at the bottom cannot be dismissed if the corresponding control volume, including the node at the bottom, is used to extract the average velocity (i.e., the “conservative method” [7,47]). We used the conservative method to obtain the bottom flow velocities.

2.4. Wake Region

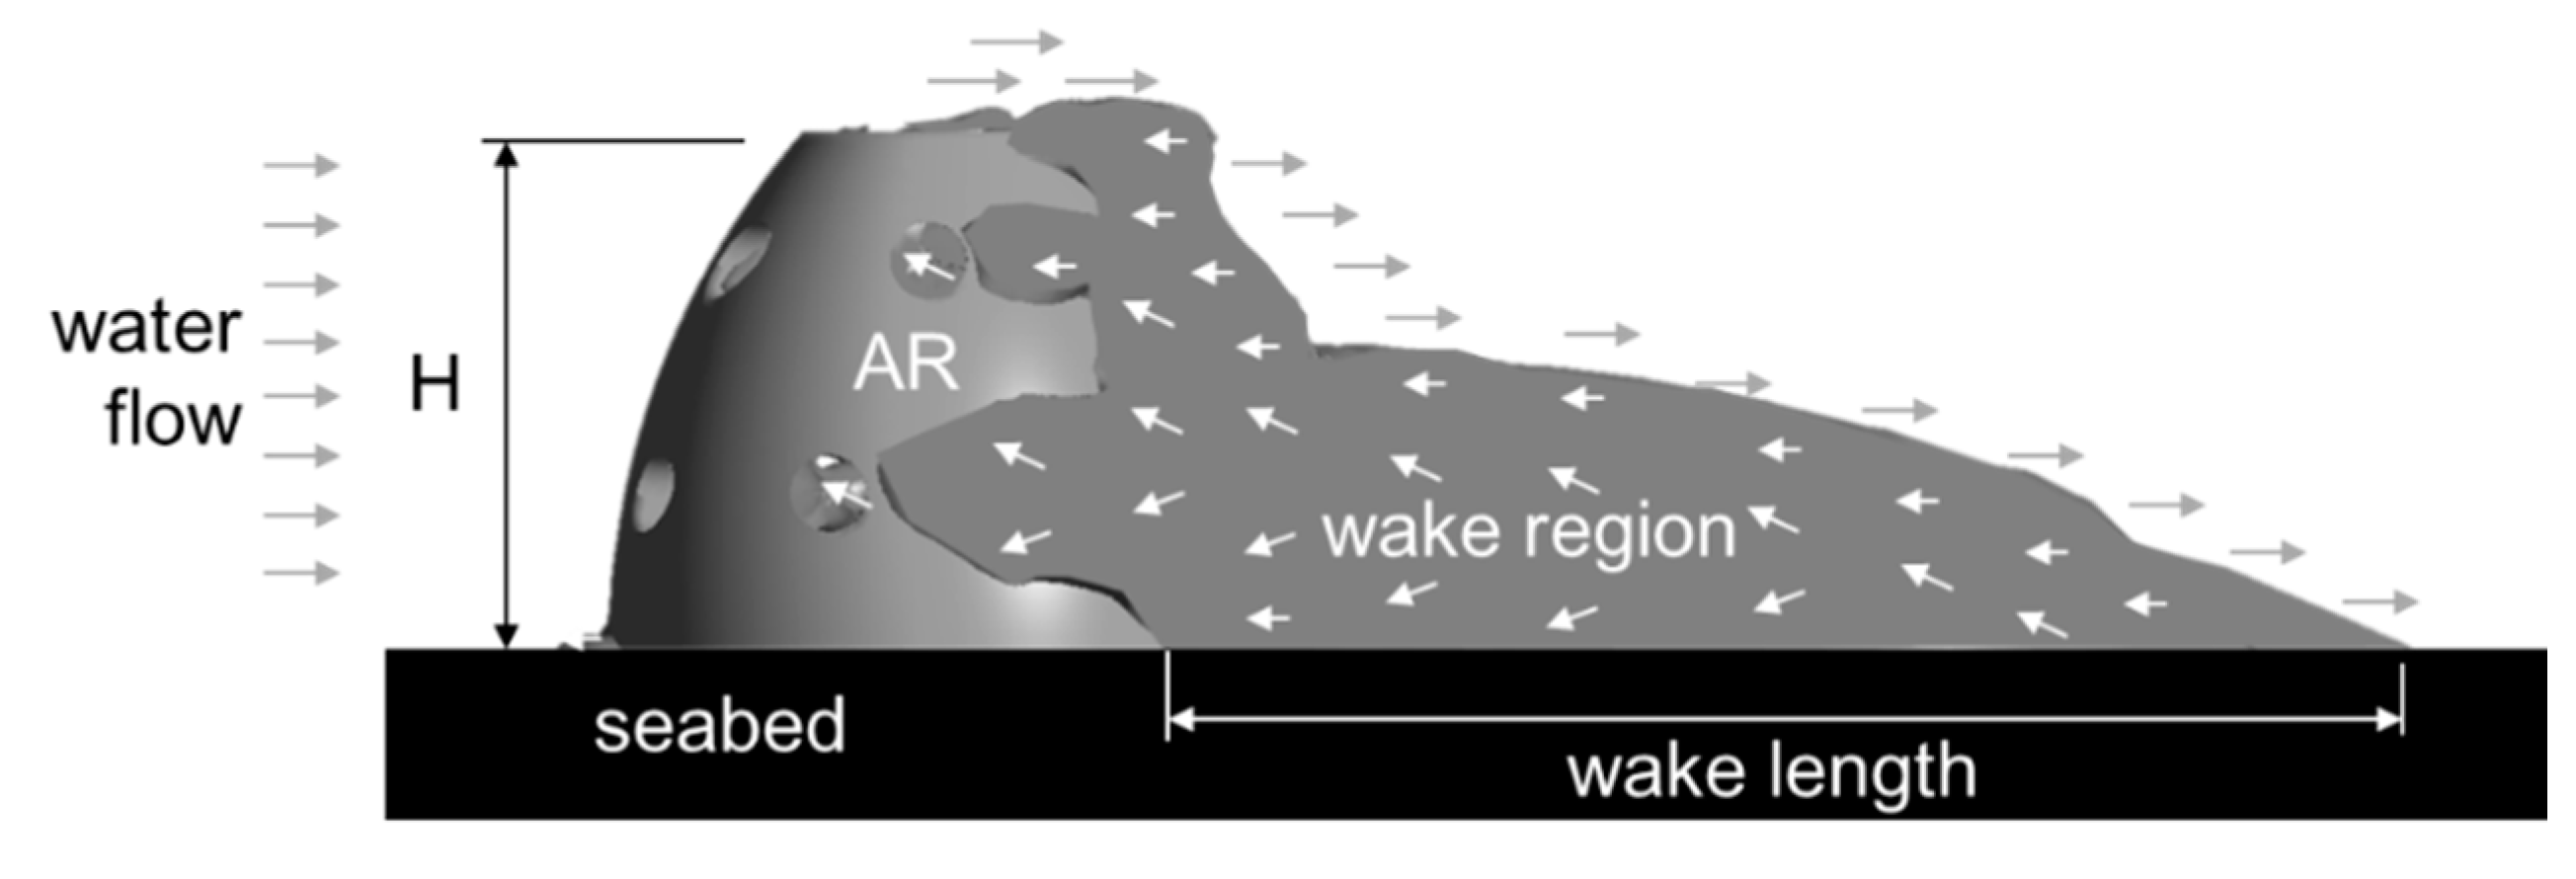
It is known that the wake region is a sheltering and feeding ground for fish [34]. Deployment of ARs can change flow fields and create a space of recirculating flows behind ARs. This zone is defined as shown in Figure 7. Wake regions can recruit marine species, such as plankton, which are important food sources for many fish [48]; thus, it is important not only to improve the wake zone or extend its size but also to examine its efficiency [7].
Wake regions have been characterized in terms of wake length (WL) [49], wake area (WA) [34], and flow velocity profile in a certain plane [50,51,52,53]. However, the determination of WL and WA depends on how the wake plane was chosen and, accordingly, these measures cannot account for a wake region with one figure. Thus, Kim et al. [19] proposed the concept of wake volume (WV) based on the EbFVM, which is a more quantitative measure for wake region estimation. EbFVM was used in this study. The procedure to obtain wake volume is as follows. First, an element is regarded as a finite wake volume if the water flows at the associated nodes are all recirculating water flows. Then, the total wake volume of the AR is obtained by collecting the finite wake volumes (or elements) that satisfy the criterion.
The wake region of an AR is dependent on flow direction. This dependence should be characterized by examining all AR volumes, considering major flow directions; thus, it becomes a time-consuming process. However, it is not necessary to consider all directions because the geometric symmetry of an AR can be taken into account. Kim et al. [36] showed that most ARs are symmetrical with respect to 45° or 90° and consequently the wake volume values repeat every 45° or 90°. This dependence of wake volume on flow direction can be illustrated graphically in one figure, the so-called “wake volume diagram” [36], which was also adopted in this study.

2.5. Efficiency Index

Kim et al. [7] proposed efficiency, tranquility, and stability indices to evaluate performance in the AR wake region. Among these three, the efficiency index ( I e ) is directly related to the size of a wake region because the index estimates the total wake volume ( V w ) per reef volume ( V A R ). Here, the reef volume is not the apparent volume, but the actual volume, which is related to the material used and, accordingly, the fabrication cost. Combining the efficiency index with the wake volume diagram, Kim et al. [37] proposed the so-called “efficiency index diagram,” illustrating the variation in efficiency index with respect to flow direction. This diagram has a similar pattern to the corresponding wake volume diagram because it considers the constant geometric volume (Table 1) of each module or set. Thus, it is not necessary to draw the efficiency index diagram once the wake volume diagram is characterized. However, the efficiency index values are valuable in discussing the efficiency of each reef module or set. To obtain those indices, we considered the reef volumes in Table 1. The total reef volume for each AR set was obtained by multiplying 25 (i.e., 5 × 5) by the volume of the corresponding AR module (e.g., 25 times 0.133 m3 for the AR1 set).

3. Results and Discussion

3.1. Wake Volume with the Change of Seawater Temperature

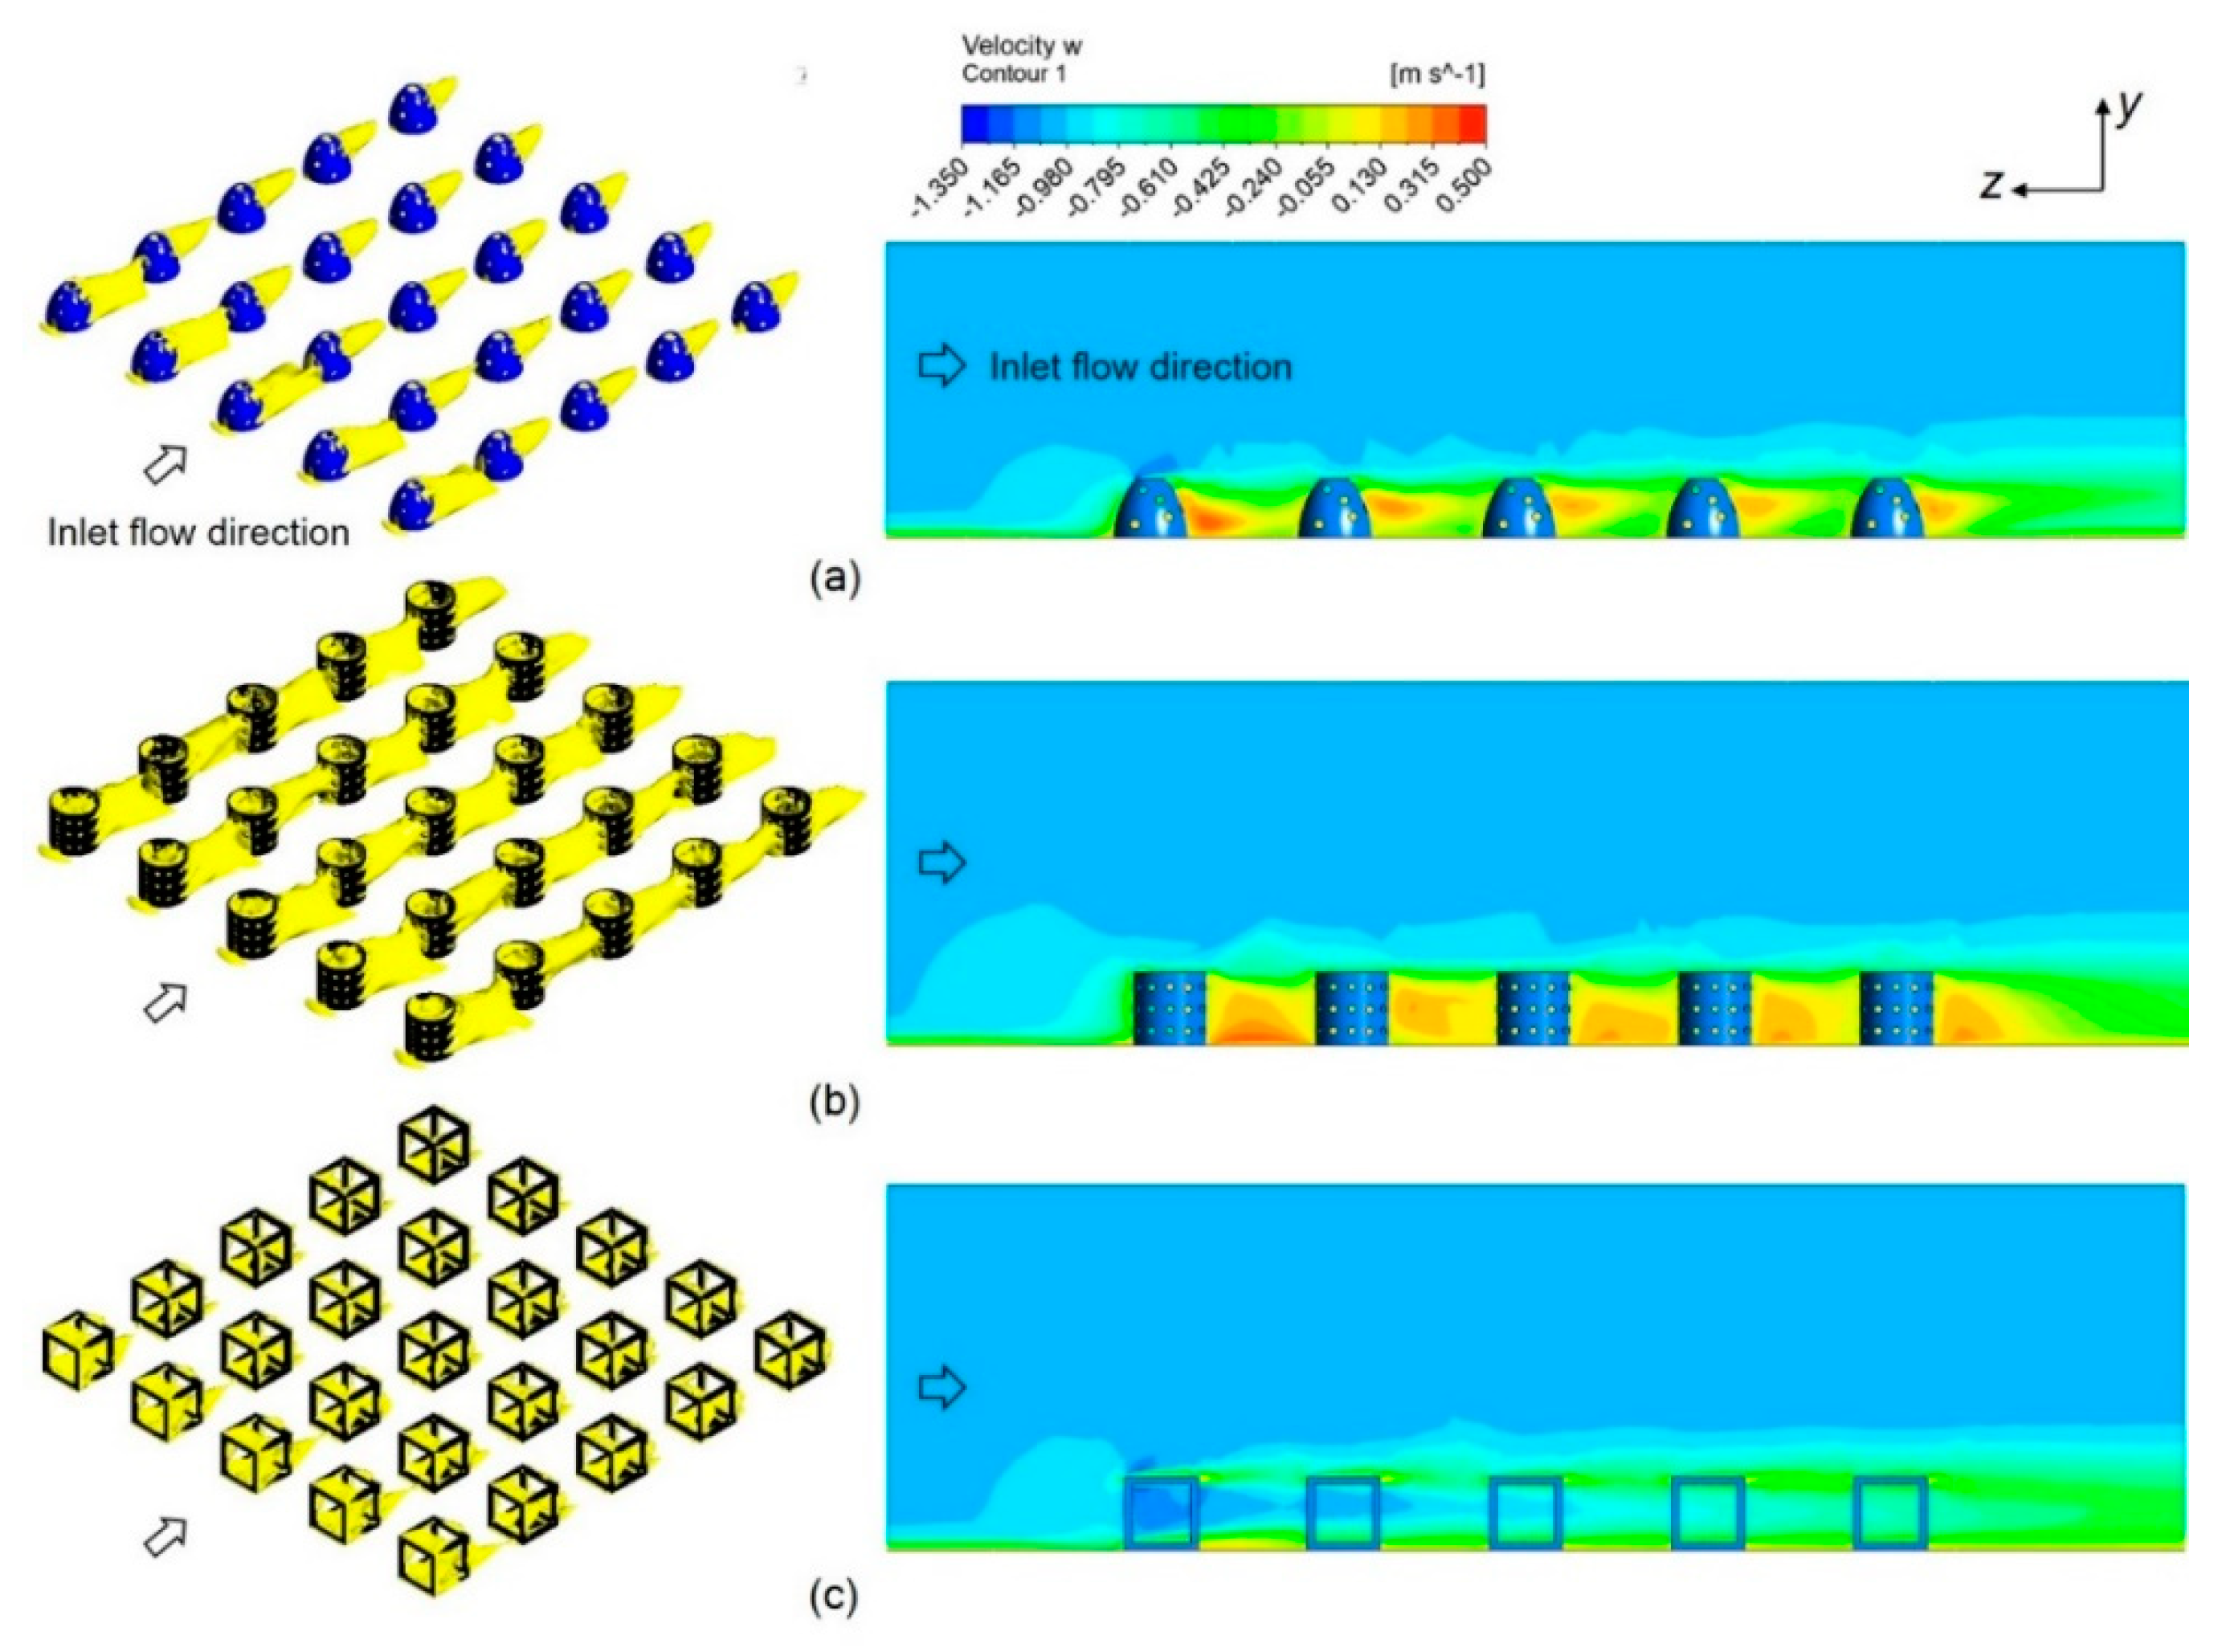
Here, we discuss the wake volume according to variation in seawater temperature, namely, the lowest (24 °C) and highest (29 °C) temperatures. It was found that the wake volumes ( V w ) of AR1 (reef ball module), AR2 (cylinder reef module), and AR3 (cube reef module) at 24 °C were 0.35, 0.93, and 0.16 m3, respectively. Figure 8 illustrates the wake volume of each AR module at 24 °C. Considering the AR sets, the wake volumes of the AR1 set, AR2 set, and AR3 set at 24 °C were 6.98, 18.22, and 3.02 m3, respectively (Figure 9; these sets were constructed as 5 × 5 flatly distributed placement models; 25 modules for each set). In Figure 9, the contours indicate velocities ( w ) in the direction of the z -axis; hence, the positive velocities illustrate recirculating water flows.
When the sea temperature increased to 29 °C, the wake volumes tended to remain about equal or decrease slightly as follows: 0.35 (AR1), 0.93 (AR2), and 0.16 m3 (AR3) for the AR modules and 6.59 (AR1 set), 17.16 (AR2 set), and 3.01 m3 (AR3 set) for the AR sets. Table 2 shows the wake volumes of each AR module and each AR set obtained from the flow analyses. Considering each reef module, the differences in wake volumes between 24 and 29 °C were unclear. In contrast, for the reef sets, the wake volumes did decrease as the water temperature increased from 24 to 29 °C. That is, the wake volumes decreased as the water density decreased. Consequently, the differences ( d ) between the wake volume variations were 0.39 (AR1 set), 1.06 (AR2 set), and 0.01 m3 (AR3 set), equivalent to relative differences ( r ) of 5.6% (AR1 set), 5.8% (AR2 set), and 0.3% (AR3 set). These variations are unlikely to be of great significance.
Additionally, it was observed that the size of a wake volume depended significantly on the reef considered. Specifically, the highest wake volume was ~18.22 m3 (AR2 set), which was 2.61 times that of the AR1 set and 6.03 times that of the AR3 set. Many investigators (e.g., [54,55]) have noted that the location and configuration of a porous reef and its void assemblage are also closely related to the fish assemblage. A wake zone consists of many eddies that vary in scale. Generally, the flow and eddies generated around ARs allow plankton to stay, which provides food for the fish. Thus, the size, shape, and structural composition of a reef affect the size of its wake volume and consequently the efficiency of the reef. AR2 set has a larger wake volume than the other two sets because of its higher water-blocking mechanism and complex configuration, specified by the larger area surface (see Table 1) and the 24 holes, respectively. The observation above is limited to the 5 × 5 placement model of each AR set. Keeping the same seawater temperature variation (24–29 °C) and increasing the number of AR modules (e.g., 10 × 10) is likely to increase the differences in wake volumes further.

3.2. Flow Characteristics of ARs and AR Sets

When ocean currents pass through reefs, the flow field around a reef interferes with the others. Moreover, the flow field is dependent on the flow direction over the reef [56], and accordingly, it is important to consider the effects of seasonal flow directions on the wake region [42]. To investigate the variation in the wake volume of the target AR sets, we considered four flow directions: 0°, 15°, 30°, and 45°. Table 3 summarizes the variation.
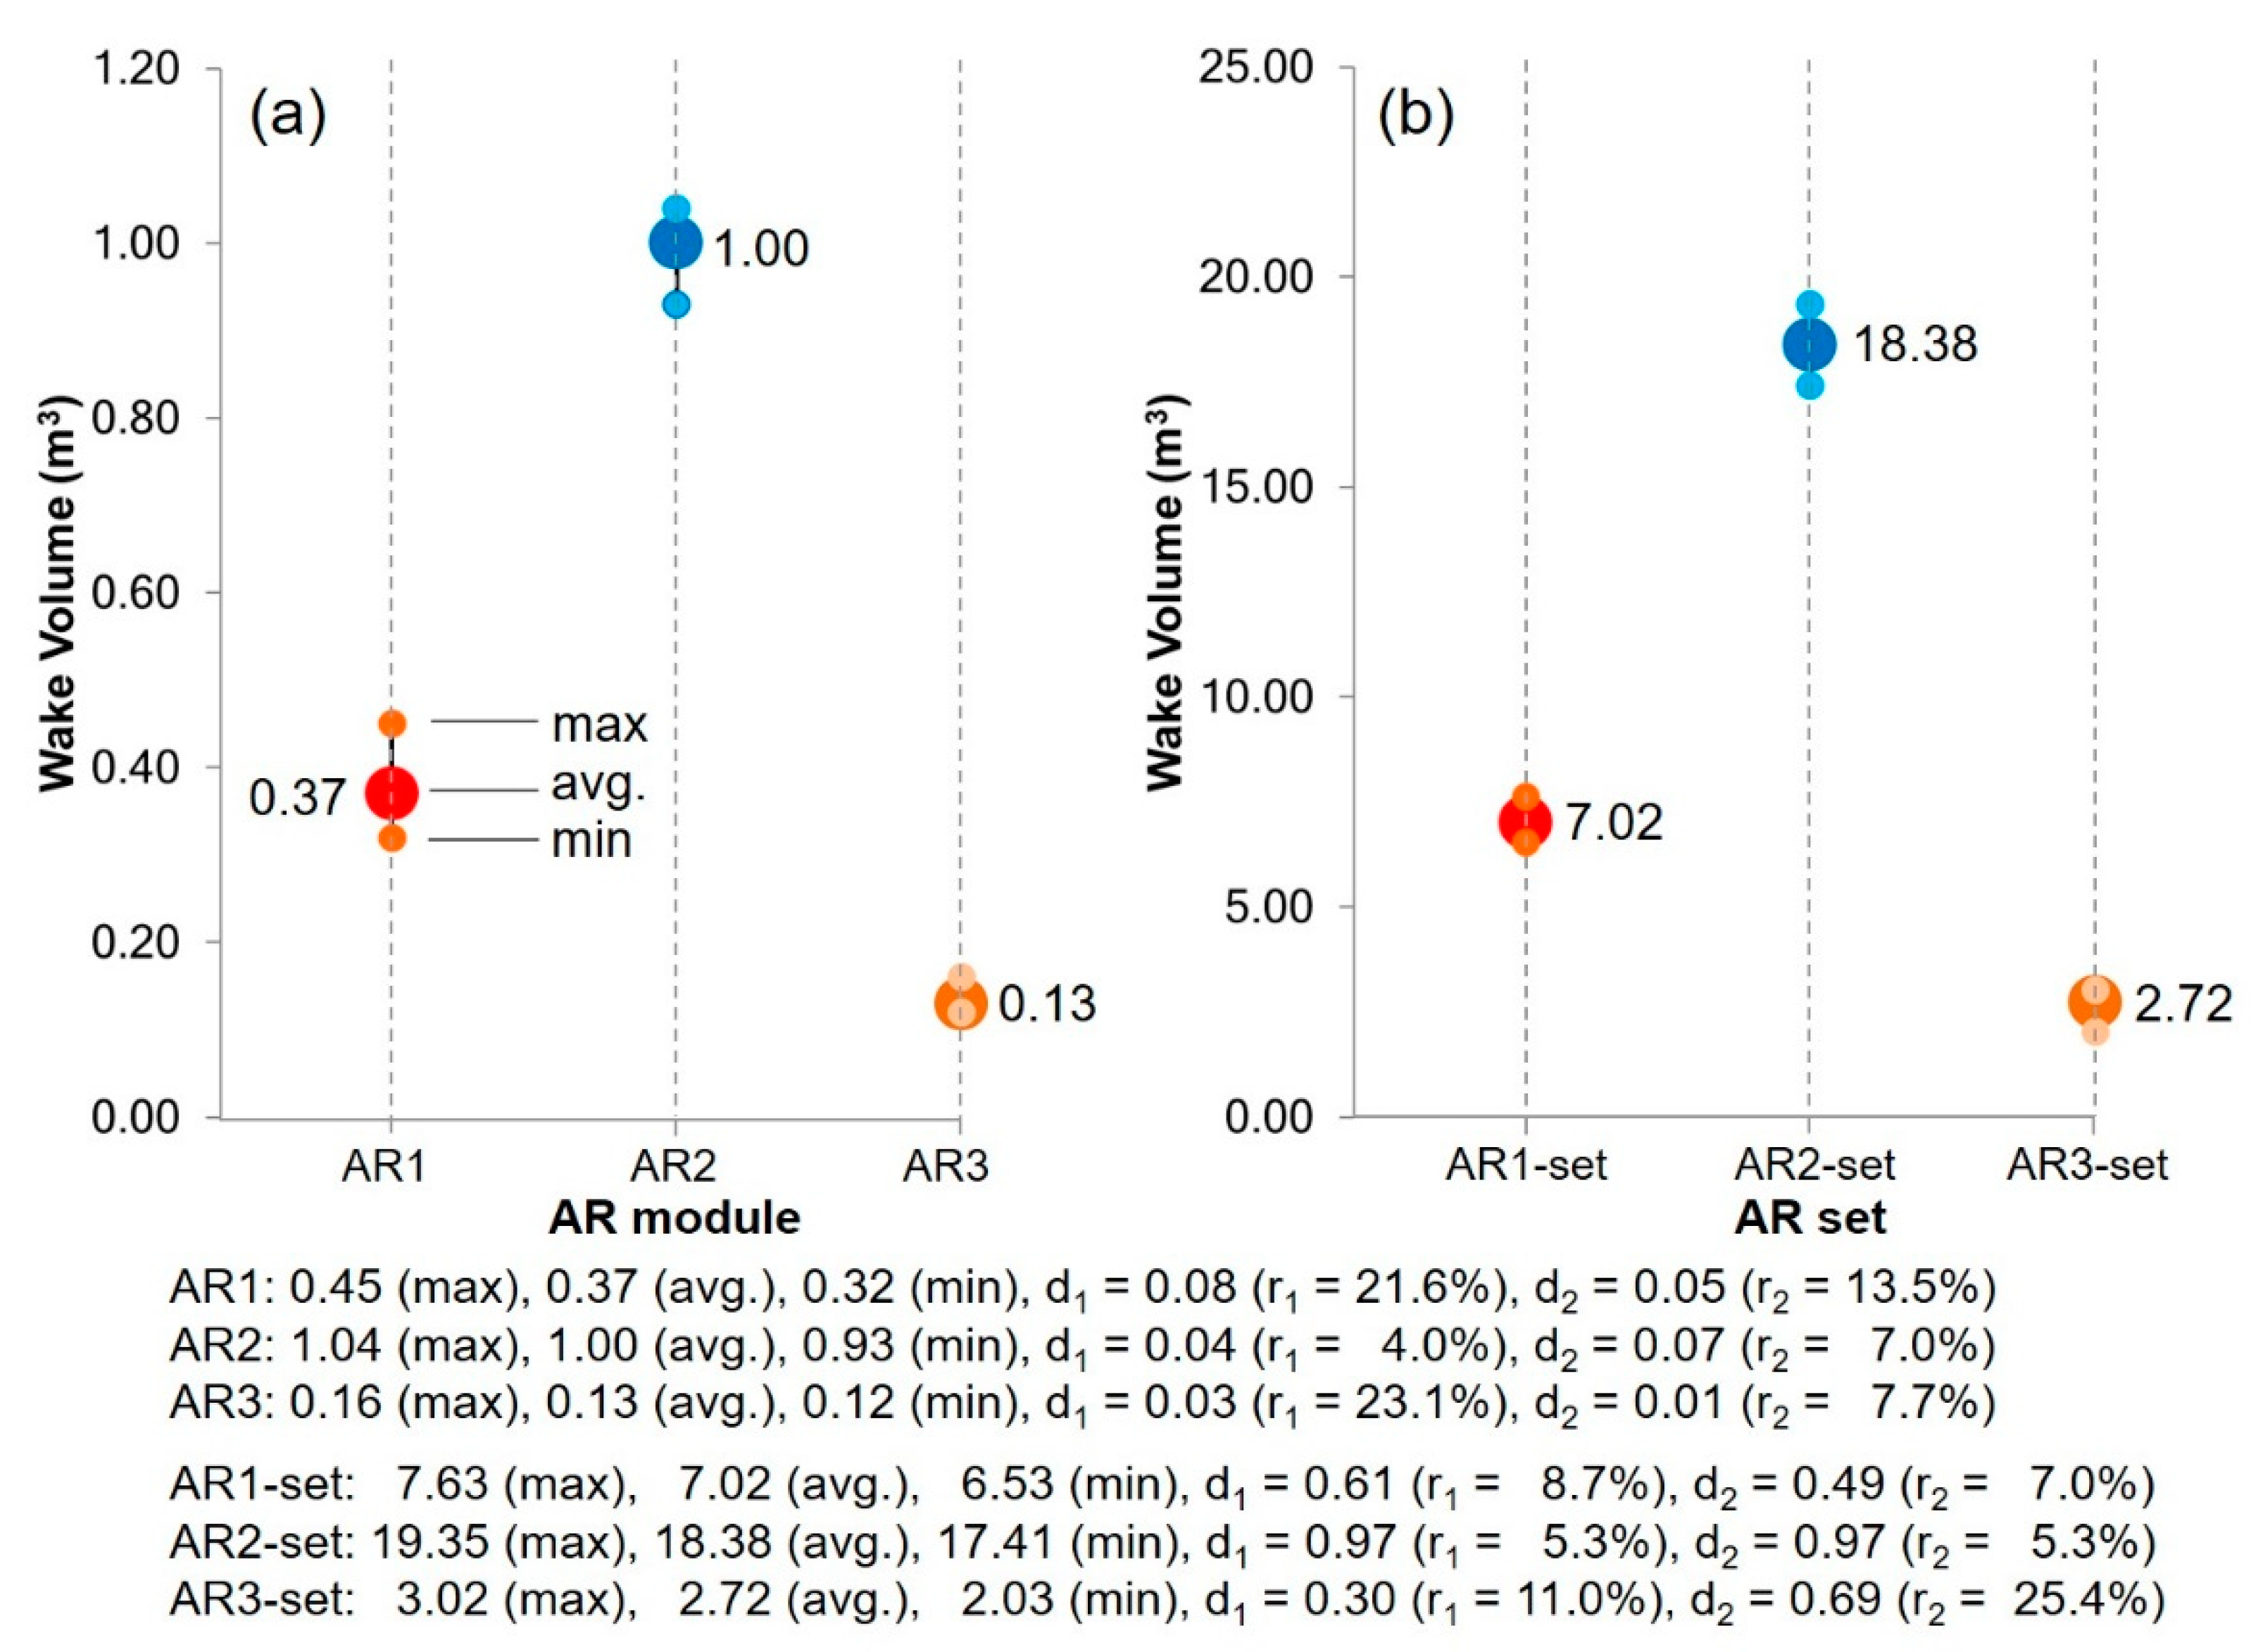
As shown in Table 3, considering the flow directions and the seawater temperature of 24 °C, the corresponding wake volumes of AR1 were 0.36 (0°), 0.32 (15°), 0.45 (30°), and 0.35 m3 (45°). The highest (0.45 m3) and lowest (0.32 m3) occurred with flow directions of 30° and 15°, respectively, and the average wake volume was 0.37 m3. The difference ( d 1 ) between the maximum and average was 0.08 m3, and the difference ( d 2 ) between the minimum and average was 0.05 m3, corresponding to relative differences of r 1 = 21.6% and r 2 = 13.5%, respectively (Figure 10a).
Similarly, the corresponding wake volumes of the AR1 set were 6.98 (0°), 6.94 (15°), 7.63 (30°), and 6.53 m3 (45°). The highest (7.63 m3) and the lowest (6.53 m3) occurred with flow directions of 30° and 45°, respectively, and the average wake volume was 7.02 m3. Here, the difference ( d 1 ) between the maximum and average was 0.61 m3, and the difference ( d 2 ) between the minimum and average was 0.49 m3, corresponding to relative differences of r 1 = 8.7% and r 2 = 7.0%, respectively (Figure 10b). Because of the geometric symmetry of AR1, the wake volumes of AR1 and AR1 set were symmetrical with respect to 45°. The maximum wake volumes for AR1 and AR1 set occurred with a flow direction of 30°; however, the minimum wake volumes occurred with flow directions of 15° (AR1) and 45° (AR1 set). Thus, the AR1 module and set should be located with an inclination of 30° along the major water flow. Figure 11 shows the so-called wake volume diagrams of AR1 (Figure 11a) and AR1 set (Figure 11b) according to variation in the flow direction. Here, the average wake volumes are denoted by the dotted lines for the module and set.
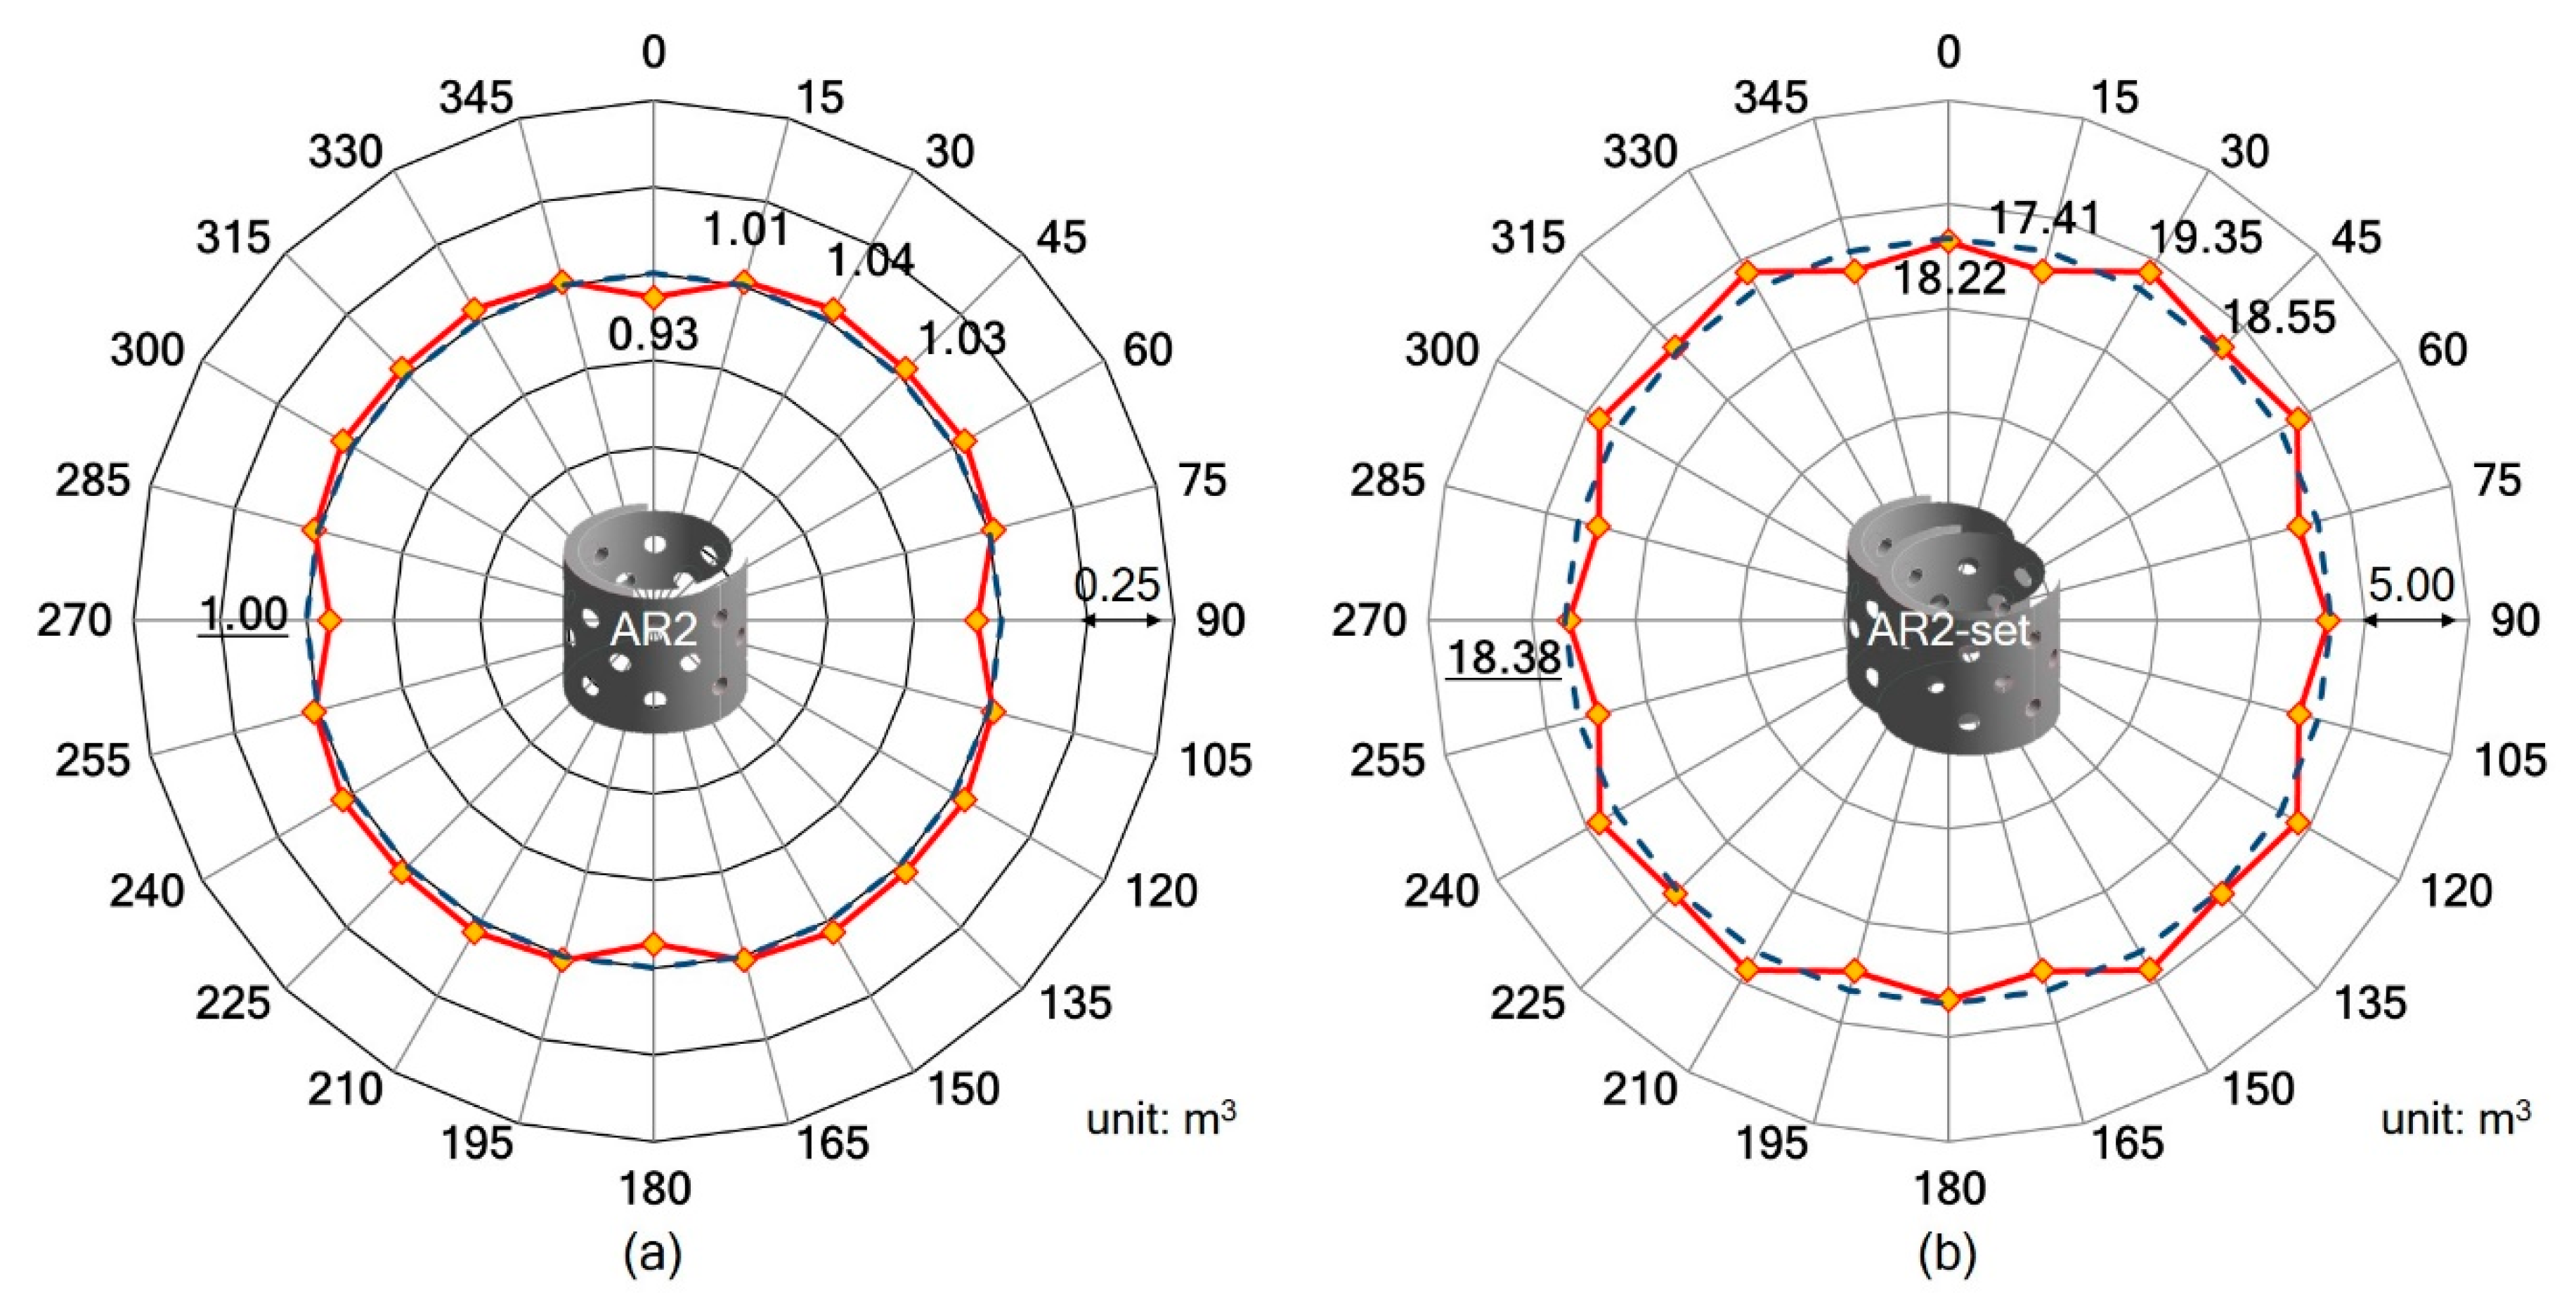
The corresponding wake volumes for AR2 were 0.93 (0°), 1.01 (15°), 1.04 (30°), and 1.03 m3 (45°) when the seawater temperature was 24 °C (Table 3). The highest wake volume for AR2 reached 1.04 m3 (30°), the lowest wake volume was 0.93 m3 (0°), and the average wake volume was 1.00 m3. Here, the differences d 1 and d 2 were 0.04 m3 and 0.07 m3, respectively, corresponding to relative differences of r 1 = 4.0% and r 2 = 7.0% (Figure 10a).
Similarly, the corresponding wake volumes for the AR2 set were 18.22 (0°), 17.41 (15°), 19.35 (30°), and 18.55 m3 (45°) when the seawater temperature was 24 °C. The highest (19.35 m3) and the lowest (17.41 m3) occurred with flow directions of 30° and 15°, respectively, and the average wake volume was 18.38 m3. Here, the difference ( d 1 ) between the maximum and average was 0.97 m3, and the difference ( d 2 ) between the minimum and average was 0.97 m3, corresponding to relative differences of r 1 = 5.3% and r 2 = 5.3% (Figure 10b). Because of the geometric symmetry of AR2, the wake volumes of AR2 and AR2 set were symmetrical with respect to 45°. The maximum wake volumes of AR2 and AR2 set occurred with a flow direction of 30°; however, the minimum wake volumes occurred with flow directions of 0° (AR2) and 15° (AR2 set). Thus, the AR2 module and set should be located with an inclination of 30° to the major water flow. Figure 12 shows the wake volume diagrams of AR2 (Figure 12a) and AR2 set (Figure 12b) according to variation in the flow direction. Here, the average wake volumes are also denoted by the dotted lines for the module and set.
The corresponding wake volumes for AR3 were 0.16 (0°), 0.13 (15°), 0.12 (30°), and 0.12 m3 (45°) when the seawater temperature was 24 °C (Table 3). The highest wake volume for AR3 reached 0.16 m3 (0°), the lowest wake volume was 0.12 m3 (30° and 45°), and the average wake volume was 0.13 m3. Here, the differences d 1 and d 2 were 0.03 m3 and 0.01 m3, corresponding to relative differences r 1 = 23.1% and r 2 = 7.7% (Figure 10a).
Similarly, the corresponding wake volumes for the AR3 set were 3.02 (0°), 2.93 (15°), 2.90 (30°), and 2.03 m3 (45°) when the seawater temperature was 24 °C. The highest (3.02 m3) and the lowest (2.03 m3) values occurred with flow directions of 0° and 45°, respectively, and the average wake volume was 2.72 m3. Here, the differences d 1 and d 2 were 0.30 and 0.69 m3, corresponding to relative differences of r 1 = 11.0% and r 2 = 25.4%, respectively (Figure 10b). Because of the geometric symmetry of AR3, the wake volumes of AR3 and AR3 set were symmetrical with respect to 45°. The maximum wake volumes for AR3 and AR3 set occurred with a flow direction of 0°; however, the minimum wake volumes occurred with flow directions of 30° and 45° (AR3) and 45° (AR3 set). Thus, the AR3 module and set should be located with the inclination of 0° along the major water flow. Figure 13 shows the wake volume diagrams of AR3 (Figure 13a) and AR3 set (Figure 13b) according to variation in the flow direction. Here, the average wake volumes are also indicated by the dotted lines for the module and set.
Considering Figure 10 (maximum, minimum, and average wake volumes) and the wake volume diagrams (Figure 11, Figure 12 and Figure 13), it can be seen that AR2 showed relatively small variation in the wake volumes according to the flow direction among the AR modules examined. This indicates that AR2 generates a consistent wake volume (1.00 m3 on average) essentially regardless of the flow direction. In contrast, AR1 and AR3 showed quite significant variations in their wake volumes with the flow direction. Similarly, among the AR sets, AR2 showed relatively small variation in wake volume, providing a consistent wake volume (18.38 m3 on average). The other sets (AR1 set and AR3 set) showed larger fluctuations in their wake volumes. These results were caused by the geometric shapes (reef ball, cylinder, and cube) of the target AR modules and their geometric layouts (even intervals with h 1 = h 2 = 1.5 m) in the target 5 × 5 flatly distributed placement models. For example, the cylinder AR module has relatively uniform shapes in the axial direction and a circular surface in the circumferential direction; thus, the different flow directions do not generate significant variation in the wake volumes. In contrast, the reef ball AR module has a shape that varies in the axial direction, and accordingly, the circular surface is a conic shape, which results in sensitivity in wake volume responses to the flow direction. Moreover, the cube AR module has a large void on each surface, and the void ratio is considerably larger than in the other modules; thus, the front areas are influenced significantly by the flow direction. These geometric characteristics were also observed in the AR sets because the sets were constructed of evenly flatly distributed placement models. The uniformly generated wake volumes of the AR2 set can be disturbed if the set is constructed with an uneven placement model (i.e., h 1 h 2 ≠ a constant).
Table 4 shows the efficiency indices according to variation in the flow direction. As shown, among the AR modules, AR2 had the highest efficiency index ( I e a v g = 9.28) because of its large wake volume ( V w a v g = 1.00 m3) and relatively small reef volume ( V A R = 0.108 m3). Among the AR sets, the AR2 set had the highest efficiency index ( I e a v g = 6.81) because of its large wake volume ( V w a v g = 18.38 m3) and relatively small reef volume ( V A R = 2.70 m3). In terms of wake volumes, the AR modules and AR sets can be listed in the following orders: AR2 > AR1 > AR3, and AR2 set > AR1 set > AR3 set. These sequences are also applicable to the efficiency indices, primarily because the AR volumes in Table 1 are almost the same. Thus, the wake region efficiency can be estimated by the size of the wake volumes, such that AR2 > AR1 > AR3, and AR2 set > AR1 set > AR3 set. It should be also noted that the efficiency index of each AR set is not larger than that of the corresponding AR module. That is because the wake volume of each AR set did not significantly increase while the reef volume became 25 times larger. This emphasizes the usefulness of an efficiency index when we estimate the efficiency of a flatly distributed placement model of an AR set in regard to wake volume. However, efficiency is one of three indices estimating the wake region, along with tranquility and stability indices, as proposed by Kim et al. [7]. Moreover, the highest efficiency index does not necessarily indicate that AR2 and AR2 set are superior to the other modules and sets in every aspect. Their shapes and structural composition (e.g., voids and walls) are also connected to their efficiency, such as increasing surface area for colonization, providing a firm and stable substrate for attachment, managing a refuge from predators, generating habitat diversity, reducing the energy demand of marine species, creating feeding areas through turbulence, and increasing biomass for the food chain.
A habitat assessment methodology is also needed to evaluate the quality of an AR habitat systematically. The so-called “habitat evaluation procedures,” developed by the U.S. Fish and Wildlife Service [57,58] for government employees to assess fish and wildlife habitat quality, have been useful for assessing natural habitats. Currently, sustainable ecosystem-based fisheries management systems are being developed (e.g., improving essential fish habitat designations [59]).
However, it seems that no procedure or associated habitat quality index (e.g., a habitat suitability index) has been developed for an AR habitat, possibly because of the difficulties in dealing with the interaction between ARs and marine environmental conditions. From that perspective, it is a meaningful start to characterize a wake region according to the wake volume diagram and efficiency index, which are closely related to the reduction of energy demand and creation of a feeding area, for further research efforts into better artificial reef management. Such further research should consider not only abiotic but also biotic variables that are strongly correlated with habitat quality.

4. Conclusions

This study presents wake volume estimation for three artificial reef modules (AR1, AR2, AR3) and sets (AR1 set, AR2 set, AR3 set) that are used in Vietnam. For the estimates, two environmental parameters were considered: flow direction (0°, 15°, 30°, 45°) and seawater temperature (24, 29 °C). From the flow analysis results, the following conclusions can be made. First, among the two environmental parameters tested, flow direction had a major effect on the wake volume estimates. In contrast, seawater temperature variation in Vietnamese waters did not have a major effect on wake volumes. Thus, seawater temperature variation need not necessarily be considered in wake volume estimations. Second, among the three AR modules assessed, AR2 (cylinder reef) generated the maximum wake volume (1.04 m3 at 30°), larger than those (0.45 m3 at 30° and 0.16 m3 at 0°) of the other two AR modules. Among the three AR sets, AR2 set (composed of 5 × 5 modules) created the maximum wake volume (19.35 m3 at 30°), larger than those (7.63 at 30° and 3.02 m3 at 0°) of the other two AR sets. Thus, considering only the size of the wake region, the AR2 module and set are attractive for use in Vietnamese coastal waters. Additionally, the dependence on flow direction showed that the optimum installation angles for the ARs were 30° (AR1 module and set), 30° (AR2 module and set), and 0° (AR3 module and set) along the major flow direction. Third, in terms of the wake region efficiency, the AR2 module and set had better average efficiency indices (9.28 for AR2 and 6.81 AR2 set) than the other cases. This trend was similar to that of the wake volume results primarily because the AR volumes were almost the same. That is, the wake volumes are dominant in the efficiency indices and accordingly the wake volume diagrams are sufficient to represent the dependence on flow directions. Finally, a smaller wake volume size does not necessarily indicate that the AR will be less effective for an intended purpose. The wake volume should be considered as a parameter in wake region estimation, especially from the perspective of reducing the energy demands of marine species and creating feeding areas through turbulence. Other parameters such as AR shapes and structural composition (e.g., voids and walls) are also connected with their effectiveness, such as increasing the surface area for colonization, providing a firm and stable substrate for attachment, managing refuges from predators, and increasing biomass for the food chain. Ultimately, it is important to integrate all of these parameters into one frame and to consider them all in AR estimates and management. From that perspective, the wake region estimation should be a part of the total picture, and the integration should be a part of future research topics. In addition, it should be a future research plan to validate the numerical results using an experimental tool such as particle image velocimetry.

Author Contributions

Conceptualization, Q.T.N.L. and W.-B.N.; Methodology, Q.T.N.L., S.J. and W.-B.N.; Software, Q.T.N.L. and S.J.; Validation, Q.T.N.L., S.J. and W.-B.N.; Formal Analysis, Q.T.N.L. and S.J.; Investigation, Q.T.N.L., S.J. and W.-B.N.; Resources, Q.T.N.L., S.J. and W.-B.N.; Data Curation, Q.T.N.L., S.J. and W.-B.N.; Writing—Original Draft Preparation, Q.T.N.L.; Writing-Review & Editing, S.J. and W.-B.N.; Visualization, Q.T.N.L., S.J. and W.-B.N.; Supervision, W.-B.N.; Project Administration, W.-B.N. and S.J.; Funding Acquisition, W.-B.N. All authors have read and agreed to the published version of the manuscript.

Funding

This work was supported by the National Research Foundation of Korea (NRF) grant funded by the Korea government (MSIT) (No. 2018R1A2B6005879).

Conflicts of Interest

The authors declare no conflict of interest.

References

  1. Perkol-Finkel, S.; Shashar, N.; Benayahu, Y. Can artificial reefs mimic natural reef communities? The roles of structural features and age. Mar. Environ. Res. 2006, 61, 121–135. [Google Scholar] [CrossRef] [PubMed]
  2. Dupont, J.M. Artificial reefs as restoration tools: A case study on the west Florida shelf. Coast. Manag. 2008, 36, 495–507. [Google Scholar] [CrossRef]
  3. Lee, M.O.; Otake, S.; Kim, J.K. Transition of artificial reefs (ARs) research and its prospects. Ocean. Coast. Manag 2018, 154, 55–65. [Google Scholar] [CrossRef]
  4. Paxton, A.B.; Peterson, C.H.; Taylor, J.C.; Adler, A.M.; Pickering, E.A.; Silliman, B.R. Artificial reefs facilitate tropic fish at their range edge. Commun. Biol. 2019, 2, 168. [Google Scholar] [CrossRef] [Green Version]
  5. London Convention and Protocol/UNEP. London Convention and Protocol/UNEP Guidelines for the Placement of Artificial Reefs; London Convention and Protocol/UNEP: London, UK, 2009; pp. 1–21. [Google Scholar]
  6. Claudet, J.; Pelletier, D. Marine protected areas and artificial reefs: A review of the interaction between management and scientific studies. Aquat. Living Resour. 2004, 17, 129–138. [Google Scholar] [CrossRef]
  7. Kim, D.; Woo, J.; Yoon, H.S.; Na, W.B. Efficiency, tranquility and stability indices to evaluate performance in the artificial reef wake region. Ocean. Eng. 2016, 122, 253–261. [Google Scholar] [CrossRef]
  8. Lök, A.; Metin, C.; Ulaş, A.; Düzbastılar, F.O.; Tokaç, A. Artificial reefs in Turkey. ICES J. Mar. Sci. 2002, 59, S192–S195. [Google Scholar] [CrossRef] [Green Version]
  9. Choi, C.G.; Takeuchi, Y.; Terawaki, T.; Serisawa, Y.; Ohno, M.; Sohn, C.H. Ecology of seaweed beds on two different types of artificial reef. J. Appl. Phycol. 2002, 14, 343–349. [Google Scholar] [CrossRef]
  10. Choi, C.G.; Ohno, M.; Sohn, C.H. Algal succession on different substrate covering the artificial iron reef at Ikata in Shikoku, Japan. ALGAE 2006, 21, 305–310. [Google Scholar] [CrossRef] [Green Version]
  11. Jensen, A.; Collins, K.; Lockwood, P. Current issues relating to artificial reefs in European seas. In Artificial Reefs in European Seas; Jensen, A.C., Collins, K.J., Lockwood, A.P.M., Eds.; Kluwer Academics Publishers: Dordrecht, The Netherlands, 2000; pp. 489–499. ISBN 07-7923-5845-7. [Google Scholar]
  12. Jensen, A. Artificial reefs of Europe: Perspective and future. ICES J. Mar. Sci. 2002, 59, S3–S13. [Google Scholar] [CrossRef] [Green Version]
  13. Pendleton, L.H. Creating Underwater Value: The Economic Value of Artificial Reefs for Recreational Diving; The San Diego Oceans Foundation: San Diego, CA, USA, 2004; pp. 1–11. [Google Scholar]
  14. Düzbastılar, F.O.; Lök, A.; Ulaş, A.; Metin, C. Recent developments on artificial reef applications. in Turkey Hydraulic experiments. Bull. Mar. Sci. 2006, 78, 195–202. [Google Scholar]
  15. López, I.; Tinoco, H.; Aragonés, L.; García-Barba, J. The multifunctional artificial reef and its role in the defence of Mediterranean coast. Sci. Total Environ. 2016, 550, 910–923. [Google Scholar] [CrossRef] [PubMed]
  16. Jakšić, S.; Stamenković, I.; Đorđević, J. Impacts of artificial reefs and diving tourism. TURIZAM 2013, 17, 155–165. [Google Scholar] [CrossRef]
  17. Sheng, Y.P. Physical characteristics and engineering at reef sites. In Artificial Reef Evaluation with Application to Natural Marine Habitats; Seaman, W., Ed.; CRC Press: Boca Raton, FL, USA, 2000; pp. 51–94. ISBN 978-0849390616. [Google Scholar]
  18. Lee, I.C.; Kim, D.; Jung, S.; Na, W.B. Prediction of primary physical measures for cost-effective management of artificial seaweed reefs. Mar. Technol. Soc. J. 2020, 54, 25–43. [Google Scholar] [CrossRef]
  19. Kim, D.; Woo, J.; Na, W.B.; Yoon, H.S. Flow and structural response characteristics of a box-type artificial reef. J. Korean Soc. Coast. Ocean. Eng. 2014, 26, 113–119. [Google Scholar] [CrossRef]
  20. Woo, J.; Kim, D.; Yoon, H.S.; Na, W.B. Efficient placement models of labyrinth-type artificial concrete reefs according to wake volume estimation to support natural submerged aquatic vegetation. Bull. Mar. Sci. 2018, 94, 1259–1272. [Google Scholar] [CrossRef]
  21. Kim, D.; Jung, S.; Kim, J.; Na, W.B. Efficiency and unit propagation indices to characterize wake volumes of marine forest artificial reefs established by flatly distributed placement models. Ocean. Eng. 2019, 175, 138–148. [Google Scholar] [CrossRef]
  22. Na, W.B. Artificial reefs and their issues and scientific basis. Sci. Fish. Oceanogr. 2020, 2, 77–82. [Google Scholar]
  23. Kim, D.; Woo, J.; Na, W.B. Intensively stacked placement models of artificial reef sets characterized by wake and upwelling regions. Mar. Technol. Soc. J. 2017, 51, 60–70. [Google Scholar] [CrossRef]
  24. Yanagi, T.; Nakajima, M. Change of oceanic condition by the man-made structure for upwelling. Mar. Pollut. Bull. 1991, 23, 131–135. [Google Scholar] [CrossRef]
  25. Kim, D.S.; Shimasaki, Y. Change in marine environment after artificial reef deployment in the south sea of Korea. J. Fac. Agric., Kyushu Univ. 2013, 58, 403–415. [Google Scholar]
  26. Dao, M.S.; Pham, T. Management of coastal fisheries in Viet Nam. In Assessment, Management and Future Directions for Coastal Fisheries in Asian Countries; Silvestre, G., Garces, L., Stobutzki, I., Ahmed, M., Valmonte-Santos, R.A., Luna, C., Lachica-Alino, L., Munro, P., Christensen, V., Pauly, D., Eds.; WorldFish Center Conference Proceedings: Penang, Malaysia, 2003; Volume 67, pp. 957–986. [Google Scholar]
  27. Trinh, T.H. The Current Coral Reefs, Marine Species in Binh Dinh Province; Nha Trang Oceanographic Institute: Nha Trang, Vietnam, 2002. [Google Scholar]
  28. Trinh, T.H. The Topographic and the Current Coral Reefs in Binh Dinh Province; Nha Trang Oceanographic Institute: Nha Trang, Vietnam, 2003. [Google Scholar]
  29. Trinh, T.H. Model Building Restoration and Management of Coral Reef Ecosystem in Qunag Nam Province; Nha Trang Oceanographic Institute: Nha Trang, Vietnam, 2006. [Google Scholar]
  30. Do, V.K. Additional Research Scientific Basis for Management of Cat Ba and Co To Islands; Hai Phong Research Institute of Marine Fisheries: Hai Phong, Vietnam, 2005. [Google Scholar]
  31. Nguyen, T.L. Research in Building Artificial Reef in Ninh Thuan to Protect., Regenerate and Develop Fisheries Resources; Science and Technology Report; Institute for Marine Science and Fishing Technology, Nha Trang University: Nha Trang, Vietnam, 2014. [Google Scholar]
  32. Le, T.N.Q. Wake Region Estimation of Vietnam’s Artificial Reefs Considering Tropical Seawater Characteristics. Master Thesis, Pukyong National University, Busan, Korea, 2016. [Google Scholar]
  33. Ha, T.H.; Dinh, V.U.; Nguyen, T.V. Circulation of coastal Nha Trang Bay. Sci. Technol. 2013, 29, 65–71. [Google Scholar]
  34. Kim, D.; Woo, J.; Yoon, H.S.; Na, W.B. Wake lengths and structural responses of Korean general artificial reefs. Ocean. Eng. 2014, 92, 83–91. [Google Scholar] [CrossRef]
  35. Woo, J.; Kim, D.; Yoon, H.S.; Na, W.B. Characterizing Korean general artificial reefs by drag coefficients. Ocean. Eng. 2014, 82, 105–114. [Google Scholar] [CrossRef]
  36. Kim, D.; Jung, S.; Na, W.B. Wake region estimation of artificial reefs using wake volume diagrams. J. Fish. Mar. Sci. Edu. 2016, 28, 1042–1056. [Google Scholar] [CrossRef] [Green Version]
  37. Kim, D.; Jung, S.; Na, W.B. Efficiency index diagram for wake region evaluation of artificial reefs facilitated for marine forest creation. J. Adv. Res. Ocean. Eng. 2016, 2, 169–178. [Google Scholar] [CrossRef]
  38. Yoon, H.S.; Kim, D.; Na, W.B. Estimation of effective usable and burial volumes of artificial reefs and the prediction of cost-effective management. Ocean. Coast. Manag. 2016, 120, 135–147. [Google Scholar] [CrossRef]
  39. Langhamer, O. Artificial reef effect in relation to offshore renewable energy conversion: State of the art. Sci. World J. 2012, 386713, 1–8. [Google Scholar] [CrossRef]
  40. Nguyen, D.N.; Nguyen, D.C.; Dao, A.T. Coral degradation and ability of rehabilitation of coral reefs in Co To Archipelago, Quang Ninh province, Vietnam. Deep-Sea Res. II 2013, 96, 50–55. [Google Scholar] [CrossRef]
  41. Nguyen, T.L. Research in Building Artificial Reefs Model for Sustainable Exploitation and Renewable Resources in Quang Nam Coast; Science and Technology Report, Institute for Marine Science and Fishing Technology; Nha Trang University: Nha Trang, Vietnam, 2015. [Google Scholar]
  42. Jung, S.; Kim, D.; Na, W.B. Wake volume characteristics considering artificial reef canyon intervals constructed by flatly distributed artificial reef set. J. Ocean. Eng. Technol. 2016, 30, 169–176. [Google Scholar] [CrossRef]
  43. Rojana-Anawat, P.; Pradit, S.; Sukramongkol, N.; Siriraksophon, S. Temperature, salinity, dissolved oxygen and water masses of Vietnamese waters. In Proceedings of the Fourth Technical Seminar on Marine Fishery Resources Survey in the South China Sea, Area IV: Vietnamese Waters, Bangkok, Thailand, 18–20 September 2000; Secretariat, Southeast Asian Fisheries Development Center: Bangkok, Thailand, 2001; pp. 346–355. [Google Scholar]
  44. ITTC-Recommended Procedures. Testing and Extrapolation Methods, General Density and Viscosity of Water. Available online: https://ittc.info/media/2017/75-02-01-03.pdf (accessed on 1 February 2020).
  45. Marcondes, F.; Sepehrnoori, K. An element-based finite-volume method approach for heterogeneous and anisotropic compositional reservoir simulation. J. Pet. Sci. Eng. 2010, 73, 99–106. [Google Scholar] [CrossRef]
  46. Finnegan, W.; Goggins, J. Numerical simulation of linear water waves and wave-structure interaction. Ocean. Eng. 2012, 43, 23–31. [Google Scholar] [CrossRef] [Green Version]
  47. ANSYS Inc. ANSYS CFX; Release 12.1; ANSYS Inc.: Canonsburg, PA, USA, 2009. [Google Scholar]
  48. Mann, K.H.; Lazier, J.R. Dynamics of Marine Ecosystems: Biological-Physical Interactions in the Oceans; Blackwell Publishing: Malden, MA, USA, 2006; pp. 163–215. ISBN 978-1-405-11118-8. [Google Scholar]
  49. Sawaragi, T. Coastal Engineering–Waves, Beaches, Wave-Structure Interactions; Elsevier Science, B.V.: Amsterdam, The Netherlands, 1995; pp. 429–469. ISBN 0-444-82068-X. [Google Scholar]
  50. Liu, T.L.; Su, D.T. Numerical analysis of the influence of reef arrangements on artificial reef flow fields. Ocean. Eng. 2013, 74, 81–89. [Google Scholar] [CrossRef]
  51. Jiang, Z.; Liang, Z.; Zhu, L.; Liu, Y. Numerical simulation of effect of guide plate on flow field of artificial reef. Ocean. Eng. 2016, 116, 236–241. [Google Scholar] [CrossRef]
  52. Jiang, Z.; Liang, Z.; Zhu, L.; Guo, Z.; Tang, Y. Effect of hole diameter or rotary-shaped artificial reef on flow field. Ocean. Eng. 2020, 197, 106917. [Google Scholar] [CrossRef]
  53. Androulakis, D.N.; Dounas, C.G.; Banks, A.C.; Magoulas, A.N.; Margaris, D.P. An assessment of computational fluid dynamics as a tool to aid the design of the HCMR-artificial-reefsTM diving oasis in the underwater biotechnological park of Crete. Sustainability 2020, 12, 4847. [Google Scholar] [CrossRef]
  54. Lindquist, D.G.; Pietrafesa, L.J. Current vortices and fish aggregations: The current field and associated fishes around a tugboat wreck in Onslow Bay, North Carolina. Bull. Mar. Sci. 1989, 44, 533–544. [Google Scholar]
  55. Eklund, A.M. The Effects of Post-Settlement Predation and Resource Limitation on Reef Fish Assemblages. Ph.D. Thesis, University of Miami, Miami, FL, USA, 1996. [Google Scholar]
  56. Oh, T.G.; Otake, S.; Lee, M.O. Estimating the effective wake region (current shadow) of artificial reefs. In Artificial Reefs in Fisheries Management; Bortone, S.A., Brandini, F.P., Fabi, G., Otake, S., Eds.; CRC Press: Boca Raton, FL, USA, 2011; pp. 279–295. ISBN 978-1439820070. [Google Scholar]
  57. U.S. Fish and Wildlife Service. Habitat Evaluation Procedures (HEP); ESM 102; USDI Fish and Wildlife Service, Division of Ecological Services: Washington, DC, USA, 1980.
  58. U.S. Fish and Wildlife Service. Standards for the Development of Habitat Suitability Index Models; ESM 103; USDI Fish and Wildlife Service, Division of Ecological Services: Washington, DC, USA, 1981.
  59. Moore, C.; Drazen, J.C.; Radford, B.T.; Kelley, C.; Newman, S.J. Improving essential fish habitat designation to support sustainable ecosystem-based fisheries management. Mar. Policy 2016, 69, 32–41. [Google Scholar] [CrossRef]
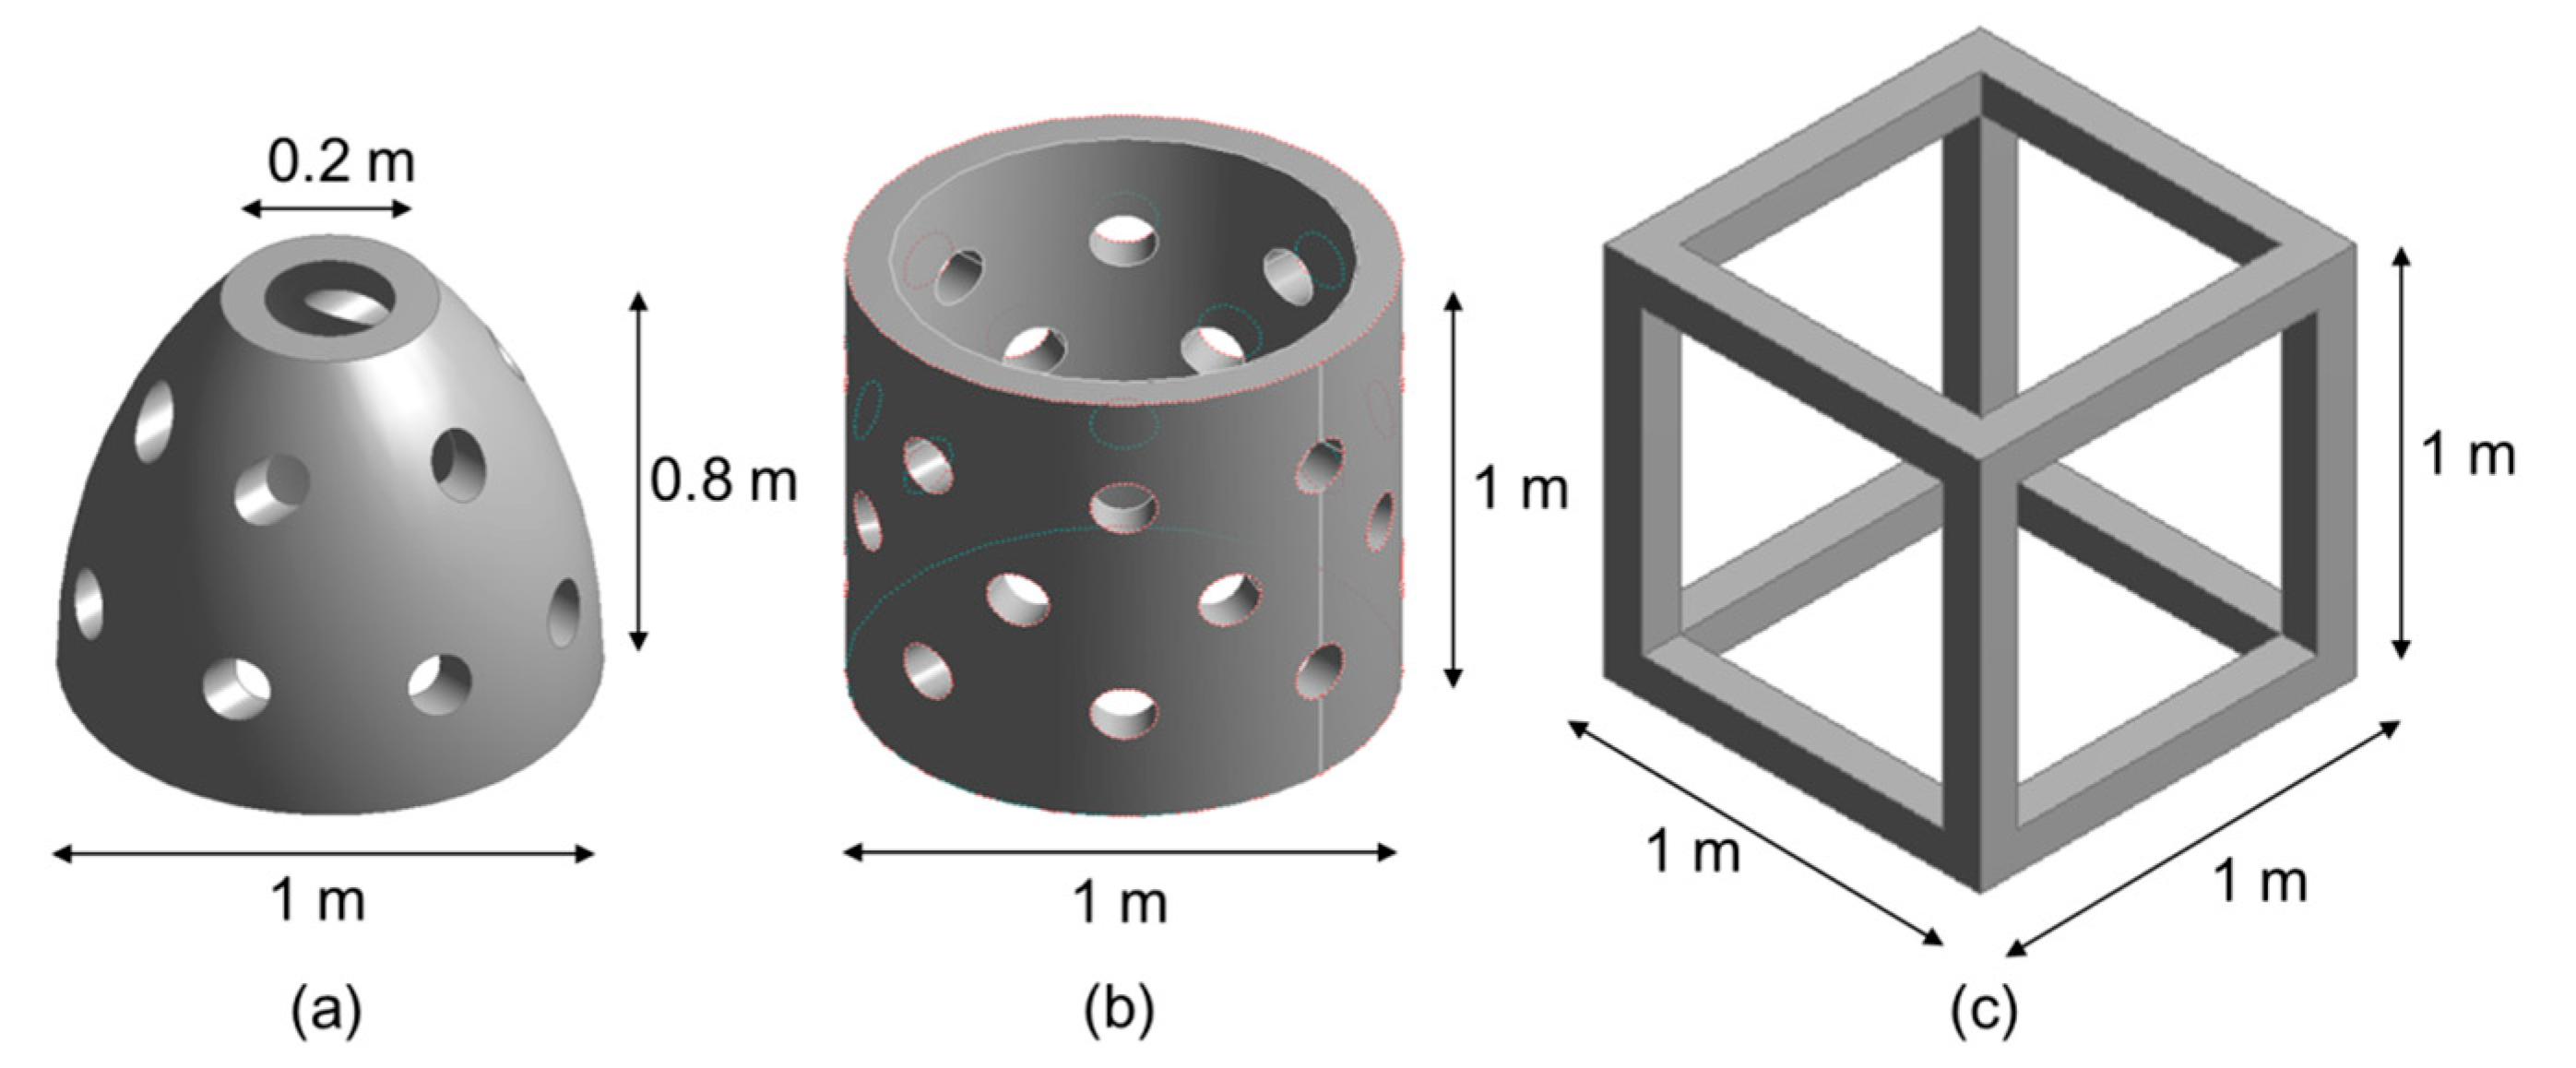
Figure 1. Geometry of target artificial reefs (ARs): (a) reef ball (AR1); (b) cylinder reef (AR2); and (c) cube reef (AR3) (not in scale).
Sustainability 12 06191 g001
Figure 2. A 5 × 5 flatly distributed placement model, established by adjusting the longitudinal interval ( h 1 ) and/or transverse interval ( h 2 ), which are denoted by artificial reef canyons [42].
Sustainability 12 06191 g002
Figure 3. Annual seawater surface temperatures of the Nha Trang region, Vietnam.
Sustainability 12 06191 g003
Figure 4. Density profile with temperature diagram.
Sustainability 12 06191 g004
Figure 5. A plan view of the computational meshes of one AR3 module and its adjacent areas, showing a part of AR3 set at the flow direction of 0°.
Sustainability 12 06191 g005
Figure 6. Boundary conditions of flow domain: (a) inlet facilitating constant flow speed of 1 m s−1 from the front face; (b) outlet assigning zero-pressure gradient on the rear face; (c) non-slip wall applied on the reef and seafloor; and (d) symmetry giving mirror effect on the top, left, and right faces.
Sustainability 12 06191 g006
Figure 7. A schematic definition of a wake region.
Sustainability 12 06191 g007
Figure 8. Wake volume of AR modules (side view): (a) AR1; (b) AR2; and (c) AR3.
Sustainability 12 06191 g008
Figure 9. Wake volumes of AR sets and their velocity contours in the mid-planes: (a) AR1-set; (b) AR2-set; and (c) AR3-set. In the left column, the yellow color indicates the wake volumes. In the right column, the contours indicate velocities ( w ) in the direction of the z -axis; hence, the positive velocities illustrate recirculating water flows.
Sustainability 12 06191 g009
Figure 10. The maximum, minimum, and average wake volumes of (a) AR modules (AR1, AR2, and AR3) and (b) AR sets (AR1-set, AR2-set, and AR3-set). Here, d 1 represents the difference between the maximum and average, and d 2 represents the difference between the minimum and average for each case. Moreover, r 1 and r 2 represent the relative differences (%) corresponding to the d 1 and d 2 , respectively.
Sustainability 12 06191 g010
Figure 11. Wake volume diagram of AR1: (a) reef module and (b) reef set, according to variation in flow directions when the seawater temperature is 24 °C.
Sustainability 12 06191 g011
Figure 12. Wake volume diagram of AR2: (a) reef module and (b) reef set, according to variation in flow directions when the seawater temperature is 24 °C.
Sustainability 12 06191 g012
Figure 13. Wake volume diagram of AR3: (a) reef module and (b) reef set, according to variation in flow directions when the seawater temperature is 24 °C.
Sustainability 12 06191 g013
Table 1. The geometric properties (surface areas and volumes) of the AR modules.
AR1AR2AR3
Surface area (m2)4.3326.1484.080
Volume (m3)0.1330.1080.104
Table 2. The wake volumes of the AR modules and sets.
Seawater TemperatureWake Volume (m3)
AR ModuleAR Set
AR1AR2AR3AR1-SetAR2-SetAR3-Set
24 °C0.360.930.166.9818.223.02
29 °C0.360.930.166.5917.163.01
Table 3. The wake volumes of the AR modules and sets when the seawater temperature is 24 °C.
Flow Directions and Average Wake VolumeWake Volume (m3)
AR ModuleAR Set
AR1AR2AR3AR1-SetAR2-SetAR3-Set
0.360.930.166.9818.223.02
15°0.321.010.136.9417.412.93
30°0.451.040.127.6319.352.90
45°0.351.030.126.5318.552.03
Ave. ( V w a v g ) 0.371.000.137.0218.382.72
Table 4. The efficiency indices of the AR modules and sets when the seawater temperature is 24 °C.
Flow Directions and Average Efficiency IndexEfficiency Index
AR ModuleAR Set
AR1AR2AR3AR1-SetAR2-SetAR3-Set
2.718.611.542.106.751.16
15°2.419.351.252.096.451.13
30°3.389.631.152.297.171.12
45°2.639.541.151.966.870.78
Ave. ( I e a v g ) 2.789.281.272.116.811.05