Economic Evaluation of Carbon Capture and Utilization Applying the Technology of Mineral Carbonation at Coal-Fired Power Plant


Abstract
1. Introduction
- Considering the energy penalties resulting from the CCU plant at a 500 MW coal-fired power plant.
- Application of the actual operational data of a 40 tCO2/day (2 MW) class pilot plant installed at a 500 MW coal-fired power plant.
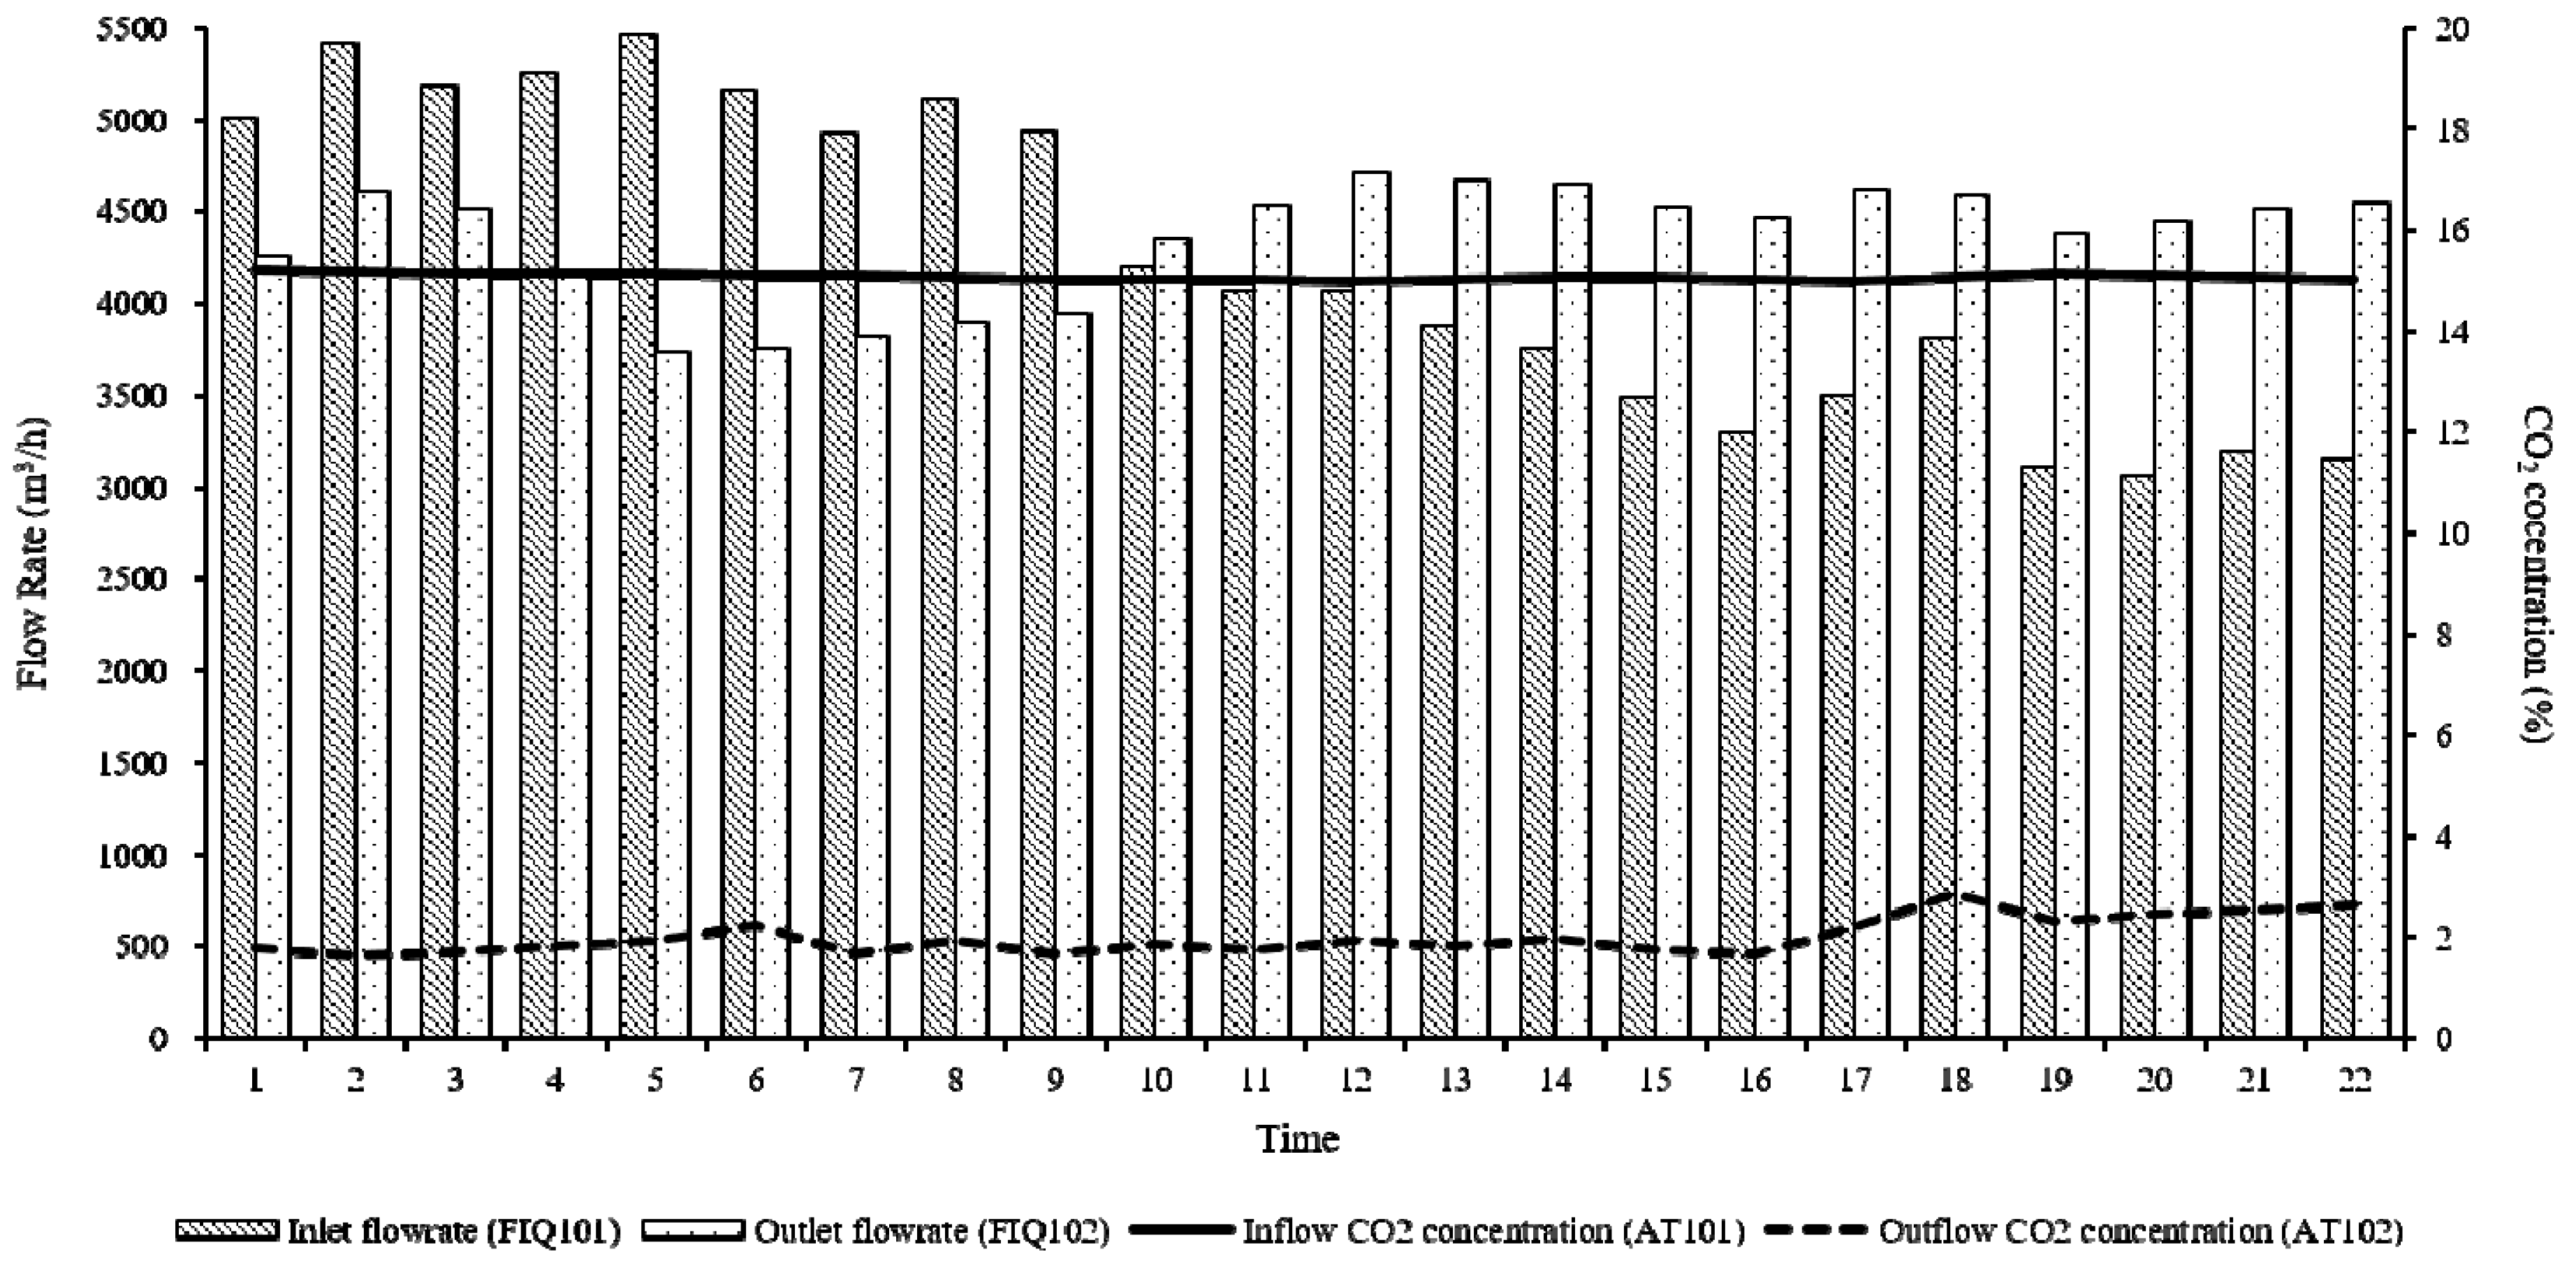
- Application of the actual operational data of the captured CO2 amount collected through a 40 tCO2/day (2 MW) class continuous-capture-process.
- For the 400 tCO2/day (20 MW class) CCU plant installed at a 500 MW coal-fired power plant that manages the economic evaluation, apply the estimated price of equipment based on the actual preliminary design.
- By applying the levelized cost of energy analysis (LCOE), compare the “CO2 avoided cost” and “CO2 captured cost” in similar businesses.
- LCOE = Σ ((Investment cost t + Operation maintenance cost t + Fuel cost t + Power plant abolition cost t)×(1 + r)-t)/(Σt(Power generation t ×(1 + r)-t))
- CO2 capture cost [USD/tCO2] = (LCOE)CCS − (LCOE)ref/(tCO2/MWh)captured
- CO2 avoid cost [USD/tCO2] = (LCOE)CCS − (LCOE)ref/(tCO2/MWh)CCS
2. Materials and Methods
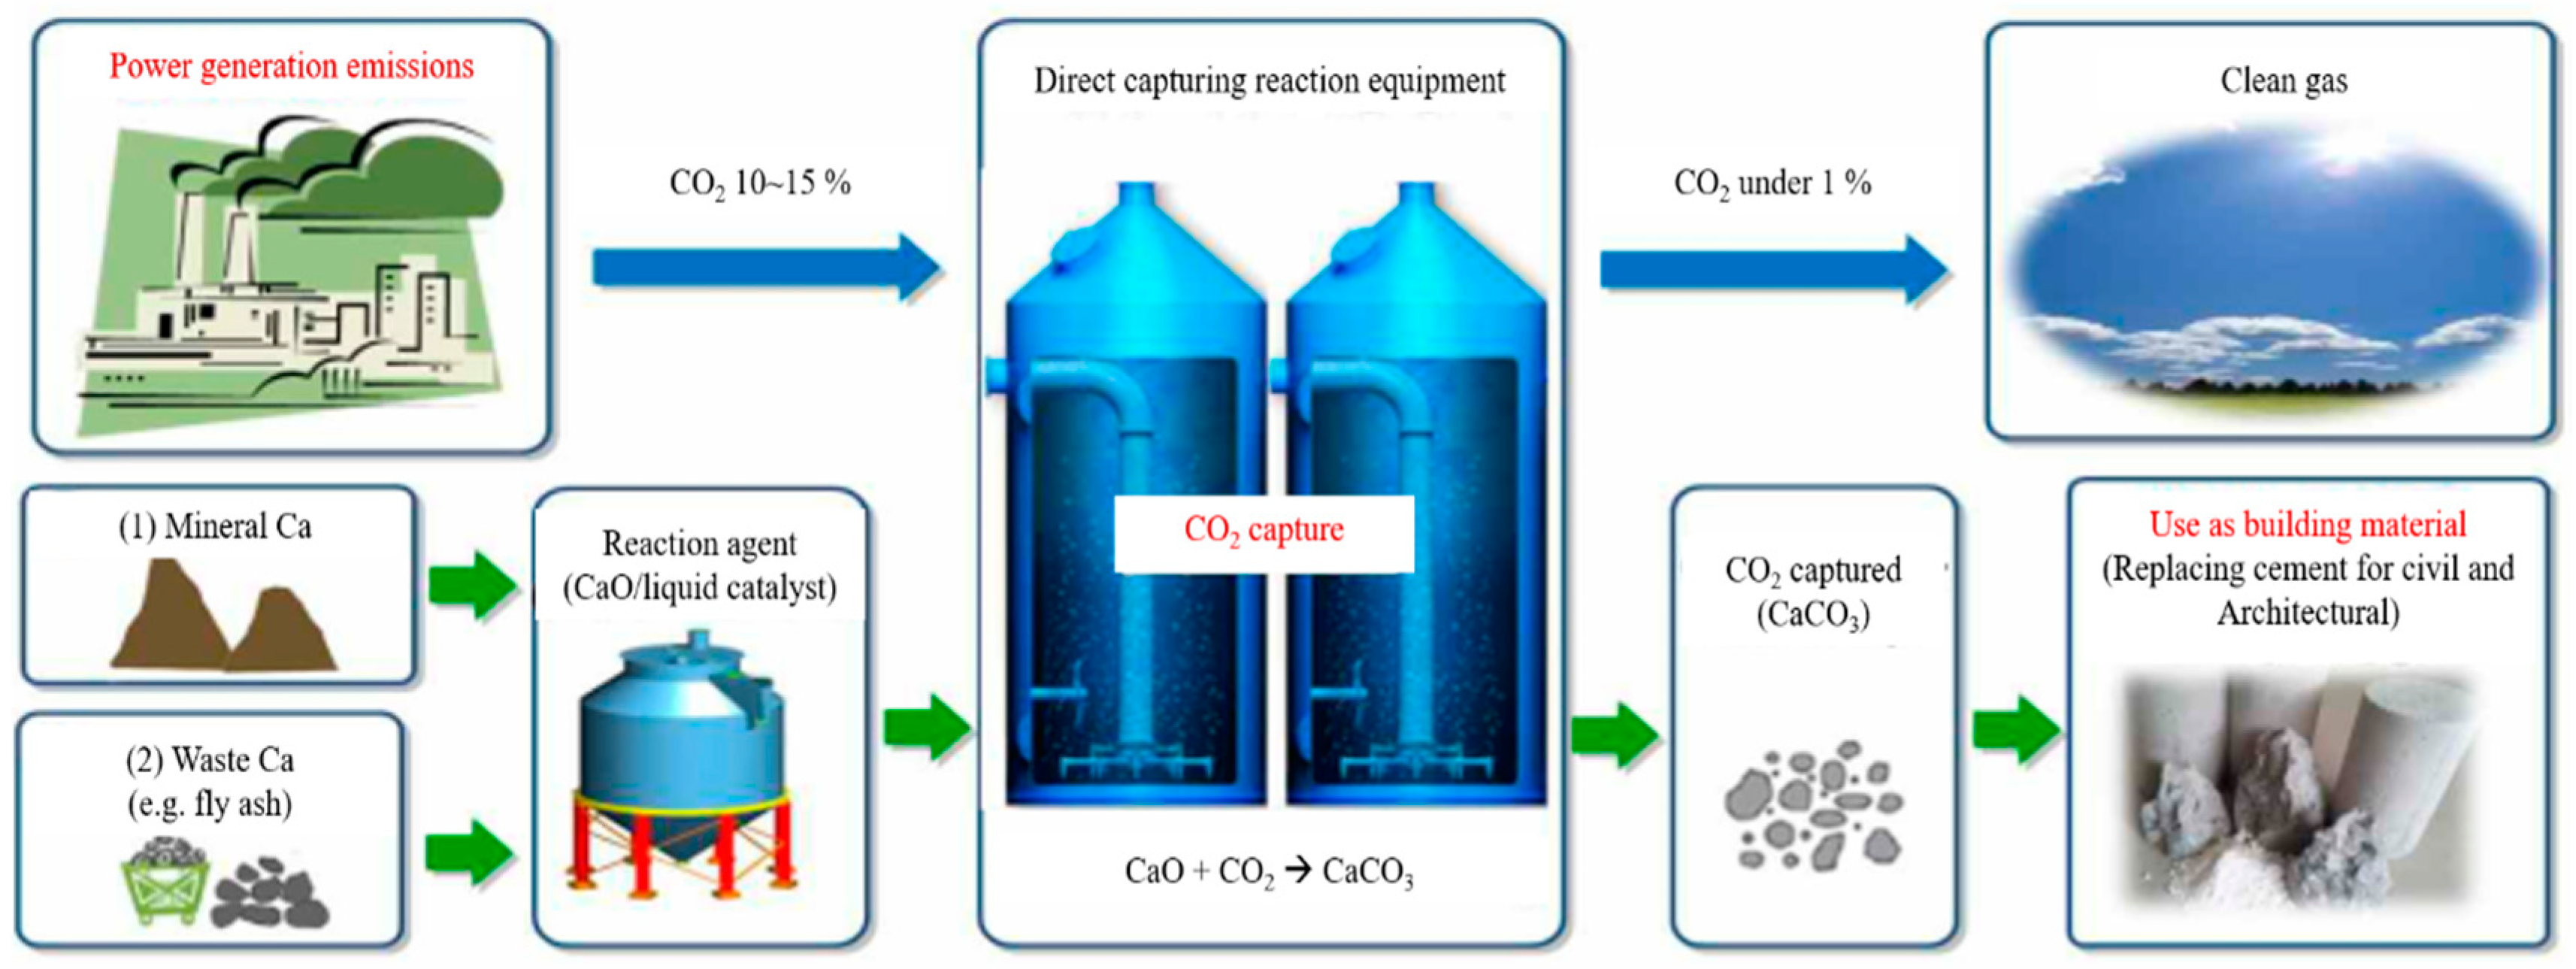
2.1. Applied Technology
2.2. Applied Scale and Process
3. Results
3.1. Cost Calculation of a 500 MW Coal-Fired Power Plant
3.2. Cost Calculation for the 400 tCO2/day Class CCU Plant
3.3. Economic Evaluation Method and Cost Calculation of the CCU Plant
3.3.1. Economic Evaluation Method for the 500 MW Coal-Fired Power Plant Including the 400 tCO2/day Class CCU Plant
- Energy penalty caused by the installation of a CCU facility
- Increase in the construction cost according to the increased facility capacity by the energy penalty
3.3.2. Cost Calculation of the 500 MW Coal-Fired Power Plant Including 400 tCO2/day Class CCU Plant
3.4. Calculation of CO2 Captured and Avoided Cost
3.4.1. CO2 Captured Efficiency and Utilization Rate
3.4.2. Calculation of the CO2 Avoided Cost
4. Discussion
4.1. Comparative Analysis with Other Studies
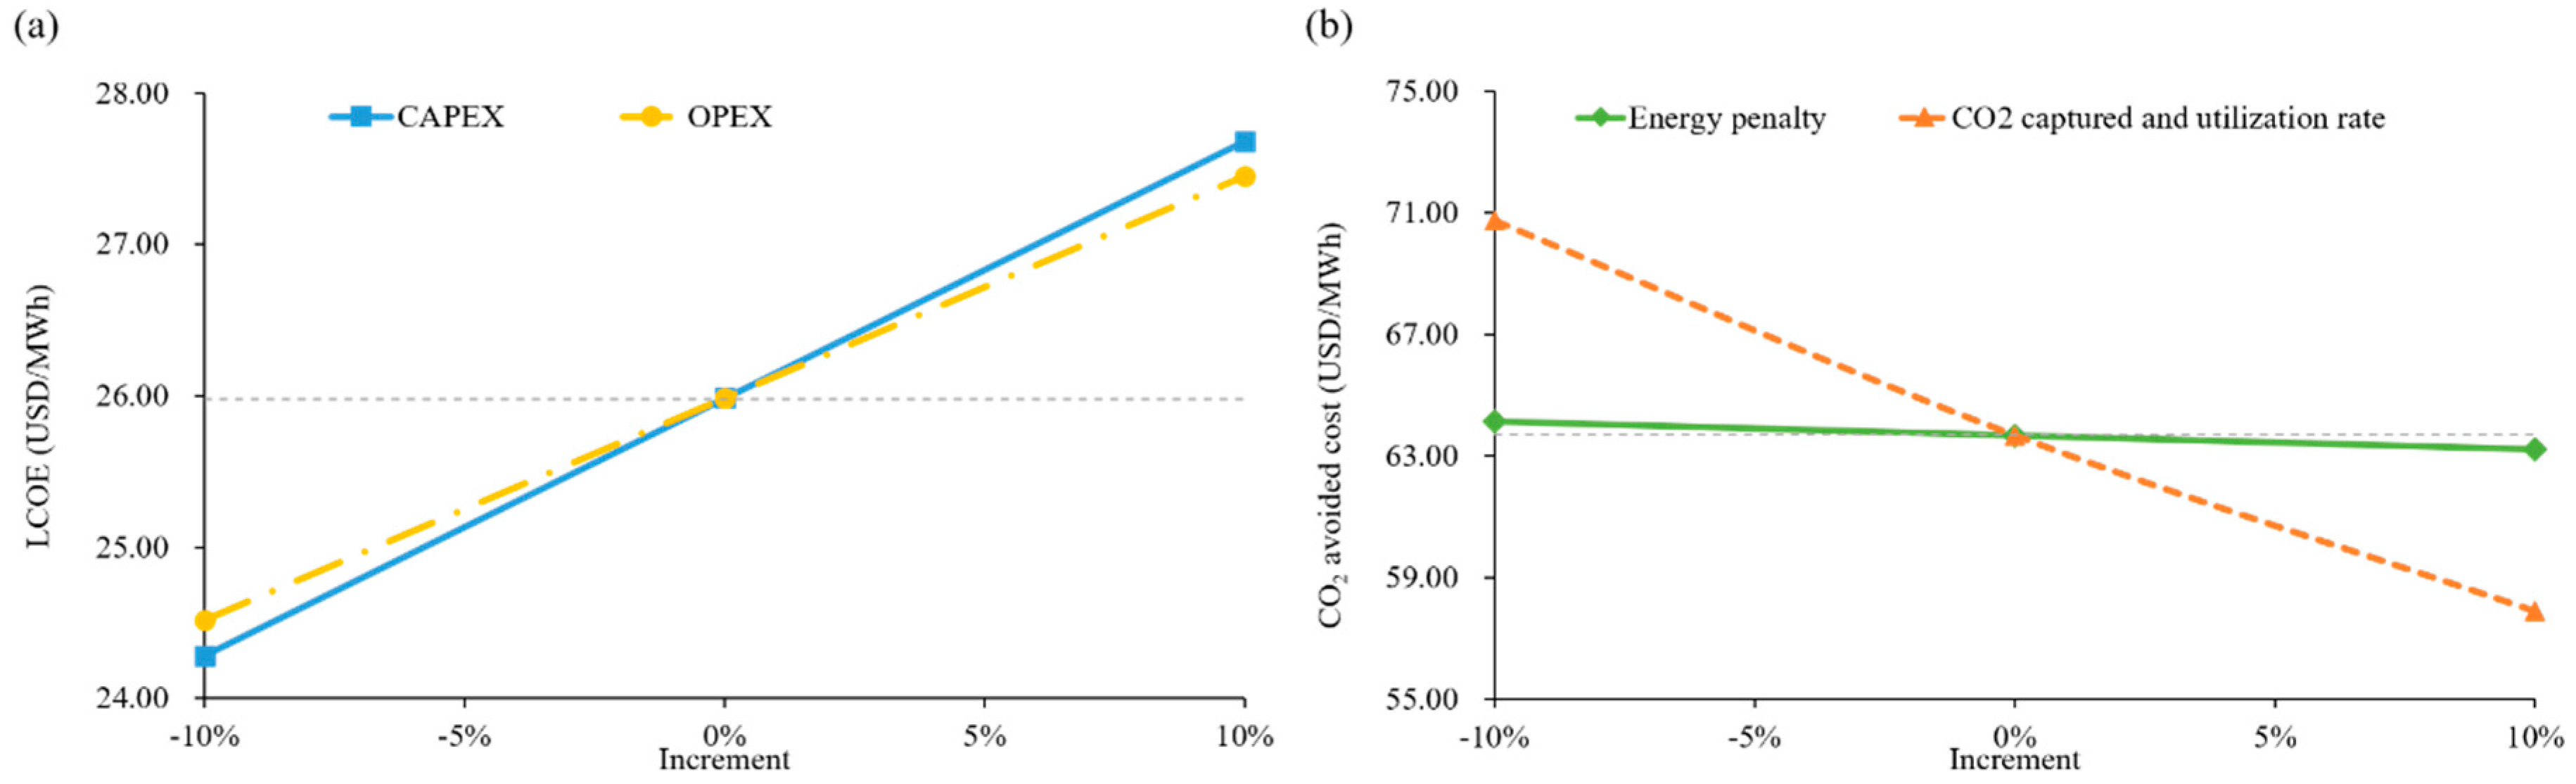
4.2. Sensitivity Analysis
5. Conclusions
Supplementary Materials
Author Contributions
Funding
Conflicts of Interest
References
- Yang, S.; Lei, L.; Zeng, Z.; He, Z.; Zhong, H. An Assessment of Anthropogenic CO₂ Emissions by Satellite-Based Observations in China. Sensors 2019, 19, 1118. [Google Scholar] [CrossRef]
- Pasricha, N.S. Chapter Six—Conservation Agriculture Effects on Dynamics of Soil C and N under Climate Change Scenario. In Advances in Agronomy; Sparks, D.L., Ed.; Academic Press: Cambridge, UK, 2017; Volume 145, pp. 269–312. [Google Scholar]
- Heede, R. Tracing anthropogenic carbon dioxide and methane emissions to fossil fuel and cement producers, 1854–2010. Clim. Change 2014, 122, 229–241. [Google Scholar] [CrossRef]
- Mac Dowell, N.; Fennell, P.S.; Shah, N.; Maitland, G.C. The role of CO2 capture and utilization in mitigating climate change. Nat. Clim. Change 2017, 7, 243–249. [Google Scholar] [CrossRef]
- Mengis, N.; Matthews, H.D. Non-CO2 forcing changes will likely decrease the remaining carbon budget for 1.5 °C. NPJ Clim. Atmos. Sci. 2020, 3, 19. [Google Scholar] [CrossRef]
- Lu, L.; Guest, J.S.; Peters, C.A.; Zhu, X.; Rau, G.H.; Ren, Z.J. Wastewater treatment for carbon capture and utilization. Nat. Sustain. 2018, 1, 750–758. [Google Scholar] [CrossRef]
- Budinis, S.; Krevor, S.; Dowell, N.M.; Brandon, N.; Hawkes, A. An assessment of CCS costs, barriers and potential. Energy Strategy Rev. 2018, 22, 61–81. [Google Scholar] [CrossRef]
- Snæbjörnsdóttir, S.Ó.; Sigfússon, B.; Marieni, C.; Goldberg, D.; Gislason, S.R.; Oelkers, E.H. Carbon dioxide storage through mineral carbonation. Nat. Rev. Earth Environ. 2020, 1, 90–102. [Google Scholar] [CrossRef]
- Cuéllar-Franca, R.M.; Azapagic, A. Carbon capture, storage and utilisation technologies: A critical analysis and comparison of their life cycle environmental impacts. J. CO2 Util. 2015, 9, 82–102. [Google Scholar]
- Nguyen, D.N. Carbon Dioxide Geological Sequestration: Technical and Economic Reviews. In SPE/EPA/DOE Exploration and Production Environmental Conference; Society of Petroleum Engineers: San Antonio, TX, USA, 2003; p. 6. [Google Scholar]
- Holloway, S. Underground sequestration of carbon dioxide—A viable greenhouse gas mitigation option. Energy 2005, 30, 2318–2333. [Google Scholar] [CrossRef]
- Hadi Mosleh, M.; Sedighi, M.; Babaei, M.; Turner, M. 16—Geological sequestration of carbon dioxide. In Managing Global Warming; Letcher, T.M., Ed.; Academic Press: Cambridge, UK, 2019; pp. 487–500. [Google Scholar]
- Wilson, T.R.S. The deep ocean disposal of carbon dioxide. Energy Convers. Manag. 1992, 33, 627–633. [Google Scholar] [CrossRef]
- Palmgren, C.R.; Morgan, M.G.; Bruine de Bruin, W.; Keith, D.W. Initial Public Perceptions of Deep Geological and Oceanic Disposal of Carbon Dioxide. Environ. Sci. Technol. 2004, 38, 6441–6450. [Google Scholar] [CrossRef] [PubMed]
- Strand, S.E.; Benford, G. Ocean Sequestration of Crop Residue Carbon: Recycling Fossil Fuel Carbon Back to Deep Sediments. Environ. Sci. Technol. 2009, 43, 1000–1007. [Google Scholar] [CrossRef] [PubMed]
- Maheshwari, N.; Krishna, P.K.; Thakur, I.S.; Srivastava, S. Biological fixation of carbon dioxide and biodiesel production using microalgae isolated from sewage waste water. Environ. Sci. Pollut. Res. 2020, 27, 27319–27329. [Google Scholar] [CrossRef] [PubMed]
- Michiki, H. Biological CO2 fixation and utilization project. Energy Convers. Manag. 1995, 36, 701–705. [Google Scholar] [CrossRef]
- Schwander, T.; Schada von Borzyskowski, L.; Burgener, S.; Cortina, N.S.; Erb, T.J. A synthetic pathway for the fixation of carbon dioxide in vitro. Science 2016, 354, 900–904. [Google Scholar] [CrossRef]
- Azadi, M.; Edraki, M.; Farhang, F.; Ahn, J. Opportunities for Mineral Carbonation in Australia’s Mining Industry. Sustainability 2019, 11, 1250. [Google Scholar] [CrossRef]
- Geerlings, H.; Zevenhoven, R. CO2 mineralization-bridge between storage and utilization of CO2. Annu. Rev. Chem. Biomol. Eng. 2013, 4, 103–117. [Google Scholar] [CrossRef]
- Global CCS Institute. The Global Status of CCS 2018; Global CCS Institute: Melbourne, Australia, 2018. [Google Scholar]
- Alcalde, J.; Flude, S.; Wilkinson, M.; Johnson, G.; Edlmann, K.; Bond, C.E.; Scott, V.; Gilfillan, S.M.V.; Ogaya, X.; Haszeldine, R.S. Estimating geological CO2 storage security to deliver on climate mitigation. Nat. Commun. 2018, 9, 2201. [Google Scholar] [CrossRef]
- Intergovernmental Panel on Climate Change. IPCC Special Report on Carbon Dioxide Capture and Storage; Intergovernmental Panel on Climate Change: Washington, DC, USA, 2005.
- Finkenrath, M. Cost and Performance of Carbon Dioxide Capture from Power Generation; no.2011/05; International Energy Agency: Paris, France, 2011. [Google Scholar]
- House, K.Z.; Harvey, C.F.; Aziz, M.J.; Schrag, D.P. The energy penalty of post-combustion CO2 capture & storage and its implications for retrofitting the U.S. installed base. Energy Environ. Sci. 2009, 2, 193–205. [Google Scholar]
- Irlam, L. Global Costs of Carbon Capture and Storage. Available online: https://www.globalccsinstitute.com/archive/hub/publications/201688/global-ccs-cost-updatev4.pdf (accessed on 4 June 2017).
- Zhang, Z.; Pan, S.-Y.; Li, H.; Cai, J.; Olabi, A.G.; Anthony, E.J.; Manovic, V. Recent advances in carbon dioxide utilization. Renew. Sustain. Energy Rev. 2020, 125, 109799. [Google Scholar] [CrossRef]
- Lee, J.H.; Lee, D.W.; Gyu, J.S.; Kwak, N.-S.; Lee, I.Y.; Jang, K.R.; Choi, J.S.; Shim, J.-G. Economic Evaluation for the Carbon Dioxide-involved Production of High-value Chemicals. Korean Chem. Eng. Res. 2014, 52, 347–354. [Google Scholar] [CrossRef]
- McCord, S.A.; Zaragoza, A.V.; Sanderson, P.; Armstrong, K.; Styring, P.; Hills, C.; Carey, P.; Osbourne, M.; Müller, L.; Bardow, A. Global CO2 Initiative Complete Mineralization Study 2018. Environ. Sci. 2019. [Google Scholar] [CrossRef]
- Zaragoza, A.V.; McCord, S.; Styring, P.; Cremonese, L.; Strunge, T.; Sick, V. Interpretation of LCA Results: A Worked Example on a CO2 to Fertilizer Process; Technische Universität Berlin: Berlin, Germany, 2020. [Google Scholar]
- Yadav, N.; Seidi, F.; Crespy, D.; D’Elia, V. Polymers Based on Cyclic Carbonates as Trait d’Union Between Polymer Chemistry and Sustainable CO2 Utilization. ChemSusChem 2019, 12, 724–754. [Google Scholar] [CrossRef] [PubMed]
- Kätelhön, A.; Meys, R.; Deutz, S.; Suh, S.; Bardow, A. Climate change mitigation potential of carbon capture and utilization in the chemical industry. Proc. Natl. Acad. Sci. USA 2019, 116, 11187–11194. [Google Scholar] [CrossRef]
- Costentin, C.; Drouet, S.; Robert, M.; Savéant, J.-M. A Local Proton Source Enhances CO2 Electroreduction to CO by a Molecular Fe Catalyst. Science 2012, 338, 90–94. [Google Scholar] [CrossRef]
- Peterson, A.A.; Nørskov, J.K. Activity Descriptors for CO2 Electroreduction to Methane on Transition-Metal Catalysts. J. Phys. Chem. Lett. 2012, 3, 251–258. [Google Scholar] [CrossRef]
- Back, S.; Kim, H.; Jung, Y. Selective Heterogeneous CO2 Electroreduction to Methanol. ACS Catal. 2015, 5, 965–971. [Google Scholar] [CrossRef]
- Fan, J.-L.; Wei, S.; Yang, L.; Wang, H.; Zhong, P.; Zhang, X. Comparison of the LCOE between coal-fired power plants with CCS and main low-carbon generation technologies: Evidence from China. Energy 2019, 176, 143–155. [Google Scholar] [CrossRef]
- Aliyon, K.; Hajinezhad, A.; Mehrpooya, M. Energy assessment of coal-fired steam power plant, carbon capture, and carbon liquefaction process chain as a whole. Energy Convers. Manag. 2019, 199, 111994. [Google Scholar] [CrossRef]
- Sick, V.; Armstrong, K.; Cooney, G.; Cremonese, L.; Eggleston, A.; Faber, G.; Hackett, G.; Kätelhön, A.; Keoleian, G.; Marano, J.; et al. The Need for and Path to Harmonized Life Cycle Assessment and Techno-Economic Assessment for Carbon Dioxide Capture and Utilization. Energy Technol. 2019, 1901034. [Google Scholar] [CrossRef]
- Chrysostomou, C.; Kylili, A.; Nicolaides, D.; Fokaides, P.A. Life Cycle Assessment of concrete manufacturing in small isolated states: The case of Cyprus. Int. J. Sustain. Energy 2017, 36, 825–839. [Google Scholar] [CrossRef]
- Energy Information Administration. Levelized Cost and Levelized Avoided Cost of New Generation Resources in the Annual Energy Outlook 2020; USA Energy Information Administration: Washington, DC, USA, 2020.
- Yeo, T.Y.; Bu, J. Mineral Carbonation for Carbon Capture and Utilization. In An Economy Based on Carbon Dioxide and Water: Potential of Large Scale Carbon Dioxide Utilization; Aresta, M., Karimi, I., Kawi, S., Eds.; Springer International Publishing: Cham, Switzerland, 2019; pp. 105–153. [Google Scholar]
- Tribe, M.A.; Alpine, R.L.W. Scale economies and the “0.6 rule”. Eng. Costs Prod. Econ. 1986, 10, 271–278. [Google Scholar] [CrossRef]
- Kang, K.K.; Kim, J.W. Environmental Impact and Economic Analysis for Expanding Young-Heung Power Plants; Korea Environment Institute: Sejong, Korea, 2012; pp. 1–86. [Google Scholar]


| Classification | Components | |
|---|---|---|
| Facility name | Direct CO2 capture-process pilot plant | |
| Facility capacity | 7000 Nm3/h | |
| CO2 removal amount | 40 ton/day | |
| Monitored CO2 removal amount | 25.94 ton/day | |
| CaCO3 production | 61.80 ton/day | |
| Measured CO2 content in CaCO3 production | 38.29% (TGA analysis) | |
| Measured electric power consumption (Real data) | 0.8 MW | |
| Main equipment | Agent supply system | After storing mineral powder and slag powder, provide a quantitative influx into the reaction agent dissolved tank, and dissolve it for (30–40) min. → Mix (30–40) min for all of the CaO to react → Transport steam and dust generated from the reaction agent reacting process to the desorption liquid storage tank (no wastewater generation). |
| CO2 removal process system | The first removal of CO2 through reacting agent and gas-liquid contact in the first reaction tower. → Discharge after removing residual CO2 with the reacting agent in the secondary reaction tower. → Supplement from the secondary reaction tower by the CO2-captured transfer pump of the first reaction tower when the chemical agents in the first reaction tower reach below pH 8.5, while reacting with CO2 in the emission gas. Real-time monitoring and analysis of CO2 concentration by CO2 analyzer installed before and after the reaction tower duct. Real-time monitoring and control from the main computer by measuring the temperature, flow rate, flux, and flow pressure. | |
| Captured CO2 treatment system | Some of the generated CO2-captured compounds are used as the ingredient of construction materials (bricks, cements block, and so forth) after the dehydrating process in a dehydrator. The remaining undehydrated CO2-captured compounds are used as reagent, such as a desulfurization agent. → Effluent from the dehydration process is used as the full chemical reagent manufacturing water, and the deficiency is supplemented with water. → The dehydrated cake is placed in a ton bag for a certain time, and then taken out. | |
| Classification | Project Outline | |
|---|---|---|
| Project name | Preliminary design of a demonstration plant of the 400 tCO2/day class direct CO2 capture-removal process | |
| Location | Local power plant, cement or steel manufacturing plant | |
| Facility capacity | 60,000 Nm3/h | |
| CO2 removal amount | 400 tCO2/day | |
| Task range | Mechanical field | Preliminary design of machinery, such as ingredients and chemical reagent supply facility, CO2 removal reacting facility, CO2-captured treatment facility, and other process facilities. |
| Electric measurement and control field | Preliminary design of electric measurement and control field, such as motor control center (MCC) module, electric panel, and process measuring instrument. | |
| Classification | Contents | |
|---|---|---|
| Facility capacity | 60,000 Nm3/h (15,000 Nm3/h × 4 series) | |
| Operating time | 24 h/day, 350 days | |
| Construction period | 36 months | |
| Treatment process | Chemical reagent supply facility | Ingredient storage room/ingredient input hopper/ingredient transfer conveyor/ingredient supply conveyor/ingredient supply SILO/ingredient input conveyor/reactant dissolution tank/reactant transfer pump/reactant storage tank/reactant supply pump/liquid catalyst storage tank/liquid catalyst supply pump |
| CO2 removal reacting facility | Emission gas cooling tower/cooling tower circulation pump/emission gas pressurized blower/reaction tower/reaction tower circulation pump/reaction tower transfer pump of CO2-captured | |
| CO2-captured treatment facility | CO2-captured settling tank/sediment collector/sediment outlet/sediment transfer pump/supernatant treating tank/supernatant reuse-pump/sediment storage pit/drying bed | |
| Other facility | Supernatant storage tank/water storage tank/process liquid supply pump/air compressor/pit pump/bottom drain pump | |
| CO2-captured compounds treatment plan | Precipitate the CO2-captured in settling tank, supernatant overflows into the supernatant treating tank, and reuse it as process liquid. The residual sediment is sent to the sediment storage pit, and then stacked on the drying bed by excavator. After the sediments are dried, they are taken out to supply the required site. | |
| Rain water and domestic wastewater treatment plan | Connected treatment of rain water through rain water pipeline into the manufacturing plant rainwater pipeline. Connected treatment of domestic wastewater through wastewater pipeline into the manufacturing plant wastewater pipeline. | |
| Emission gas capture method | Portion of emission gas is captured from the emission gas transfer duct generated during the carbon fuel combustion process. | |
| 500 MW Coal-Fired Thermal Power Plant | Applied Value | Unit | Note |
|---|---|---|---|
| Discount rate | 7 | % | Assumption (IEA data for reference) |
| Load factor | 85 | % | 3 year average of Domestic power plant |
| Plant lifetime | 25 | Year | Assumption (IEA data for reference) |
| Capacity | 500 | MW | Assumption |
| Annual generated electricity | 3,570,000 | MWh/year | 500 MW × 85% × 350 day × 24 h |
| Thermal efficiency | 40 | % | Assumption (IEA data for reference) |
| Equipment cost | 875 | USD/kW | Assumption (construction cost of domestic power plant) |
| Annual fixed cost | 4 | Construction cost% | Assumption (IEA data for reference) |
| Annual variable cost | 0.5 | Construction cost% | Assumption (IEA data for reference) |
| Fuel cost | 0.83 | USD/GJ | Assumption (IEA data for reference) |
| Capex | 437.5 | M USD | 500 MW × 875 USD/kW |
| Annual operating & maintain cost | 19.7 | M USD/year | 4.5% × 437.5 M USD |
| Annual fuel cost | 26.8 | M USD/year | (3,570,000 MWh/40%) × 3.6 GJ/MWh × 0.83 USD/GJ |
| Capex (present value (PV) | 395.7 | M USD | 3 year (1st year 10%, 2nd year 30%, 3rd year 60%) |
| Opex (PV) | 472.9 | M USD | Opex for 25 year |
| Generated electricity (PV) | 36,337,926 | MWh | Generated electricity for 25 year |
| Construction Cost | Applied Value | Unit | Note |
|---|---|---|---|
| Mechanical construction | 6.0 | M USD | Preliminary design report |
| Electric construction | 1.6 | M USD | Preliminary design report |
| Civil/architectural construction | 10.2 | M USD | Preliminary design report |
| Total construction cost | 17.8 | M USD | Preliminary design report |
| Classification | Item | Price Unit | Unit | Usage | Total Amount (USD) |
|---|---|---|---|---|---|
| Labor costs | Operator | 2500 | USD/man month | 32 people, 12 months | 960,000 |
| Electric power cost | Contract power | 8.18 | USD/kw/month | 60,000 | 490,500 |
| Electric power consumption | 0.075 | USD/kw × h | 22,400,880 | 1,689,361 | |
| Sub Total | 2,179,861 | ||||
| Reagent cost | Calcium hydroxide | 75 | USD/ton | 0 | 0 |
| Fly ash | 4.17 | USD/ton | 363,672 | 1,515,300 | |
| Liquid catalyst | 416.7 | USD/ton | 763 | 318,000 | |
| Sub Total | 1,833,300 | ||||
| Water cost | Basic fee | 49.2 | USD/ton/month | 12 | 590 |
| Usage fee | 0.78 | USD/m3 | 385,200 | 301,740 | |
| Sub Total | 302,330 | ||||
| Total annual operating cost | 5,275,491 | ||||
| 500 MW + CCU Coal-Fired Power Plant | Applied Value | Unit | Note |
|---|---|---|---|
| Discount rate | 7 | % | Assumption (see IEA data) |
| Load factor | 85 | % | Application of 3 year averagefor domestic power companies |
| Plant lifetime | 25 | year | Assumption (see IEA data) |
| Energy penalty | 0.8 | % | Calculation form 3.3 |
| Capacity (with CCU) | 504 | MW | Calculation form 3.3 |
| CCU additional capacity | 4 | MW | Calculation form 3.3 |
| Net capacity | 500 | MW | -- |
| Annual generated electricity | 3,598,560 | MWh/year | 504 MW × 85% × 350 days × 24 h |
| Thermal efficiency | 40 | % | Assumption (see IEA data) |
| Capital expenditure (CAPEX) | 875 | USD/kw | Assumption [43] |
| Annual fixed operating expenditure (OPEX) | 4 | Construction cost% | Assumption (see IEA data) |
| Annual variable OPEX | 0.5 | Construction cost% | Assumption (see IEA data) |
| Fuel cost | 0.83 | USD/GJ | Assumption (see IEA data) |
| CAPEX | 439.95 | M USD | 437.5 M USD × ((504/500)^0.7) |
| Annual OPEX | 19.80 | M USD/year | 4.5% × 439.95 M USD |
| Annual fuel cost | 27.00 | M USD/year | 3,598,860 MWh/40% × 3.6 GJ/MWh × USD/GJ |
| Annual emitted CO2 | 3,400,000 | tCO2/year | Actual data of 500 MW domestic coal-fired thermal power plant |
| Levelized cost of energy analysis (LCOE) | 23.90 | USD/MWh | Calculation |
| Only CCU CAPEX | 17.75 | M USD | Amount statement of the CO2 direct capture removal process (400 tCO2/day) |
| Only CCU OPEX | 5.25 | M USD/year | Only cost applied among construction design report of the direct CO2 capture removal process (400 tCO2/day) |
| CAPEX including CCU (PV) | 413,916,667 | USD | 3 year (10% for first year, 30% for second year, 60% for third year) |
| OPEX including CCU (PV) | 537,750,000 | USD | Including 25 year of operating and disposal costs |
| Generated electricity(PV) | 36,328,630 | MWh | Generated electricity for 25 years |
| Calculation of CO2 Avoided | Applied Value | Unit | Note |
|---|---|---|---|
| Coal-fired power plant without CCU | |||
| Capacity | 500 | MW | |
| Annual generated electricity | 3,570,000 | MWh/year | 500 MW × 85% × 350 day × 24 h |
| Annual emitted CO2 | 3,400,000 | tCO2/year | Actual data of 500 MW domestic coal-fired thermal power plant |
| CO2 emission factor | 0.9524 | tCO2/MWh | CO2 emission/generated electricity |
| Coal-fired power plant with CCU | |||
| Energy penalty | 0.8 | % | Calculated in Section 3.3. |
| Capacity (with CCU) | 504 | MW | |
| Annual emitted CO2 | 3,598,560 | MWh/year | 500 MW × 85% × 350 day × 24 h |
| CO2 emission factor | 0.9524 | tCO2/MWh | |
| CO2 captured and utilization rate | 3.43 | % | CO2 captured efficiency (85.71%) × (20 MW/500 MW) |
| CO2 emission | 3,427,200 | tCO2/year | Generated electricity × CO2 emission factor (Korea) |
| CO2 captured and utilization amount | 117,504 | tCO2/year | CO2 emission × CO2 captured and utilization rate |
| CO2 emission without CCU | 3,400,000 | tCO2/year | Actual data of 500 MW domestic coal-fired power plant |
| Net CO2 emission | 3,309,696 | tCO2/year | CO2 emission–CO2 capture and utilization amount |
| CO2 avoided | 90,304 | tCO2/year | CO2 emission without CCU–net CO2 emission |
| Classification | Applied Value | Unit | Note |
|---|---|---|---|
| Coal-fired plant without CCU | |||
| Current construction cost | 395.67 | M USD | |
| Current operation cost | 472.92 | M USD | On a 25 year basis |
| Current electric power generation cost | 36,337,926 | MWh | On a 25 year basis |
| LCOE | 23.90 | USD/MWh | |
| Coal-fired plant with CCU | |||
| Current construction cost | 413.92 | M USD | |
| Current operation cost | 537.75 | M USD | On a 25 year basis |
| Current electric power generation cost | 36,628,630 | MWh | On a 25 year basis |
| LCOE | 25.98 | USD/MWh | |
| CO2 avoided cost | 63.67 | USD/tCO2 | |
| Emitting Source | Generated Emissions [tCO2/year] | CO2 Captured and Utilization Rate [%] | Captured, Recovery Emissions [tCO2/year] | LCOE [USD/MWh] | CO2 Avoided Cost [USD/tCO2] | |
|---|---|---|---|---|---|---|
| Coal-fired thermal power plant, Republic of Korea (mineral carbonation of this study) | 3,427,200 | 3.43 | 117,504 (Captured efficiency 85.71%) | 26 | 64 | |
| CCS | IGCC + CCS, US, 2015, FOAK [11] | 4,245,600 | 90 | 3,819,360 | 141 | 97 |
| NGCC + CCS, US, 2015, FOAK [11] | 1,971,000 | 90 | 1,769,520 | 78 | 89 | |
| PC supercritical. CCS, US, 2015, FOAK [11] | 4,677,840 | 90 | 4,204,800 | 124–133 | 74–83 | |
| CCU | Coal-fired power plant (500 MW, 2010, recovery by dry sorbent) [20] | 4,090,625 | 80 | 3,272,500 | 32.46 | Capture cost 28.15 |
| Coal-fired power plant (2010, US) [9] | - | 85–100 | - | Included in avoidance cost | Capture cost 43–58 | |
| Aluminum production (2013, Norway) [21] | - | - | Capture rate of 85% | - | Capture cost 80–105 | |
| Coal powered (UK, 600 MW, mineral carbonation) [22] | Approx. 4,000,000 | 85% | 3,400,000 | - | 86–140 | |
© 2020 by the authors. Licensee MDPI, Basel, Switzerland. This article is an open access article distributed under the terms and conditions of the Creative Commons Attribution (CC BY) license (http://creativecommons.org/licenses/by/4.0/).
Share and Cite
Lee, B.J.; Lee, J.I.; Yun, S.Y.; Lim, C.-S.; Park, Y.-K. Economic Evaluation of Carbon Capture and Utilization Applying the Technology of Mineral Carbonation at Coal-Fired Power Plant. Sustainability 2020, 12, 6175. https://doi.org/10.3390/su12156175
Lee BJ, Lee JI, Yun SY, Lim C-S, Park Y-K. Economic Evaluation of Carbon Capture and Utilization Applying the Technology of Mineral Carbonation at Coal-Fired Power Plant. Sustainability. 2020; 12(15):6175. https://doi.org/10.3390/su12156175
Chicago/Turabian StyleLee, Bong Jae, Jeong Il Lee, Soo Young Yun, Cheol-Soo Lim, and Young-Kwon Park. 2020. "Economic Evaluation of Carbon Capture and Utilization Applying the Technology of Mineral Carbonation at Coal-Fired Power Plant" Sustainability 12, no. 15: 6175. https://doi.org/10.3390/su12156175
APA StyleLee, B. J., Lee, J. I., Yun, S. Y., Lim, C.-S., & Park, Y.-K. (2020). Economic Evaluation of Carbon Capture and Utilization Applying the Technology of Mineral Carbonation at Coal-Fired Power Plant. Sustainability, 12(15), 6175. https://doi.org/10.3390/su12156175