Article

Gross Employment Effects in the Renewable Energy Industry in Germany—An Input–Output Analysis from 2000 to 2018

by
Marlene O’Sullivan
1,* and
Dietmar Edler
2
1
Department of Energy Systems Analysis, Institute of Engineering Thermodynamics, German Aerospace Center (DLR), 70569 Stuttgart, Germany
2
German Institute for Economic Research (DIW), 10117 Berlin, Germany
*
Author to whom correspondence should be addressed.
Sustainability 2020, 12(15), 6163; https://doi.org/10.3390/su12156163
Submission received: 9 June 2020 / Revised: 29 June 2020 / Accepted: 30 June 2020 / Published: 31 July 2020
(This article belongs to the Special Issue Technological Innovation and the Effect of Employment on Green Growth)

Abstract

:
The purpose of this paper is to provide detailed insights into an approach to measure gross employment of the renewable energy (RES) industry in Germany in order to improve transparency and comparability. The method applied for the assessment of gross employment figures follows the input–output (IO) modeling approach and covers direct as well as indirect employment effects. All-in-all, four different approaches of applying the IO-methodology are described. The analysis includes 11 different RES technologies. It provides information on employment in manufacturing and installation, operation and maintenance (O&M), as well as the provision of biogenic fuels. The results show the relevance of the manufacturing and installation sector as well as the influence of foreign trade on this sector. On the other hand, it reveals the growing importance of O&M as well as the provision of biogenic fuels and their role in providing a more stable development of employment in the RES industry. Our main methodological conclusions are as follows: (1) data availability is a major challenge in assessing employment effects of specific technologies; (2) there are many different ways to apply the IO-modeling approach to specific technologies and services; (3) the transfer of results to other countries is limited.

1. Introduction

The energy transition is one of the greatest political challenges of our time. The challenges not only lie in the technical implementation of the energy system transformation, but also in the carbon lock-in effects that come with the transformation of the energy system [1,2]. One aspect that has a strong impact on political decision-makers as well as on public acceptance are societal implications that result from the energy transition. Uncertainty about these implications may well be one of the greatest barriers to the rigorous realization of the energy transition in most countries. In this context, one of the most pressing issues is the change in industrial structures and employment that accompanies a change in technology. The discussion of the impact of new technologies on employment has been on the economic agenda ever since David Ricardo wrote [3] his famous chapter “On Machinery” in the third edition of his Principles of Political Economy and Taxation in 1821. Therefore, the successful establishment of new industries in the technologies that are the drivers of the energy transition is of particular importance for political decision-makers [4].
In order to monitor and assess the development of the renewable energy (RES) industry economic indicators like domestic demand and employment are essential. However, RES technologies as evolving cross-sectional technologies are not represented in official classifications of goods and industries so that no immediate information on the RES-sector employment can be found in official statistics. Therefore, gross employment effects must be derived by formal quantitative estimation methods.
A number of methods have been used so far in different countries and regions to determine gross employment in RES-technologies [5,6,7,8,9]. Most of these approaches differ significantly in many ways. Cameron and Zwaan [10], as well as Barros et al. [11] give a good overview of the research that has been carried out regarding gross employment of RES-technologies. Aldieri et al. [12] offers a recent overview of the wind energy sector. Furthermore, a classification conducted by Breitschopf et al. [13] identifies three main approaches: (a) the employment factor approach, (b) the supply chain analysis and (c) the input–output modeling approach that help to improve the interpretation and comparison of RES-employment related work.
This paper aims to contribute to the scientific discourse on the effects of the energy transition in several ways. It will show four different methods using an input–output modeling approach that were applied to estimate the development of gross employment of the RES-industry in Germany between 2000 and 2018. The technology specific IO-vectors that were created from two of these approaches will be provided in the supplementary material for further discussion and use in the research community. The vectors for the production and installation of RES technologies in Germany are based on primary data from company surveys. The vectors for the operation and maintenance of RES plants in Germany are based on questionnaire-based interviews with experts from companies active in the respective markets.
This paper focuses on the development of gross employment (direct and indirect employment), which reflects the employment attributable to the activities of the built-up and operation of renewable energy plants. Employment has been chosen as the main indicator representing economic activity connected to the built-up of the RES industry in Germany mainly for two reasons: (1) The total input requirements for labor calculated with the input–output approach encompass all stages of the value-added chain. (2) Employment is easier to comprehend and to communicate than other economic indicators like e.g., gross production or gross value added. Focusing on gross employment has some merits but also important drawbacks. Gross employment gives a broad picture of economic resources committed to facilitate the built-up of RES industry and to put it in perspective to other economic activities and the economy as a whole. With this it allows for the monitoring of the development of the RES industry due to the expansion of renewable energy technologies in a country. However, this approach neglects possible negative employment effects that are relevant from an economy-wide point of view, such as the budget or substitution effect. Therefore, this approach cannot inform about the overall economy-wide economic effects of the built-up of RES-industries. The balance of the economy-wide effects (positive and negative), generally called net effects, are essential to assess the advantageousness of economic policy measures e.g., the policy measures to foster the diffusion of RES technologies in Germany. This important strand of analysis is not addressed in this study. However, it should be noted, that the methods and results presented regarding gross employment form an indispensable set of information for studies on net employment effects (e.g., technology-specific IO-vectors). Based on the generated data set presented in this study, net employment effects have been analyzed in a series of studies [14,15,16,17,18,19]. The results hint to small, but under most assumptions, positive net employment effects induced by the expansion of RES-technologies in Germany.
Next to the methodological input, this study provides detailed insights into the developments of different RES-sectors in Germany and the role of different areas of business activity. It contributes a set of economic indicators over a period of almost 20 years for the RES-industry in Germany, starting from the status of infant industry to a mature, consolidating industry that can be used for further analysis (detailed data-sheets are provided in the supplementary material). The overall comparability of the gross employment figures between years is provided by adjustments to the IO-vectors for each year according to the official input-tables for Germany.
Altogether, this study aims to shed insights in the determination of gross employment effects of RES in Germany in order to improve the understanding and transparency of figures communicated by the German government. In addition, it aims to improve the discrepancy that most literature on RES-employment has not been published in peer-reviewed journals [10] and therefore often does not contribute to the global academic discourse. The hope is that a better understanding of German employment figures will improve the comparison done in other publications, such as IRENA [20] as well as EurObserv’ER [21]. The overall intention is to provide data-driven, methodologically sound input for the political debate on economic implications of the support of new technologies over a comparably long period of investigation.
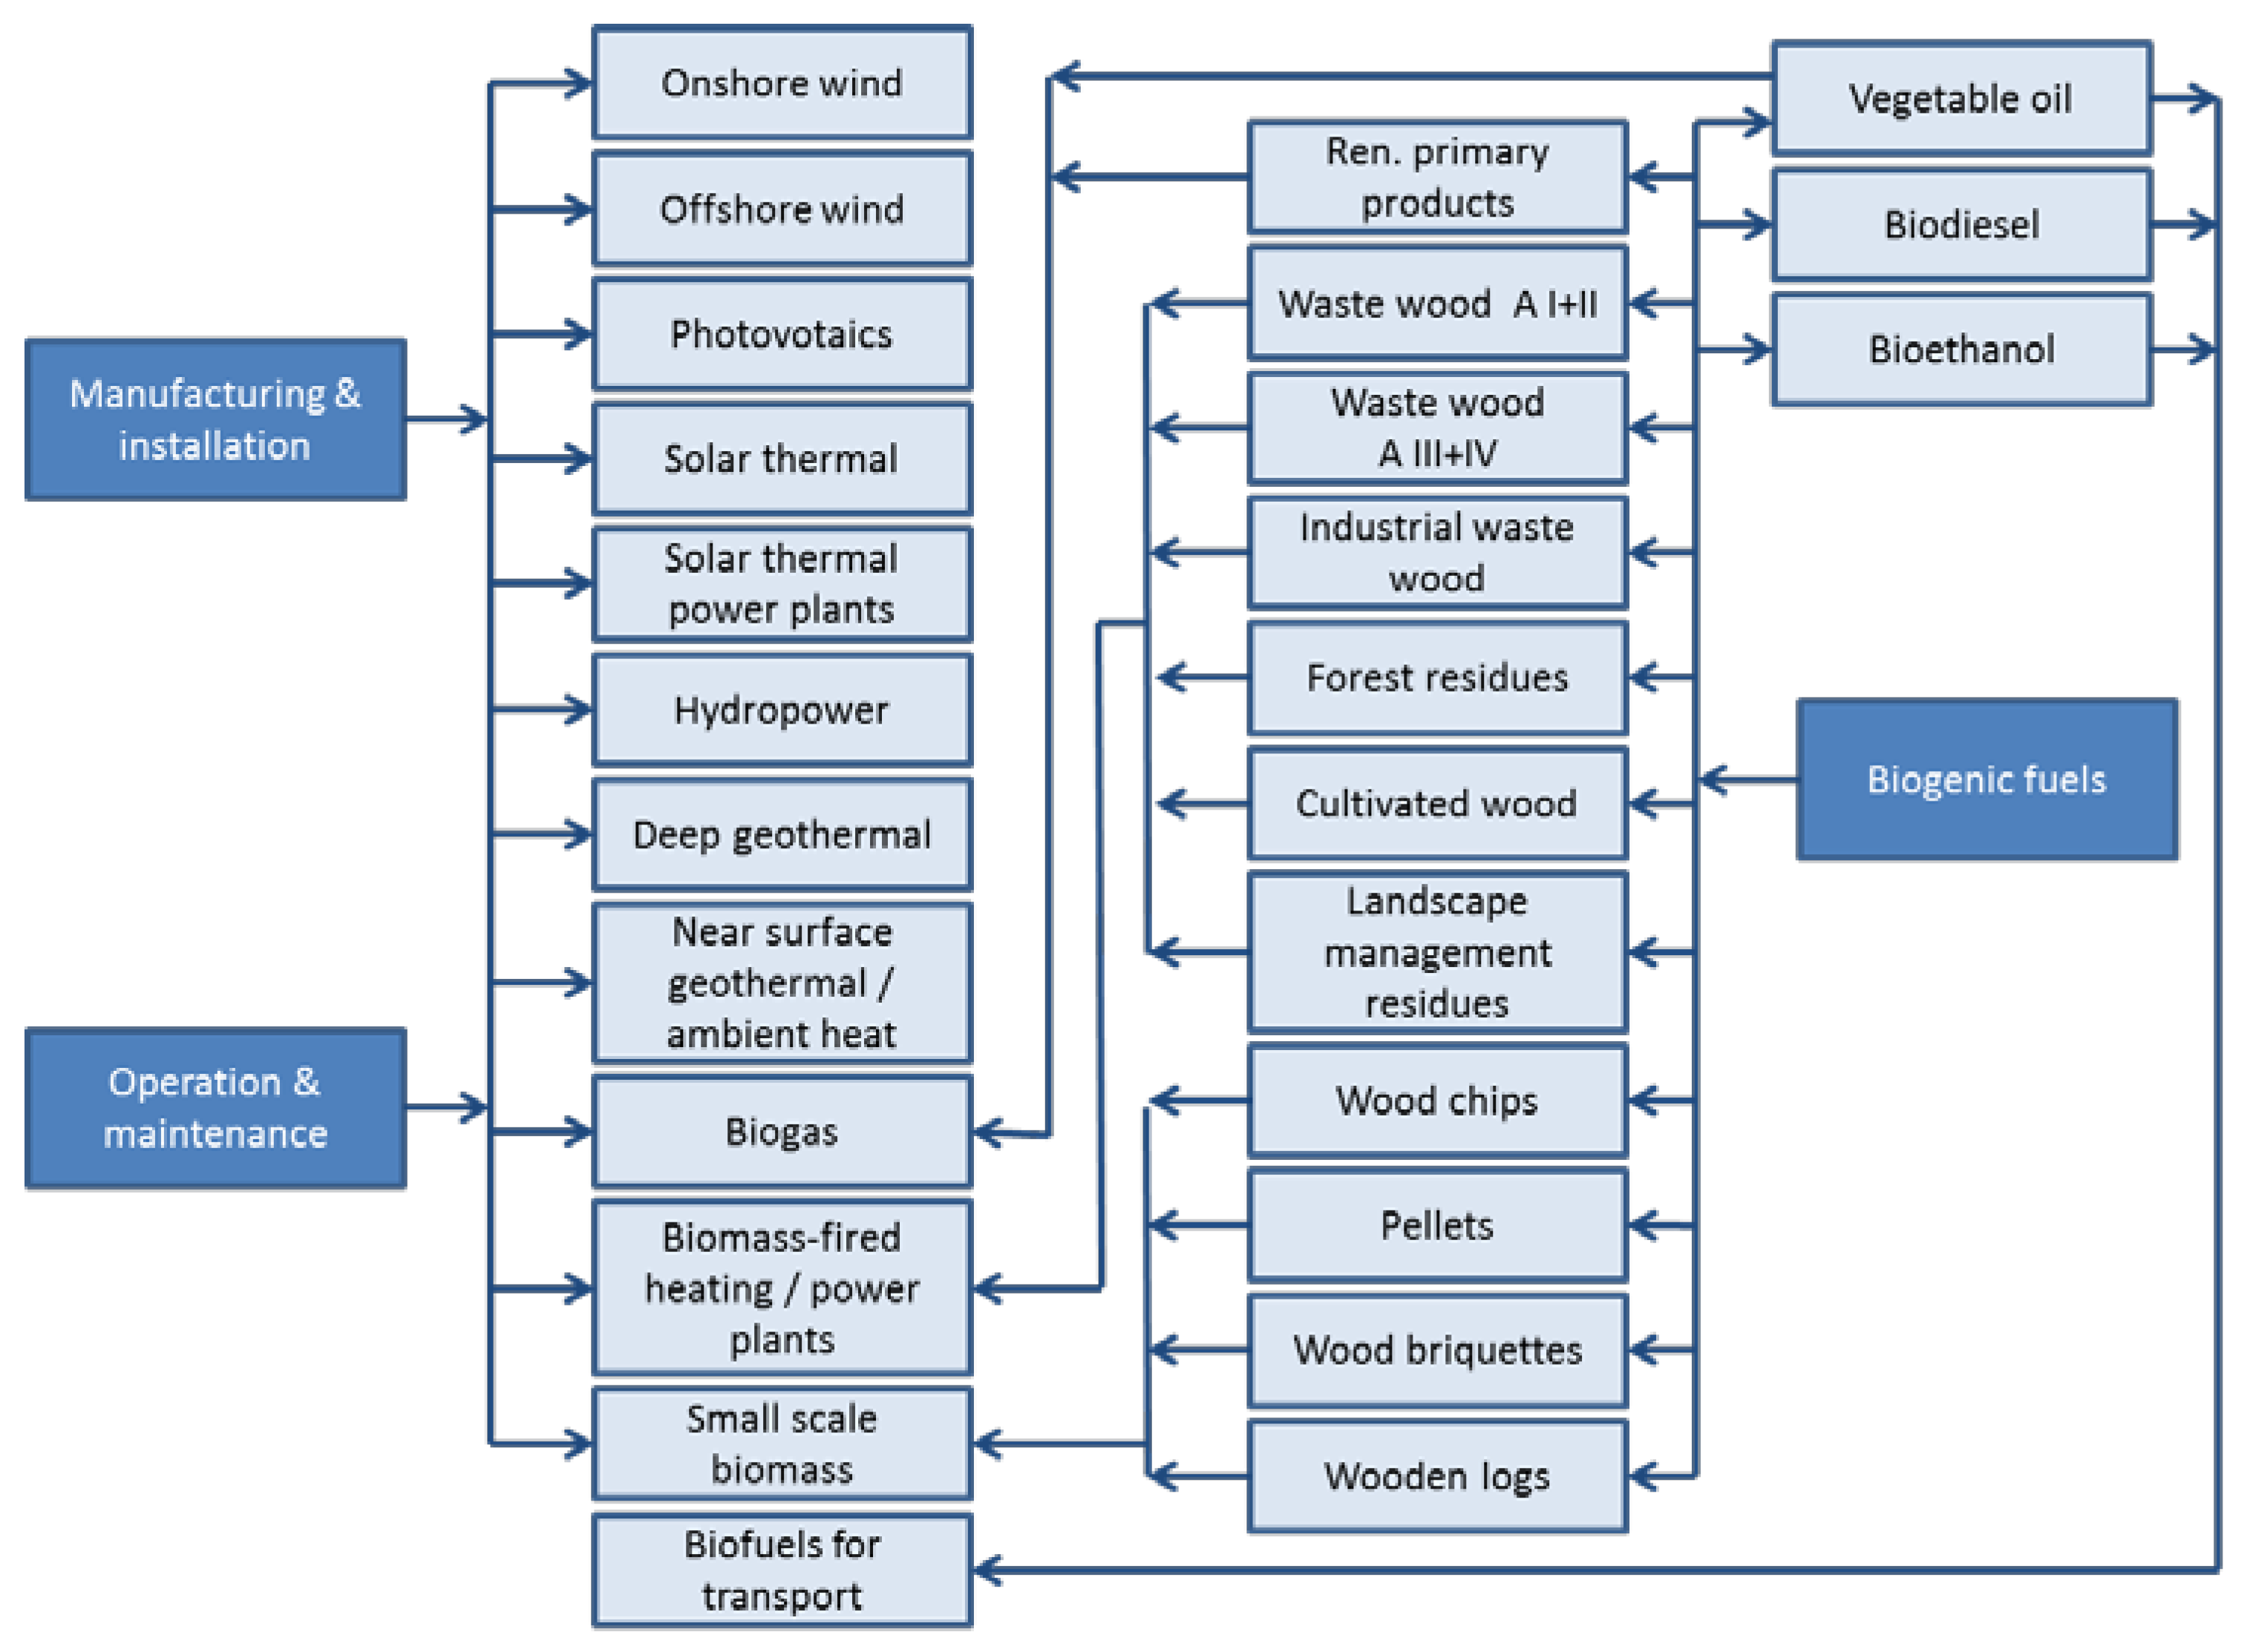
Three different areas of entrepreneurial activity will be taken into consideration—the manufacturing and installation of new RES-capacities, the operation and maintenance of existing RES-capacities, as well as the provision of biogenic fuels for stationary plants and the transport sector. Regarding the technological differentiation of RES-plants, 12 different sectors have been taken into consideration; eight power technology sectors, three heat technology sectors and one transport sector (see Figure 1). The sectors that cover the eight power technologies also include combined heat and power technologies (wind onshore, wind offshore, photovoltaics, solar thermal power plants, hydropower, deep geothermal, biogas including installations for the use of liquid biomass, biomass-fired heating/power plants). The only sector that also includes pure heat technologies is the one for biomass-fired heating/power plants. The reason for this aggregation lies in the structure of the industry. The differentiation of this sector was not feasible as the companies providing the technologies are the same. However, three more technologies that are only used for heating purposes could be distinguished from their respective counterparts for electricity generation—solar thermal, near surface geothermal/ambient heat and small-scale biomass. For all these 11 sectors, manufacturing and installation are considered. In addition, operation and maintenance have been taken into account for 10 out of the 11 sectors. As solar thermal power plants are not built in Germany, due to the low solar irradiation, operation and maintenance are not relevant for this sector in Germany. The provision of biogenic fuels for the operation of biomass applications has also been taken into consideration for a wide range of different biomass fractions. Renewable primary products like corn are taken into consideration as input for biogas plants. Vegetable oil is used in installations for the use of liquid biomass. Different kinds of waste wood, forest residues, cultivated wood, and landscape management residues are taken into consideration for biomass-fired heating/power plants. Wood chips, pellets, wood briquettes and wooden logs have been considered for the use in small scale biomass technologies. Besides the 11 power and heat technology sectors one sector is specifically aimed at the transport sector—biofuels for transport. This sector only covers the provision of biogenic fuels and includes vegetable oil, biodiesel and bioethanol.
Section 2 describes the methodology as well as the data used to determine the employment in the various RES-sectors. In Section 3 the time series of employment, as well as other economic indicators, will be presented. In addition, some background information will be provided that explains the developments. The discussion in Section 4 will provide a summary of the methodological conclusions as well as conclusions on the development of the RES-industry in Germany.

2. Methodology

2.1. Input–Output Modeling Approach Using Extended Input–Output Tables

The method used in this study follows the input–output (IO) modeling approach [22,23], namely the open static IO-model. In comparison to other modeling approaches this method makes it possible to comprehensively determine the economic activities. The framework of the model allows for the consideration of the activities directly related to RES investments, as well as the activities indirectly triggered in the upstream production stages (indirect effects in terms of input–output-Analysis). The same applies to activities in operation and maintenance.
A disadvantage of the IO-model compared with other approaches is the disaggregation level of the underlying IO-framework. German input–output tables represent the economy in 71 production sectors [24]. As mentioned above, the RES-sector is not explicitly represented as a separate sector in existing input–output tables. Instead, RES-companies and their activities are accounted for in established sectors of the existing IO-table. It can be assumed that producers of RES-technologies are predominantly allocated to the sectors “Machinery and equipment n.e.c.” and “Electrical equipment”. Big companies like Siemens, Bosch, ABB and Alstom that are classified with their respective production in the above-mentioned sectors strongly influence the structure of these sectors in Germany. Contrary to this, the manufacturers of RES-systems based in Germany were often startups or small and medium-sized enterprises specializing in these new technologies. The results of a company survey show, that even in 2012 when the German RES-market had reached its all-time high the corporate structure was still very strongly characterized by medium-sized companies [18].
Therefore, we conclude that RES-companies’ input structures are not adequately represented by the IO-tables’ existing sectors for Germany. As a consequence, additional IO-vectors for each area (production including installation, O&M) were created for all 11 RES technologies to complement the existing IO-table for Germany (see supplementary material). Therefore, 22 new sectors were added. Mapping a new sector in an existing IO-table requires that the input vector and the output vector be to be specified according to the sectoral disaggregation (71 sectors) of the IO-table (see Figure 2). The input vector describes the cost structure of the sector, namely the procurement of domestic intermediate goods from each of the existing 71 sectors, the procurement of imported intermediate goods as well as gross value added of the sector itself. The output vector describes the sales structure of the sector, namely the sale of products as intermediate goods to other domestic sectors and the sale of products as final demand goods to domestic and foreign buyers.
The data requirements to establish an IO-vector are quite high and the necessary data regarding the new RES-sectors in Germany are not specifically made available by the Federal Statistical Office. Therefore, company surveys were conducted in order to create technology specific IO-vectors for the manufacturing and installation of new RES-plants. Over the course of time three company surveys were carried out each containing approximately 1200 companies in Germany covering the years 2004, 2007 and 2012. The market coverage of each of these surveys was different in each year and between technologies. The highest average market coverage could be achieved in 2004 with the participation of companies that covered approximately 70% of the domestic demand of final products. In 2007 an average coverage of 61% was reached and in 2012, manufacturers which covered 47% of the domestic demand provided their input. However, it has to be taken into consideration that the RES-industry in Germany saw rapid development in this timeframe. The domestic demand almost doubled between each of the respective years (see below). Market coverage for the most important sectors in Germany, wind and photovoltaics, was well above average in each survey. The most difficult sectors were in the area of solid biomass. The willingness of conventional power plant manufacturers, who are often active in the field of large-scale biomass plants, to participate in the surveys was very low in all three years. With regard to small-scale biomass plants, the challenge was that many of these plants are provided by very small companies such as stove and fireplace builders. Good market coverage in this area would, therefore, require a much larger sample [14,16,18].
Information on added value was gathered from manufacturers based on detailed lists containing components of various RES-plants. Focus was placed on gathering information on the procurement of intermediate goods from domestic sources and from abroad. In the course of creating the new IO-vectors, supplementary information was included as well. The technical structure of each RES-system was taken into consideration in order to undertake a cost allocation of components as well as an allocation of these components to other sectors in the IO-framework. In addition, supplementary information from the existing IO-table such as uncritical/supplementary intermediate inputs was used. These inputs, such as the need for electricity or stationery, could not be determined in the company survey due to its fragmentation. The information was therefore taken from existing IO-sectors that are closely related to the sector under investigation with respect to their underlying production processes [14,16,18,25].
The derived cost structures were kept unchanged until new survey-based data became available (e.g., in 2012) or unless major structural discontinuity occurred in specific industries like the photovoltaics (PV) industry. Due to the fact that most German solar cell production was closed down, the shares of solar cell production from Germany in the IO-vector was largely shifted to imports from abroad (see below). However, even if the cost structure was kept unchanged we use the most recent available IO-table for Germany in each year of calculation. In Germany official IO-tables are available annually, although the availability has a time lag of three to four years (in 2020 the most recent input–output-table reports the year 2016). Therefore, we used technology-specific IO-vectors that were embedded in the most recent official IO-table of Germany for each year under investigation.
The IO-vectors for the operation and maintenance (O&M) of RES-plants were created less elaborately. Like the IO-vectors on manufacturing and installations they were constructed as an extension to the existing IO-table for Germany. The main difference is that the empirical construction of the cost structures was not based on surveys. Instead, they were defined primarily as weighted averages of existing sectors for which technological proximity of production processes could be identified. Expert information from literature on technological features was used to modify the resulting cost structures for each RES technology. This approach was chosen as it was assumed that the cost structures and added value in these areas of RES-activity would be similar, but not identical to respective other sectors. However, a series of questionnaire-based expert interviews were conducted in 2012 to learn more about the cost structure of the operation and maintenance of RES-plants [18]. This additional information was used to improve the representation of O&M activities by updating the cost structure of the respective sectors. Again, the cost structure was kept unchanged while the underlying IO-table was updated accordingly for each year.
A detailed analysis of the provision of biomass and biofuels was completed in Lehr et al. [16] which took into account all the biofuel sectors described in Figure 1. The main focus of this analysis was on the sectoral structure of the supply side as well as the foreign trade of each of these 14 biogenic fuel fractions. It was not feasible to create specific IO-vectors (as for production and O&M of RES-facilities) for the large variety of fuel fractions, especially as they could not be applied to the analysis of the net employment effects in the later stage of the project. Instead, a sectoral structure of the supply is established for the different biogenic fuel fractions und applied to the available official German input–output tables. This approach reflects the lack of data and the variety of processes in this area (in [26] this approach is labeled as “synthetic industry” approach).

2.2. Estimating Employment by Using Labor Coefficients

In IO analysis, the relationship between gross output and employment effects is facilitated by (sectoral) labor coefficients. Labor coefficients measure the sector-specific labor required to produce one unit of gross output. Conceptually labor coefficients are the reciprocal value of labor productivity, usually used in national accounts where it is defined as the ratio of gross domestic product (GDP) to the input of labor (measured by the number of persons employed or by the number of hours worked). Labor coefficients for existing sectors in the IO table are available from official data [24]. The labor coefficients of the newly created RES-sectors must be estimated from available information, namely based on added value and wages differentiated by qualification level. Before the results of the second company survey became available in 2007, the annual change of labor coefficients in RES sectors were estimated mainly based on productivity gains in other sectors [14,27]. This proved inadequate as data from the second survey became available and indicated a significant increase in labor productivity in RES-sectors between 2004 and 2007 which was not represented by the average increase of productivity in existing sectors. This circumstance can be explained by the early development stage of most RES-technologies in the years prior to 2004 and the significant achievements in production technologies that were triggered by the market demand for RES-technologies that picked up around that time. It can be assumed that learning by doing, economies of scale and the starting of automation in production processes resulted in accelerating labor productivity in RES industries. Therefore, labor productivity in the phase between 2004 and 2007, was interpolated based on the findings from the company surveys.
Due to this experience regarding the development of labor productivity, a more careful approach was chosen regarding the preliminary results of the RES-employment in the years after 2007 [28,29]. In general, the labor coefficients were updated annually based on intraindustry developments and productivity trends in sectors with technological proximity.
The years between 2007 and 2012 were particularly interesting in the PV sector. The prices for PV-systems in Germany went down by 65% in this time period, while market demand went from 1.2 GW in 2007 to 8.2 GW in 2012. In addition, solar cell and module production was ramped up significantly in this timeframe; this was followed by the market exit of many German manufacturers. Starting at about 700 MW in 2007, production in Germany increased to about three gigawatts in 2011 and then declined to about 2.1 GW in 2012. Due to various indicators like production output, workforce and profits that were reported in the corporate communication of some of the central PV-companies in Germany, it was assumed that labor productivity declined in this time frame. The RES-employment derived from this approach has proven to have been quite solid as the results that came out of the next company survey from the year 2012 did not deviate strongly from the estimated development of the previous years. Therefore, labor productivity was used in the creation of the numbers presented in this study as it had been developed in the preliminary work. Another reason to stick with the preliminary approach was that a new industrial classification (WZ 2008) had been introduced by the German federal statistical office that did not allow for a direct comparison with previous years. This new industrial classification was applied to the IO-vectors for the determination of RES-employment with the availability of results from the company survey of the year 2012.

2.3. Derivation of Domestic Demand

The model-based determination of employment in the RES-sector is based on the domestic demand in each investigation area. As domestic demand is also not provided by official statistics, it had to be derived from the available data on the RES-development in Germany (see Figure 3).
Employment from the manufacturing and installation of new RES-plants results from the associated domestic production. Therefore, it is necessary to determine the effective domestic demand associated with the investment in each RES-technology. Investments in RES-technologies in Germany are derived from the extension statistics provided by the AGEE-Stat [30]. Average specific investment costs have been used as well as the average construction time of each technology in order to determine the investment for each respective technology and year [31]. To obtain the effective domestic demand from the investments, imported capital goods must be deducted from the investments. This is required as capital goods produced abroad and imported to Germany do not trigger production and employment in Germany. At the same time, effective domestic demand not only includes demand derived from domestic investment, but also foreign demand, which results in exports (see Figure 3).
The information used on foreign trade is primarily based on the results of the three previously mentioned company surveys conducted in 2004, 2007 and 2012 [14,16,18]. Foreign trade between the survey years was derived using an interpolation of the absolute values. The development between 2000 and 2003 as well as 2014 and 2018 was estimated based on external sources such as the foreign trade statistics of the Federal Statistical Office [32], the COMTRADE database of the UN [33] and the development of foreign RES-markets. In order to establish a consistent development of foreign trade over the entire period, the relative development of the various statistical sources was used. The absolute values of these statistics are not used since they do not have the same reference base as the products covered by the business surveys. For example, foreign trade statistics specifically list turbines for hydropower plants in different size classes, but other parts such as pumps cannot be traced directly. Therefore, this approach implicitly assumes that the development of the reported components is an indicator of the foreign trade development of other components of these plants. The foreign trade statistics of the Federal Statistical Office were used as the primary source as they are more up to date. At the same time, the COMTRADE database was subsequently required as it also covers the years 2000–2003.
Another restriction on the use of foreign trade statistics is that most RES-products are not listed separately in these statistics. Very often they are a subset of the represented goods in a category (dual-use problem). As it is not clear which role RES products play in these statistical categories, these databases can only be used to a limited degree. Therefore, external trade statistics are mainly used for hydropower (Destatis: WA84101100 Wasserturbinen und Wasserräder, bis 1000 kW; WA84101200 Wasserturbinen und Wasserräder, 1000–10,000 kW; WA84101300 Wasserturbinen und Wasserräder, über 10,000 kW; WA84109000 Teile von Wasserturbinen und Wasserrädern, Regler; COMTRADE: 8410 (Hydraulic turbines, water wheels, power <1000 kW; Hydraulic turbines, water wheels, power 1000–10,000 kW; Hydraulic turbines, water wheels, power >10,000 kW; Parts of hydraulic turbines and water wheels)) and onshore wind energy (Destatis: WA85023100 Stromerzeugungsaggregate, windgetrieben; COMTRADE: 850231 wind-powered generating) as the dual-use problem does not occur for the products relevant to the RES-technologies. The only foreign trade categories with a dual use problem that were taken into consideration are inverters and photosensitive semiconductor devices, which include photovoltaic cells and modules. Due to the outstanding developments in the PV-sector in Germany in the time period under consideration, we assume that the foreign trade development of this class of technologies is strongly influenced by the photovoltaic market development and, therefore, applicable to our purpose.
The development of foreign trade in other technologies, on the other hand, is estimated on the basis of the development of new installations in the European market. This applies in particular to solar thermal energy [34,35], near-surface geothermal energy and environmental heat [36] as well as to some extent photovoltaics (development of components other than cells, modules and inverters) [37]. Due to the lack of statistical data on the development of other renewable energy sectors in Europe, the foreign trade quotas resulting from the company surveys were maintained for the sectors deep geothermal energy, biomass-fired heat/power plants and small biomass plants. The survey result for 2004 forms the basis for the years 2000 to 2003. The results of the company survey of the year 2012 also covered information on the foreign trade development of 2013, which was used for the years 2014 to 2018. In the biogas and wind offshore sector, this approach was abandoned for the years 2014 to 2018. Based on expert interviews as well as the new installations in offshore wind energy in Europe [38], the volume of orders from abroad was regarded as stable, which is why the total export in 2013 was carried forward to the following years. Other information used to identify or verify domestic demand was the market distribution of wind turbine producers [39,40] and production volumes of photovoltaic components [41,42]. In addition, a detailed analysis of the development of offshore projects in Germany was carried out, helping to identify the companies involved in each project as well as the course of the construction. In case of solar thermal power plants, an analysis of global projects was conducted to identify the involvement of German producers. These two analyses were used directly to derive domestic demand in these sectors.

2.4. Derivation of the Domestic Demand for Operation and Maintenance of RES Facilities

The determination of gross employment in the case of O&M is based on the costs of these services. According to the results of the expert interviews in Lehr et al. 2015, the costs of operation and maintenance are determined on the basis of a technology-specific, proportional share of the investments. This share strongly depends on each individual technology and ranges between 1% of the investment costs per year for PV, solar thermal and small-scale biomass installations to 5.5–6% for offshore wind, biomass-fired heating/power and biogas plants [18]. Regarding the foreign trade of O&M services for RE-installations in Germany, there are no reliable statistical findings. Overall, it can be assumed that an exchange of services takes place only in border regions. However, it is not possible to estimate what the overall balance looks like. Therefore, it was assumed that the demand for O&M services is entirely provided by domestic employees. The same approach was taken for the installation and construction works during the construction of new plants.

2.5. Employment Related to the Provision of Biomass and Biogenic Fuels

The employment attributed to the provision of biomass and biogenic fuels was determined with different approaches during the investigation period. The years 2007 to 2013 were investigated in a very detailed way. The domestic demand was derived from the physical use of the various biogenic fuels and their average costs per unit. The foreign trade of each of those biogenic fuels was deducted from information supplied by various sources, most of which held information regarding foreign trade or domestic production [16,18]. The approach taken for the years 2004 to 2006 was much less detailed as the database for these years was by far not as differentiated as in the years that followed [14,27]. A rough estimate regarding the demand for biogenic fuels was conducted, which only distinguished between biomass and biofuel provision. The employment attributed to this demand was then derived from the German IO-vector for “Products of agriculture, hunting and related services”, but rescaled by a factor, as the production of “energy plants” requires less labor input than the average product portfolio of agricultural products. Finally, employment derived for the years 2000 to 2003 and 2014 to 2018 was simply extrapolated without using IO-calculations. The indicators that were used to conduct this extrapolation included the development of cultivated areas, domestic production, foreign trade and labor productivity for the relevant sectors of the German IO-table [43]. We are aware that extrapolation seems quite risky. However, the detailed analysis of the years 2004–2013 led us to believe that the risks are limited as the most important drivers of the development are taken into consideration.
By using domestic demand in combination with labor productivity, gross employment can be determined via the respective IO-calculations. Another indicator that can be derived from the IO-framework is gross production. It measures the direct and indirect production (gross production as sum) necessary to meet the estimated effective domestic demand (see Figure 3).

3. Results

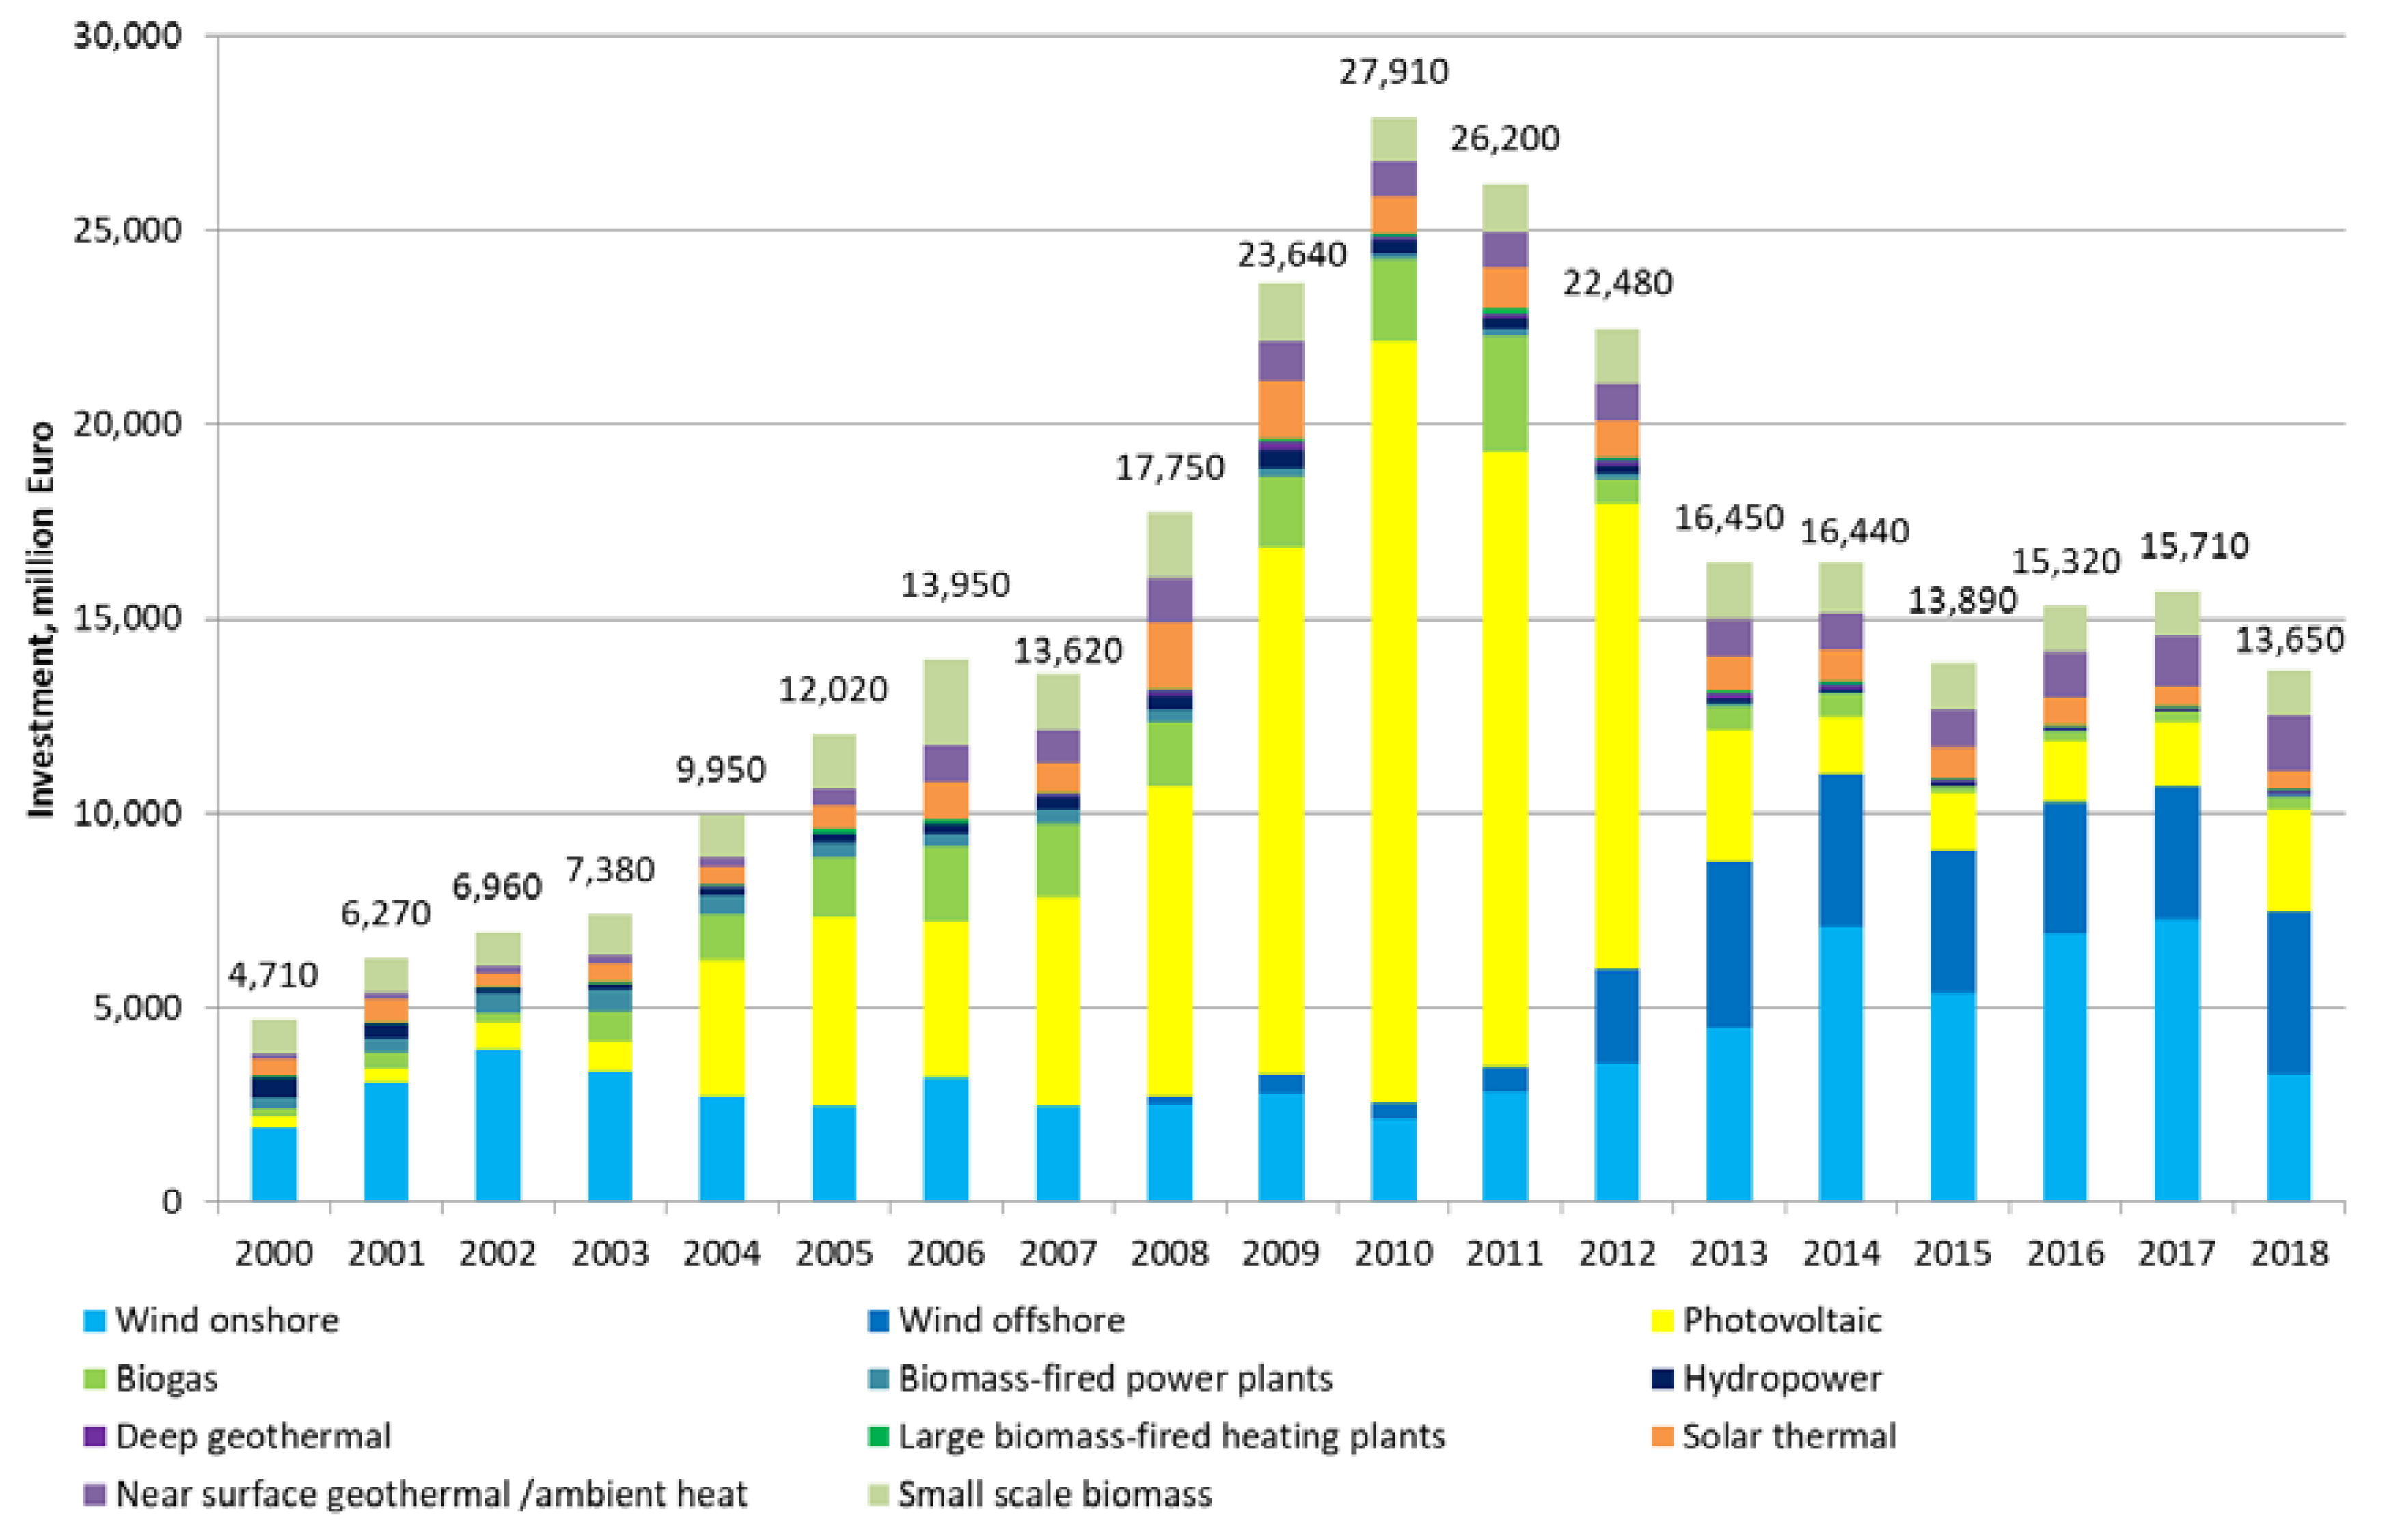
The development of RES-technologies in Germany can be observed from the investment undertaken (see Figure 4). These investments were strongly driven by market-pull instruments [44,45]. Especially the Renewable Energy Sources Act (EEG) for RES-power generation systems that was introduced in 2000 as well as its predecessor the “Stromeinspeisegesetz” from 1991 had a strong effect on the German RES-market development. More than 81% of the investments in RES-technologies between 2000 and 2018 were in electricity generation technologies, most of which were within the scope of the EEG. Only about 19% of the investment could be allocated to technologies exclusively used for heating. The ones that were eligible under a promotion scheme were primarily supported via the Market Incentive Program, which facilitates investments via state subsidies. As this program is dependent on the national budget, this support mechanism has proven to be not as stable as the EEG, which is paid by a levy from the electricity customers.
This instability was experienced in May 2010 when an unexpected budget freeze was imposed on the Market Incentive Program. However, this budget freeze was maintained for less than two and a half months, the investment momentum in the heating sector was slowed down with a lasting effect. As a result, some manufacturers of RES-heating systems have tried to become independent of government market support schemes in order to achieve a more stable development in demand.
In the field of RES-power generation plants, the EEG has been a comparatively reliable support framework for many years. However, this legal framework has also led to a number of uncertainties, which are reflected in the development of RES-investment. Over the course of time, it has repeatedly been possible to observe an increase or decrease in investment activity triggered by changes in support under one of the seven amendments of the EEG. One example is the biogas sector. The prospect of an improvement in support conditions in mid-2008 led to a postponement of investments in this sector. In 2011, on the other hand, investments were brought forward, as deterioration in support conditions was to be expected. Another example is the PV sector. Even though PV would be expected to have the highest installation rates during the summer due to weather conditions, its yearly peak was found to be in December shortly before the digression of the feed-in tariffs [46]. Therefore, it can be said that investments in a market backed by support instruments present the industry with the challenge of dealing with constantly changing market conditions and developments.
Altogether more than 284 billion euros was invested in RES-technologies in Germany in the period between 2000 and 2018. The major amount went into photovoltaics as well as wind energy technologies, which accounted for a share of 35% each (approx. Euro 100 billion).
Yearly investments in RES-technologies in Germany increased continuously in the period from 2000 to 2010 with the exception of 2007. The main driver for the sharp increase in investments was photovoltaics (PV), which nearly quadrupled its investment volume. Between 2011 and 2013, there was a significant reduction in investments, again primarily related to the PV-sector. In 2011 and 2012, this development was exclusively attributable to the sharp decline in this technology’s specific investment costs, while installations remained at an all-time high of about 7–8 GW. In contrast, just under one-third of the installed capacity of the previous year was added in 2013. A similar course of investment activities, albeit at a much lower level, could be observed in the biogas sector during this period. However, the significant increase in investment in the offshore wind sector prevented the decline in total investment between 2012 and 2013 from being even more dramatic. Overall, investments have been comparatively stable since 2013 at a level between 14 and 16 billion euros.
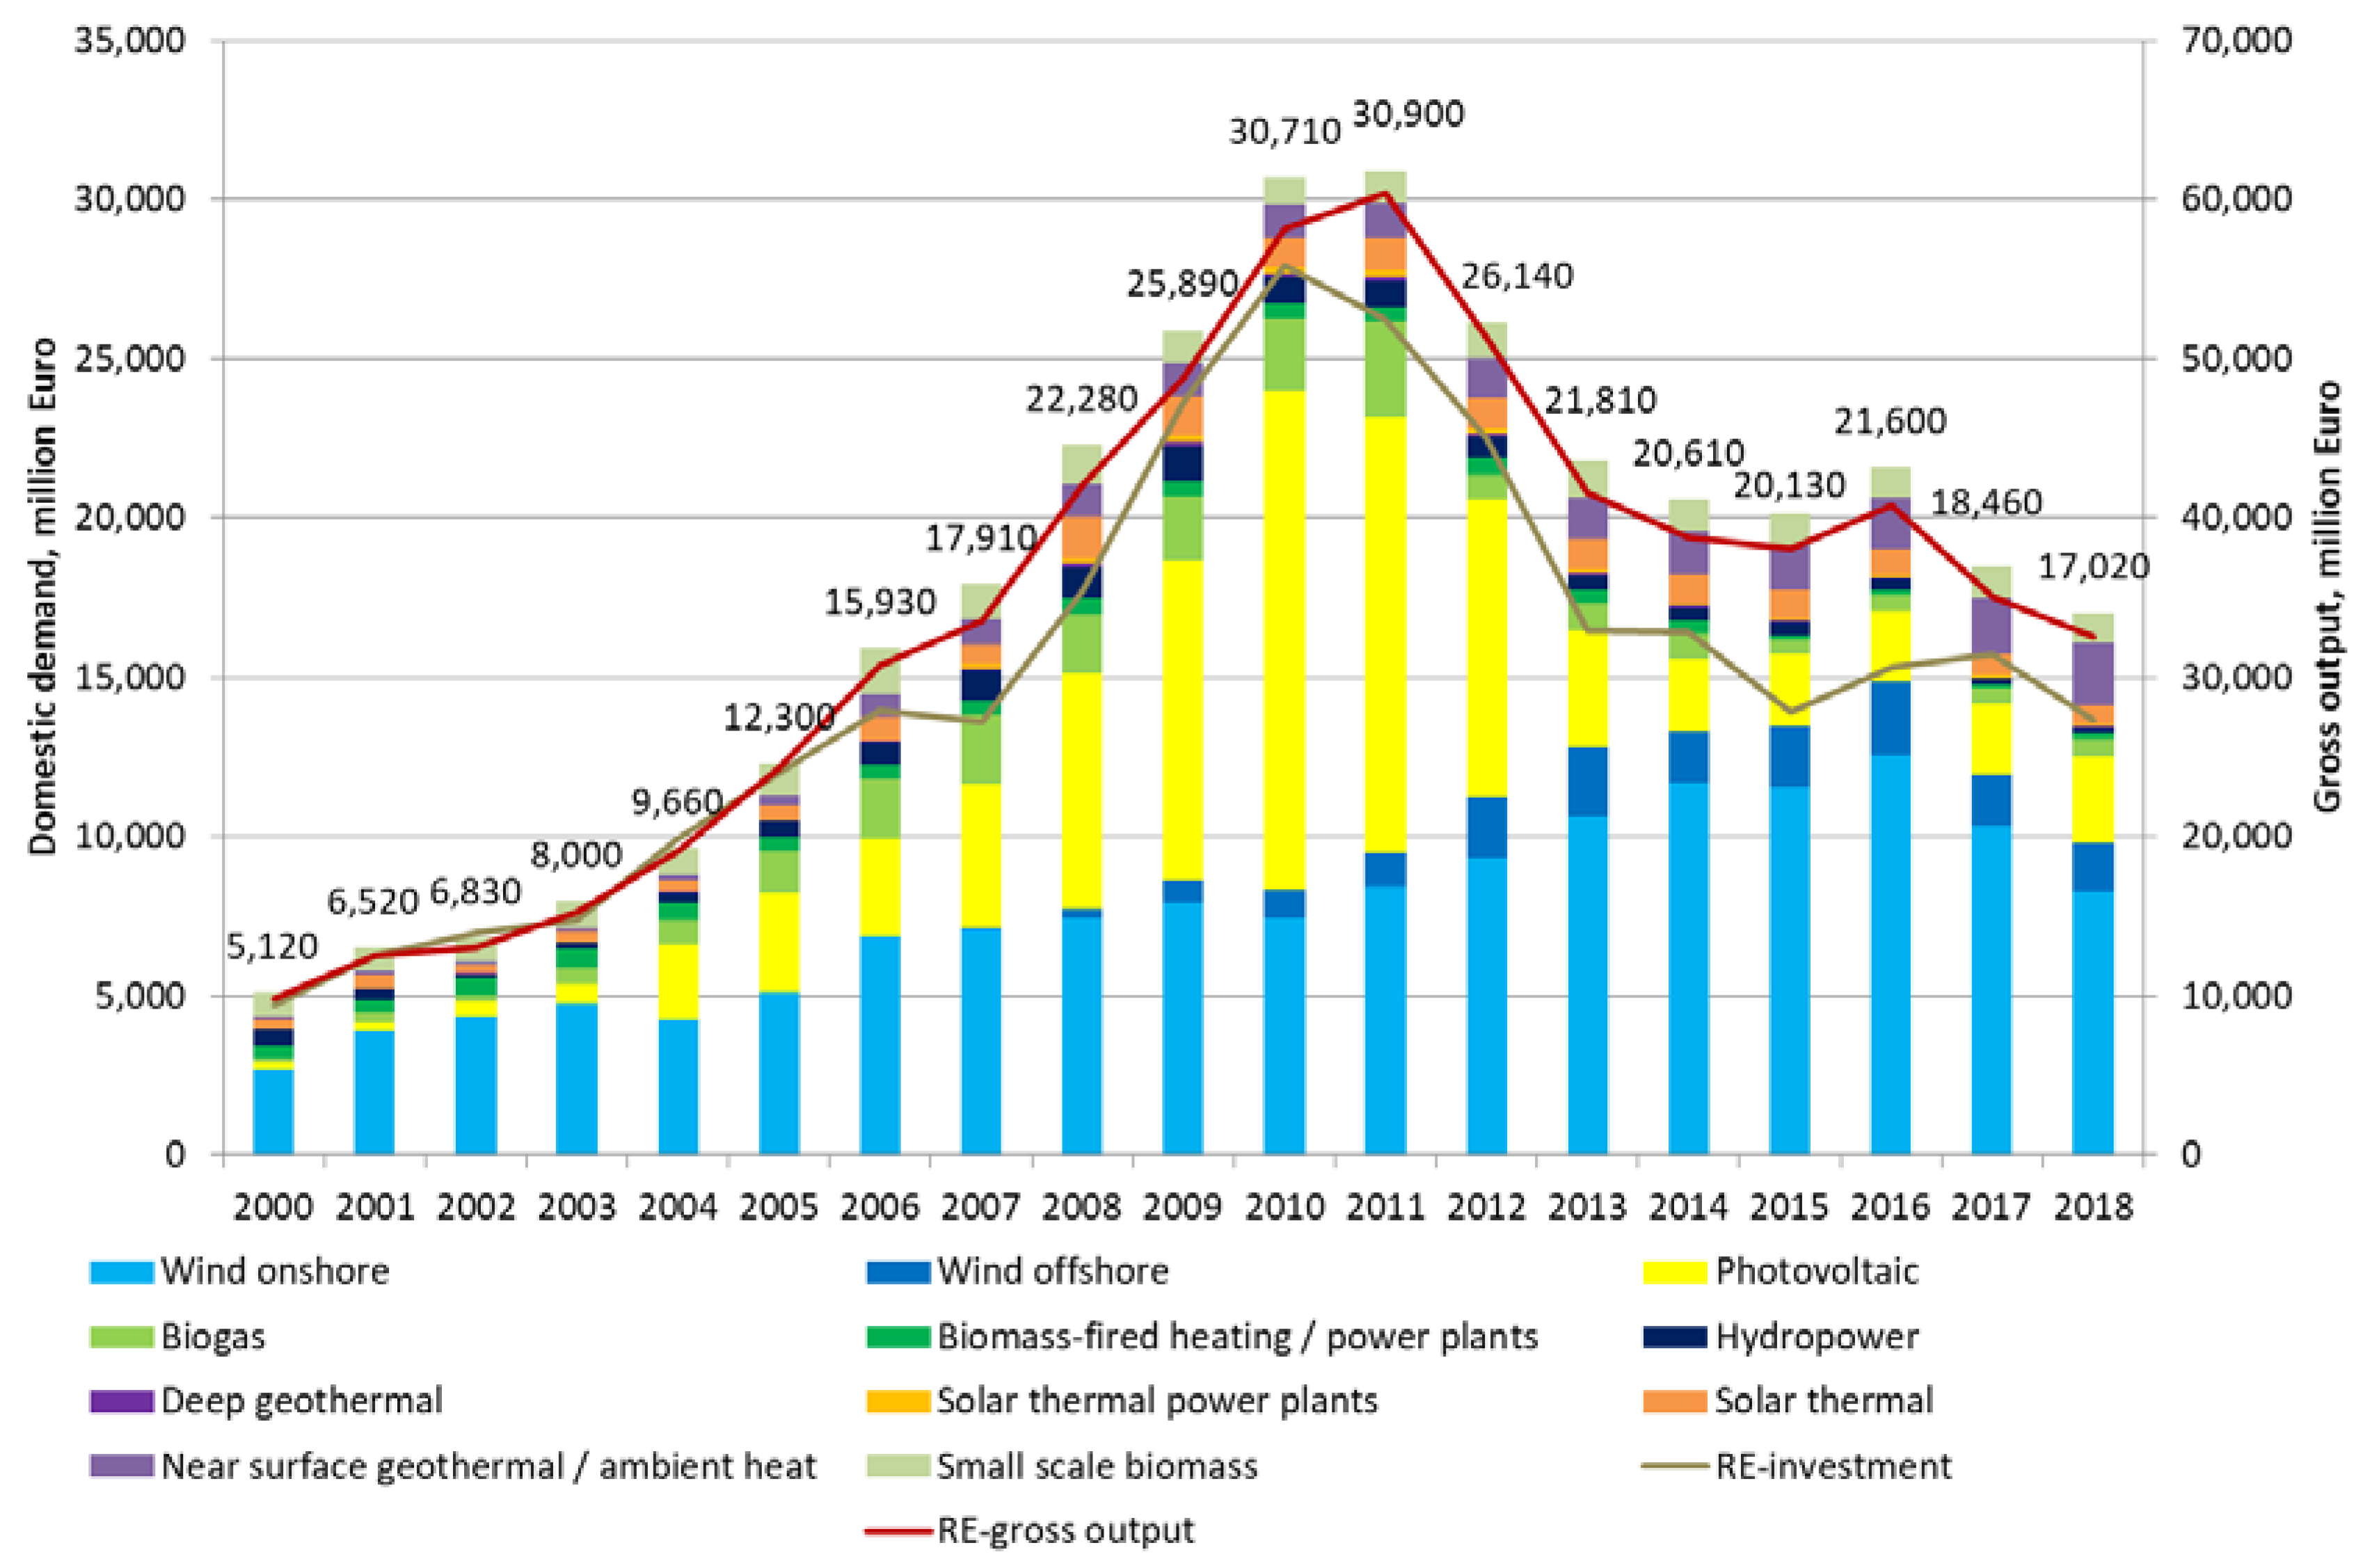
The domestic demand for RES-plants and components in Germany derived from investments and foreign trade is shown in Figure 5. All-in-all, just under 338 billion euros could be determined for the years 2000 to 2018. The largest share of domestic demand with about euros 161 billion (48%) was provided by the wind sector, followed by the PV-sector with 86 billion euros (25%).
Starting from around 5 billion euros in 2000, domestic demand for RES-installations rose to just under 31 billion euros in 2010 and 2011. The decline, mainly induced by the developments in the PV-industry between 2011 and 2013, resulted in a domestic demand of around 21 billion euros annually between 2013 and 2016. In 2017/2018, there was a further decline in domestic demand to around euros 17 billion euros.
Gross output, which is determined via the IO-framework, was almost twice as high as domestic demand over the whole time period under consideration.
Comparing Figure 4 and Figure 5, a difference in the technological representation becomes apparent. The sectors of biomass-fired power plants and large biomass-fired heating plants that are individually represented in Figure 4 are combined into one sector in Figure 5. As mentioned before, this is due to the industrial structure of this technology, which does not allow a differentiation between the electricity and heat sector. In addition, the sector of solar thermal power plants appears in Figure 5, which is not taken into consideration in Figure 4 since there are no investments in this technology in Germany.
Comparing the development of domestic demand and the development of investments in renewable energy plants in Germany, the overall development pattern appears to be quite similar. Differences are mainly based on shifts between domestic and foreign demand. While investments declined slightly between 2006 and 2007, companies were able to realize further growth in exports, which led to an increase in domestic demand in 2007. Exports were still able to offset the decline in investments in 2011, whereas from 2012 onwards, a consolidation took place, which affected the PV and biogas sectors in particular. Investments in Germany rose from 2016 to 2017, while domestic demand declined. This development is attributable to a significant decline in exports in 2017, which could not be offset by the increase in investments.
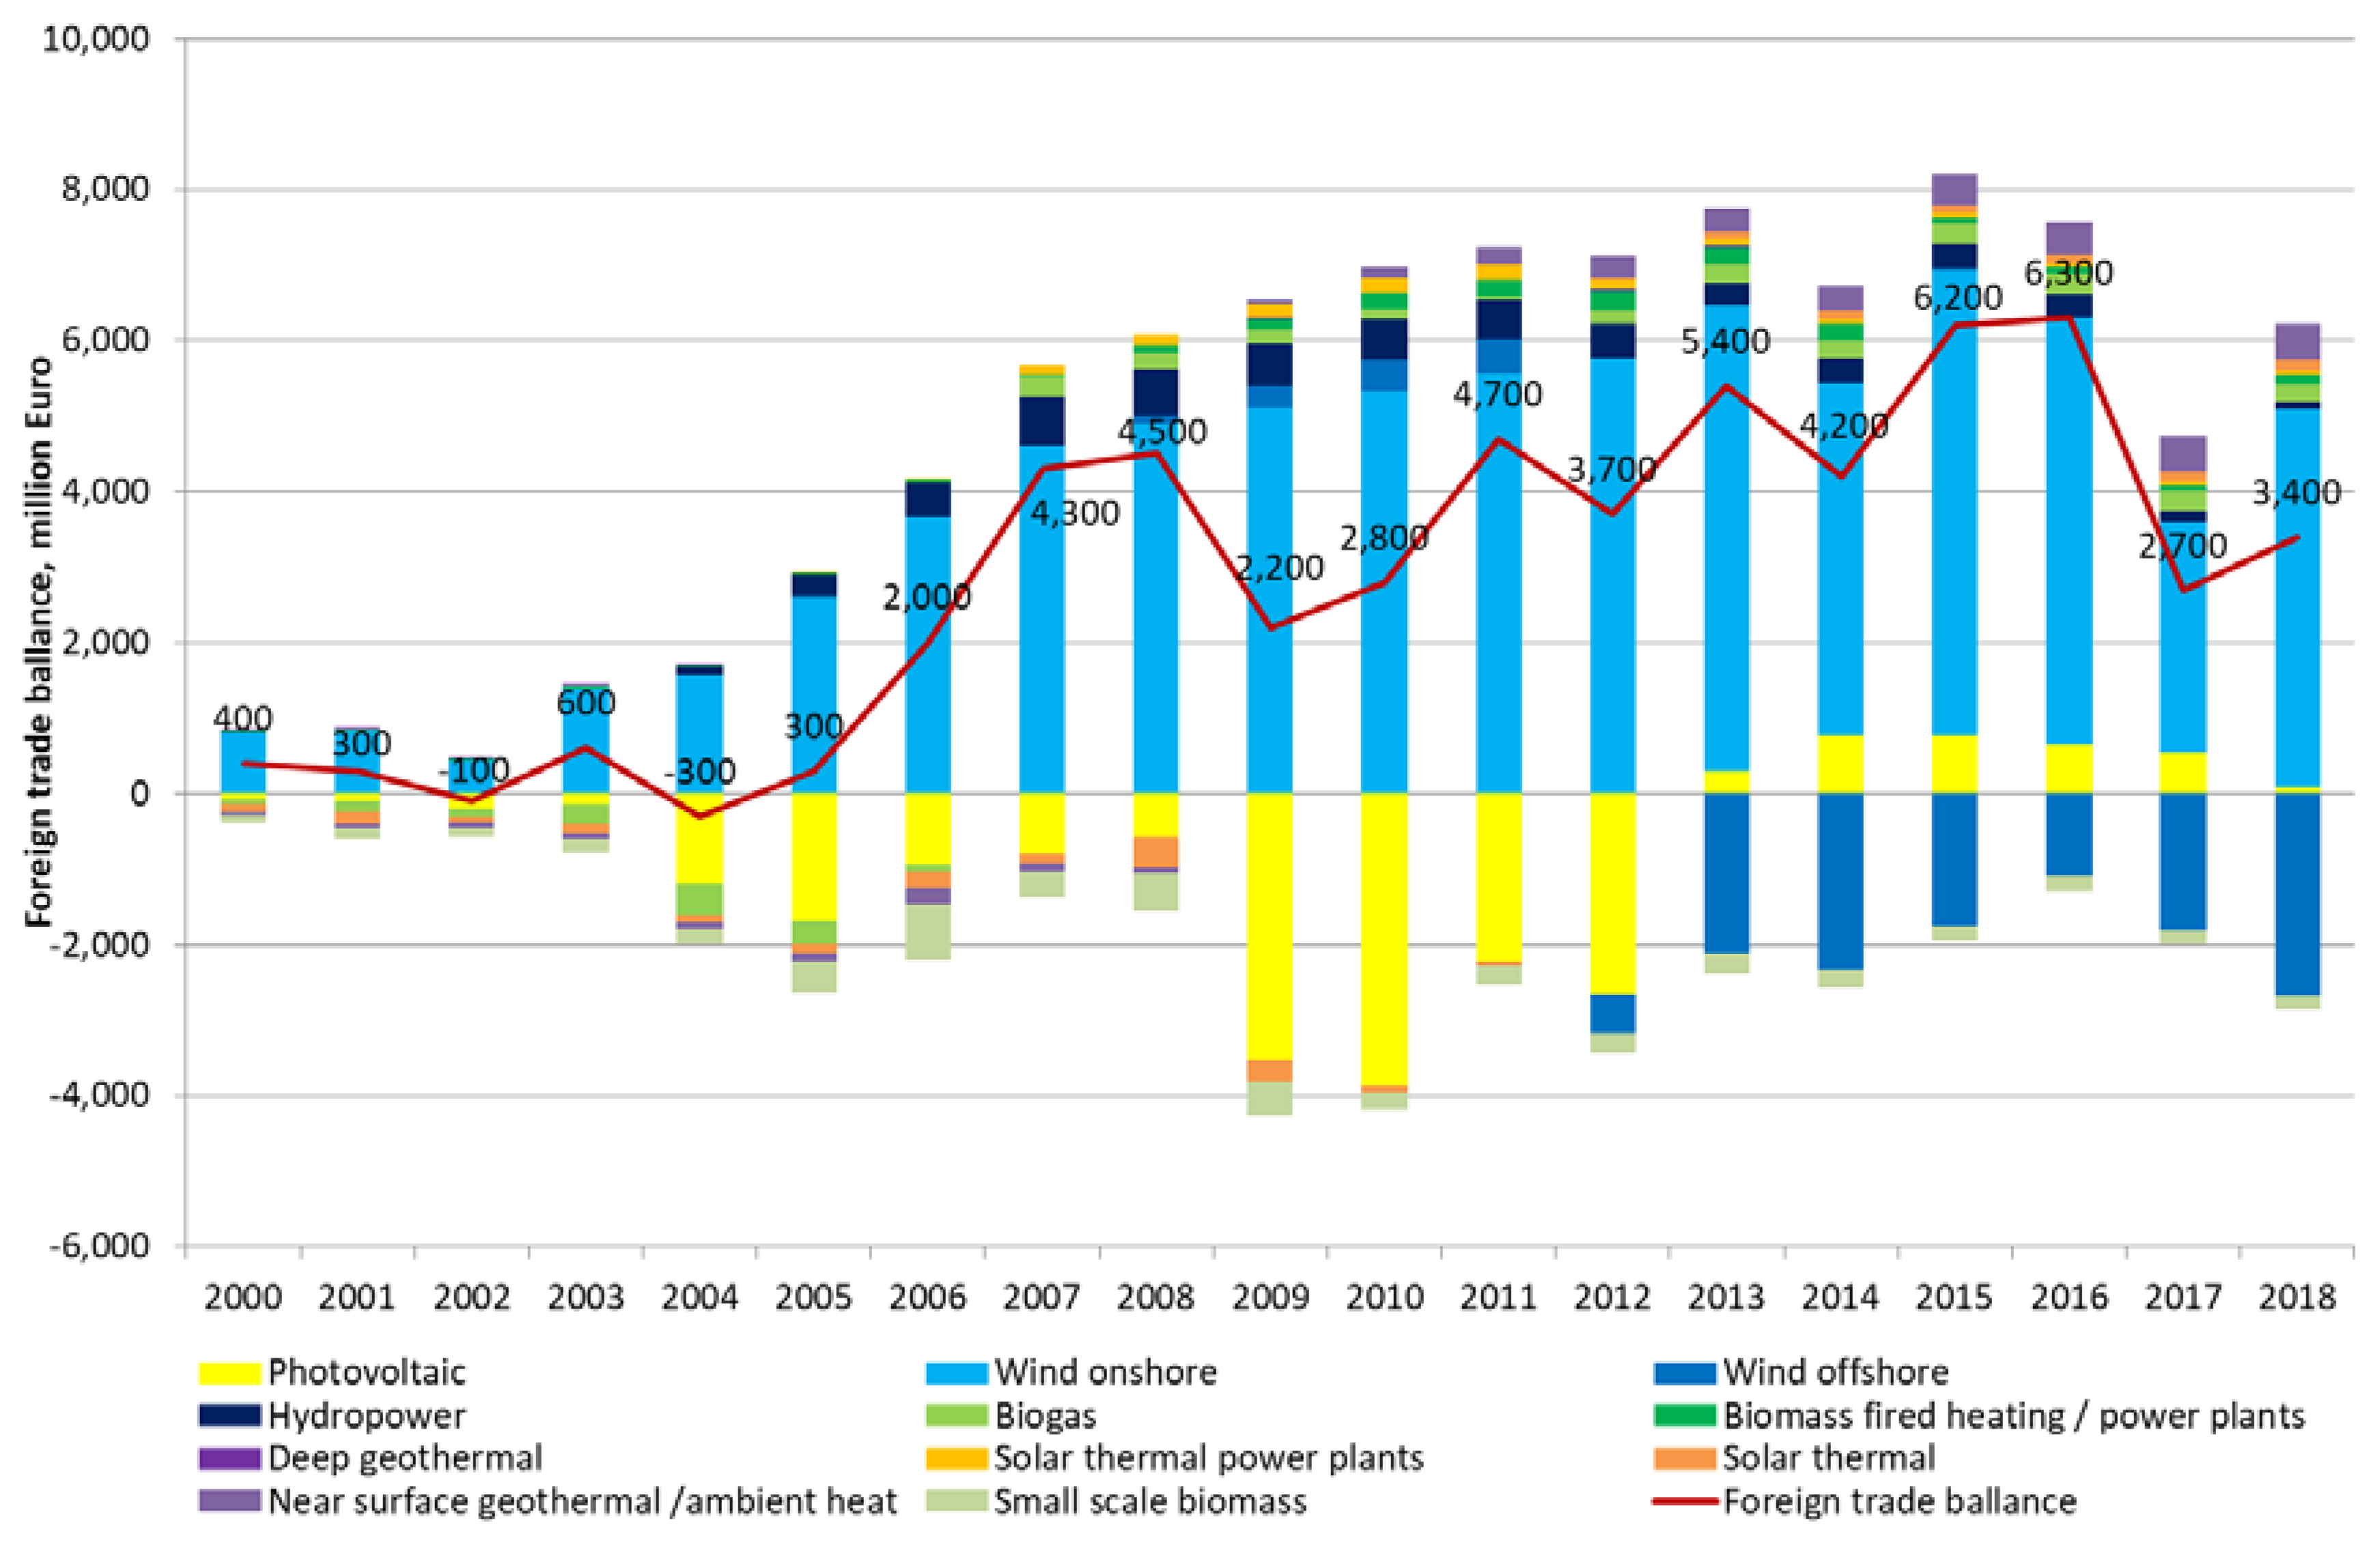
A closer look at foreign trade shows that there were more exports in the period under review than direct imports of RES-systems on the German market (see Figure 6). Overall, foreign trade surplus totaled to around 53.5 billion euros in the period between 2000 and 2018. It also becomes clear that the annual surplus has risen over time to a high of over 6 billion euros per year, whereas at the beginning of the period (2002 and 2004), it was hardly relevant, if not negative.
It should also be noted that the foreign trade figures shown here only include imports of end products, whereas on the export side, intermediate products are included as well. However, imports of intermediate products are considered within the IO-framework and are therefore taken into account in the determination of employment.
The technology-specific illustration in Figure 6 shows which technologies had positive and negative foreign trade balances over time. In the PV-sector, the trade balance from 2000 to 2012 was consistently negative, which shows that Germany did not have sufficient production capacity to meet domestic demand. The sharp decline in the yearly installed capacity in the period between 2012 and 2014 led to a foreign trade surplus in recent years. This surplus was mainly driven by the strong position of German inverter manufacturers whereas many PV module manufacturers were forced to leave the market.
In addition to the PV sector, there are a number of other RES-sectors with trade deficits. Particularly striking is the deficit in offshore wind energy, which is influenced in particular by the strong market position of Siemens with its production facilities in Denmark. The trade deficits in various heating technologies can be partly explained by the historically strong role of other countries in this segment, such as Austria.
Over time, trade surpluses were achieved in almost all sectors in Germany, again not taking imports of intermediate products into consideration. The only ones that continue to have negative trade surpluses are the offshore wind and small-scale biomass sector.
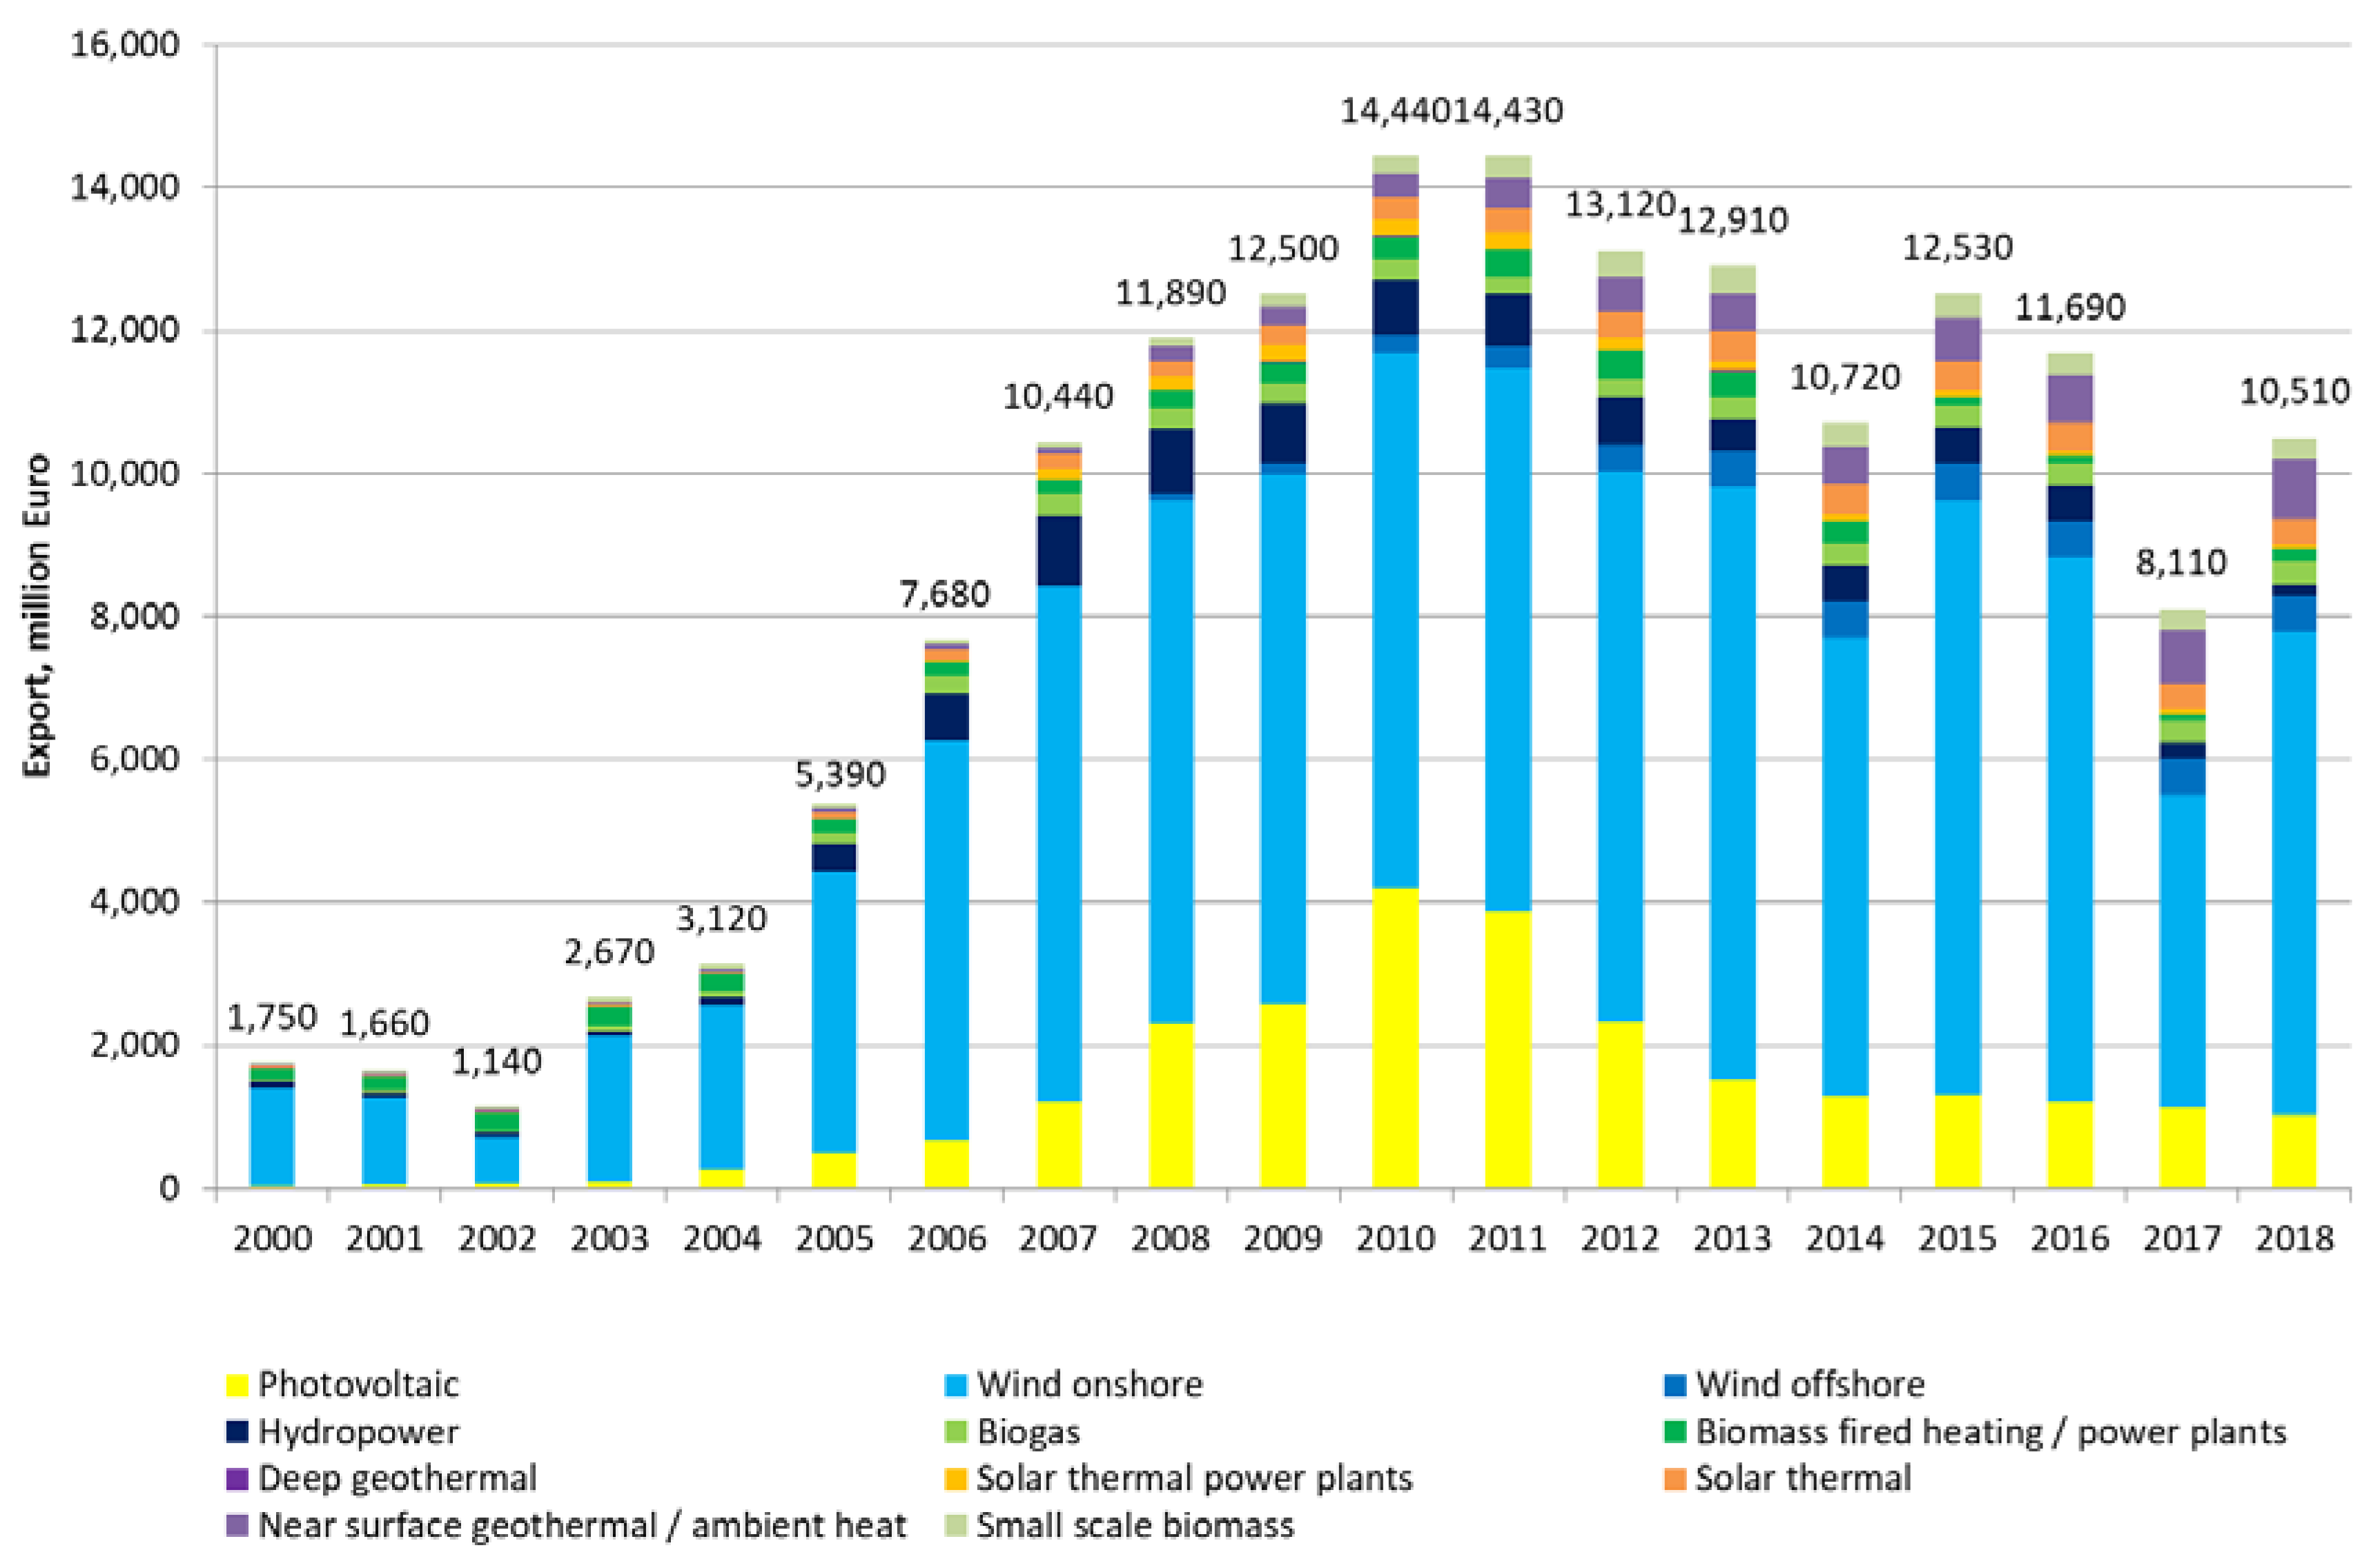
In terms of exports, the onshore wind energy sector stands out (see Figure 7). The decline in exports in 2014 has to be seen in context with the development of domestic investments. In 2014, investments in onshore wind capacities in Germany increased significantly compared to the previous year. Therefore, it can be assumed that exports declined in order to serve the domestic market. The development over the next two years suggests that wind production capacities in Germany were expanded. In 2017, German exports in the wind energy sector fell significantly by 43% [32]. At first glance, this export trend appears to be surprising. According to international statistics, the worldwide development in the construction of wind turbines was slightly declining in 2017, but the development in Europe was clearly positive [47]. However, a closer analysis of the foreign trade statistics reveals that German companies have played a relatively small role in the largest growth market of 2017, the United Kingdom. On the other hand, other markets, in which German companies have been very successful in prior years, experienced a significant market downturn in 2017. The most important example in this context is Turkey.
The decline in exports in the PV-sector since 2012 has two reasons. First, it is attributable to the consolidation of the German PV industry, and second, it reflects the decline in the European PV market.
A steady increase in exports can be observed in most other RES-sectors. It clearly shows the economic development of this infant industry. Initially, strongly focused on the domestic market, it has diversified its markets over time with various export strategies. This also becomes evident in an analysis of the results of the company surveys. In the course of time, an increasing share of companies declared to export its products. At the same time, the average export quota rose in all RES-sectors. In addition, the number of companies establishing production sites in other countries also increased over time.
Overall, exports of RES-plants and components rose from a level below 2 billion euros in the period from 2000 to 2003 to a peak at around 14 billion euros in 2010 and 2011.
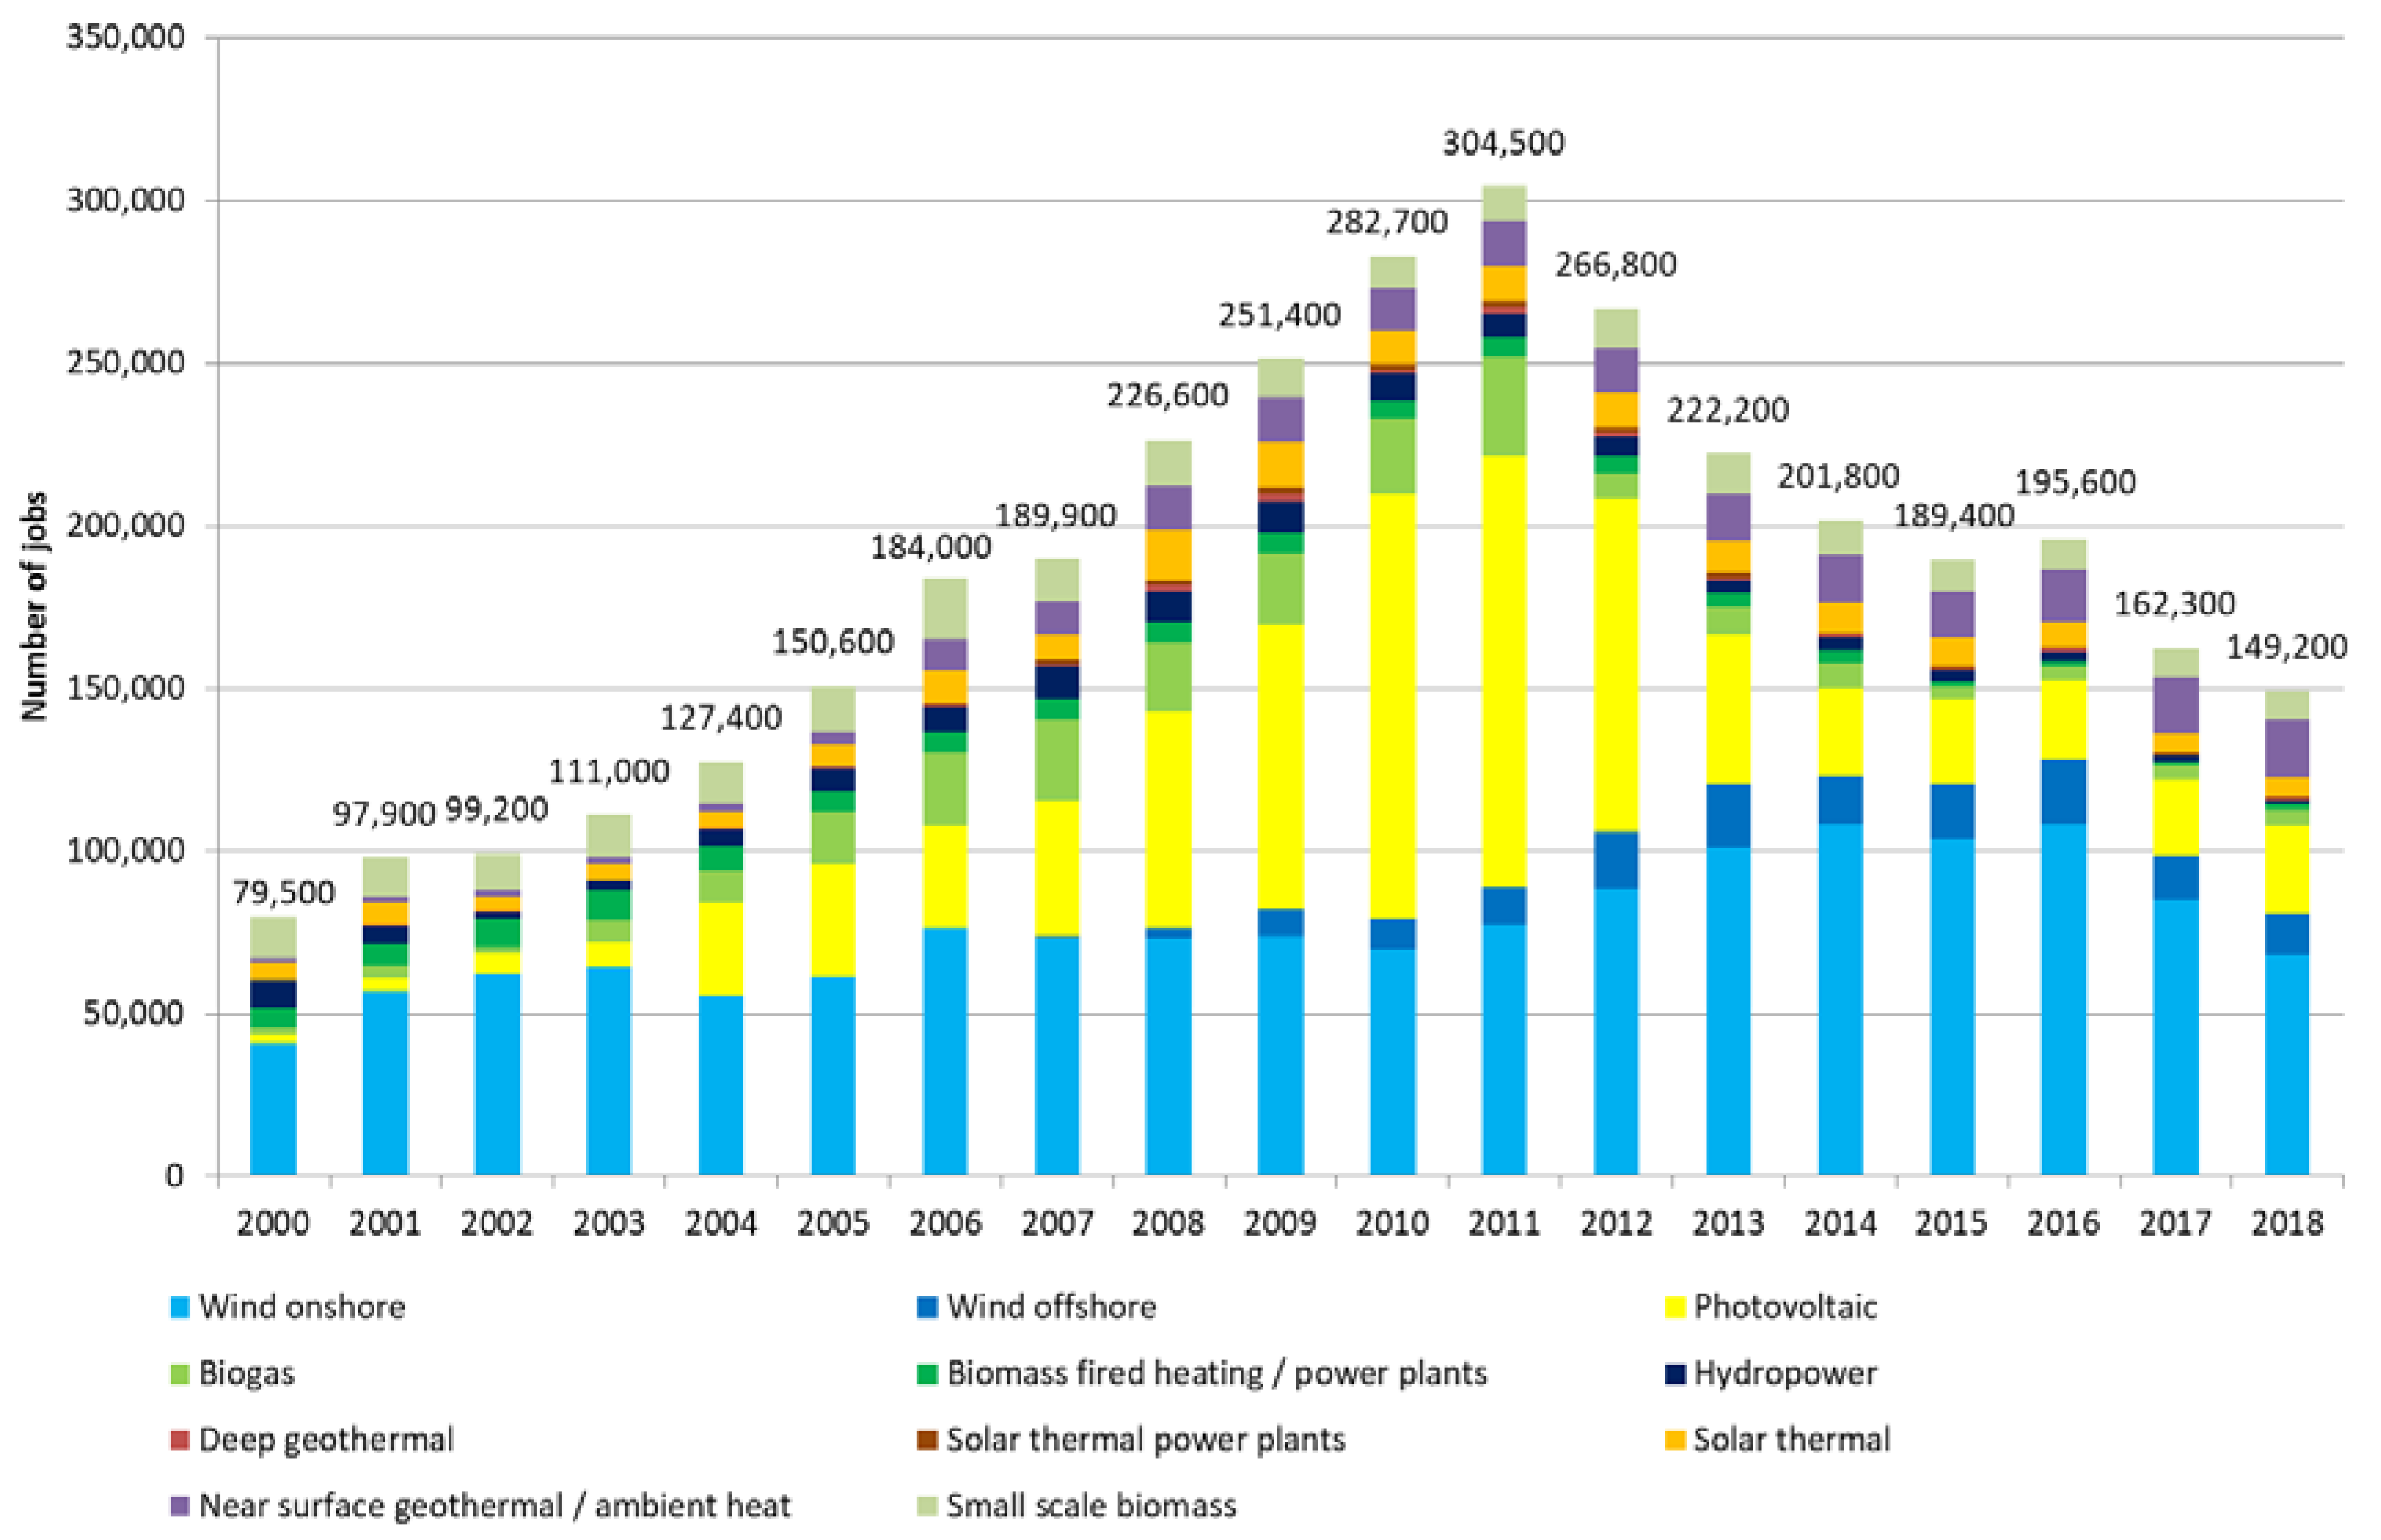
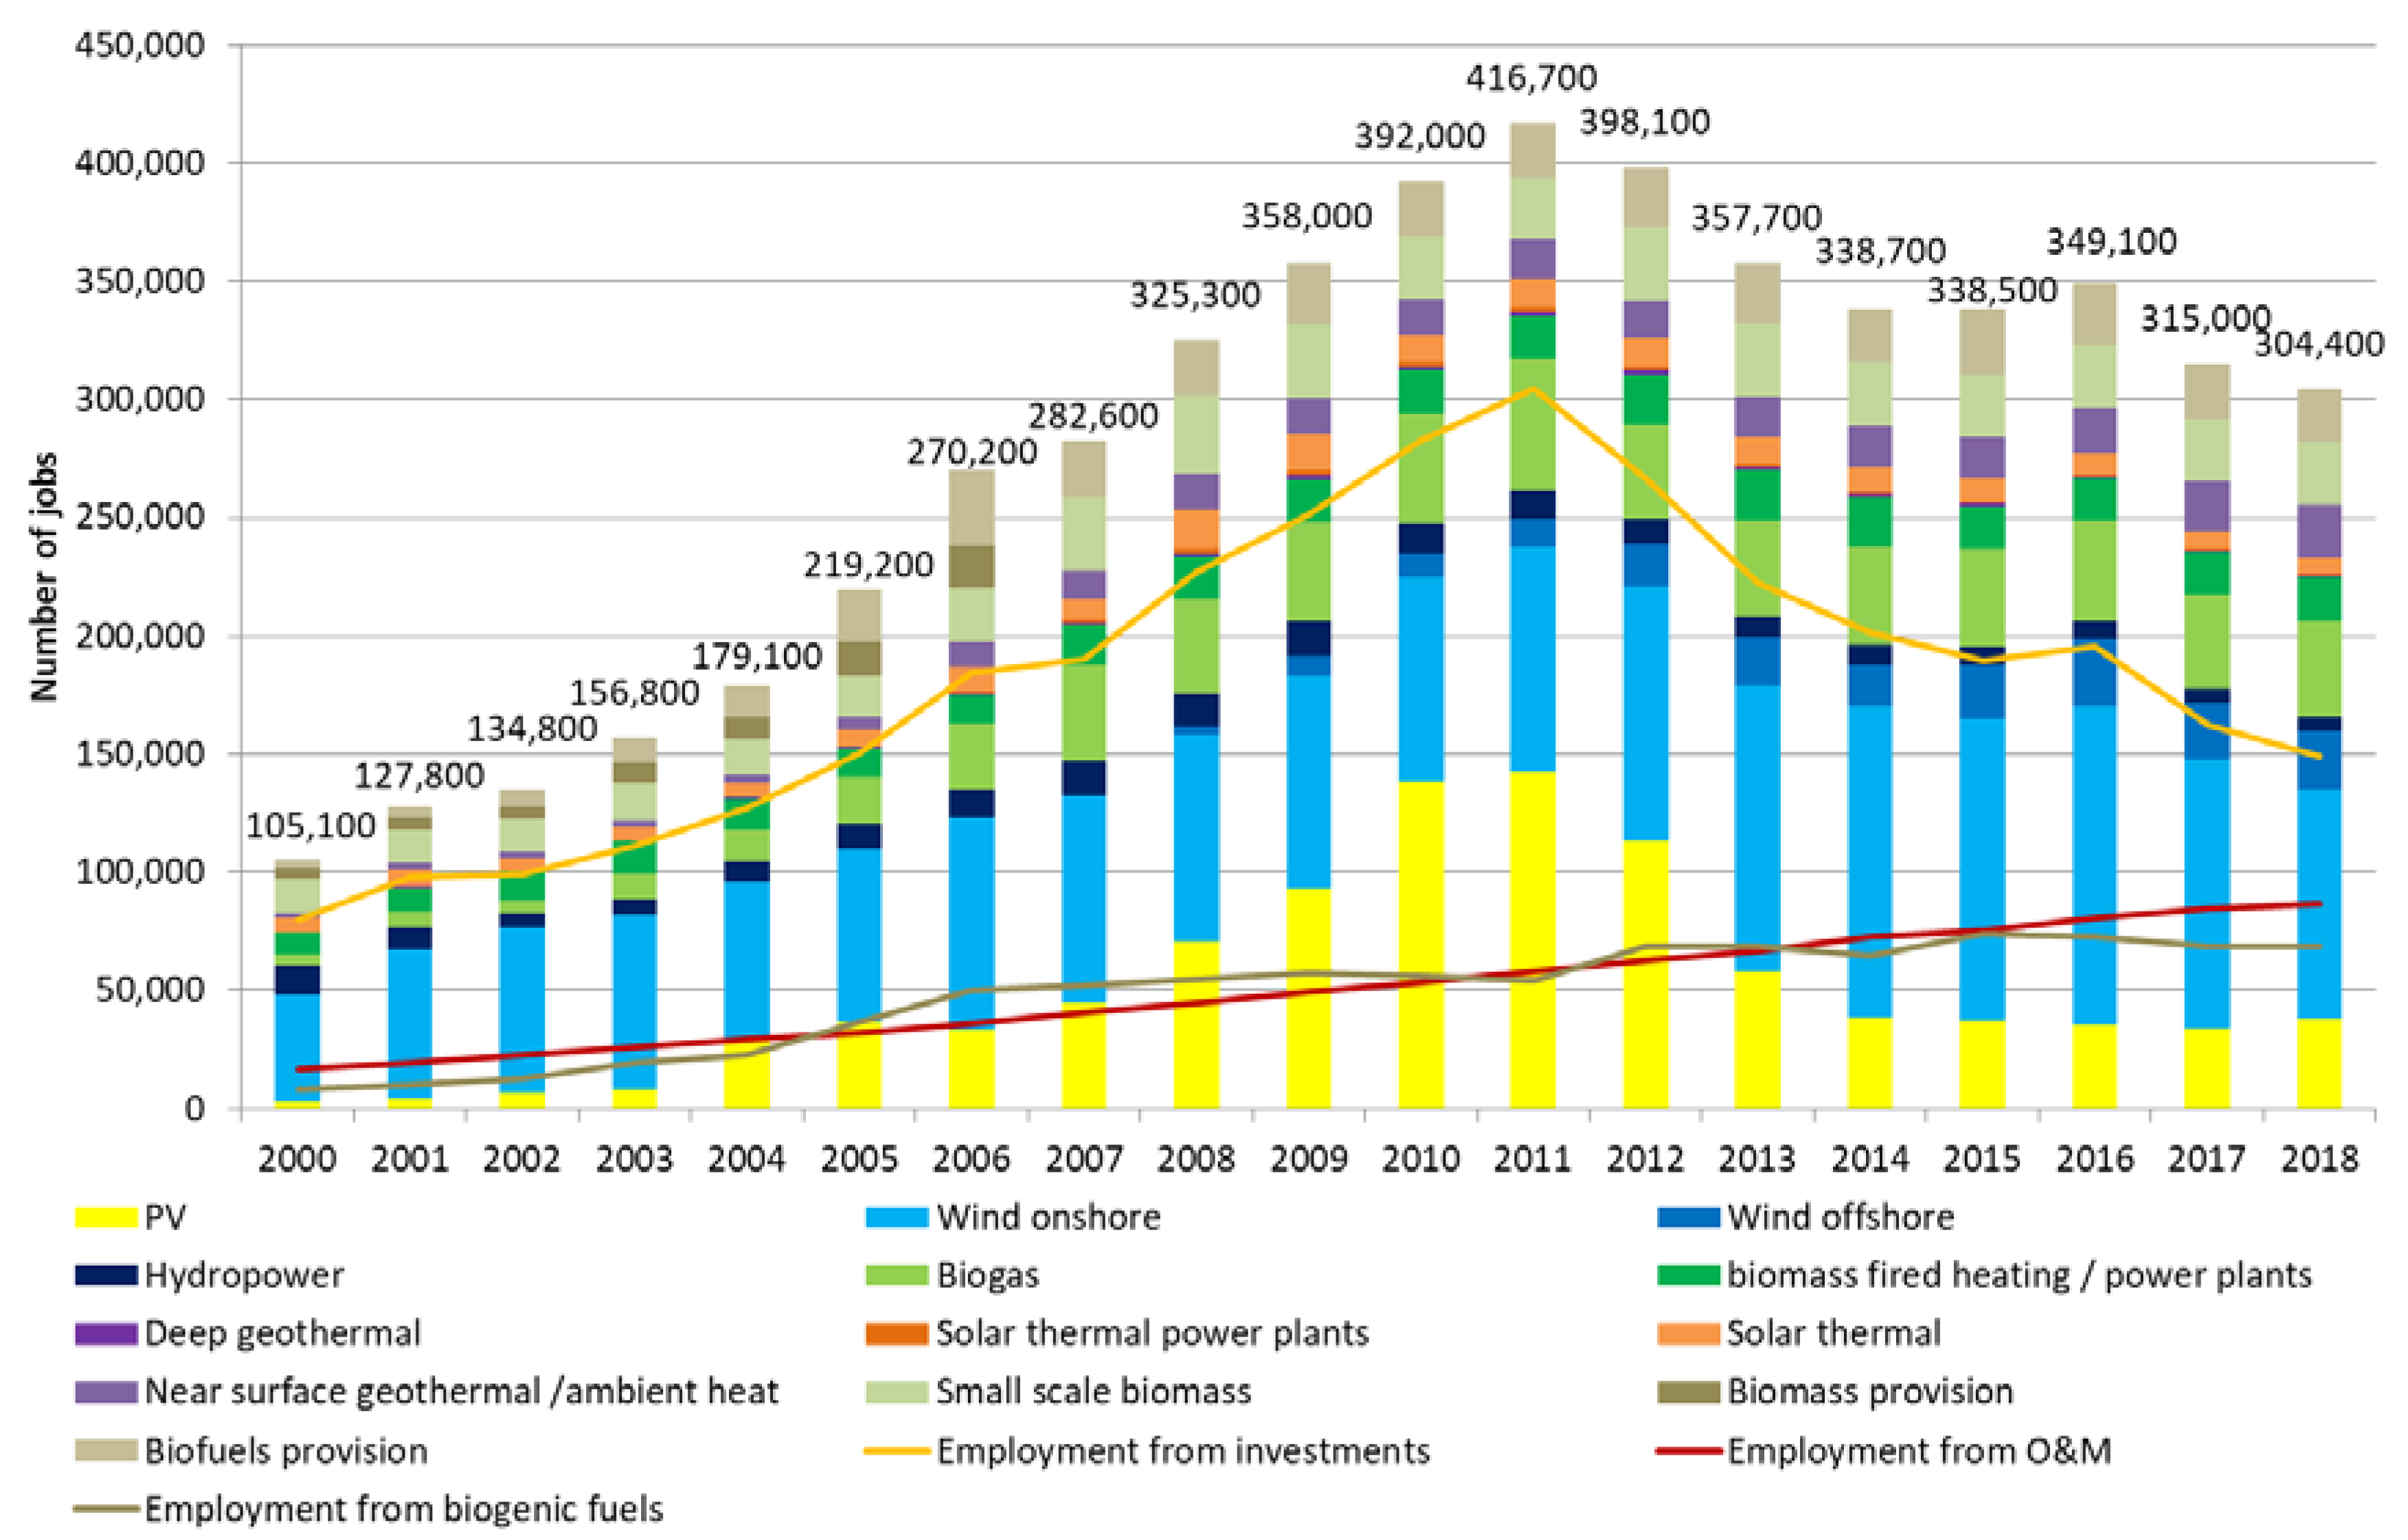
The employment resulting from investments in installations for the use of renewable energies in Germany and abroad is displayed in Figure 8. Starting from around 79,500 jobs in 2000, employment rose to 304,500 in 2011. In the following three years, employment fell by around one third. In 2016 there was a slight increase, followed by yet another decline. In 2018 about 149,200 jobs were determined in the context of investments in RES-technologies.
A comparison of the development of employment with the development of domestic demand reveals a difference in the development of both indicators, which requires a more detailed explanation. The significant increase in employment between 2010 and 2011 was accompanied by only a slight improvement in domestic demand. This discrepancy can be attributed to specific developments in the PV-sector that were previously mentioned. In Germany, PV system prices were on average 24% lower in 2011 than in the previous year and domestic demand in this sector declined by about 13%. In contrast, newly installed capacity in Germany rose by another 470 MW compared with the previous year (+6%), as did the production of modules, cells and inverters [41]. Furthermore, an analysis of corporate communications revealed that there were no significant reductions in the number of employees in 2011. It was therefore assumed that the decline in domestic demand was not fully reflected in employment in 2011. Instead, it had a significant impact on company results [29]. In 2012, this development led to a consolidation of the German PV industry, as many companies were unable to adequately meet the further strong decline in prices.
The increase in employment in 2011 is therefore primarily attributable to the fact that employment in photovoltaics rose slightly despite declining gross production. In addition, many other sectors, such as onshore and offshore wind energy, biogas and all heating technologies, also reported growth. The year 2012 was then marked by massive reductions in employment in the PV sector and the biogas sector. In the PV sector, this development was further reinforced in 2013 by the strong decline of domestically installed capacities by 68% compared to the previous year.
Looking at the development of the RES-sector as a whole, another important aspect becomes apparent. Operation and maintenance (O&M), as well as the provision of biomass and biogenic fuels have had a stabilizing effect on the employment in the RES-sector (see Figure 9).
Employment in operation and maintenance is not as much influenced by annual fluctuations in the addition of new capacities as the manufacturing and installation of RES-plants. Only its development is directly linked to the net additions of RES-capacities, while the majority of the economic basis remains stable over time. However, once again, it should be pointed out that employment in the O&M sector has also shown increases in labor productivity, which are taken into account.
With regard to the provision of biogenic fuels, there are some more uncertainties than in the area of O&M. Due to existing installation, the demand for biomass products is relatively stable which is a major advantage over the plant manufacturing sector. However, many biomass products are subject to an international market, which may affect the development of employment in this area due to exports and imports. Overall, it can be assumed that the employment development in this sector will be more even than in the business area of investments.
Employment resulting from O&M and the provision of biogenic fuels has been less relevant in the past. However, these areas are gaining importance and employed just over half of the people in the RES-industry in Germany in 2018. Nevertheless, the main driver of the development so far has been the investment in new RES-installations. The fluctuations in the development of the overall RES-employment are almost exclusively attributable to them.

4. Discussion

Data regarding the development of new technologies and their industries cannot be found in official statistics. Therefore, approaches are needed to derive a reasonable estimate of economic indicators in order to assess the development of those emerging industries.
A methodological approach that allows for the determination of direct and indirect employment uses country-specific input–output tables. The work presented in this study shows that there are many different possibilities to apply the input–output (IO) modeling approach. Four different methods were chosen here to determine gross employment for the renewable energy (RES) industry in Germany. The approaches differ significantly in their complexity and the associated data and information requirements.
(1)
The most complex approach described in this study involves the development of specific IO-vectors based on company surveys. This approach is particularly appropriate when an industry is characterized by newly created enterprises that play only a minor role in the relevant IO-vectors of the conventional classification. With regard to the required business surveys, however, it must be taken into account that a high degree of transparency and effort is required from companies to obtain adequate data on the flow of intermediate goods. Therefore, this approach should be based on a clear benefit and support of the industry under investigation.
(2)
A less elaborate way to extend an IO-table with a new vector was chosen for the operation and maintenance of RES-plants. The new IO-vectors were derived by a recombination of existing IO-vectors taking into account the specific costs structure of the service under investigation. This approach follows the assumption that the intermediate goods and services purchased by the new sector do not differ significantly from the representation of the relevant IO-vectors in the conventional classification. The quality and reliability of results can be improved when questionnaire-based interviews with relevant actors and experts are used in the data generation process.
(3)
The third approach using the IO-table without actively extending it is closely related to the second method. It recombines existing IO-vectors by taking the specific costs structures into consideration. The main difference is that no new vector is created, but the domestic demand of the good under consideration is divided between the different vectors. This approach was taken for the provision of biogenic fuels. This approach is particularly useful when there is no further use for a new vector and a variety of different goods are to be considered.
(4)
The simplest approach to estimate employment in a sector using the IO approach is to apply domestic demand directly to an existing IO-vector. This was done in the case of the provision of biomass in the early years of the time under investigation. However, the labor coefficient was rescaled by a factor for the sector “Products of agriculture, hunting and related services”, as the production of “energy plants” requires less labor input than the average product portfolio of agricultural products.
All of the approaches described using the IO-methodology, require detailed data from other sources. Even the simplest approach was in need of information regarding labor intensity from detailed agricultural statistics in Germany. The availability of this detailed information is, therefore, crucial in order to apply the IO-methodology to specific technologies and their industries.
Overall, it can, therefore, be concluded that there can be considerable methodological differences in the determination of economic indicators using the IO-approach. Therefore, different studies using the IO-methodology for the same country or region may vary significantly. This may also be true for two studies using the same approach based on different data sources.
Moreover, the data required for the different IO-approaches is very country-specific, as are the IO-tables. The transferability to other countries as well as the comparability of results from studies of different countries is therefore limited.
Another aspect is the development stage of the industry under consideration. Results have shown that labor intensity and its development strongly depends on the development phase in which an industry is at the time of the analysis. This can vary considerably from one country to another. Another aspect is the possibility of unexpected labor productivity developments. In the case of the drastic price adjustments of PV modules, for example, there was a temporary decline in labor productivity in Germany. The results of these short-term, special circumstances do not apply to other phases and industries, which once again makes transferability of results a challenge.

5. Conclusions

The results of the determination of the development of gross employment in the RES-industry in Germany show the relevance of different areas of business activity. It particularly shows the importance of investments and installations on gross employment in the early years of the development and the growing relevance of operation and maintenance as well as the provision of biogenic fuels in the later stages of the energy transition.
For the overall development of the German RES-industry, the wind onshore and PV industries have both played the most important role. At the same time, the two sectors have shown very different developments.
The wind energy industry has experienced a relatively reliable domestic market that did not show any radical developments in the time under consideration. The major share of onshore wind installations in Germany was provided by wind companies with production sites in Germany. Over the course of time, the German wind industry managed to develop a strong export orientation, which helped to overcome fluctuations in domestic demand.
On the other hand, the German PV-sector has experienced a substantial expansion, driven by domestic demand that was followed by a consolidation within a few years. Imports of PV-cells and–modules were necessary at all times to meet domestic demand. Moreover, the German PV sector’s overall trade balance has been negative over a large part of the time span considered here. Exports were also used as a stabilizing factor by the PV-industry. However, the German PV-sector did not develop the same export orientation as the wind sector. One possible explanation is the strong expansion of domestic demand. Another reason may have been the low volume of other markets in the early years of our investigation period. Between 2002 and 2010, the German PV market accounted for a share of the global expansion, ranging from 30% to 68% annually.
However, these differences only provide first insights into the developments of these RES-sectors in Germany. Further research into these industries on a global level is needed to gain a better understanding of the role of national and international markets.
This study shows that the expansion of RES-technologies in Germany was accompanied by a substantial buildup of an evolving industry that supplies investment goods, which were used for the installation of domestic and foreign RES facilities. Domestic installations paved the way for increasing demand for employment in operation and maintenance as well as the provision of biofuels.
It is widely discussed that gross employment effects are not sufficient to describe the overall employment effects of RES-expansion as other effects such as budget or substitution effects are not taken into account (see also [15,17,48]). The authors of this study are in total agreement with those arguments. Therefore, no statement can be made about the positive or negative effects of the transition towards the use of RES in Germany based directly on this publication. However, as argued in the introduction to this study, we still believe that analyzing gross employment effects has merits in and of itself as it gives a comprehensive picture of the economic relevance of the evolving RES industry in Germany. In addition, we would argue that the research presented generates valuable information for investigation of net effects of the RES expansion as is demonstrated in studies based on our data set [14,15,16,17,18,19].

Supplementary Materials

The following are available online at https://www.mdpi.com/2071-1050/12/15/6163/s1, Table S1: Annex_Result_Tables, Table S2: Annex_IO_Vectors.

Author Contributions

Conceptualization, M.O. and D.E.; methodology, D.E. and M.O.; investigation, M.O. and D.E.; data curation, M.O. and D.E.; writing—original draft preparation, M.O.; writing—review and editing, D.E.; visualization, M.O. Both authors have read and agreed to the published version of the manuscript. All authors have read and agreed to the published version of the manuscript.

Funding

This research was funded by the German Federal Ministry of Economic Affairs and Energy (BMWi) as well as the German Federal Ministry for the Environment, Nature Conservation and Nuclear Safety (BMU).

Acknowledgments

We would like to thank Peter Bickel for providing detailed information on RES investments in Germany. In addition, the work of the Arbeitsgruppe Erneuerbare Energien Statistik (AGEE-Stat) regarding newly installed RES capacities was crucial to this project.

Conflicts of Interest

The authors declare no conflict of interest. The funders had no role in the design of the study; in the collection, analyses or interpretation of data; in the writing of the manuscript or in the decision to publish the results.

References

  1. Seto, K.C.; Davis, S.J.U.; Mitchell, R.B.; Stokes, E.C.; Unruh, G.; Ürge-Vorsatz, D. Carbon lock-in: Types, causes, and policy implications. Annu. Rev. Environ. Resour. 2016, 41, 425–452. [Google Scholar] [CrossRef] [Green Version]
  2. Unruh, G.C. Understanding carbon lock-in. Energy Policy 2000, 28, 817–830. [Google Scholar] [CrossRef]
  3. Ricardo, D. On the Principles of Political Economy, and Taxation. In The Works and Correspondence of David Ricardo, 3rd ed.; Sraffa, P., Ed.; Cambridge University Press: Cambridge, UK, 1821; Volume 1. [Google Scholar]
  4. Directive (EU) 2018/2001 of the European Parliament and of the Council on the Promotion of the Use of Energy from Renewable Sources (Recast). Official Journal of the European Union. 11 December 2018. Available online: https://eur-lex.europa.eu/legal-content/EN/TXT/PDF/?uri=CELEX:32018L2001&from=EN (accessed on 7 November 2019).
  5. Blanco, M.I.; Rodrigues, G. Direct employment in the wind energy sector: An EU study. Energy Policy 2009, 37, 2847–2857. [Google Scholar] [CrossRef]
  6. Wei, M.; Patadia, S.; Kammen, D.M. Putting renewables and energy efficiency to work: How many jobs can the clean energy industry generate in the US? Energy Policy 2010, 38, 919–931. [Google Scholar] [CrossRef]
  7. Connolly, K.; Allan, G.J.; McIntyre, S.G. The evolution of green jobs in Scotland: A hybrid approach. Energy Policy 2016, 88, 355–360. [Google Scholar] [CrossRef] [Green Version]
  8. Llera, E.; Scarpellini, S.; Aranda, A.; Zabalza, I. Forecasting job creation from renewable energy deployment through a value-chain approach. Renew. Sustain. Energy Rev. 2013, 21, 262. [Google Scholar] [CrossRef]
  9. Draycott, S.; Szadkowska, I.; Silva, M.; Ingram, D.M. Assessing the macro-economic benefit of installing a farm of oscillating water columns in Scotland and Portugal. Energies 2018, 11, 2824. [Google Scholar] [CrossRef] [Green Version]
  10. Cameron, L.; Zwaan, B. Employment factors for wind and solar energy technologies: A literature review. Renew. Sustain. Energy Rev. 2015, 45, 160–172. [Google Scholar] [CrossRef] [Green Version]
  11. Barros, J.J.C.; Coira, M.L.; Cruz López, M.P.; Caño Gochi, A. Comparative analysis of direct employment generated by renewable and non-renewable power plants. Energy 2017. [Google Scholar] [CrossRef]
  12. Aldieri, L.; Grafström, J.; Sundström, K.; Vinci, C.P. Wind Power and Job Creation. Sustainability 2019, 12, 45. [Google Scholar] [CrossRef] [Green Version]
  13. Breitschopf, B.; Nathani, C.; Resch, G. Employment impact assessment studies – Is there a best approach to assess employment impacts of RET deployment? Renew. Energy Law Policy Rev. 2013, 2, 93–104. [Google Scholar]
  14. Staiß, F.; Kratzat, M.; Nitsch, J.; Lehr, U.; Edler, D.; Lutz, C. Erneuerbare Energien: Arbeitsplatzeffekte – Wirkungen des Ausbaus erneuerbarer Energien auf den deutschen Arbeitsmarkt. In Research Project on Behalf of the Federal Ministry for the Environment, Nature Conservation and Nuclear Safety (BMU); BMU: Berlin, Germany, 2006. [Google Scholar]
  15. Lehr, U.; Nitsch, J.; Kratzat, M.; Lutz, C.; Edler, D. Renewable energy and employment in Germany. Energy Policy 2008, 36, 108–117. [Google Scholar] [CrossRef]
  16. Lehr, U.; Lutz, C.; Edler, D.; O’Sullivan, M.; Nienhaus, K.; Nitsch, J.; Simon, S.; Breitschopf, B.; Bickel, P.; Ottmüller, M. Kurz- und langfristige Auswirkungen des Ausbaus der erneuerbaren Energien auf den deutschen Arbeitsmarkt. In Research Project on Behalf of the Federal Ministry for The Environment, Nature Conservation and Nuclear Safety (BMU); GWS: Osnabrück, Germany, 2011. [Google Scholar]
  17. Lehr, U.; Lutz, C.; Edler, D. Green jobs? Economic impacts of renewable energy in Germany. Energy Policy 2012, 47, 358–364. [Google Scholar] [CrossRef] [Green Version]
  18. Lehr, U.; Ulrich, P.; Lutz, C.; Thobe, I.; Edler, D.; O’Sullivan, M.; Naegler, T.; Simon, S.; Pfenning, U.; Peter, F.; et al. Beschäftigung durch erneuerbare Energien in Deutschland—Ausbau und Betrieb, heute und morgen. In Research Project on Behalf of the Federal Ministry of Economics and Energy (BMWi); DIW: Berlin, Germany, 2015. [Google Scholar]
  19. Blazejczak, J.; Braun, F.G.; Edler, D.; Schill, W.-P. Economic effects of renewable energy expansion: A model-based analysis for Germany. Renew. Sustain. Energy Rev. 2014, 40, 1070–1080. [Google Scholar] [CrossRef] [Green Version]
  20. Renewable Energy and Jobs—Annual Review 2019; International Renewable Energy Agency (IRENA): Abu Dhabi, UAE, 2019; Available online: https://www.irena.org/publications/2019/Jun/Renewable-Energy-and-Jobs-Annual-Review-2019 (accessed on 12 July 2019).
  21. The State of Renewable Energies in Europe. EurObserv’er. 2018. Available online: https://www.eurobserv-er.org/category/2018/ (accessed on 12 July 2019).
  22. Leontief, W. Input-Output Economics, 2nd ed.; Oxford University Press: Oxford, UK, 1986. [Google Scholar]
  23. Miller, R.; Blair, P. Input-Output Analysis—Foundations and Extensions, 2nd ed.; Cambridge University Press: Cambridge, UK, 2009. [Google Scholar]
  24. Statistisches Bundesamt. Volkswirtschaftliche Gesamtrechnungen—Input-Output-Rechnung 2015 (Revision 2014, Stand: August 2018), Fachserie 18, Reihe 2; Statistisches Bundesamt (Destatis): Wiesebaden, Germany, 2019. [Google Scholar]
  25. Edler, D. Modeling Economic Impacts of Renewable Energy Expansion—The Experience for Germany, EcoMod 2012. In Proceedings of the International conference on Economic Modelling, Sevilla, Spain, 4–6 July 2012. [Google Scholar]
  26. Garrett-Peltier, H. Green versus brown: Comparing the employment impacts of energy efficiency, renewable energy, and fossil fuels using an input-output model. Econ. Model. 2017, 61, 439–447. [Google Scholar] [CrossRef]
  27. Kratzat, M.; Lehr, U.; Nitsch, J.; Edler, D.; Lutz, C. Erneuerbare Energien: Arbeitsplatzeffekte 2006. In Research Project on Behalf of the Federal Ministry for the Environment, Nature Conservation and Nuclear Safety (BMU); BMU: Berlin, Germany, 2007. [Google Scholar]
  28. O’Sullivan, M.; Edler, D.; van Mark, K.; Nieder, T.; Lehr, U. Bruttobeschäftigung 2010—eine erste Abschätzung. In Research Project on Behalf of the Federal Ministry for the Environment, Nature Conservation and Nuclear Safety (BMU); BMU: Berlin, Germany, 2011. [Google Scholar]
  29. O’Sullivan, M.; Edler, D.; Nieder, T.; Rüther, T.; Lehr, U.; Peter, F. Bruttobeschäftigung 2011—eine erste Abschätzung. In Research Project on Behalf of the Federal Ministry for the Environment, Nature Conservation and Nuclear Safety (BMU); BMU: Berlin, Germany, 2012. [Google Scholar]
  30. Time Series for the Development of Renewable Energy Sources in Germany—Based on Statistical Data from the Working Group on Renewable Energy-Statistics (AGEE-Stat); Federal Ministry for Economic Affairs and Energy: Berlin, Germany, 2019; Available online: https://www.erneuerbare-energien.de/EE/Navigation/DE/Service/Erneuerbare_Energien_in_Zahlen/Zeitreihen/zeitreihen.html (accessed on 21 December 2019).
  31. Investments in the Construction of RE Plants in Germany 2000–2018; Centre for Solar Energy and Hydrogen Research Baden-Württemberg; BMWi: Berlin, Germany, 2019.
  32. Foreign Trade Statistics, Statistischen Bundesamt, Genesis-online. Available online: 51000-0013,https://www-genesis.destatis.de/genesis/online (accessed on 1 October 2019).
  33. UN Comtrade Database, United Nations. Available online: https://comtrade.un.org/ (accessed on 1 October 2019).
  34. Solar Heat Worldwide, Solar Heating and Cooling Programme, International Energy Agency. Available online: http://www.iea-shc.org/publications-category?CategoryID=101 (accessed on 13 December 2019).
  35. Dias, P. Solar Thermal Markets in EU 28 and Switzerland, Personal Information; European Solar Thermal Industry Federation: Brussels, Belgium, 16 October 2018. [Google Scholar]
  36. Market data, European Hear Pump Association. Available online: http://www.ehpa.org/market-data/ (accessed on 13 December 2019).
  37. Statistic Reports, Photovoltaic Power Systems Programme, International Energy Agency. Available online: http://www.ieapvps.org/index.php?id=92&no_cache=1&tx_damfrontend_pi1%5BshowUid%5D=156&tx_damfrontend_pi1%5BbackPid%5D=92 (accessed on 13 December 2019).
  38. Offshore statistics, European Wind Energy Association. Available online: https://windeurope.org/about-wind/statistics//offshore/ (accessed on 15 December 2019).
  39. Windenergie in Deutschland, Deutsches Windenergie Institut (DEWI). 2019. Available online: http://www.dewi.de/dewi_res/index.php?id=9#DM (accessed on 7 October 2019).
  40. Windenergiestatistik: Windenergieausbau in Deutschland, WindGuard. 2019. Available online: http://www.windguard.de/service/knowledge-center.html (accessed on 16 December 2019).
  41. Aus der Traum. In Photon; Photon International GmbH: Aachen, Germany, 2013; pp. 16–23.
  42. Die Hoffnung liegt im Kleinen. In Photon; Photon International GmbH: Aachen, Germany, 2014; pp. 20–24.
  43. O’Sullivan, M.; Edler, D.; Lehr, U. Ökonomische Indikatoren der Energiebereitstellung—Methode, Abgrenzung und Ergebnisse für den Zeitraum 2000–2017. In Research Project on Behalf of the Federal Ministry of Economics and Energy (BMWi); DIW: Berlin, Germany, 2019. [Google Scholar]
  44. Wüstenhagen, R.; Bilharz, M. Green energy market development in Germany: Effective public policy and emerging customer demand. Energy Policy 2006, 34, 1681–1696. [Google Scholar] [CrossRef] [Green Version]
  45. Haas, R.; Panzer, C.; Resch, G.; Ragwith, M.; Reece, G.; Held, A. A historical review of promotion strategies for electricity from renewable energy sources in EU countries. Renew. Sustain. Energy Rev. 2011, 15, 1003–1034. [Google Scholar] [CrossRef]
  46. Klein, M.; Deissenroth, M. When do households invest in solar photovoltaics? An application of prospect theory. Energy Policy 2017, 109, 270–278. [Google Scholar] [CrossRef] [Green Version]
  47. Global Wind Energy Council. Global Wind Report—Annual Market Update 2017; Global Wind Energy Council: Brussels, Belgium, 2018. [Google Scholar]
  48. Lambert, R.J.; Silva, P.P. The challenges of determining the employment effects of renewable energy. Renew. Sustain. Energy Rev. 2012, 16, 4667–4674. [Google Scholar] [CrossRef] [Green Version]
Figure 1. Areas of investigation and subsectors defined in the framework of the input–output table (own representation).
Sustainability 12 06163 g001
Figure 2. Schematic representation of a new sector in the framework of an input–output table (own representation based on [22]).
Sustainability 12 06163 g002
Figure 3. Schematic representation of the calculation steps for deriving effective domestic demand and gross production.
Sustainability 12 06163 g003
Figure 4. Investments in the construction of renewable energy (RES)-plants in Germany, millions of euros [30,31] (own representation).
Sustainability 12 06163 g004
Figure 5. Domestic demand and gross output for RES plants and components in Germany, millions of euros (see supplementary material).
Sustainability 12 06163 g005
Figure 6. German foreign trade balance of RES plants and components, millions of euros (own calculation).
Sustainability 12 06163 g006
Figure 7. Export of plants and components for the use of renewable energies from Germany, millions of euros (own calculation).
Sustainability 12 06163 g007
Figure 8. Employment in Germany triggered by investments in RES-technologies in the period 2000–2018 (see supplementary material).
Sustainability 12 06163 g008
Figure 9. Employment in the renewable energy sector in Germany in the period 2000–2018 (see supplementary material).
Sustainability 12 06163 g009

