Article

The Spatial Externalities of Tourism Activities in Poverty Reduction

by
Pablo Ponce
1,
Nathalie Aguirre-Padilla
2,
Cristiana Oliveira
3,
José Álvarez-García
4,* and
María de la Cruz del Río-Rama
5
1
School of Economics, Universidad Nacional de Loja, 11050 Loja, Ecuador
2
School of Economics, Universidad Técnica Particular de Loja, 11050 Loja, Ecuador
3
European University of the Canary Islands, 38300 Sta. Cruz de Tenerife, Spain
4
Financial Economy and Accounting Department, Faculty of Business, Finance and Tourism, University of Extremadura, 10071 Caceres, Spain
5
Business Management and Marketing Department, Faculty of Business Sciences and Tourism, University of Vigo, 32004 Ourense, Spain
*
Author to whom correspondence should be addressed.
Sustainability 2020, 12(15), 6138; https://doi.org/10.3390/su12156138
Submission received: 10 June 2020 / Revised: 27 July 2020 / Accepted: 27 July 2020 / Published: 30 July 2020

Abstract

:
Poverty is one of the main indicators of economic development worldwide, in such a way that one of the Sustainable Development Goals is to eradicate poverty in all its forms worldwide. The objective of this research was to examine the effect of the gross value added (GVA) of tourism on poverty in the 198 contiguous Ecuadorian cantons. The methodology used was the application of a set of spatial econometric models to capture the regional effect of tourism on poverty. Data were obtained from the Central Bank of Ecuador and the National Survey of Employment, Unemployment and Under-Employment of the National Institute of Statistics and Census (INEC). The results show that tourism activities and regional poverty are negatively related; thus, a 1% increase in tourism-related economic activity decreases the regional poverty of the canton itself by 4.31%, and that of neighboring cantons by between 0.7% and 2.4%. The inclusion of the control variables shows that schooling and the mestizo population contribute to reducing the canton’s poverty, since the regions with a high GVA of tourism have high levels of schooling and a mestizo population. Thus, regional poverty increases when the level of schooling increases in neighboring cantons. On the other hand, in cantons with a high Mestizo population, compared to the African-American population, the poverty of the canton and its neighboring regions decreases. Public policy measures which aim at reducing poverty must take into account spatial spills from tourist activity in the cantons.

1. Introduction

The World Tourism Organization [1] (p. 5) states that “tourism consists of travel and stays people undertake in places other than their habitual surroundings, for periods of more than a day and less than a year, for leisure, business or other motives”. Consequently, strengthening tourism favors regional economic and social development. Tourism produces important effects on the national income by generating foreign exchange for the country in which it is carried out and providing important direct and indirect benefits for people as an important source of employment. Thus, tourism constitutes an important part of the Gross Domestic Product (GDP) of most countries.
Tourism is the most rapidly growing economic sector worldwide [2]. According to the World Tourism Organization (UNWTO), there were 1.4 billion international tourist arrivals worldwide, which represents a 6% increase over the previous year, which is higher than global economic growth rate of 3.7% in 2017 [3]. The data confirm the fundamental role of tourism as a motor of growth and economic development worldwide. According to the International Labour Organization (ILO), tourism-related economic activity is the major source of growth, employment, incomes and profits for many developing countries of the world [4]. Tourism is currently classified as the most or second most important source of export incomes in 20 of the 48 least developed countries, and is experiencing constant growth in at least ten more of these countries. Thus, in countries that rely principally on tourism (particularly small island countries), tourism can represent 30 to 90% of GDP and 50 to 90% of exports, while employing 20 to 50% of the population [5].
As noted above, tourism is a generator of economic development [6], given that it requires large amounts of manpower and is an important source of development and employment, especially for groups that have limited access to the labor market, such as women, youth, immigrant workers and rural populations. Tourism can contribute significantly to social and economic development and poverty reduction [4]. Numerous studies have confirmed that the development of tourism improves indicators of poverty and contributes to more balanced regional development [7]. Authors like Sook, May, Songan and Nair [8] affirm that tourism has improved the conditions of people considered as poor, given that it generates employment and thus improves the life of the population [9]. In contrast, empirical evidence shows that the incomes generated by tourist activities do not always favor the poorer classes, but rather benefit the owners of businesses that provide tourism-related services. According to Blake, Saba, Sinclair and Teles [10], the main beneficiaries of government programs to promote tourism are high and middle-income families, followed by low-income households, based on the profits derived from expanding tourism. The exception is when governments direct revenues from tourism expansion specifically to low income groups. However, it is necessary to clarify that the effect of tourism activity on gross domestic product (GDP) and on poverty is different. Tourism has a direct effect on poverty reduction due to the generation of jobs and higher incomes; however, for tourism to be a great stimulator of GDP, it is required that tourism-related economic activity be highly developed, but this does not mean that the increase in GDP will reduce poverty. In this sense, there is no consensus on the effect that tourism causes on GDP and poverty; for example, Croes and Rivera [11] mention that the existence of the tourism and economic growth nexus is a benefit for the poorest. For their part, Croes and Vanegas [12] confirm that the ability to generate economic growth from tourism contributes to alleviating poverty. In contrast, Mahadevan and Suardi [13] indicate that tourism activity alone does not reduce poverty.
The tourist activity in Ecuador is privileged because of its natural and geographic diversity. Ecuador is located in South America, and crossed by the equator. Its geographical position is strategic, because its coasts in the Pacific Ocean are bathed by the waters of the Cold Humboldt Current and the Warm current of Niño, which allow it to have a unique natural ecosystem and high flora and fauna biodiversity. Ecuador is divided into four clearly identifiable regions: the Insular Region (or Galapagos), the Coastal Lowlands Region, the Andean Highlands Region and the Amazon Region, which are known as the ‘Worlds of Ecuador’. The Galapagos is characterized as being an ecological park worldwide, with unique fauna and flora; the Coastal Lowlands region is characterized by its beaches, ports, large commercial cities and mangroves; the Andean is known for its great mountains, volcanoes, landscapes and colonial cities; and the Amazon is known for its jungle of flora and fauna, which are unique in kind [14]. The evolution of the tourism sector in Ecuador is of the utmost importance in the national economy. Thus, the direct contribution of tourism to Ecuador’s GDP in 2019 was 2.2%, with an estimated foreign exchange income from inbound tourism in 2019 of 2287.5 (USD million). Tourism employed 477,382 people in the accommodation and food service activities as of December 2019. According to the 2019 National Census, made by the Ministry of Tourism of Ecuador, there are a total of 24,257 registered tourist establishments, with a total of 1,471,968 foreign arrivals in 2018.
Of the total of registered establishments, 17,225 are food and drinks venues, followed by accommodation establishments, which number 4153, which means that there are 81,476 rooms available to receive tourists from all over the country. The rest of the establishments are divided into small groups, such as intermediation, recreation, tourist transport and community tourism centers.
According to the Ecuadorian Ministry of Tourism [14], tourism generated 552,508 jobs in the third trimester of the present year, which represents a 1.8% increase over the same trimester of the previous year. The balance of foreign exchange for tourism was 393 million dollars, which represented an increase of 6.1% over 2018. In contrast, according to data published by the National Survey on Employment, Unemployment and Under-Employment [15], the poverty rate rose from 23% in 2018 to 23.9% in 2019, while urban poverty increased by 2.1% and rural poverty decreased by 1.5% in 2019, compared to the previous year. As the statistics show, tourism is growing in Ecuador, but so is poverty. The latter—associated with the fact that poverty in Ecuador is the subject of particular analysis—was described by Correa-Quezada et al. [16], who held that some regions in Ecuador are located in a ‘poverty trap’.
The objective of this research was to examine the effect of tourism-related gross value added (GVA) on regional poverty in Ecuador using ordinary least squares (OLS) analysis, and to analyze the effects of spatial spillovers on poverty through the application of spatial econometric models: the spatial autoregression model (SAR), the spatial error model (SEM), and the lag and spatial error model (SARMA), which combines the SAR, SEM and spatial Durbin error models (SDM). The analysis considered the 198 contiguous cantons of Ecuador, excluding the province of Galápagos, which—as an island—does not have contiguous territory, because of which the estimators of the spatial models for it are less consistent or efficient. Finding the determinants of poverty in developing countries is very important, as it is one of the main objectives of sustainable development.
The data for 2018 were obtained from the databases of the Central Bank of Ecuador [17] and National Survey on Employment, Unemployment and Under-Employment (ENEMDU) [15]. Regional poverty was used as a dependent variable and tourism gross value added (GVA) was used as the independent variable. To validate the robustness of the estimators, covariates were used; namely, the level of schooling, the level of unemployment, ethnicity, and informal-sector employment (self-employed). This study supports the hypothesis that regional poverty is determined by factors in contiguous regions.

2. Literature Review

The tourism-poverty nexus has been explored theoretically [18,19,20,21] and empirically [18,22,23]. Zhao and Ritchie [24] identified a set of research needs and opportunities in this field. There is no definite consensus on the effect of tourism on poverty reduction. Li et al. [25] analyzed 346 articles from 11 tourism-related journals published between 2000 and 2014. They found positive, negative and null effects of tourism on poverty. Tourism has become the subject of major research in the last decade [26]. This literature review shows that numerous studies highlight that tourism development improves poverty indicators [27,28,29]. In contrast, other studies, such as that of Blake, Saba, Sinclair and Teles [10] on Brazil, show that the income generated by tourism activities does not always favor the poorest class, but rather benefits the people who own the means of providing tourism services.
Toward the end of the 1990s, a strategy termed Pro-Poor Tourism (PPT) was developed in Great Britain in order to incorporate the poor into the capitalist market through the interventions of commercially viable tourism projects that increase employment and opportunities for entrepreneurs, benefitting poor individuals and collectives of the poor [30]. The approach draws on the empirical evidence [10] that low-income households benefit from the effects of government programs to promote tourism. In this way, the expansion of tourism is directed specifically towards the lowest income groups.
According to the Tourism Alliance against Poverty [31], tourism that favors the poor results in increased net profits for the poor. Tourism for the poor is not a specific product or a niche sector, but rather an approach to tourism development and management. This condition improves the links between tourism businesses and poor people, so that tourism contributes to the fight against increases in poverty, and so that poor people can participate more effectively in product development.
There is also evidence that community tourism programs have improved the living conditions of the population that is considered poor in regional territories, using sustainable rural tourism as a dependent variable, alongside tourism activities that involve communities, including participation in decision-making, levels of knowledge about the tourism industry and empowerment [8].
The analysis of the impact of tourism on regional inequality indicates a significant long-term relationship, given that promoting the development of tourism is an effective tool to achieve more balanced regional development [7], starting from the fact that the development of the tourism sector can contribute significantly to the reduction of poverty indicators, given that tourism is considered an opportunity-generating activity, e.g., it improves livelihoods among the population by creating employment [9].
Many of the studies conducted in various countries around the world have shown that tourism has positive economic effects in terms of generating incomes and employment and reducing poverty [10,32]. Other authors have argued that tourism has a negative effect on economic growth [33,34,35,36]. Other studies attribute negative effects to tourism. Smorfitt et al. [37] argued that tourism imposes a high cost on regional economies, in that the profits obtained from tourists do not exceed the net losses suffered by local residents, resulting in negative effects on their general wellbeing [38]. Among the studies arguing that tourism has negative impacts on economic growth and poverty, the main causes identified are inefficient policies and environmental factors [39]. There are also studies suggesting that tourism has considerable positive impacts at the regional level, even when its impact at the national level is insignificant [40]. Furthermore, several studies argue that tourism does not have any impact at all [36,41,42,43].
According to Deller [44], changes in poverty rates can to some extent be attributed to the role of recreation and tourism. Based on this, tourism potentially influences poverty rates by three channels; namely, prices, profits and incomes for the government [10]. Firstly, it is considered that prices can negatively affect the poor. The more tourism-related consumption, the higher the production, prices and wages in the tourism sector. Based on this, if wages increase in order to retain labor, the costs and prices of the products of these industries also increase, the result being higher prices overall. This does not benefit poor households that must pay more for the same products, since the increase in the general price level reduces their real income levels.
Secondly, in relation to wages, tourism solely benefits employees in tourism-related industries, given that the highest incomes tend to increase consumption among the poor and improve their level of life, but the poor that are not employed in this sector do not benefit from this source of income. Zhao [45] argued that the poor can benefit from tourism through self-employment in small-scale tourist-oriented businesses. With the help of Grootberg Lodge, Zhao argued that salary income has improved the livelihoods of some households in rural areas [46,47]. The results of a study in Malawi by Gartner and Cukier [48] reveal that, while employees in the tourism sector have better working and monetary conditions, the group does not show improvements in relation to other conditions of poverty.
The third aspect where the influence of tourism on poverty rates can be seen is government revenue, through taxes and tourism-related charges. This revenue can be used to improve the provision of infrastructure in poor areas, housing subsidies for the poor, increased health care and the formation of new jobs. However, the overall impact on the poor of increased government income depends on how this income is allocated. [10]. By adequately redistributing a larger proportion of tourism income to the poor, governments can increase the income levels and living conditions of the poor. Furthermore, by providing job training, governments can increase the employment rates among the poor [25].
This is why the government needs to invest in physical capital in order to improve tourism and the access to tourist destinations, through subsidies to the industry and the establishment of environmental standards for technology adoption and the promotion of regulated tourism. The contribution of tourism to poverty reduction is a challenging issue. For example, using a geographically weighted regression, Deller [44] analyzed what he considered to be the small role of tourism and recreation in explaining changes in poverty rates. Thomas [49] showed that the impact of tourism depends to a large extent on the chosen poverty threshold, a view shared by other authors that have addressed this issue [50,51,52].
While there is some empirical evidence that supports the link between the growth of tourism, economic expansion and poverty reduction in general [53], the evidence of this relationship in Latin America and the Caribbean is scarce in the best of cases. The presence of multiplier impacts of tourism on GDP and poverty are really important; a 5% increase in tourism-related income leads to a 3.09% reduction in poverty [53]. Other authors have argued that, although tourism has a positive effect on economic development, the effect is not statistically significant, which is why Latin American economies are generally based on sectors other than tourism. However, the incomes from tourism are significant to economic growth and poverty reduction in countries like Mexico, Uruguay, Nicaragua, Bolivia, Cuba, the Dominican Republic, Ecuador, Costa Rica, Peru and Brazil [54]. Furthermore, in Mexico, through an autoregressive distributed lags (ARDL) approach, the existence of a long-term relationship between international tourism and poverty reduction is evident [55].
A study by Estrella and Frías [9] showed that the tourism sector in Ecuador has a positive effect on the economy, contributing to economic growth and poverty reduction. Another study of tourism in Ecuador by Oyarvide et al. [56] identified variables that may explain the low level of development, such as the lack of training, low quality of services offered, lack of access to financing, failure to take advantage of natural tourist attractions, lack of socialization of socio-economic and cultural problems, and lack of linkages between productive activities and territorial planning. Similarly, Lambogglia [54] observed that income from tourism has a statistically significant and positive impact on economic growth. The determinants of Ecuadorian tourism that have positive and statistically significant effects are income levels, the human development index and the opening of international trade, while infrastructure and price levels are not significant variables. In Ecuador, tourism is a determining factor of economic growth. The socio-economic policies adopted in the analyzed period contributed to the development of the tourism sector, and consequently to the economic growth of the country [54].
Finally, several studies have been carried out in recent years analyzing the effect of tourism on poverty in different parts of the world. For example, Llorca-Rodríguez et al. [57] found that tourism reduces poverty in Peru, but not extreme poverty owing to a weak macro-environment and low levels of community participation. Similarly, in relation to a neighboring country of Peru, namely Ecuador, Croes and Rivera [53] established that tourism has the potential to decrease inequality and favor the poor. Gao and Wu [58] found that tourism has been used in historic villages in China as a key instrument in rural development and poverty reduction, given that the ideology of rural tourism and the means of sustainable living are integrated in this model [59]. Similarly, Shaanxi et al. [60] analyzed the participation of Chinese households in tourism projects aimed at favoring the poor, and found that the incomes of participating households were significantly higher than those of non-participating households; this difference was also explained by material, financial, political and human capital. Qin et al. [61] examined the positive effect of tourism policies on poverty in China. They found that the degree of the effect of the policy depended in large measure on other cultural, social and economic factors. Den Braber et al. [62] found that protected areas in Nepal alleviate general and extreme poverty, taking into account the performance of tourism, given that poverty has also decreased in areas with few tourists, which could be associated with tourism as an energizing activity. Yergeau [63] affirms that Nepalese households involved in tourism have notably higher incomes than uninvolved households. Njoya and Seetaram [64] analyzed the contribution of tourism to alleviating poverty, and found that the poverty rate decreased marginally, but with more impact in rural areas. In other words, the externalities of urban development are strengthened by the effects of tourism.
As noted above, not only have there have been studies of the impact of tourism in specific countries, but some authors have also examined the effect of tourism at the level of groups of countries. In a study of 43 tourist-receiving countries, Raza and Shah [65] confirmed the compliance of the Kuznets curve; that is, the growth of tourism decreases inequality and poverty. Likewise, Llorca-Rodríguez et al. [66] demonstrated the existence of the Kuznets tourism curve, indicating that both internal and inbound tourism reduce poverty, although internal tourism shows more intensive links to economically backward elements that favor the poor than inbound tourism, which could be explained by access to information. Complementary to this, in an analysis of 13 economies with intensive levels of tourism, Mahadevan and Suardi [13] found that tourism does not reduce personal poverty, but showed that the poverty gap is reduced significantly. In a study of 113 countries in different parts of the world, Lv [7] found that tourism is an efficient tool for the long-term reduction of poverty.
The literature review confirmed that there are few works that employ spatial econometric techniques to capture the regional effects of the interaction of poverty and tourism in order to analyze the role of tourism in reducing poverty in Ecuador. Therefore, the objective and the results of the study are novel, and allow us to raise important political implications. In contrast, Croes and Rivera [11] used a social accounting matrix model to quantify the effect of tourism on poverty.

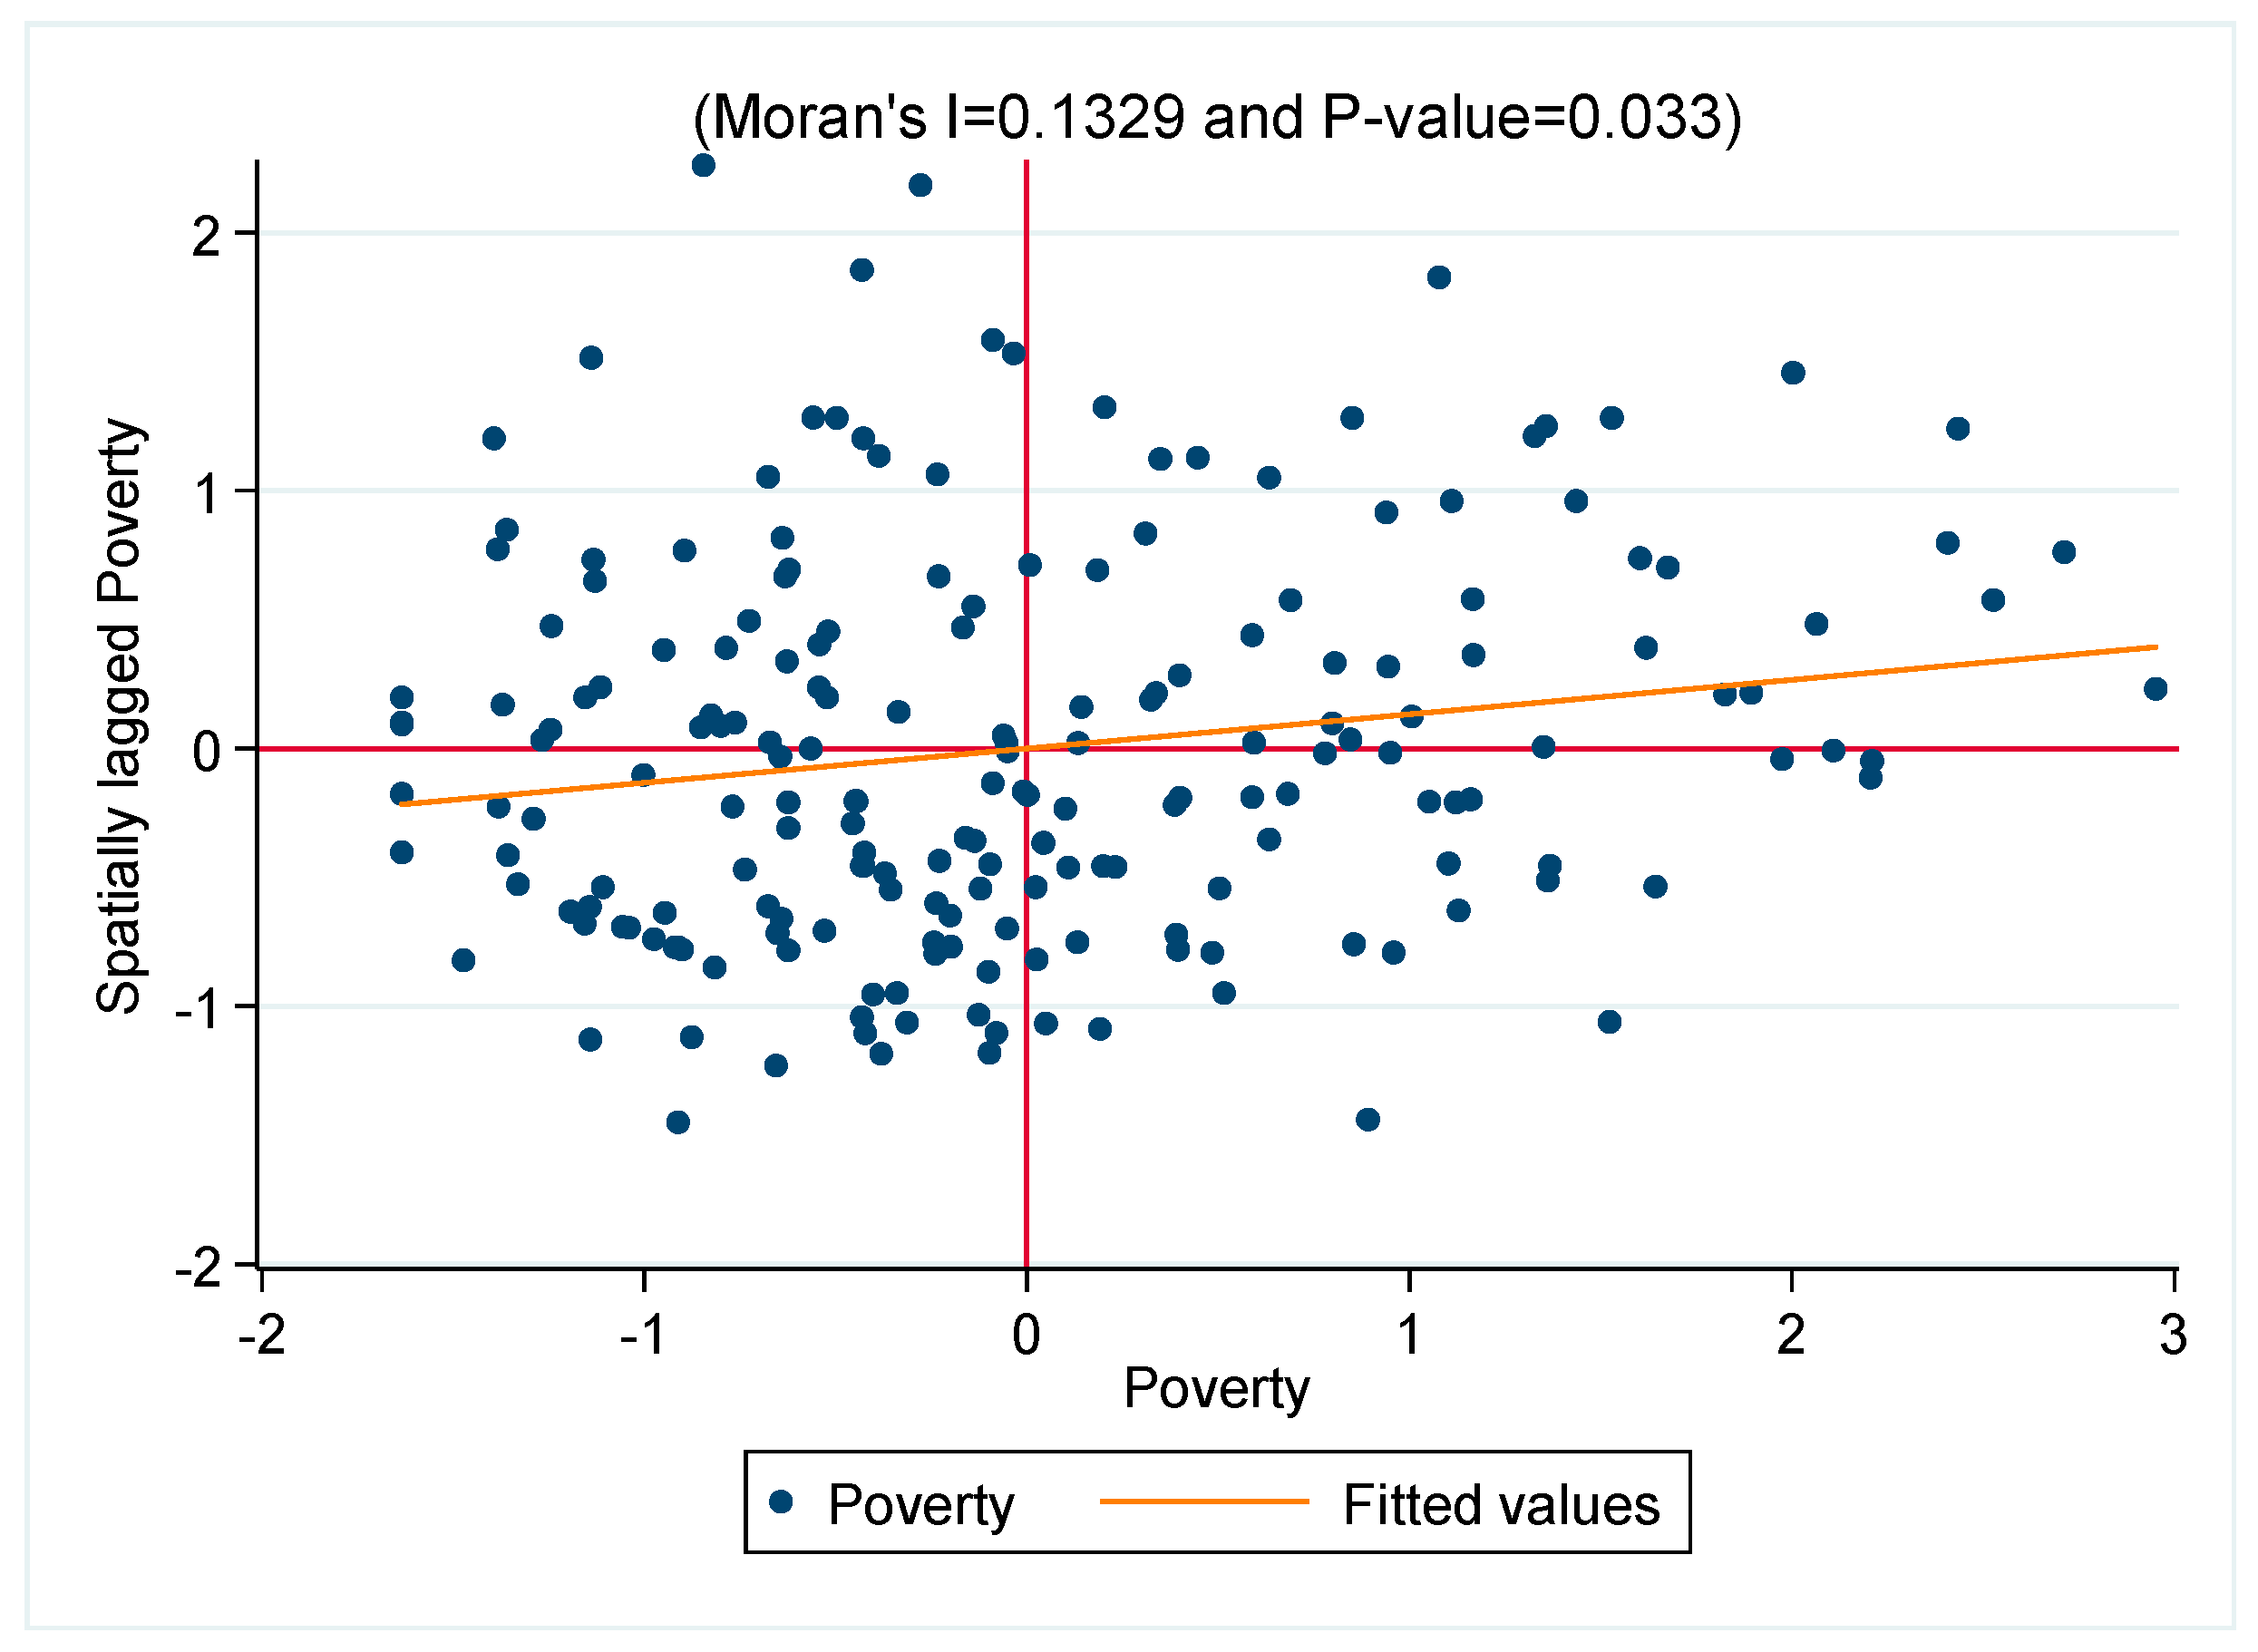
3. Data and Methodology
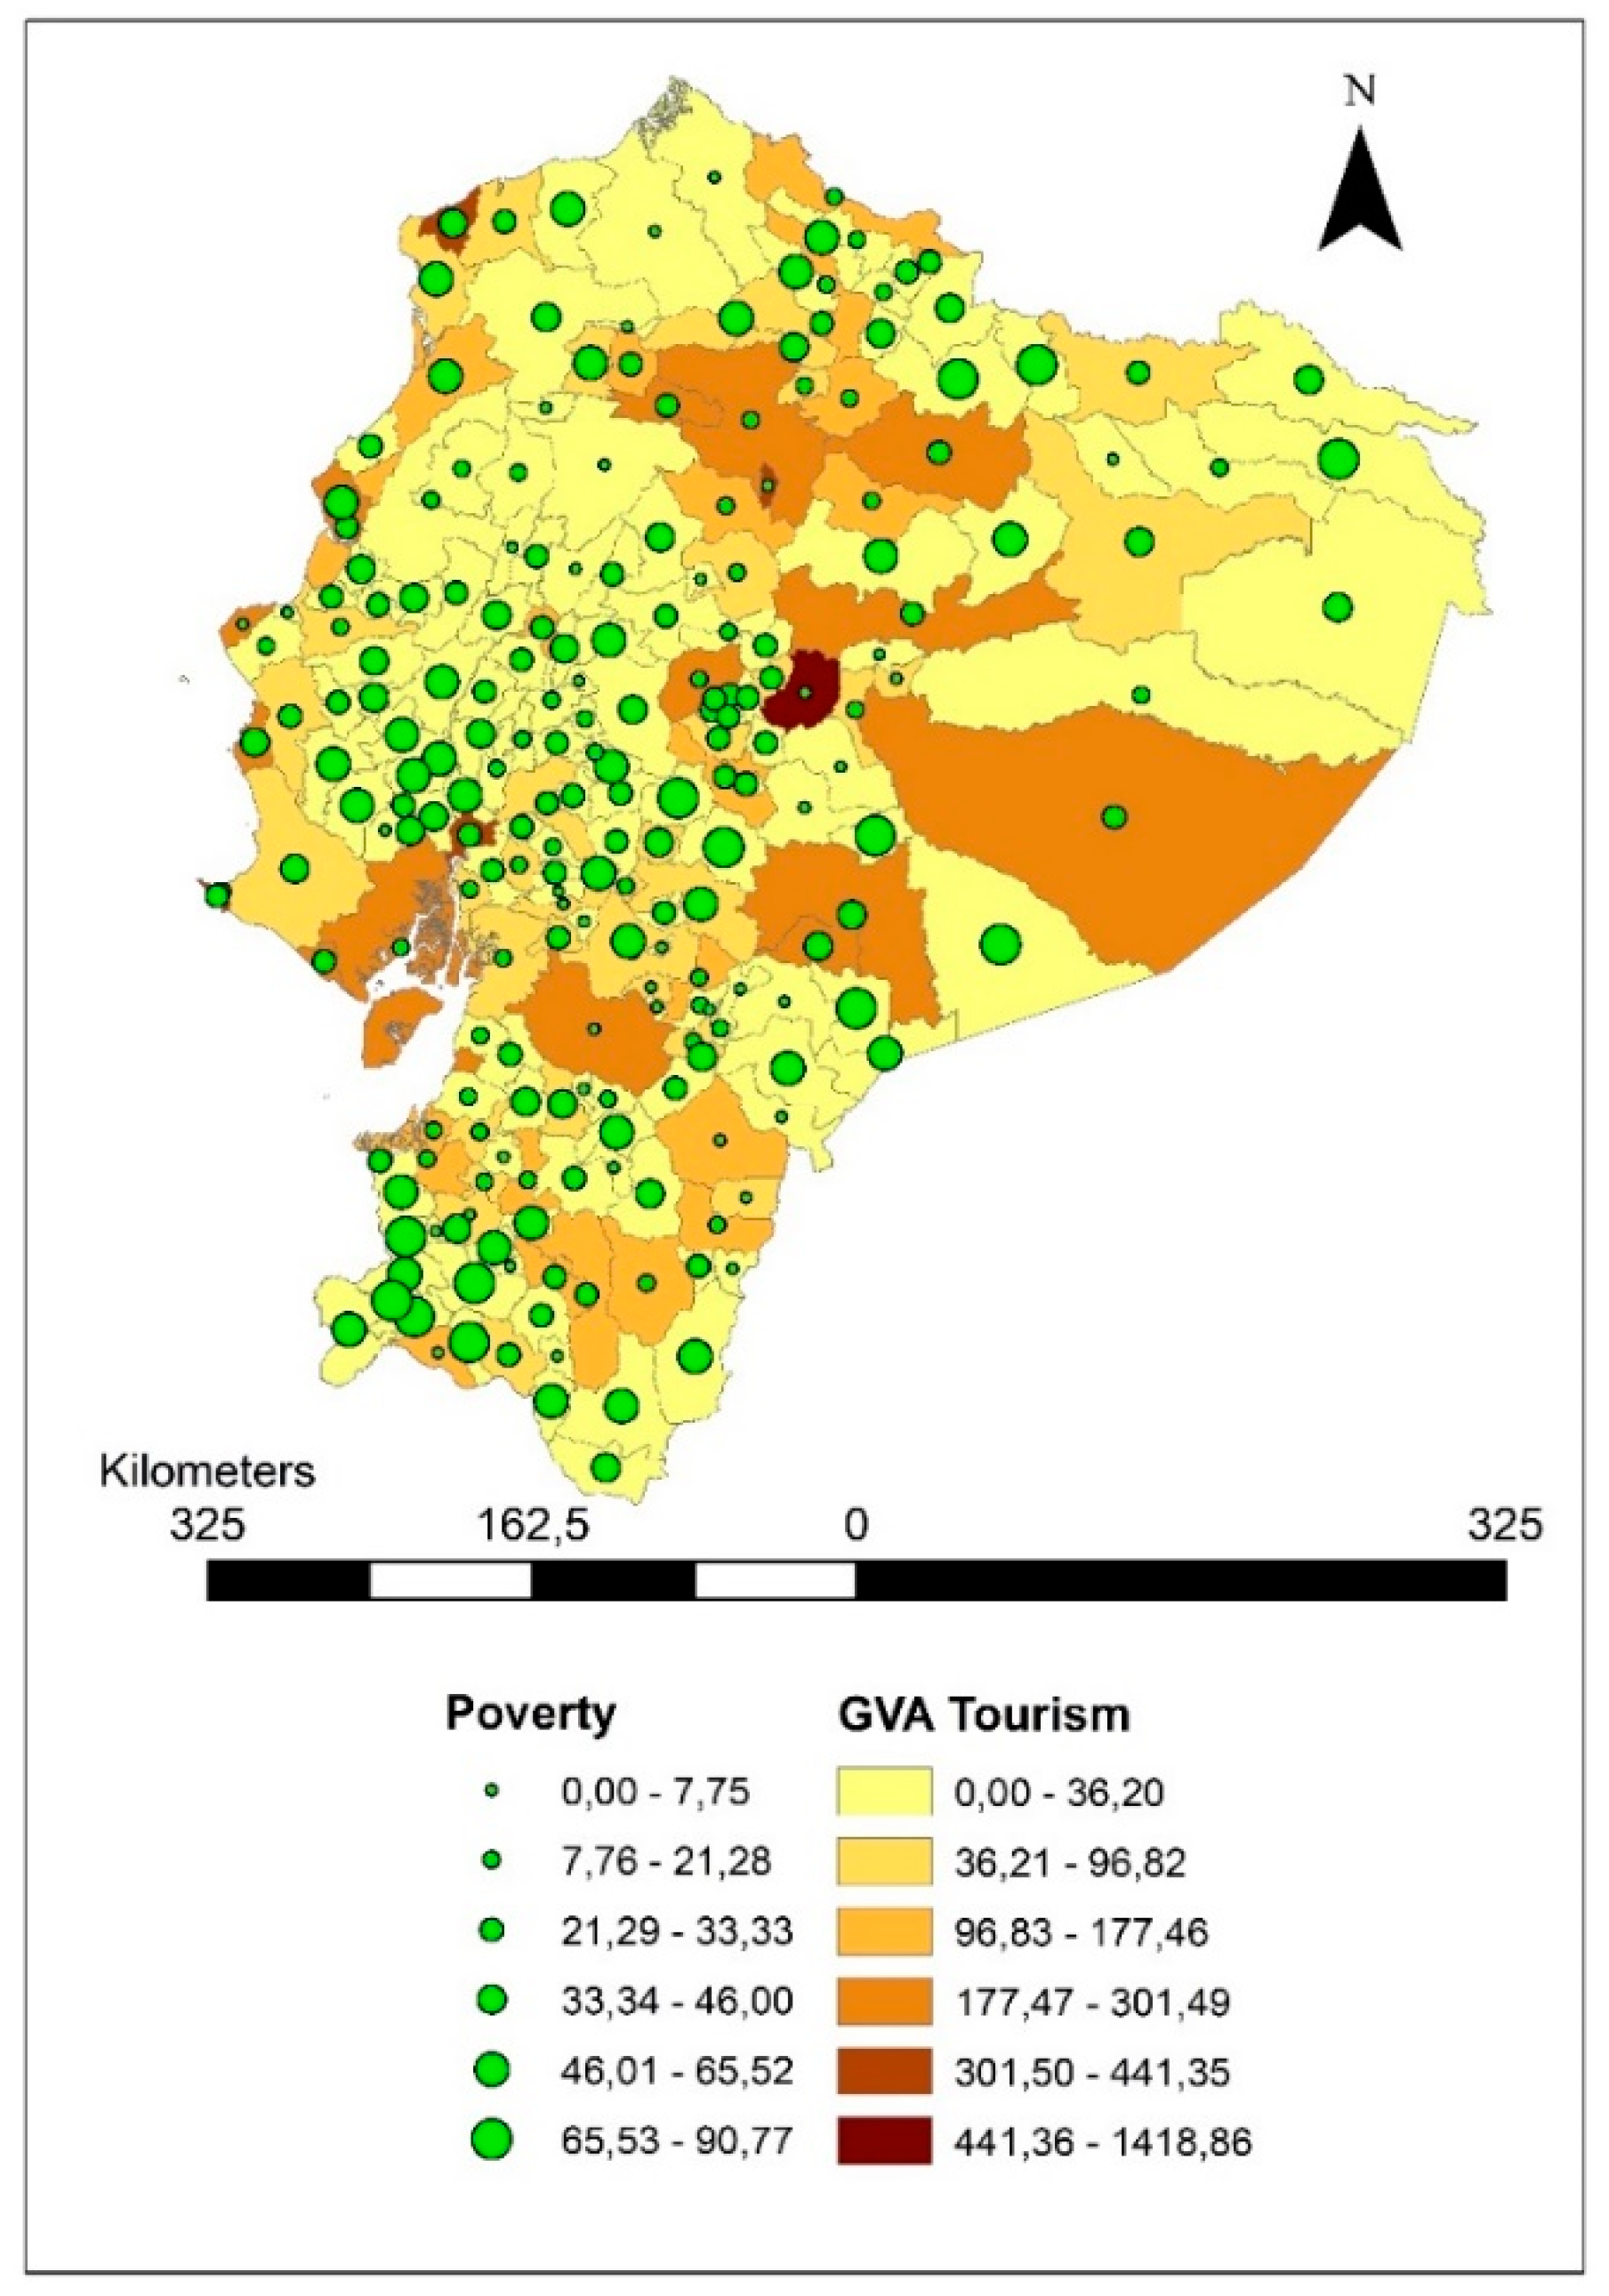
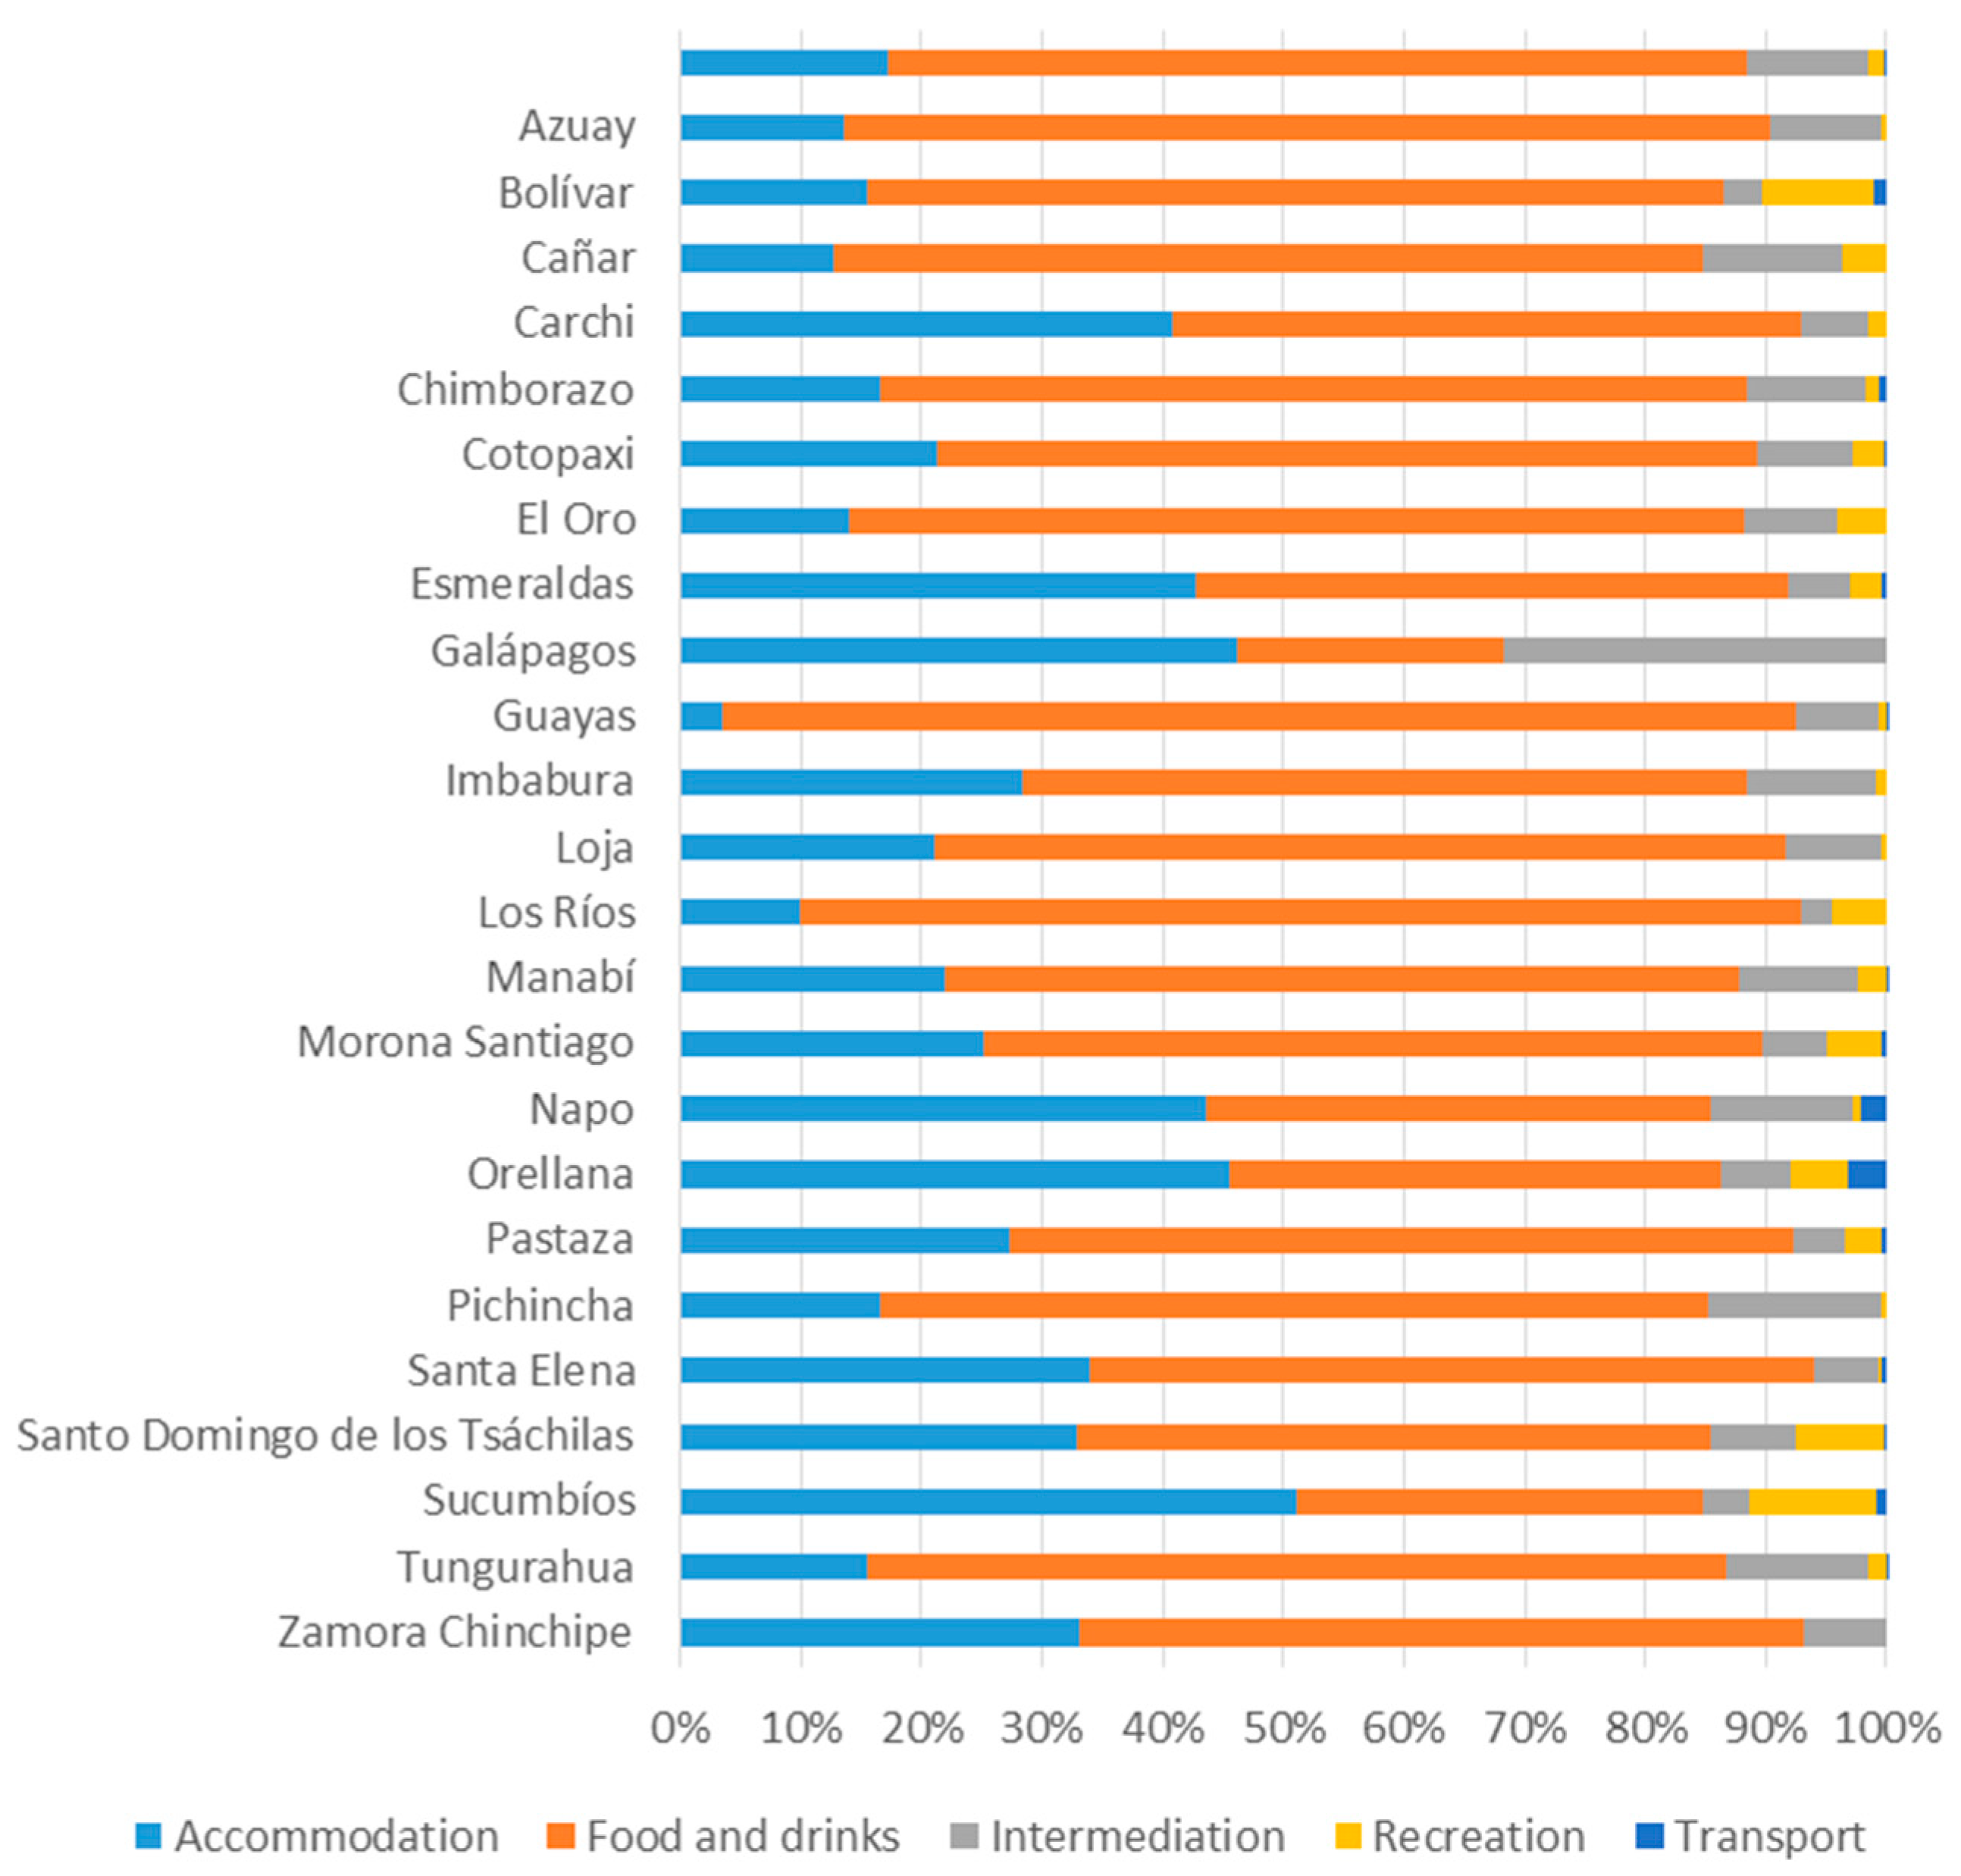
3.1. Data

The necessary data were obtained from the database of the Central Bank of Ecuador (CBE) [17] and the National Survey of Employment, Unemployment and Under-Employment [15] of the National Institute of Statistics and Census (INEC). The regions analyzed were the 198 contiguous Ecuadorian cantons in 2018. Because of the spatial character of the analysis, the Galápagos Province was not considered, as it is an island and does not have contiguous territory with any of the other provinces.
In Ecuador, poverty can be measured by unsatisfied basic needs, by income, or in a multidimensional fashion. The dependent variable of regional poverty was obtained from ENEMDU [15], which refers to income poverty. The independent variable of the gross value added of regional tourism was obtained from CBE [17], which is a real measure (constant 2010 prices) which measures the production capacity of the economy.
The independent variable, schooling, measures how the regions with more study and academic preparation have better job opportunities, with which the regions develop lower poverty rates. The ethnic group allows us to capture the effect of discrimination on poverty. Employment in the formal sector helps us to understand how informal activities in the region make work precarious, and unemployment analyzes how regions with fewer job opportunities generate negative externalities, such as poverty. These variables are widely used in academic literature to examine the determinants of poverty [25,46,49,67,68,69,70,71,72,73,74,75,76,77].
The survey made 59,958 observations in general; this information was then processed to obtain the values for each canton, an essential condition for carrying out the spatial econometric analysis. The National Survey of Employment, Unemployment and Under-Employment [15] variables used in the study are expressed as participation percentages for each canton, except for schooling. Table 1 describes the variables and the main statistics used in the model.
Table 2 shows the correlation matrix of the variables used in the model, in which it is observed that the Log Gross Value Added (GVA) of tourism has a significant negative relationship with Poverty.
Figure 1 shows the relationship between regional poverty and the GAV of tourism in 198 Ecuadorian cantons in 2018. The Tourism GVA is represented in brown, with darker shades representing higher levels of tourism GVA. Regional poverty is represented by the green circles; the larger the circle, the higher the rate of poverty represented. A high level of tourism-related GVA and low levels of poverty were observed in the majority of cantons. Despite this, there are cantons in which this relationship does not occur, because regional poverty is not determined by tourism GVA, but rather by other social, economic and/or spatial determinants, which will be examined later with the inclusion of control variables in the models.
After the correlational analysis of the variables, we performed the spatial autocorrelation test developed by Moran [78]. The I-Moran value, plotted in Figure 2, confirms the existence of positive autocorrelation, with a value of 0.13 at a significance level of 5% (p-value = 0.033).

3.2. Econometric Phase

To achieve the objective of this research, a two-part econometric strategy was employed. The first was a basic regression using ordinary least squares (OLS), which is formalized in the following equation:
P i = β 0 + B 1 L o g ( T G V A ) i + ε i
In Equation (1), P i is regional poverty, L o g ( T G V A ) i represents the logarithm for the gross value added generated by tourism, and ε i represents the error term of the regions i = 1 , , 198 , respectively. After estimating the basic relationship, covariates were included in order to analyze the other factors that determine regional poverty. Thus, Equation (2), which follows, is derived from Equation (1):
P i = β 0 + B 1 L o g ( T G V A ) i + B 2 Z i + ε i
where Z i is a vector that contains the control variables indicated in Table 1, such as schooling, unemployment, ethnicity and informal-sector employment.
The second part of the econometric strategy was to estimate spatial models that allow for the capture of the effect of geographic contiguity. The I-Moran test (0.1329) indicates the presence of spatial autocorrelation at the significance level of 5%. The economic dynamic is highly related to geographic space, even more when it is strengthened according to the location of economic resources. Authors like Fischer and Griffith [79] suggest the application of spatial analysis to study the spatial spillovers of economic phenomena. The first model to be estimated was the spatial autoregression model (SAR), which was used to analyze how the poverty of one region is affected by that of contiguous regions. Following Anselin [80], the model is proposed as follows:
P i = ρ W y + X β + ε
where P i is a vector of observations for the dependent variable, ρ is a spatial autocorrelation parameter, X is a vector of covariates, and ε is a vector of independent and identically distributed error terms. W is a matrix of spatial or contiguous weights that determines the set of contiguous regions for the location, and is a base element for the spatial analysis of the results. The elements of W are the following:
W = [ 0 ω i j ω i k ω j i 0 ω j k ω k i ω k j 0 ]
According to LeSage and Pace [81], the matrix W will be of order N x N , in which N is the number of observations. Each element of W is called special weight ( ω i j ), which capture contiguity and are different from zero when cantons i and j are defined as neighboring. Furthermore, no region can neighbor itself; therefore, the elements of the main diagonal of W are equal to zero, ω i i = 0 . To determine the existence of spatial dependence in the error terms in the observations, the spatial error model (SEM) was employed to identify whether poverty is determined by the omitted variables of the neighboring regions. The model is defined as follows:
P i = X β + u
u = λ W u + ε
where, W is a matrix of spatial weights N x N , λ is a parameter of spatial autocorrelation of errors u , and ε is a vector of an independent and equally distributed error term. Thus, the variable in this model which is dependent on location is a function of the independent variables, as well as the errors u of the neighboring regions. The Lag and Special Error Model (SARMA), which is based on the definitions of the two previously described models, has the following description:
P i = ρ W y + X β + u
u = ε λ W u
Finally, the spatial Durbin error model (SDM) proposed by LeSage and Pace [81] was employed to determine if the poverty of a given region is the result of the tourism activities of neighboring regions. This model is formally defined by:
P i = ρ W y + X β + γ W X + ε
where, W is a matrix of spatial weights of N x N , ρ and γ are the parameters of spatial autocorrelation of the dependent and independent variables, respectively, and ε is the vector of independent and identically-distributed error terms. After estimating the equations detailed in this section, the following section presents and discusses the results.

4. Discussion of the Results

4.1. Results

A set of econometric models was estimated using the ordinary least squares (OLS) and spatial models to examine the effect of tourism activities in reducing poverty. Table 3 shows the results of the basic regressions of the models. An inverse and statistically significant relationship between tourist activities and regional poverty was observed in the OLS and SDM models. Thus, tourism activities and poverty are negatively related because tourism is developed in regions with less poverty. When tourism activities increase by 1%, poverty decreases by between 4.311% and 0.748%.
In the SAR model, the Lambda coefficient is not significant, so the premise that regional poverty depends on the poverty of neighboring regions is discarded. On the other hand, the Rho coefficient in the SEM model it is not statistically significant. The Rho and Lambda coefficients are not statistically significant in the SARMA model; that is, the results do not allow us to affirm that the poverty of a region is independent of the poverty of neighboring regions. The SDM model is statistically significant because the Lambda coefficient is statistically significant; the poverty of a region decreases by 0.748% when the GVA of the economic activity of a neighboring region increases by 1%.
Table 4 shows the relationship between the tourism GVA and regional poverty, with the control variables. The OLS model maintains the sign of the relationship but is not statistically significant. The tourism GVA variable is not significant; however, schooling and the mixed population have a negative and statistically significant effect on the poverty of the canton itself. This is due to the fact that the cantons with a higher level of education are associated with lower poverty, and the cantons with a high tourist GVA tend to concentrate a higher level of education; likewise, the mestizo population is related to lower poverty levels, and the regions with a high tourist GVA tend to concentrate a greater mestizo population. Thus, when schooling and the percentage of the mestizo population increase, poverty decreases by 5.757% and 0.203%, respectively.
Regarding the SDM model, the statistically significant and negative relationship remains; likewise, the tourist activity of one region can decrease the poverty percentage of another neighboring region by 2.413%. With respect to the control variables, regional poverty increases when the level of schooling in the neighboring cantons increases. Likewise, the increase in the informality of one region increases the poverty of neighboring regions; that is, informality allows individuals to undertake activities and generate income to escape poverty; however, these are activities with low remunerations that do not allow the generation of the necessary resources to reduce poverty. Furthermore, regional poverty decreases in the region and neighboring regions when the mestizo population increases in relation to the Afro-American population.
The difference in the coefficient of the GVA tourism variable of the OLS and SDM model could be explained by the fact that certain cantons have greater development potential and offer relatively higher wages, which is attractive for people from neighboring cantons who can move easily due to the proximity of the regions. Furthermore, in some cantons with greater economic development, there are other economic activities that generate more income than tourism, in which a large part of the canton’s population may be concentrated, such that tourism-related activities may be occupied by people from neighboring cantons who see it as an opportunity to get out of poverty.

4.2. Discussion of Results

The results of the basic regressions shown in Table 3 concur with those obtained by Pham et al. [41], who stated that tourism has a positive effect in reducing poverty at the regional level, although its effect is insignificant at the national level. This is similar to what Blake et al. [10] and Scheyvens and Russell [32] observed; they pointed out that tourism has a positive economic effect, generating incomes and jobs and reducing poverty. However, contrary to what Agarwal [33], Iverson [34], Pratt [35] and Akama and Kieti [36] have stated, the OLS regression makes evident the existence of a negative and statistically significant relationship. The more dynamic the tourism sector, the more the demand for goods and services, which translates into job creation and poverty reduction. This concurs with Harrison [30], who noted that tourism projects increase employment and business opportunities, benefiting populations and collectives.
According to Table 4, which includes the covariates, the results of the SDM model are similar to those of Pérez [82] and Barragán [83], who found that the poverty of a region is associated with spatial factors of neighboring regions. The result, that regional poverty increases when the educational level in neighboring cantons increase, is associated with the fact that the more developed regions concentrate a greater quantity of skilled labor and generate competition and inequality with neighboring regions. Since according to Alvarado, Jiménez, Sánchez and Ponce [84], human capital has a positive effect on the level of regional entrepreneurship with spatial spills, such that the entrepreneurship rate of a given region depends on the neighboring areas and local human capital closer by. Regarding informality, Zhao [45] observed that the poor benefit from tourism through self-employment in small-scale tourism-related businesses. However, if attempts are made to bring informal workers into the formal sector, the reduction in the incidence of poverty is not very significant, since there are other factors that contribute to poverty, such as high dependency rates among poor households, and the shorter number of hours that informal-sector workers work [85]. The condition of informality in itself is a source of low incomes, explaining between 60 and 70% of the difference in the wage incomes of formal and informal sector workers. The importance of informal-sector employment and the lower remuneration that workers in this sector receive indicate a relationship between informality and poverty [86]. Regarding the Mestizo population, according to Churchill, Smyth [73], poverty is determined by racial discrimination factors.
The results as a whole indicate the existence of economic and spatial factors that determine regional poverty. This confirms the hypothesis that regional poverty is determined by spatial spillovers. These results are supported by the fact that poverty is associated with geographic, as well as social and economic, conditions.
Gartner and Cukier [48] affirm that while the employees of the tourism sector experience improved working and monetary conditions, the group does not exhibit improvements in relation to other aspects of poverty, given that poverty is a multidimensional condition. Added to this, the impact of tourism on poverty depends largely on the poverty threshold chosen [50,51,52], and poverty can worsen or improve according to factors in the region itself, as well as factors in neighboring regions.
Based on an analysis of consumption in Ecuador, Barragán [83] showed the existence of spatial dependence at the parochial level. This concurs with the results of a spatial analysis of poverty in Colombia by Pérez [82], who observed spatial dependence at the departmental and municipal levels, indicating that geographic location is an important determinant of poverty. That is, the fact that each region has on its neighbors is a fundamental determinant in explaining poverty. This result differs from that of Tapia [87], who concluded from his analysis of multidimensional poverty in Ecuador that the increase or decrease in poverty in a spatial unit (canton) does not affect the level of poverty in neighboring canton.
The tourism activity typical of the region contributes to reducing poverty, which is consistent with Estrella and Frías [9], who concluded that the tourism sector has a positive effect on the economy and contributes to economic growth. It also confirms that the tourism sector can play an important role in poverty reduction. The presence of multiplier effects of tourism on the GNP and poverty are really important, with a 5% increase in tourism resulting in a 3.09% reduction in poverty [53]. Harrison [30] and Estrella and Frías [9] indicated that, in countries that depend mainly on tourism, this sector can represent between 30 and 90% of GNP, and employ between 20 and 50% of the population [5]. Tourism also improves the links between tourist businesses and the poor in order to increase the contribution of tourism to the fight against poverty. Furthermore, it allows the poor to participate more effectively in the development of the region. Finally, tourism generates spatial spills, thereby reducing poverty in neighboring regions. This is contrary to what was found by Smorfitt et al. [37], who argued that tourism imposes a major cost to regional economies, given that the incomes obtained from tourists owing to the expansion of tourism are less than the net losses suffered by residents, resulting in a negative impact on the general wellbeing of the population [38]. Economic policy-makers should direct their strategies to reducing regional poverty. They should take into account the economic and spatial characteristics of the cantons themselves and of their neighboring cantons, given that poverty is not an isolated phenomenon, but rather depends on the factors of neighboring regions. Government intervention is therefore necessary in the correct allocation of income from tourism among different groups. If tourism is managed by focusing primarily on poverty alleviation, it can directly benefit the poorest groups by employing the local population in tourism businesses, providing goods and services to tourists, managing small and community-based businesses, and improving access to tourist destinations, with a consequent positive impact on poverty reduction according to Blake et al. [10] and Li, Jin and Shi [25]. Since, in Ecuador, the tourist activities with the highest demand are those related to food, the skills required of people do not require a high degree of preparation, so the availability of people to enter the tourism sector is immediate and represents a low cost of transaction. In this way, tourism activity becomes one of the key factors in achieving the goal of sustainable development, eradicating world poverty. Ecuador can take advantage of its tourist potential due to its geographical location, its biodiversity, and its intercultural diversity. All of its provinces have tourism potential; the development of that potential depends not only on activity but also on state support. According to the Ministry of Tourism of Ecuador [14], all of the provinces have tourism potential, as can be seen in Figure A1 (Appendix A).

5. Conclusions and Policy Implications

This examination of the economic and spatial determinants of regional poverty makes an important contribution for economic policy-makers, since they can make appropriate decisions based on empirical data to combat poverty. Furthermore, it provides sufficient evidence which contributes to achieving the objective of sustainable development, i.e., eradicating poverty worldwide.
This research examined the effect of the gross value added of tourism on regional poverty in Ecuador, using basic econometric and spatial models to examine the role of neighboring regions in determining the poverty of Ecuadorian cantons. This study made a novel contribution in that there have not been any previous studies that analyze the relationship between poverty and tourism in Ecuador. The contribution is very significant; the results of the study indicate that poverty and tourism activities are negatively related in the same canton, and with the neighboring regions; that is to say, the increase in the tourist activity of a canton reduces the poverty of the canton and its neighboring cantons. Furthermore, poverty is reduced by the increase in informal-sector employment in the canton itself, as well as in adjoining cantons. Poverty can worsen or improve according to factors typical of the region, as well as the factors of neighboring regions. Thus, the tourist activity which is typical of a region contributes to the reduction of its poverty. Additionally, there are effects of territorial contiguity on the poverty of the cantons; that is, the poverty of a canton is not the result of the poverty or economic activity in neighboring regions; however, the poverty of a canton increases when the level of schooling in the neighboring cantons increases.
One of the limitations of this study is that the analysis employed cross-sectional data, which limits the temporal and spatial dimensions of econometric analyses. Another limitation is derived from the inclusion of new control variables that have not been considered due to the lack of data at the official database level.

Author Contributions

All authors contributed equally to this work. All authors wrote, reviewed and commented on the manuscript. All authors have read and agreed to the published version of the manuscript.

Funding

This research received no external funding.

Conflicts of Interest

The authors declare no conflict of interest.

Appendix A

Figure A1. Tourist demand by provinces in Ecuador 2018, based on data from the Ministry of Tourism [14].
Sustainability 12 06138 g0a1

References

  1. UNWTO. Recommendations on tourism statistics. In United Nations and World Tourism Organization. Statistical Papers; Technical Report No.83; UNWTO: New York, NY, USA, 1994. [Google Scholar]
  2. Nisbett, M. Empowering the empowered? Slum tourism and the depoliticization of poverty. Geoforum 2017, 85, 37–45. [Google Scholar] [CrossRef] [Green Version]
  3. UNWTO. Global Report on Inclusive Tourism Destinations: Model and Success Stories; UNWTO: New York, NY, USA, 2018. [Google Scholar]
  4. Hughes, S.; Haworth, N. The International Labour Organization (ILO): Coming in from the Cold (Vol. 45); Routledge: Abingdon, UK, 2011. [Google Scholar]
  5. Jiménez, O.; Cavazos, J. El turismo orientado a los pobres: Una alternativa estratégica para los países en desarrollo. PasosRev. De Tur. Y Patrim. Cult. 2012, 10, 451–465. [Google Scholar] [CrossRef]
  6. Sokhanvar, A.; Çiftçio, S.; Javid, E. Another look at tourism- economic development nexus. Tour. Manag. Perspect. 2018, 26, 97–106. [Google Scholar] [CrossRef]
  7. Lv, Z. Deepening or lessening? The effects of tourism on regional inequality. Tour. Manag. 2019, 72, 23–26. [Google Scholar] [CrossRef]
  8. Sook Fun, F.; May Chiun, L.; Songan, P.; Vikneswaran, N. The Impact of Local Communities’ Involvement and Relationship Quality on Sustainable Rural Tourism in Rural Area, Sarawak. The Moderating Impact of Self-efficacy. Procedia—Soc. Behav. Sci. 2014, 144, 60–65. [Google Scholar]
  9. Estrella, M.; Frías, R. Impacto del Turismo en el Alivio de la Pobreza. Caso Ecuador. Rev. ECA Sinerg. 2017, 8, 69–79. [Google Scholar] [CrossRef] [Green Version]
  10. Blake, A.; Saba, J.; Sinclair, M.; Teles, V. Tourism and Poverty Relief. Ann. Tour. Res. 2008, 35, 107–126. [Google Scholar] [CrossRef]
  11. Croes, R.; Rivera, M. Tourism’s potential to benefit the poor: A social accounting matrix model applied to Ecuador. Tour. Econ. 2017, 23, 29–48. [Google Scholar] [CrossRef]
  12. Croes, R.; Vanegas, M. Cointegration and causality between tuourism and poverty reduction. J. Travel Res. 2008, 47, 94–103. [Google Scholar] [CrossRef] [Green Version]
  13. Mahadevan, R.; Suardi, S. Panel evidence on the impact of tourism growth on poverty, poverty gap and income inequality. Curr. Issues Tour. 2017, 22, 253–264. [Google Scholar] [CrossRef]
  14. Ministerio de Turismo. Información Relevante del Turismo en el Ecuador; Ministerio de Turismo: Cuenca, Ecuador, 2019. [Google Scholar]
  15. National Institute of Statistics and Censuses (INEC). Employment, Unemployment and Underemployment Surveys/Encuestas de Empleo, Desempleo y Subempleo (ENEMDU). Available online: http://www.ecuadorencifras.gob.ec/informacion-historica-de-empleo/ (accessed on 5 April 2020).
  16. Correa-Quezada, R.; García-Vélez, D.; del Río-Rama, M.C.; Álvarez-García, J. Poverty Traps in the Municipalities of Ecuador: Empirical Evidence. Sustainability 2018, 10, 4316. [Google Scholar] [CrossRef] [Green Version]
  17. Central Bank of Ecuador. CBE. Provincial Accounts Report; CBE: Quito, Ecuador, 2019. [Google Scholar]
  18. Croes, R. Una exploración del potencial del turismo en la lucha contra la pobreza en América Latina. Diálogos Rev. Electrón. De Hist. 2012, 13, 41–63. [Google Scholar]
  19. Scheyvens, R. Exploring the tourism-poverty nexus. Curr. Issues Tour. 2007, 10, 231–254. [Google Scholar] [CrossRef]
  20. Rubí-González, F.; Palafox-Muñoz, A. El Turismo Como Catalizador de la Pobreza; Alba Sud: Barcelona, España, 2017; Available online: http://www.albasud.org/publ/docs/79.ca.pdf (accessed on 12 February 2020).
  21. Jiang, M.; DeLacy, T.; Mkiramweni, N.P.; Harrison, D. Some evidence for tourism alleviating poverty. Ann. Tour. Res. 2011, 38, 1181–1184. [Google Scholar] [CrossRef]
  22. Ramchander, P. Township tourism: Blessing or blight? The case of Soweto in South Africa. In Cultural Tourism Global Local Perspectives; Haworth Press: Philadelphia, PA, USA, 2007; pp. 39–67. [Google Scholar]
  23. Rolfes, M. Poverty tourism: Theoretical reflections and empirical findings regarding an extraordinary form of tourism. GeoJournal 2010, 75, 421–442. [Google Scholar] [CrossRef]
  24. Zhao, W.; Ritchie, J. Tourism and poverty alleviation: An integrative research framework. Curr. Issues Tour. 2007, 10, 119–143. [Google Scholar] [CrossRef]
  25. Li, K.X.; Jin, M.; Shi, W. Tourism as an important impetus to promoting economic growth: A critical review. Tour. Manag. Perspect. 2018, 26, 135–142. [Google Scholar] [CrossRef]
  26. Richards, G. Cultural tourism: A review of recent research and trends. J. Hosp. Tour. Manag. 2018, 36, 12–21. [Google Scholar] [CrossRef]
  27. Gal, Y.; Gal, A.; Hadas, E. Coupling tourism development and agricultural processes in a dynamic environment. Curr. Issues Tour. 2010, 13, 279–295. [Google Scholar] [CrossRef]
  28. De Vita, G. The long-run impact of exchange rate regimes on international tourism flows. Tour. Manag. 2014, 45, 226–233. [Google Scholar] [CrossRef]
  29. Tang, C.F. Temporal Granger causality and the dynamics relationship between real tourism receipts, real income and real exchange rates in Malaysia. Int. J. Tour. Res. 2013, 15, 272–284. [Google Scholar] [CrossRef]
  30. Harrinson, D. Pro-poor Tourism: A critique. Third World Q. 2008, 29, 851–868. [Google Scholar] [CrossRef]
  31. Tourism Alliance against Poverty. 2011. Available online: http://www.propoortourism.info/ (accessed on 12 February 2020).
  32. Scheyvens, R.; Russell, M. Tourism, land tenure and poverty alleviation in Fiji. Tour. Geogr. 2012, 14, 1–25. [Google Scholar] [CrossRef]
  33. Agarwal, S. Resort economy and direct economic linkages. Ann. Tour. Res. 2012, 39, 1470–1494. [Google Scholar] [CrossRef]
  34. Iverson, T. The economic impact of the Mariana Trench Marine National Monument. Asia Pac. J. Tour. Res. 2010, 15, 319–338. [Google Scholar] [CrossRef]
  35. Pratt, S. A general equilibrium analysis of the economic impact of a devaluation on tourism: The case of Fiji. Tour. Econ. 2014, 20, 389–405. [Google Scholar] [CrossRef]
  36. Akama, J.S.; Kieti, D. Tourism and socio-economic development in developing countries: A case study of Mombasa Resort in Kenya. J. Sustain. Tour. 2007, 15, 735–748. [Google Scholar] [CrossRef]
  37. Smorfitt, D.; Harrison, S.; Herbohn, J. Potential economic implications for regional tourism of a foot and mouth disease outbreak in North Queensland. Tour. Econ. 2005, 11, 411–430. [Google Scholar] [CrossRef]
  38. Lindberg, K.; Andersson, T.; Dellaert, B. Tourism development: Assessing social gains and losses. Ann. Tour. Res. 2001, 28, 1010–1030. [Google Scholar] [CrossRef]
  39. Dwyer, L.; Forsyth, P.; Spurr, R.; Hoque, S. Economic impacts of a carbon tax on the Australian tourism industry. J. Travel Res. 2013, 52, 143–155. [Google Scholar] [CrossRef]
  40. Pham, T.; Simmons, D.; Spurr, R. Climate change-induced economic impacts on tourism destinations: The case of Australia. J. Sustain. Tour. 2010, 18, 449–473. [Google Scholar] [CrossRef]
  41. Oh, C.O. The contribution of tourism development to economic growth in the Korean economy. Tour. Manag. 2005, 26, 39–44. [Google Scholar] [CrossRef]
  42. Onis, Z.; Senses, F. Rethinking the emerging post-Washington consensus. Dev. Chang. 2005, 36, 263–290. [Google Scholar] [CrossRef]
  43. Pluss, C.; Backes, M. Red Card for tourism? In 10 Principles and Challenges for a Sustainable Tourism Development in the 21st Century; (NGO Network for Sustainable Tourism Development); DANTE: Freiburg, Germany, 2002. [Google Scholar]
  44. Deller, S. Rural poverty, tourism and spatial heterogeneity. Ann. Tour. Res. 2010, 37, 180–205. [Google Scholar] [CrossRef]
  45. Zhao, W. The nature and roles of small tourism business in poverty alleviation: Evidence from Guangxi, China. Asia Pac. J. Tour. Res. 2009, 14, 169–182. [Google Scholar] [CrossRef]
  46. Lapeyre, R. The Grootberg lodge partnership in Namibia: Towards poverty alleviation and empowerment for long-term sustainability? Curr. Issues Tour. 2011, 14, 221–234. [Google Scholar] [CrossRef]
  47. Lacher, R.; Oh, C. Is tourism a low-income industry? Evidence from three coastal regions. J. Travel Res. 2012, 51, 464–472. [Google Scholar] [CrossRef]
  48. Gartner, C.; Cukier, J. Is tourism employment a sufficient mechanism for poverty reduction? A case study from Nkhata Bay, Malawi. Curr. Issues Tour. 2012, 15, 545–562. [Google Scholar] [CrossRef]
  49. Thomas, F. Addressing the measurement of tourism in terms of poverty reduction: Tourism value chain analysis in Lao PDR and Mali. Int. J. Tour. Res. 2014, 16, 368–376. [Google Scholar] [CrossRef]
  50. Spenceley, A.; Goodwin, H. Nature-based tourism and poverty alleviation: Impacts of private sector and parastatal enterprises in and around Kruger National Park, South Africa. Curr. Issues Tour. 2007, 10, 255–277. [Google Scholar] [CrossRef]
  51. Butcher, J. Can ecotourism contribute to tackling poverty? The importance of ‘symbiosis’. Curr. Issues Tour. 2011, 14, 295–307. [Google Scholar] [CrossRef]
  52. Hummel, J.; Gujadhur, T.; Ritsma, N. Evolution of tourism approaches for poverty reduction impact in SNV Asia: Cases from Lao PDR, Bhutan and Vietnam. Asia Pac. J. Tour. Res. 2013, 18, 369–384. [Google Scholar] [CrossRef]
  53. Croes, R.; Vanegas, M. Tourism and poverty alleviation: A co-integration analysis. J. Travel Res. 2008, 47, 94–103. [Google Scholar] [CrossRef] [Green Version]
  54. Lambogglia, J. Análisis del Turismo y su Importancia en el Crecimiento Económico en América Latina: El Caso del Ecuador; Facultad Latinoamericana de Ciencias Sociales—Sede Ecuador: Quito, Ecuador; Departamento de Desarrollo: San Juan, Puerto Rico; Ambiente y Territorio: Buenos Aires, Argentina, 2014.
  55. Garza-Rodríguez, J. Tourism and poverty reduction in Mexico: An ARDL cointegration approach. Sustainability 2019, 11, 845. [Google Scholar] [CrossRef] [Green Version]
  56. Oyarvide, H.; Nazareno, I.; Roldán, A.; Ferrales, Y. Emprendimiento como factor del desarrollo turístico rural sostenible. Retos De La Dir. 2016, 10, 71–93. [Google Scholar]
  57. Llorca-Rodríguez, C.M.; Jurado-Casas, A.C.; García-Fernández, R.M. Tourism and poverty alleviation: An empirical analysis using panel data on Peru’s departments. Int. J. Tour. Res. 2017, 19, 746–756. [Google Scholar] [CrossRef]
  58. Gao, J.; Wu, B. Revitalizing traditional villages through rural tourism: A case study of Yuanjia Village, Shaanxi Province, China. Tour. Manag. 2017, 63, 223–233. [Google Scholar] [CrossRef]
  59. Lor, J.J.; Kwa, S.; Donaldson, J.A. Making ethnic tourism good for the poor. Ann. Tour. Res. 2019, 76, 140–152. [Google Scholar] [CrossRef]
  60. Shaanxi, S.; Lo, K.; Li, J.; Wang, M.; Li, C.; Li, S.; Lo, K. A Comparative Analysis of Participating and Non-Participating Households in Pro-Poor Tourism in A Comparative Analysis of Participating and Non-Participating Households in Pro-Poor Tourism in Southern Shaanxi, China. Tour. Plan. Dev. 2018, 25, 1–16. [Google Scholar]
  61. Qin, D.; Xu, H.; Chung, Y. Perceived impacts of the poverty alleviation tourism policy on the poor in. J. Hosp. Tour. Manag. 2019, 41, 41–50. [Google Scholar] [CrossRef]
  62. Den Braber, B.; Evans, K.L.; Oldekop, J.A. Impact of protected areas on poverty, extreme poverty, and inequality in Nepal. Conserv. Lett. 2018, 11, e12576. [Google Scholar] [CrossRef]
  63. Yergeau, M.E. Tourism and local welfare: A multilevel analysis in Nepal’s protected areas. World Dev. 2020, 127, 104744. [Google Scholar] [CrossRef]
  64. Njoya, E.T.; Seetaram, N. Tourism Contribution to Poverty Alleviation in Kenya: A Dynamic Computable General Equilibrium Analysis. J. Travel Res. 2018, 57, 513–524. [Google Scholar] [CrossRef] [Green Version]
  65. Raza, S.A.; Shah, N. Tourism growth and income inequality: Does Kuznets Curve hypothesis exist in top tourist arrival countries Tourism growth and income inequality. Asia Pac. J. Tour. Res. 2017, 22, 1–11. [Google Scholar] [CrossRef]
  66. Llorca-Rodríguez, C.M.; García-Fernandez, R.M.; Casas-Jurado, A.C. Domestic versus inbound tourism in poverty reduction: Evidence from panel data. Curr. Issues Tour. 2018, 23, 1–20. [Google Scholar] [CrossRef]
  67. Sutter, C.; Bruton, G.D.; Chen, J. Entrepreneurship as a solution to extreme poverty: A review and future research directions. J. Bus. Ventur. 2019, 34, 197–214. [Google Scholar] [CrossRef]
  68. Epprecht, M.; Müller, D.; Minot, N. How remote are Vietnam’s ethnic minorities? An analysis of spatial patterns of poverty and inequality. Ann. Reg. Sci. 2011, 46, 349–368. [Google Scholar] [CrossRef] [Green Version]
  69. Gustafsson, B.; Sai, D. Temporary and persistent poverty among ethnic minorities and the majority in rural China. Rev. Income Wealth 2009, 55, 588–606. [Google Scholar] [CrossRef]
  70. Montalvo, J.G.; Reynal-Querol, M. Ethnic diversity and growth: Revisiting the evidence. Rev. Econ. Stat. 2017, 1–43. [Google Scholar] [CrossRef] [Green Version]
  71. Gradín, C.; Del Río, C.; Cantó, O. Gender wage discrimination and poverty in the EU. Fem. Econ. 2010, 16, 73–109. [Google Scholar] [CrossRef]
  72. Sawhill, I. Discrimination and poverty among women who head families. Signs: J. Women Cult. Soc. 1976, 1, 201–211. [Google Scholar] [CrossRef]
  73. Churchill, S.A.; Smyth, R. Ethnic diversity and poverty. World Dev. 2017, 95, 285–302. [Google Scholar] [CrossRef]
  74. Kholowa, F.; Rose, P. Parental or policy maker misunderstandings? Contextual dilemmas of pre-schooling for poverty reduction in Malawi. Int. J. Educ. Dev. 2007, 27, 458–472. [Google Scholar] [CrossRef]
  75. Danson, M.; Galloway, L.; Sherif, M. From unemployment to self-employment: Can enterprise policy intensify the risks of poverty? Crit. Perspect. Account. 2020, 102–164. [Google Scholar] [CrossRef]
  76. Jaax, A. Private sector development and provincial patterns of poverty: Evidence from Vietnam. World Dev. 2020, 127, 104747. [Google Scholar] [CrossRef]
  77. Kar, S.; Marjit, S. Urban informal sector and poverty. Int. Rev. Econ. Financ. 2009, 18, 631–642. [Google Scholar] [CrossRef]
  78. Moran, P.A. Notes on continuous stochastic phenomena. Biometrika 1950, 37, 17–23. [Google Scholar] [CrossRef]
  79. Fischer, M.M.; Griffith, D.A. Modeling spatial autocorrelation in spatial interaction data: An application to patent citation data in the European Union. J. Reg. Sci. 2018, 48, 969–989. [Google Scholar] [CrossRef] [Green Version]
  80. Anselin, L. Lagrange multiplier test diagnostics for spatial dependence and spatial heterogeneity. Geogr. Anal. 1988, 20, 1–17. [Google Scholar] [CrossRef]
  81. LeSage, J.P.; Pace, R.K. Introduction to Spatial Econometrics; CRC Press: Boca Raton, FL, USA, 2009. [Google Scholar]
  82. Pérez, G. Dimensión especial de la pobreza en Colombia. In Documentos de Trabajo Sobre Economía Regional; Centro de estudios económicos regionales—CEER: Cartagena, Colombia, 2005. [Google Scholar]
  83. Barragán, F. La Expresión Territorial de la Pobreza en Ecuador: Una Lectura Multiescalar; Pontifica Universidad Católica del Ecuador: Quito, Ecuador, 2012. [Google Scholar]
  84. Alvarado, R.; Jiménez, C.; Sánchez, B.; Ponce, P. El rol del capital humano en el emprendimiento regional en Ecuador: Un enfoque usando métodos espaciales. Paradig. Econ. 2019, 11, 75–100. [Google Scholar] [CrossRef]
  85. Beccaria, L.; Groisman, F. Informalidad y pobreza en Argentina. Investig. Econ. 2008, 67, 135–169. [Google Scholar]
  86. Guimaraes, A. Las Causas de la Pobreza Negra en Brasil: Algunas Reflexiones; Banco Interamericano de Desarrollo: Washington, DC, USA; Banco Mundial: Washington, DC, USA, 2000. [Google Scholar]
  87. Tapia, N. Análisis Espacial de la Pobreza Multidimensional en el Ecuador; Universidad de Cuenca: Cuenca, Ecuador, 2016. [Google Scholar]
Figure 1. Poverty and tourism-related GVA at the regional level in Ecuador in 2018. Source: the authors, based on data from ENEMDU [15] and CBE [17].
Sustainability 12 06138 g001
Figure 2. I-Moran Test.
Sustainability 12 06138 g002
Table 1. Variables of the model.
VariablesDescriptionMeanStandard Deviation
Dependent
PovertyPercentage of poor people of the total population32.3419.79
Independent
Log Gross Value Added (GVA) of tourismLogarithm of gross value added of tourism per capita (constant 2010 prices)3.321.39
SchoolingAverage number of years of schooling of the canton8.751.10
UnemploymentPercentage of unemployed persons of the total population 2.412.79
Informal-sector employmentPercentage of people who are not affiliated to the Social Security System of the total population60.7915.84
Afro-American populationPercentage of Afro-American people out of total population1.646.18
Mestizo populationPercentage of mestizo people of the total population77.6324.74
Source: the authors.
Table 2. Correlation matrix.
Variable PovertyLog Gross Value Added (GVA) of TourismSchoolingUnemploymentInformal-Sector EmploymentAfro-American populationMestizo Population
Poverty1
Log Gross Value Added (GVA) of tourism−0.3030 *1
Schooling−0.4221 *0.4140 *1
Unemployment−0.06830.3570 *0.18651
Informal-sector employment0.1831−0.0250−0.0454−0.01211
Afro-American population−0.00290.00390.01030.11900.06711
Mestizo population−0.3652 *0.3032 *0.2400 *0.1766−0.2118−0.18211
Note: * Describe the significance level of 5%. Source: the authors.
Table 3. The results of the basic regressions.
VariableOLSSARSEMSARMASDM a
Log (tourism GVA)−4.311 ***−4.330 ***−4.454 ***−4.460 ***−0.748 ***
(−4.45)(−4.50)(−4.59)(−4.58)(−4.29)
Constant46.69 ***45.09 ***47.12 ***47.40 ***31.93 ***
(13.37)(11.06)(13.25)(9.78)(14.40)
Lambda
Constant
-0.0102-−0.001720.0830 ***
(0.75) (−0.09)(5.74)
Sigma2
Constant
-352.7 ***350.8 ***350.6 ***184.5 ***
(9.95)(9.94)(9.92)(9.83)
Rho
Constant
--0.02240.0242-
(1.12)(0.84)
Observations198198198198198
Note: t statistics in parentheses (*** p < 0.001). a The independent variable is spatially lagged to generate the SDM model.
Table 4. Results of the OLS and spatial models with control variables.
VariableOLSSARSEMSARMASDM
Log (Tourism-related GVA)−1.730−1.731−1.838−1.858−2.413 *
(−1.68)(−1.71)(−1.82)(−1.84)(−2.00)
Level of schooling−5.757 ***−5.825 ***−6.194 ***−6.207 ***2.423 *
(−4.72)(−4.87)(−5.19)(-5.23)(2.19)
Unemployment0.6280.6320.6860.6950.397
(1.33)(1.37)(1.51)(1.53)(0.67)
Informal-sector employment0.1460.1400.1150.1130.275 **
(1.86)(1.81)(1.46)(1.43)(3.09)
Afro-American population−0.204−0.211−0.182−0.174−0.227
(−1.01)(−1.06)(−0.92)(−0.87)(−1.21)
Mestizo population−0.203 ***−0.203 ***−0.202 ***−0.201 ***−0.153 *
(−3.73)(−3.82)(−3.81)(−3.79)(−2.49)
Constant94.20 ***93.26 ***100.0 ***101.1 ***−5.193
(8.22)(8.28)(8.68)(8.60)(−0.66)
Lambda Constant-0.0121-−0.006390.0759 ***
(0.98) (−0.37)(6.49)
Sigma2 Constant-278.7 ***273.1 ***272.1 ***1926.0 ***
(9.95)(9.91)(9.86)(9.89)
Rho Constant- 0.03870.0450-
(1.95)(1.75)
Observations198198198198198
Note: t statistics in parentheses, * p < 0.05, ** p < 0.01, *** p < 0.001. Independent variables were spatially lagged to generate the Dublin model.

