Article

The Impact of Drainage on the Performance of Low Volume Sealed Roads

Civil Engineering and Assets, Transport Research Laboratory, Berkshire RG40 3GA, UK
*
Author to whom correspondence should be addressed.
Sustainability 2020, 12(15), 6101; https://doi.org/10.3390/su12156101
Submission received: 14 July 2020 / Revised: 25 July 2020 / Accepted: 27 July 2020 / Published: 29 July 2020
(This article belongs to the Section Sustainable Urban and Rural Development)

Abstract

:
Under the Research for Community Access Partnership (ReCAP) funded by the United Kingdom Aid (UKaid) program, a project entitled ‘Development of Specifications for Low Volume Sealed Roads through Back Analysis’ was carried out. Previous studies on the performance of low volume sealed roads have emphasized the importance of good drainage to ensure good performance. The emphasis has been on providing sealed shoulders, adequate crown height, and adequate camber. These studies have not related these cross-sectional features with materials characteristics. This paper investigates the influence of each of these features on the performance of low volume sealed roads and their relation to pavement materials. The features were considered each one at time, using a matrix of three levels of the value of each feature and three levels of performance categories. Thus, presenting a 3 × 3 performance matrix for each factor. Assessment of the matrices showed that provision of sealed shoulders permits the use of materials of higher plasticity (PI ≤ 16 and PM ≤ 560) without compromising performance compared to that permissible for sections with unsealed shoulders (PI ≤ 10 and PM ≤ 240). These results can be used to supplement existing selection criteria for road base material of low volume roads.

1. Introduction

1.1. General

In 1975, the first international conference on low volume roads [1] proposed several criteria for defining low volume roads. One of them was that the definition should be based on a traffic-volume criterion: ‘A low-volume road or street is one that carries fewer than X vehicles per day. Each agency must pick its own number’. In 1987, a study [2] by the Transportation Research Board delineated the safe cut-off point between roads defined as low-volume roads and roads defined as high-volume roads as 2000 vehicles per day. The American Association of State Highway and Transportation Officials (AASHTO) refers to roads carrying less than 400 vehicles per day as ‘very low-volume roads’ [3]. Conversely the National Cooperative Highway Research Programme (NCHRP) [4] defines low volume roads as those designed to carry up to 750,000 heavy vehicles per design lane over the design life of the road. This is equivalent to 2.0–3.0 million standard axles.
In the Research for Community Access Partnership program, low volume roads are defined as roads that carry up to 300 motorized vehicles per day, or roads designed to carry up to a cumulative total of about one million equivalent standard axles through their design life [5]. The part of the definition that is expressed in number of vehicles per day facilitates the application of suitable geometric design standards, whereas the part of the definition expressed in cumulative equivalent standard axles enables the selection of appropriate materials for low volume roads. All vehicle axle loads are converted to the equivalent standard axle load (8.2 tonnes). Additionally, low volume sealed roads (LVSRs) are those with thin bituminous seals constructed over natural gravel pavement layers or lightly modified gravel pavement layers. The costs of providing such roads based on traditional standards and design methods are generally too high for application on large rural networks. In response to this, the UK Department for International Development (DFID), and other development agencies within the Research for Community Access Partnership (ReCAP), have supported research and knowledge transfer on various aspects of rural infrastructure for several years, specifically targeted at reducing the costs of low volume road networks for rural and peri-urban communities. The research has concentrated on rural roads, although some elements are also applicable to urban conditions.
Although low volume roads are now generally defined as those designed to carry up to 1 million equivalent standard axles [5], recent research [6] has shown that the same materials used for their construction are able to support up to three million equivalent standard axles (MESA) under conditions of good drainage and maintenance. This is an important finding, since it promotes sustainable use of geomaterials. For existing roads built with these materials, road agencies do not need to exploit new material to extend the design from 1 MESA to 3 MESA. This is especially important in Sub-Saharan Africa since it not only reduces cost, but it also means few material borrow-pits are opened. The borrow-pits are seldom well-reinstated and often end up filling with stagnant water, and thus facilitate breeding of disease vectors such as mosquitos. As part of the ReCAP initiative, one of the major projects was: The Development of Guidelines and Specifications for LVSRs through Back Analysis. For simplicity, the project is often referred to as ‘the Back Analysis Project’. The principal objective of the project was analysis of the performance of existing LVSRs and the revision of guidelines and specifications currently in use for their provision. The project collected road performance data from previous research studies and compiled these into an open-access database (www.lvroadsdata.com). A review of the database identified a number of areas where data were lacking. These comprised ‘information gaps’ that restricted or prevented some types of analyses from being carried out and therefore some engineering questions from being answered. The last phase of the project was to fill some of these ‘information gaps’ by carrying out fieldwork to collect additional data to add to the database. To do so additional research was also undertaken in four countries. The combined dataset of road performance was then used to undertake a revision of specifications for low volume sealed roads.

1.2. Background

The Back Analysis Project comprised three phases.
Phase 1 involved the development of a database of historic performance data on LVSRs over the past four decades in Sub-Saharan Africa and South East Asia. An important component of the project was to obtain performance data from a large sample of roads, especially roads that have been constructed using local and more readily available materials that do not meet the higher specifications that are applied to the construction of more heavily trafficked roads, but are considerably less expensive. The data (various data types) from 23 research studies of LVSRs from 16 countries were included in the database.
Phase 2 consisted of further development of the database architecture and structure, extensive review of other existing reports and data, capacity-building activities conducted through training of counterparts from the road research centers of the 12 Africa Community Access Partnership partner countries, and further population of the database with studies identified in Phase 1. A comprehensive assessment of the data and a strict filtering process to eliminate incomplete and unreliable data was followed by a ‘gap analysis’ to identify incomplete areas of data and therefore knowledge gaps that were candidates for further research, some of which could be carried out in Phase 3 of the project.
Phase 3 consisted of additional fieldwork and laboratory studies, analysis to refine specifications for pavement materials for LVSRs, and capacity building in partner countries. Many of the historic studies were primarily designed to investigate the structural design of the pavements, and so they concentrated on the thickness and strength of the pavement layers. Although drainage was always known and acknowledged to be important, few studies involved quantifying the contribution of the different drainage provisions to eventual performance. Therefore, Phase 3 also involved, amongst other things, the analysis of the effect of the drainage aspects and the failure mechanisms of the sections studied during the fieldwork.

1.3. Drainage-Related Defects

Many low volume roads are constructed using natural gravels that are generally susceptible to moisture ingress. Moisture ingress leads to reduction in strength, which in turn leads to development of ruts, cracks, and eventually potholes. Gourley and Greening [7] showed how the effects of poor drainage, characterized by high moisture content in the wheel paths of roads made with natural gravels, contribute to rutting and cracking. Rolt et al. [8] found that the failure of many low volume roads was initiated by surfacing defects and drainage factors. Paige-Green [9] observed that many failures on low volume roads occur where drainage has been poor over the life of the road. In studying the performance of low volume sealed roads, therefore, the measurement and comparison of these defects is important, although it should be borne in mind that these defects may also be induced by other factors, such as poor compaction. It has often been stated that up to a design value approaching about 1 million cumulative equivalent standard axles (MESA), the performance of LVSRs is largely governed by environmental (climatic) factors rather than by traffic, as illustrated in Figure 1. This means that if good performance of LVSRs is to be guaranteed, then detailed attention should be paid to drainage in order to control the climatic effects on the road materials, specifically the potential effect of water.

1.4. Aim and Purpose

One of the most important ways that the life of a LVSR can be improved and even maximized is to make sure that the drainage of the road is adequate. Good drainage is not merely the provision of suitable side drains; it also requires a variety of other features that come together to minimize the adverse effects of water on the performance of the road. The main external cross-sectional features that affect drainage are crown height, sealed shoulders, and road camber [8]. Incorporating all of these cross-sectional features into the design can significantly affect the cost of the road. However, the relative importance of each factor and the optimum values for design are not widely known.
The work described in this paper aims at assessing the effect of these cross-sectional features on the performance of LVSRs and their relationship to key materials characteristics in order to promote long pavement life.
This paper also discusses, through case studies, the mechanisms of failures initiated by poor drainage. Understanding the mechanisms will assist practitioners in adopting appropriate designs that prevent or minimize such failures in future. The main purpose of the study is to contribute to existing knowledge on the improvement of low volume sealed roads. The study is significant in that the results have the potential to reduce the cost of road provision by recommending lower thresholds and specifications that are known to work successfully in practice.

2. Materials and Methods

Phase 3 involved the identification of LVSRs in 4 countries (Ghana, Uganda, Mozambique, and Zambia) in Sub-Saharan Africa, followed by field and laboratory investigations. The choice of the four countries was based on the need to broaden and enhance the range of data available for analysis. The countries were selected for the following main reasons: Ghana was chosen for roads in high rainfall areas (up to 2200 mm/yr), Mozambique was chosen for roads that had been subjected to extreme flood events from tropical cyclones, Uganda was chosen for conditions of moderate to high rainfall, and Zambia was chosen for roads located on weak subgrades in swamps. Field studies were carried out collaboratively between TRL and the major road authority for each country. The drainage-related design cross-sectional features that were considered are crown height (which also represents to an extent the depth of side drains), camber (cross-fall), and shoulder design (sealed/unsealed/grassed). The data have been combined and analyzed, and the results used to provide recommendations for the review of specifications for LVSRs. The cross-sectional features were considered each one at time using a matrix of three levels of the value of the feature and three levels of performance categories, thus presenting a 3 × 3 matrix for each factor. In each of the matrix cells, the number of sections that fitted the value range of the factor and the performance level were filled. This made it easy to categorize the levels at which poor, fair, or good performance were observed.
For Phase 3 of the project, the study roads were selected in such a manner that they filled gaps that had not been covered in previous studies. Therefore, the roads were selected on the basis that they fulfilled all the following attributes:
  • Possessed a thin bituminous surfacing/seal (not Asphalt Concrete),
  • have been in existence for more than 10 years,
  • preferably with bases that were constructed using locally available materials/natural gravels or lightly modified materials; but a few with coarse rock bases were also studied, and
  • have a current traffic volume of more than 500 vehicles per day (vpd), based on initial traffic of 300 vpd and a growth rate of 5% for 10 years.
It was necessary to determine all the characteristics of the study roads, hence the activities involved identification of suitable study roads through reconnaissance visits, field investigations including visual condition surveys, traffic counts, axle load surveys, rut depth measurements, roughness measurements, deflection tests, Dynamic Cone Penetrometer (DCP) tests, test pits, and field density and moisture tests.
On each study road, at least two sections (each 300 m long and with a carriageway width of not less than 6 m) were selected for comparison; one that had a good visual appearance and one with a poor visual appearance. The visual condition of the sections were later assessed and quantified in terms of a Visual Condition Index (VCI). The VCI uses the model presented in Department of Transport of South Africa guidelines [11] as shown in Box 1. This has been simplified for use in ReCAP projects by assigning a weight of 1 to all the defects measured. The defects considered in the computation of the VCI for this analysis are potholes, patches, cracking, raveling, and rutting.
Materials from the different pavement layers in each section were extracted and subjected to laboratory testing. The tests included Atterberg Limits, moisture content, particle size distribution, compaction tests, and strength tests.
Box 1. Computation of Visual Condition Index (VCI).
V C I = 100 ( 1 C i = 1 n F i )
Where:
    F i = D i × E i × W i
   i = Visual assessment item number as specified on the condition assessment sheet
   n = number of defect parameters measured
   Di = Degree (severity) rating of defect i
   Ei = Extent rating for defect i
   Wi = Weight for defect i
    C = 1 ÷ i = 1 n F i ( m a x )
   Fi(max) = Fi with Di and Ei set at their maximum value (5).
VCImax = 100
VCImin = 0
The condition of each of the study road sections was classified as Good, Fair, or Poor using the visual condition scale presented in Table 1. The 3-level scale, as opposed to the 5-level scale, was used for simplicity. This was done by combining ‘Poor’ and ‘Very Poor’, and ‘Good’ and ‘Very Good’ on the 5-level scale. The visual condition and construction cross-section data from the field studies were combined with data from previous studies and then analyzed. Sections that received a reseal within 7 years of monitoring were excluded from the analysis, since these would confound the VCI. The 7 years were chosen based on the half-life of thin double bituminous seals reported by Wolff and Visser [12].
External drainage of roads is significantly affected by the quantity or intensity of rainfall received. However, most weather stations do not record rainfall intensity. Thus, only daily rainfall records were obtained from the nearest weather stations to each of the roads studied. The daily rainfall spanning periods of 5 to 10 years were used to compute the mean annual rainfall. The range of key characteristics of the road sections are shown in Table 2.
When the sections contained in the database were combined with those in the Phase 3 field study, a total of 112 sections that had data on the crown height, camber (cross-fall), and shoulder design type were identified. Sections that had received a reseal within 7 years of its final monitoring date were eliminated from the final analysis, as were sections located in areas of rainfall less than 750 mm/year. The final number of sections used was therefore 59 sections for crown height and shoulder design analysis, and 45 sections for camber (cross-fall) analysis. The longitudinal gradient of all the sections studied was less than 3%, this minimized the confounding effect that would have been created as a result of extreme gradients.

3. Results

3.1. General

The quantification of drainage condition largely relies on the subjective interpretation of the surveyor. Nevertheless, proxy parameters: Shoulder type (sealed, grassed, or unsealed), camber (crossfall), and crown height can be determined and measured. However, other nuances such as localized ponding spots, or the presence of cracks, can adversely affect the drainage characteristics of road sections. Therefore, in order to understand the mechanism by which drainage influences performance, it is necessary to study each site in detail. The following results and discussions focus on the three listed parameters above. This is followed by a detailed discussion of two case studies to show how drainage actively affects road performance. There may also be other contributory factors that affect the performance, and therefore conclusions in the following discussions are drawn by using the parameter thresholds at which poor performance was observed, rather than by using the thresholds from the roads that showed good performance.

3.2. Shoulder Type

3.2.1. Performance Classification by Shoulder Type

A study by Gourley and Greening [7] showed that sealed shoulders play an important role in the performance of low volume sealed roads by moving the zone of moisture fluctuation and influence farther away from the outer wheel track. This finding is supported by data from the present study, as sections with sealed shoulders (Table 3) had the highest proportion of good performance, though four sections were classified as ‘Poor’. Provision of sealed shoulders therefore plays a significant role in promoting good performance. It is anticipated that the use of sealed shoulders can usually be justified in whole life cycle cost terms. Ogden [13] showed that in Australia, the use of sealed shoulders was also associated with an accident reduction of up to 41 percent, and that the whole life cost break-even point for sealing shoulders was as low as 360 vehicles per day.

3.2.2. The Effect of Base Layer Characteristics on Good-Performers in Relation to Shoulder Type

Further analysis of the good performers (VCI > 70) shows (Table 4) that the base layer material had to meet plasticity and strength limits to ensure good performance. The base layer properties have been chosen due to the fact that in a pavement surfaced with a thin bituminous seal (<20 mm thick), the base Layer provides the largest proportion of the overall pavement strength and carries higher traffic stresses compared to the sub-base layer. The comparisons are based on the 25th and 75th percentiles to represent the interquartile range and eliminate outliers. It can be concluded that provision of sealed shoulders permits the use of materials of higher plasticity (PI ≤ 16 and PM ≤ 560) without compromising performance, compared to the plasticity permissible for sections with unsealed shoulders (PI ≤ 10 and PM ≤ 240). It is also worth noting that there is no significant difference in the minimum permissible strength (CBR 40–46%) of the base layer for the unsealed and sealed shoulders. The plasticity characteristics of the base layer material therefore plays a role in the performance of the pavement. Depending on the level of acceptable risk, it is advisable to choose any value between the 25th and 75th percentile limits. The six sections that had unsealed shoulders and exhibited poor performance (VCI < 50) had plasticity modulus between 30 and 648 compared to four sections that had sealed shoulders and exhibited poor performance that had plasticity modulus between 310 and 1288. If shoulders are sealed, materials of significantly higher plasticity (up to two times) compared to the case when shoulders are unsealed can be used before poor performance is observed.
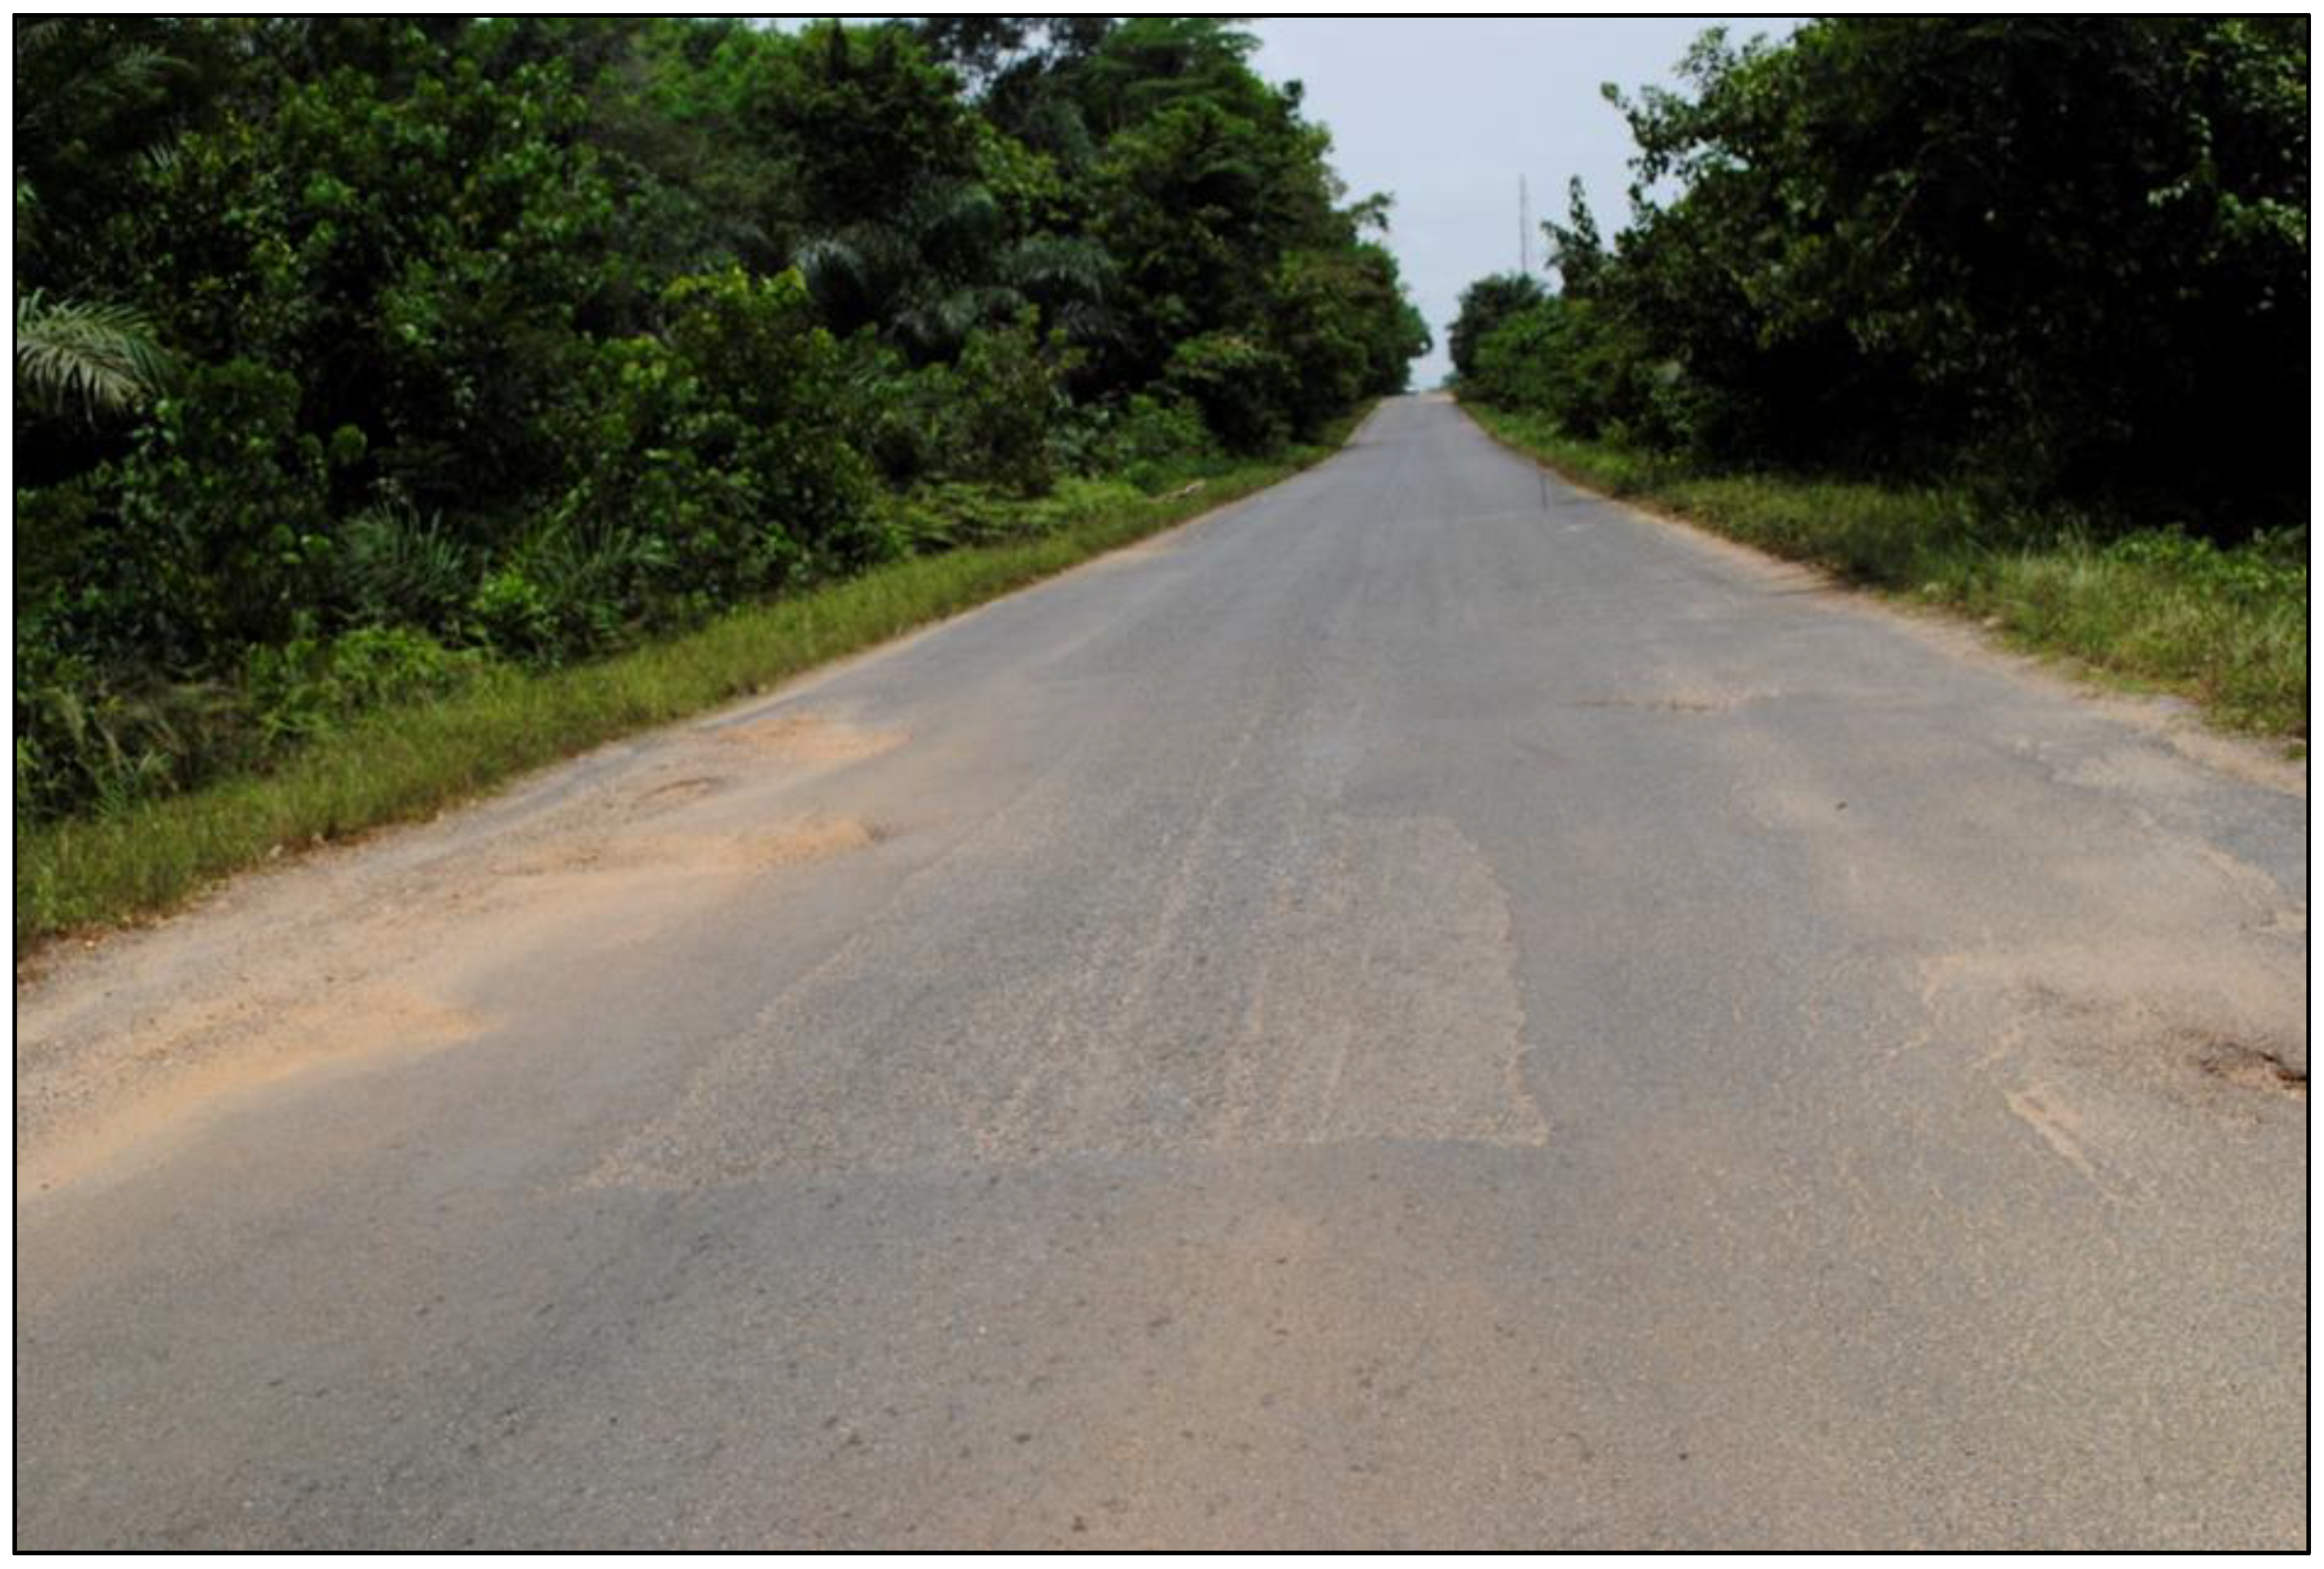
In situations where a soil/grass berm forms at the edge of the running surface (Figure 2), water cannot flow to the side drain and, depending on the permeability of the base material, tends to enter the pavement. This will occur whether there is a shoulder or not. Depending on permeability, the water can permeate to all the lower pavement layers. Since the wheel-track is close to this area, rutting, cracking, and potholing can be expected.
Of the eight sections with grassed shoulders investigated in this study, none showed poor performance. Plausible explanations for this are that the grass prevents erosion and deformation of the shoulder that would, in turn, allow water ponding and ingress into the pavement layers; the grass also absorbs some water and/or disperses it and promotes evapotranspiration. The grassed shoulders were nevertheless steeper than the usual camber of 3%.
The data shown in Table 4 indicates that base layer material plasticity characteristics have a significant influence on the performance of low volume sealed roads. A study [14] also showed that if free-draining materials are used in the pavement layers or if the subgrade is free-draining (sandy or gravel), then crown height does not appear to be a significant influence. The study however did not give any limiting values.

3.3. Crown Height

3.3.1. Performance Classification by Crown Height

The crown height (CH) is the elevation difference between the side drain invert and the carriageway crown. It indicates the potential for moisture to rise within the pavement layers to the higher pavement layers and to where weakening would have the most adverse effect; the higher the crown height, the lower the potential for moisture ingress. Additionally, a silty or highly plastic material used in the pavement layers can increase moisture suction into the pavement. In a study of the performance of low volume sealed roads in Southern Africa, Gourley and Greening [7] recommended a minimum crown height of 0.75 m to ensure good performance. The visual condition indices from the current study (Table 5) show that many of the sections performed well regardless of crown height. There must therefore be other factors at play. However, it should be noted that a higher proportion of sections with crown heights less than 0.5 m have performed poorly (VCI < 50) than sections with crown heights between 0.50 m and 0.75 m or sections with crown heights greater than 0.75 m. This suggests that a crown height of 0.50 to 0.75 m could be a sufficient standard for low volume sealed roads. This will usually lead to some cost and time savings in earthworks depending on the embankment height required to adequately cover the culverts and other water crossing structures. The presence or absence of sealed shoulders appears to override the effect of crown height to a significant degree—for example, of the 38 sections with crown height less than 0.5 m that performed well (VCI > 70), 27 of them had either sealed or grassed shoulders, whereas of the 10 sections that performed poorly (VCI < 50), 6 of them had unsealed shoulders. Eight of the 14 good performers (VCI > 70) with crown height less than 0.5 m had sealed shoulders. All the five sections that had crown height less than 0.5 m and performed poorly (VCI < 50) had unsealed shoulders.

3.3.2. The Effect of Base Layer Characteristics on Good-Performers in Relation to Crown Height

The sections that performed well (VCI ≥ 70) had the base layer plasticity and strength characteristics shown in Table 6. The base layer properties have been chosen due to the fact that in a pavement surfaced with a thin bituminous seal (<20 mm thick), the base layer provides the largest proportion of the overall pavement strength and carries higher traffic stresses compared to the sub-base layer. Despite the fact that the sections used in the comparison in Table 6 performed well, the 25th percentile is used for the comparison limit to offer a margin of safety. It can be concluded that a high crown height (>0.75 m) permits for the use of materials of higher plasticity (PI ≤ 10 and PM ≤ 188) without compromising performance, compared to that permissible (PI ≤ 2 and PM ≤ 79) for low crown height (<0.5 m). It is also worth noting that there is no significant difference in the minimum permissible strength (CBR 40–46%) of the base layer for the low crown height (<0.5 m) and that for the high crown height (>0.75 m) to ensure good performance. The plasticity characteristics of the base layer material therefore plays a role in the performance of the pavement. The availability of more data can be used to refine these limits. Thus, the selection of base layer materials vis-à-vis crown height could lead to cost and time savings in earthworks. If a lower crown height than the current standard minimum of 0.75 m can be used, then it means less material needs to be exploited for the formation of embankments. This promotes sustainable use of geomaterials.

3.4. Road Camber

Road camber is important for shedding water from the carriageway to the side drains. Low values of camber (Table 7) provide for only a slow drainage rate and may permit water ponding in ruts (if rutting occurs) or in small areas of unevenness. Indeed, TRL [15] recommends a minimum camber value of 3% for paved roads. High values of camber promote drainage from the carriageway to the side drains, but if the camber is too high, driving can become uncomfortable and can prove to be a safety hazard. The flow from the shoulders to the side-drains depends on shoulder and formation slopes, unevenness, and vegetation. Table 7 shows that although most sections had a camber of greater than 1%, many sections with camber between 1 and 2% also performed well. However, since rutting and small deformations can occur relatively easily in low volume roads constructed with natural gravels, the recommended minimum camber should be at least 2%. At 2% camber, if severe rutting were to occur, this would pose a risk of water ponding in the ruts. It is therefore safer to keep a minimum camber of 3% if natural gravels are used. This is in line with recommendations for climate resilience by another study [16] in Sub-Saharan Africa. Moreover, no major materials cost savings can occur as a result of using 2% camber instead of 3%.

3.5. Case Studies

3.5.1. Case Study 1: Koforidua–Adukrom

To establish whether or not drainage played a significant role in the initiation of the many of the defects observed, two case studies are presented. The first case study shows the influence that crown height and shoulders play. It therefore looks at a section with VCI < 50 and crown height less than 0.50 m; in other words, a low crown height and poor performance.
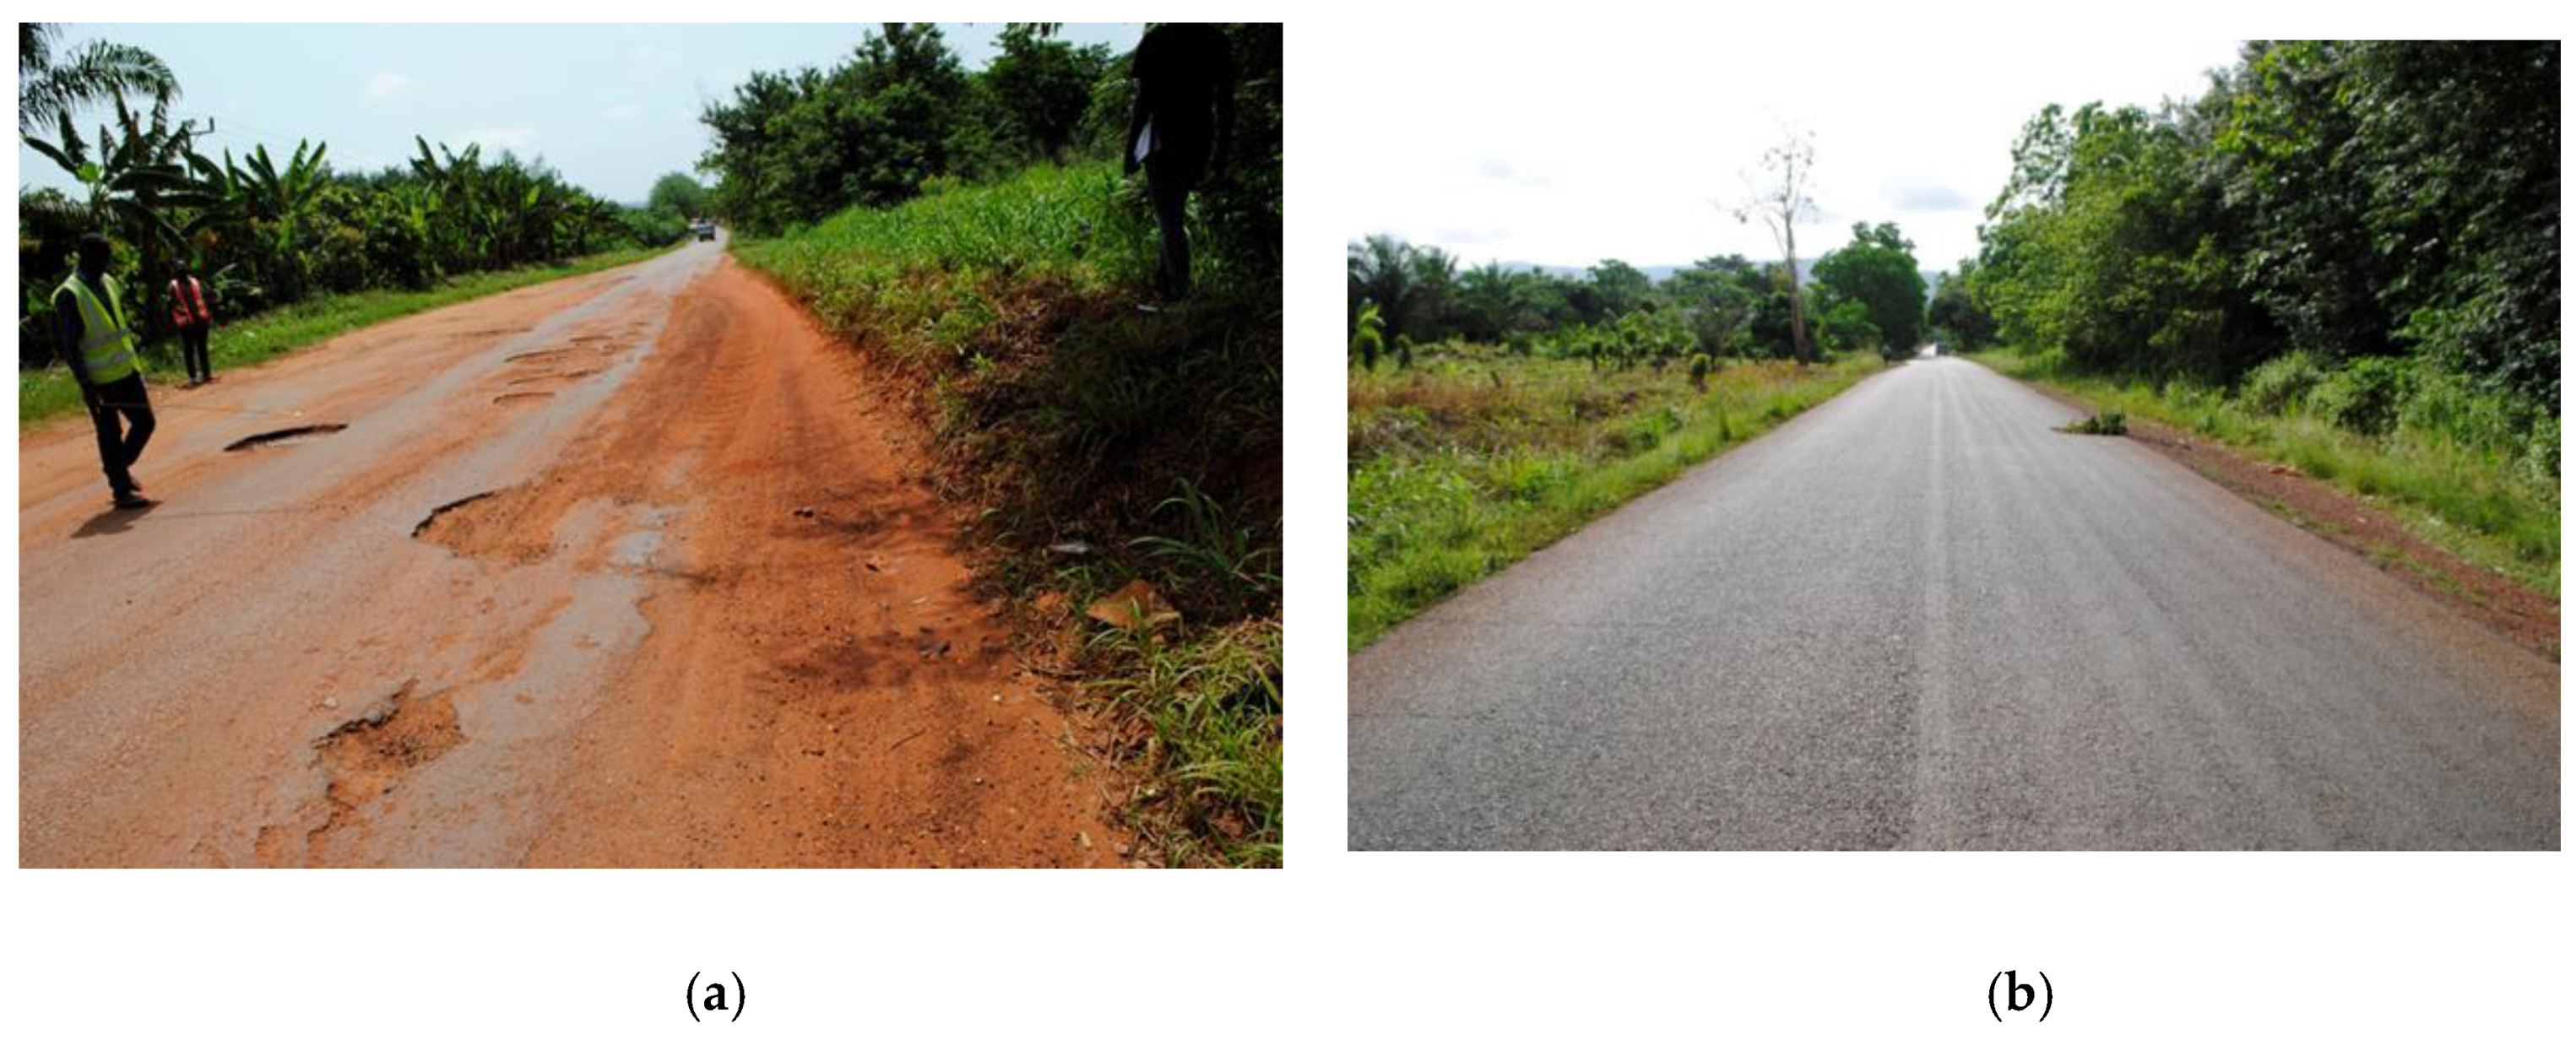
This road is located in an area where the mean annual rainfall is about 1400 mm/yr. The road has been in existence for more than 20 years (resealed after 12 years) and currently carries about 250 heavy vehicles per day, approximating to 550 equivalent standard axles per day. The road structure comprises a double bituminous surface dressing (double chip seal) on a lateritic gravel base and sub-base for both Section 1 and Section 2 of Figure 3. Table 8 shows the in situ moisture, in situ DCP strength, mean rut depth, 90th percentile rut depth, and the VCI values of the two road sections studied on the road. The measurements were carried out before the onset of the rainy season. Figure 3 shows a photograph of the two sections.
The ratio of the field moisture content (FMC) to the optimum moisture content (OMC) of the material of the pavement layers for the base and sub-base layers for Section 1 of Figure 3a are significantly higher than that of Section 2 of Figure 3b. This high moisture content weakens the pavement materials, making them more susceptible to failure. The in situ DCP CBR strengths show a similar trend, further illustrating the effect that the moisture has on the strength of the sections. In contrast, the subgrade FMC/OMC ratio for Section 1 of Figure 3a is considerably lower than for Section 2 of Figure 3b. In fact, the ratio decreases progressively from the base to the subgrade, indicating that the source of moisture is from the surface, as opposed to ground water migration through capillary action. This is supported by the fact that the crack index (CRI) of Section 1 of Figure 3a is more than twice that of Section 2 of Figure 3b. Potholes in Section 1 of Figure 3a have been patched several times, but they keep re-occurring because the cause of the problem (poor drainage) has not been addressed. The high severity of cracking allows ingress of moisture into the pavement. As a result of the moisture weakening the pavement layers of Section 1 of Figure 3a, the rut depth (as shown by the mean rut depth and 90th percentile rut depth) of Section 1 of Figure 3a is considerably higher than that of Section 2 of Figure 3b.
If the source of water is surface water, then cracking of the surfacing alone is not the only precondition for poor internal pavement drainage. Sufficient rainfall and time are required for ingress into the pavement. The road receives about 1400 mm/yr of rainfall—sufficient for ingress. A question is then raised: “Why has water ingressed more on Section 1 of Figure 3a?” This is answered by the low camber (1.3%) and the low crown height (0.1 m), which mean that in heavy storms, the rate at which water is shed to the side drains is not as fast as on Section 2 of Figure 3b (camber of 2.3%). This provides more time for water to penetrate through the cracks. Secondly, the low crown height coupled with the absence of shoulders of any kind means that ponding and ‘overflow’ onto the carriageway occurs far more easily during heavy storms. Moreover, Section 1 of Figure 3a is located in a sag. The culvert provided at the bottom is easily silted, and the silting then accumulates in the side drain as described in Table 9. Section 2 of Figure 3b, on the other hand, has a higher crown height (0.7 m), and shoulders have been provided. These serve to keep water off the carriageway and support the observations and arguments presented in Section 3.2, Section 3.3 and Section 3.4.

3.5.2. Case Study 2: Macia–Chokwe

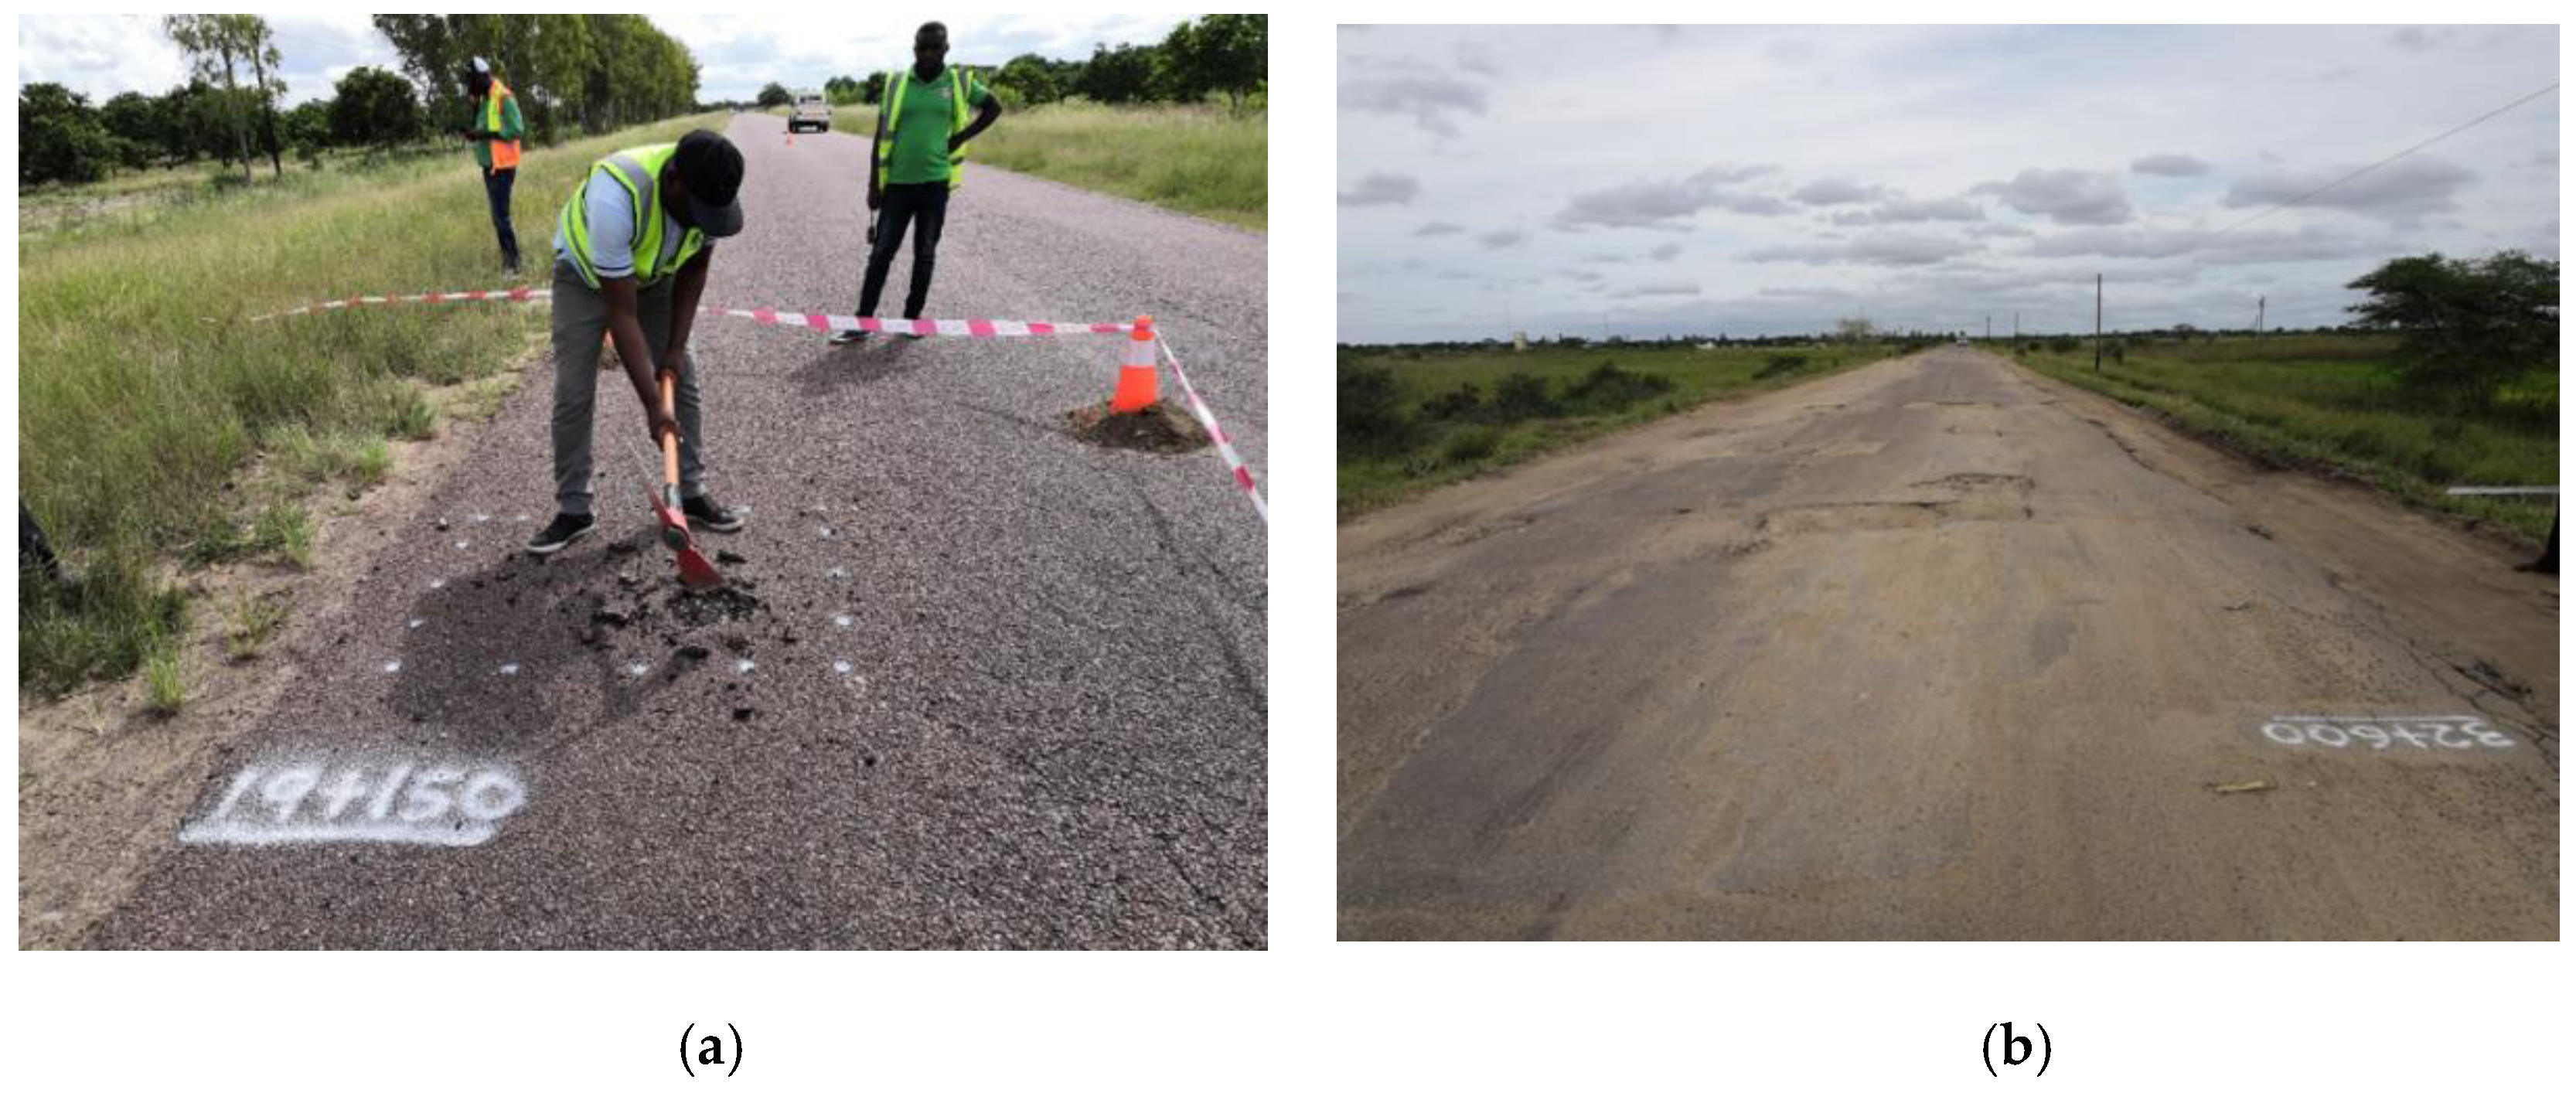
This road is located in an area with mean annual rainfall of about 600 mm/yr. However, the area often experiences tropical cyclones, which increases the rainfall to about 1300 mm/yr when they occur. The road has been in existence for more than 20 years and currently carries about 60 heavy vehicles per day, approximating to 170 equivalent standard axles per day. The road structure comprises a double bituminous surface dressing (double chip seal) on a macadam base and neat sand sub-base on one section, and double bituminous surface dressing on a cement-treated sand base and neat sand sub-base on the second section. Table 10 shows the in situ moisture, in situ DCP strength, mean rut depth, 90th percentile rut depth, and the VCI values of the two sections. The measurements were carried out before the onset of the rainy season. Figure 4 shows a photograph of the sections.
The moisture content of the base layer of Section 1 of Figure 4a was not measured because it was a coarse macadam base, and that for Section 2 of Figure 4b could not be measured either because during excavation, the layer came out in blocks. DCP tests could not be conducted on the base layers because the layers were extremely hard to penetrate and could have damaged the equipment. DCP tests were conducted on the sub-base and subgrade layers after the base layer had been removed.
The ratio of the field moisture content (FMC) to the optimum moisture content (OMC) of the sub-base layer for Section 1 of Figure 4a is marginally higher than that of Section 2 of Figure 4b. However, the ratio for the subgrade of Section 2 of Figure 4b is significantly higher than that of Section 1 of Figure 4a. The in-situ DCP CBR strengths show a corresponding pattern to the moisture pattern; that is the higher the moisture content, the lower the in-situ strength. The FMC/OMC ratio for the sections increases progressively from the sub-base to the subgrade, indicating that the source of moisture is from water migration upwards from the deeper subgrade, through capillary action. This is supported by the fact that the road passes through a generally swampy area; with Section 2 of Figure 4b being in a wetter location than Section 1 of Figure 4a. Despite this, the rut depth (as shown by the mean and 90th percentile values) of Section 2 of Figure 4b is lower than that of Section 1 of Figure 4a —probably because of the cement-stabilized base. Section 2 of Figure 4b, however, has several potholes (Figure 4) and hence a lower VCI of 57 (Fair condition) compared to 75 (Good condition) for Section 1 of Figure 4a. The cemented section (Section 1 of Figure 4a) would be more prone to pumping and loss of material through the stabilization cracking and spalling of the cracks, hence the formation of potholes.
The question arises as to what has caused the severe potholing and patching in Section 2 of Figure 4b? First, despite the fact that the crack index of Section 1 of Figure 4a is about twice that of Section 2 of Figure 4b, Section 1 of Figure 4a (Table 11) has higher camber (3.5%) than Section 2 of Figure 4b (2.5%). The lower camber in Section 2 of Figure 4b does not shed water as quickly as Section 1 of Figure 4a, especially during periods of cyclone. In addition, the unsealed shoulder of Section 2 of Figure 4b, with occasional water ponding observed, allows moisture ingress into the pavement layers.
A plausible theory for the formation of potholes in Section 2 of Figure 4b (and not in Section 1 of Figure 4a) is that the fine particles of the base material allow for easier migration (through capillary action) of moisture from the subgrade. Strohm et al. [17] showed that the capillary action of materials increases with the increase in quantity of small particles. Dawson [18] briefly discussed how water rises through the pavement structure by evaporation and capillary action during the day, and condenses under the pavement structure if the pavement structure is colder than soil at night. Dawson [18] did not, however, discuss how this progresses into the formation of defects. This may have been previously explained by Brakey [19] as the formation of thin film of moisture below the surfacing. With time, through a combination of traffic stresses and the film of moisture, the bond between the base and the seal breaks. Cracks are then formed and eventually potholes result. These defects occur if the bond between the surfacing and base is poor and the surfacing is too thin, weak, or old. In Section 1 of Figure 4a, the capillary action will be considerably less than that in Section 2 of Figure 4b because of the coarse Macadam base layer that was used in Section 1 of Figure 4a.
Capillary rise can be calculated using Equation (1) proposed by Peck and Hanson [20].
h c = C e D 10
In this formula, hc is the maximum capillary rise height, C is a constant, e is the void ratio in the material, and D10 is the theoretical sieve size through which 10% of the material passes.
It therefore follows that coarse bases would have larger values of D10 and e, and therefore the height of rise would be less. Moreover, any capillary pressure developed in the lower, finer layers would be broken at the interface with the Macadam base because of the large voids and despite the low crown height of only 0.2 m. Thus, the initiation of pothole formation by the mechanism described does not manifest itself.
In swampy conditions, a high crown height alone may not therefore be sufficient to break moisture migration if the height of embankment is less than the height of capillary rise. Introduction of a coarse layer such as Macadam is required.
Calculations by Li et al. [21] show that capillary rise in clayey sands compacted to 90% maximum dry density can reach up to 3 m and up to 3.5 m in high plasticity clays such as that found in the embankment material at Macia–Chokwe. A crown height of 1.5 m alone is thus not sufficient to prevent the capillary rise from reaching the bituminous seal.

4. Discussion

Based on the analyses presented in this paper, the following summarizing discussion can be made:
  • Supporting the findings of previous studies, it has been shown that the use of sealed shoulders significantly improves road performance. When shoulders are sealed (see Table 4), materials of high plasticity (PI ≤ 16 and PM ≤ 560) can be used in the base layer and good performance can still be achieved. However, to achieve good performance when shoulders are unsealed, more stringent limits have to be imposed on the plasticity of the base layer (PI ≤ 10 and PM ≤ 240) in order to ensure good performance. It is also worth noting (see Table 4) that there is no significant difference in the minimum permissible strength of the base layer for roads with unsealed or sealed shoulders to ensure good performance (CBR 40–46%). This study has further shown that well-maintained grassed shoulders can also be effective in improving performance of low volume sealed roads.
  • When high crown height (>0.75 m) is used, materials of high plasticity (PI ≤ 10 and PM ≤ 188) can be used in the base layer and good performance can still be achieved. However, to achieve good performance when the crown height is less than 0.5 m, more stringent limits have to be imposed on the plasticity of the base layer (PI ≤ 2 and PM ≤ 79) in order to ensure good performance (see Table 6). It is also worth noting that there is no significant difference in the minimum permissible strength (CBR 40–46%) for good performance of the base layer for the low crown height (< 0.5 m) and that for the high crown height (> 0.75 m). If the crown height is at least equal to 0.5 m, then the limits for materials characteristics for shoulder type overrides those for the crown height. Conversely, if the crown height is less than 0.5 m, then the limits for materials characteristics for the crown height overrides those for the shoulder type.
  • Though Table 7 shows that good performance can be achieved even with road camber between 1% and 2%. It is safer to provide a minimum camber of 3% if natural gravels are used, especially in view of potentially more extreme events in sub-Saharan Africa, such as the climate changes. Additionally, natural gravels (commonly used in low volume roads in sub-Saharan Africa) are susceptible to rutting, which in turn can lead to rainwater ponding and ingress into the road pavement. With a high camber (3%), rainwater has a high chance of draining off.
  • Adequately sized culverts that consider periodic silting capacity should be used at critical points on any low volume road (see Case Study 1).
  • Capillary action has the potential to cause the failure of thin bituminous seals (see Case Study 2).

5. Conclusions

Since several factors related to drainage combine to influence road performance, predicting their separate influence and the ultimate road performance is not straight forward, and it is therefore recommended that a combination of solutions be used to ensure good performance, i.e., low volume sealed roads should be constructed with a crown height of at least 0.50 m, a camber of at least 3%, and with sealed shoulders. The values of crown height to use and the decision whether to seal shoulders or not should be based on the plasticity characteristics of the base layer material available for use.
It is presented (Section 3.5.1) that the failure mechanism of one of the study sections occurred through a combination of a cracked bituminous surfacing, low camber, low crown height, and absence of shoulders. The low camber (1.3%) did not permit runoff from heavy storms to drain off quickly to the side drains, and the low crown height (0.1 m), coupled with the absence of shoulders of any kind, allowed for overflow of the side drain onto the carriageway. The water then infiltrated through the cracks on the surfacing and weakened the base layer, leading to severe rutting.
On another study section, it is presented (Section 3.5.2) that capillary rise through fine-grained embankment (1.5 m) and pavement materials led to the formation of a thin film of moisture below the surfacing. With time, through a combination of traffic stresses and the film of moisture, the bond between the base and the seal breaks. Cracks were then formed, and eventually potholes resulted.
During routine maintenance, grass or gravel berms at the edge of the road should be cleared to ensure water from the carriageway is not trapped between the seal edge and the side drain—as discussed in Section 3.2.
Whenever the ground water table is high (such as in swamps), a coarse layer such as Macadam (Section 3.5.2) should be used under the seal to ensure that condensation does not form directly at the interface between the bituminous seal and the top of the base.

Author Contributions

Conceptualization, A.O.; methodology, J.R.; formal analysis, A.O., J.R., K.M.; investigation, A.O., K.M.; data curation, J.R.; writing—original draft preparation, A.O.; writing—review and editing, J.R.; supervision, A.O.; project administration, A.O. All authors have read and agreed to the published version of the manuscript.

Funding

This research was funded by the UKaid through the Research for Community Access Partnership (ReCAP).

Acknowledgments

The authors acknowledge the support provided by the UKaid through the ReCAP program, the contribution of participating countries of the ReCAP program to fieldwork, internal reviewers Dave Gershkoff, Eng. Nkululeko Leta, and the ReCAP programme Technical Panel.

Conflicts of Interest

The authors declare no conflict of interest.

References

  1. Transportation Research Board. Special Report 160. Low-Volume Roads; Transportation Research Board: Washington, DC, USA, 1975. [Google Scholar]
  2. Transportation Research Board. Special Report 214. Designing Safer Roads: Practices for Resurfacing, Restoration, and Rehabilitation; Transportation Research Board: Washington, DC, USA, 1987. [Google Scholar]
  3. American Association of State Highway and Transportation Officials (AASHTO). A Policy on the Geometric Design of Highways and Streets; AASHTO: Washington, DC, USA, 2001. [Google Scholar]
  4. National Cooperative Highway Research Program (NCHRP). Guide for Mechanistic-Empirical Design for New and Rehabilitated Pavement Structures: Part 4 Low volume Roads; Transportation Research Board: Washington, DC, USA, 2004. [Google Scholar]
  5. Ethiopian Roads Authority. Design Standards for Low Volume Roads. Ethiopian Roads Authority; ERA: Addis Ababa, Ethiopia, 2011. [Google Scholar]
  6. Otto, A.; Rolt, J.; Musenero, L.; Mukura, K. Development of Guidelines and Specifications for Low Volume Sealed Roads through Back Analysis, Phase 3 Final Report; ReCAP for UKaid: London, UK, 2020. [Google Scholar]
  7. Gourley, C.S.; Greening, P.A.K. Performance of Low Volume Sealed Roads: Results and Recommendations from Studies in Southern Africa, Volume 1, PR/OSC/167/99; TRL: Berkshire, UK, 1999. [Google Scholar]
  8. Rolt, J.; Gourley, C.S.; Hayes, J.P. Rational Drainage of Road Pavements PR/INT/244/02; TRL: Berkshire, UK, 2002. [Google Scholar]
  9. Paige-Green, P. An Alternative Philosophy on the Deterioration and Design of Low Volume Roads; CAPSA: Sun City, South Africa, 2015. [Google Scholar]
  10. Southern Africa Development Cooperation SADC. Guideline on Low Volume Sealed Roads; Goldfields Press (Pty) Ltd.: Johannesburg, South Africa, 2003. [Google Scholar]
  11. Department of Transport South Africa. TRH 22 Pavement Management Systems; DOT: Pretoria, South Africa, 1994. [Google Scholar]
  12. Wolff, H.; Visser, T. Review of surfacings for low-volume roads on the basis of experience in South Africa. Transp. Res. Rec. 1991, 1291, 193–201. [Google Scholar]
  13. Ogden, K.W. The effects of paved shoulders on accidents on rural highways. J. Accid. Anal. Prev. 1997, 29, 353–362. [Google Scholar] [CrossRef]
  14. Rolt, J.; Mukura, K.; Dangare, F.; Otto, A. Back Analysis of Previously Constructed Rural Roads in Mozambique; African Community Access Programme for Department for International Development: London, UK, 2013. [Google Scholar]
  15. Transport Research Laboratory. Overseas Road Note 6: A Guide to Geometric Design; TRL: Berkshire, UK, 1988. [Google Scholar]
  16. Paige-Green, P.; Verhaeghe, B.; Head, M. Climate Adaptation: Risk Management and Resilience Optimisation for Vulnerable Road Access in Africa, Engineering Adaptation Guidelines; ReCAP for UKaid: London, UK, 2019. [Google Scholar]
  17. Strohm, W.E.; Nettles, E.H.; Calhoun, C.C. Study of drainage characteristics of base course materials: Symposium on subsurface drainage. Highw. Res. Rec. 1967, 203, 8–28. [Google Scholar]
  18. Dawson, A. Water in Road Structures. Movement, Drainage & Effects; Springer: New York, NY, USA, 2008. [Google Scholar]
  19. Brakey, B.A. Hydrogenesis and Expansive Soils in Colorado. In Proceedings of the 6th Annual Paving Conference, University of New Mexico, Washington, DC, USA, 12–13 December 1968. [Google Scholar]
  20. Peck, R.B.; Hanson, W.E.; Thornburn, T.H. Foundation Engineering; Wiley: New York, NY, USA, 1974. [Google Scholar]
  21. Li, Y.; Zhang, C.; Chen, C.; Chen, H. Calculation of capillary rise height of soils by SWCC model. J. Adv. Civ. Eng. 2018. [Google Scholar] [CrossRef] [Green Version]
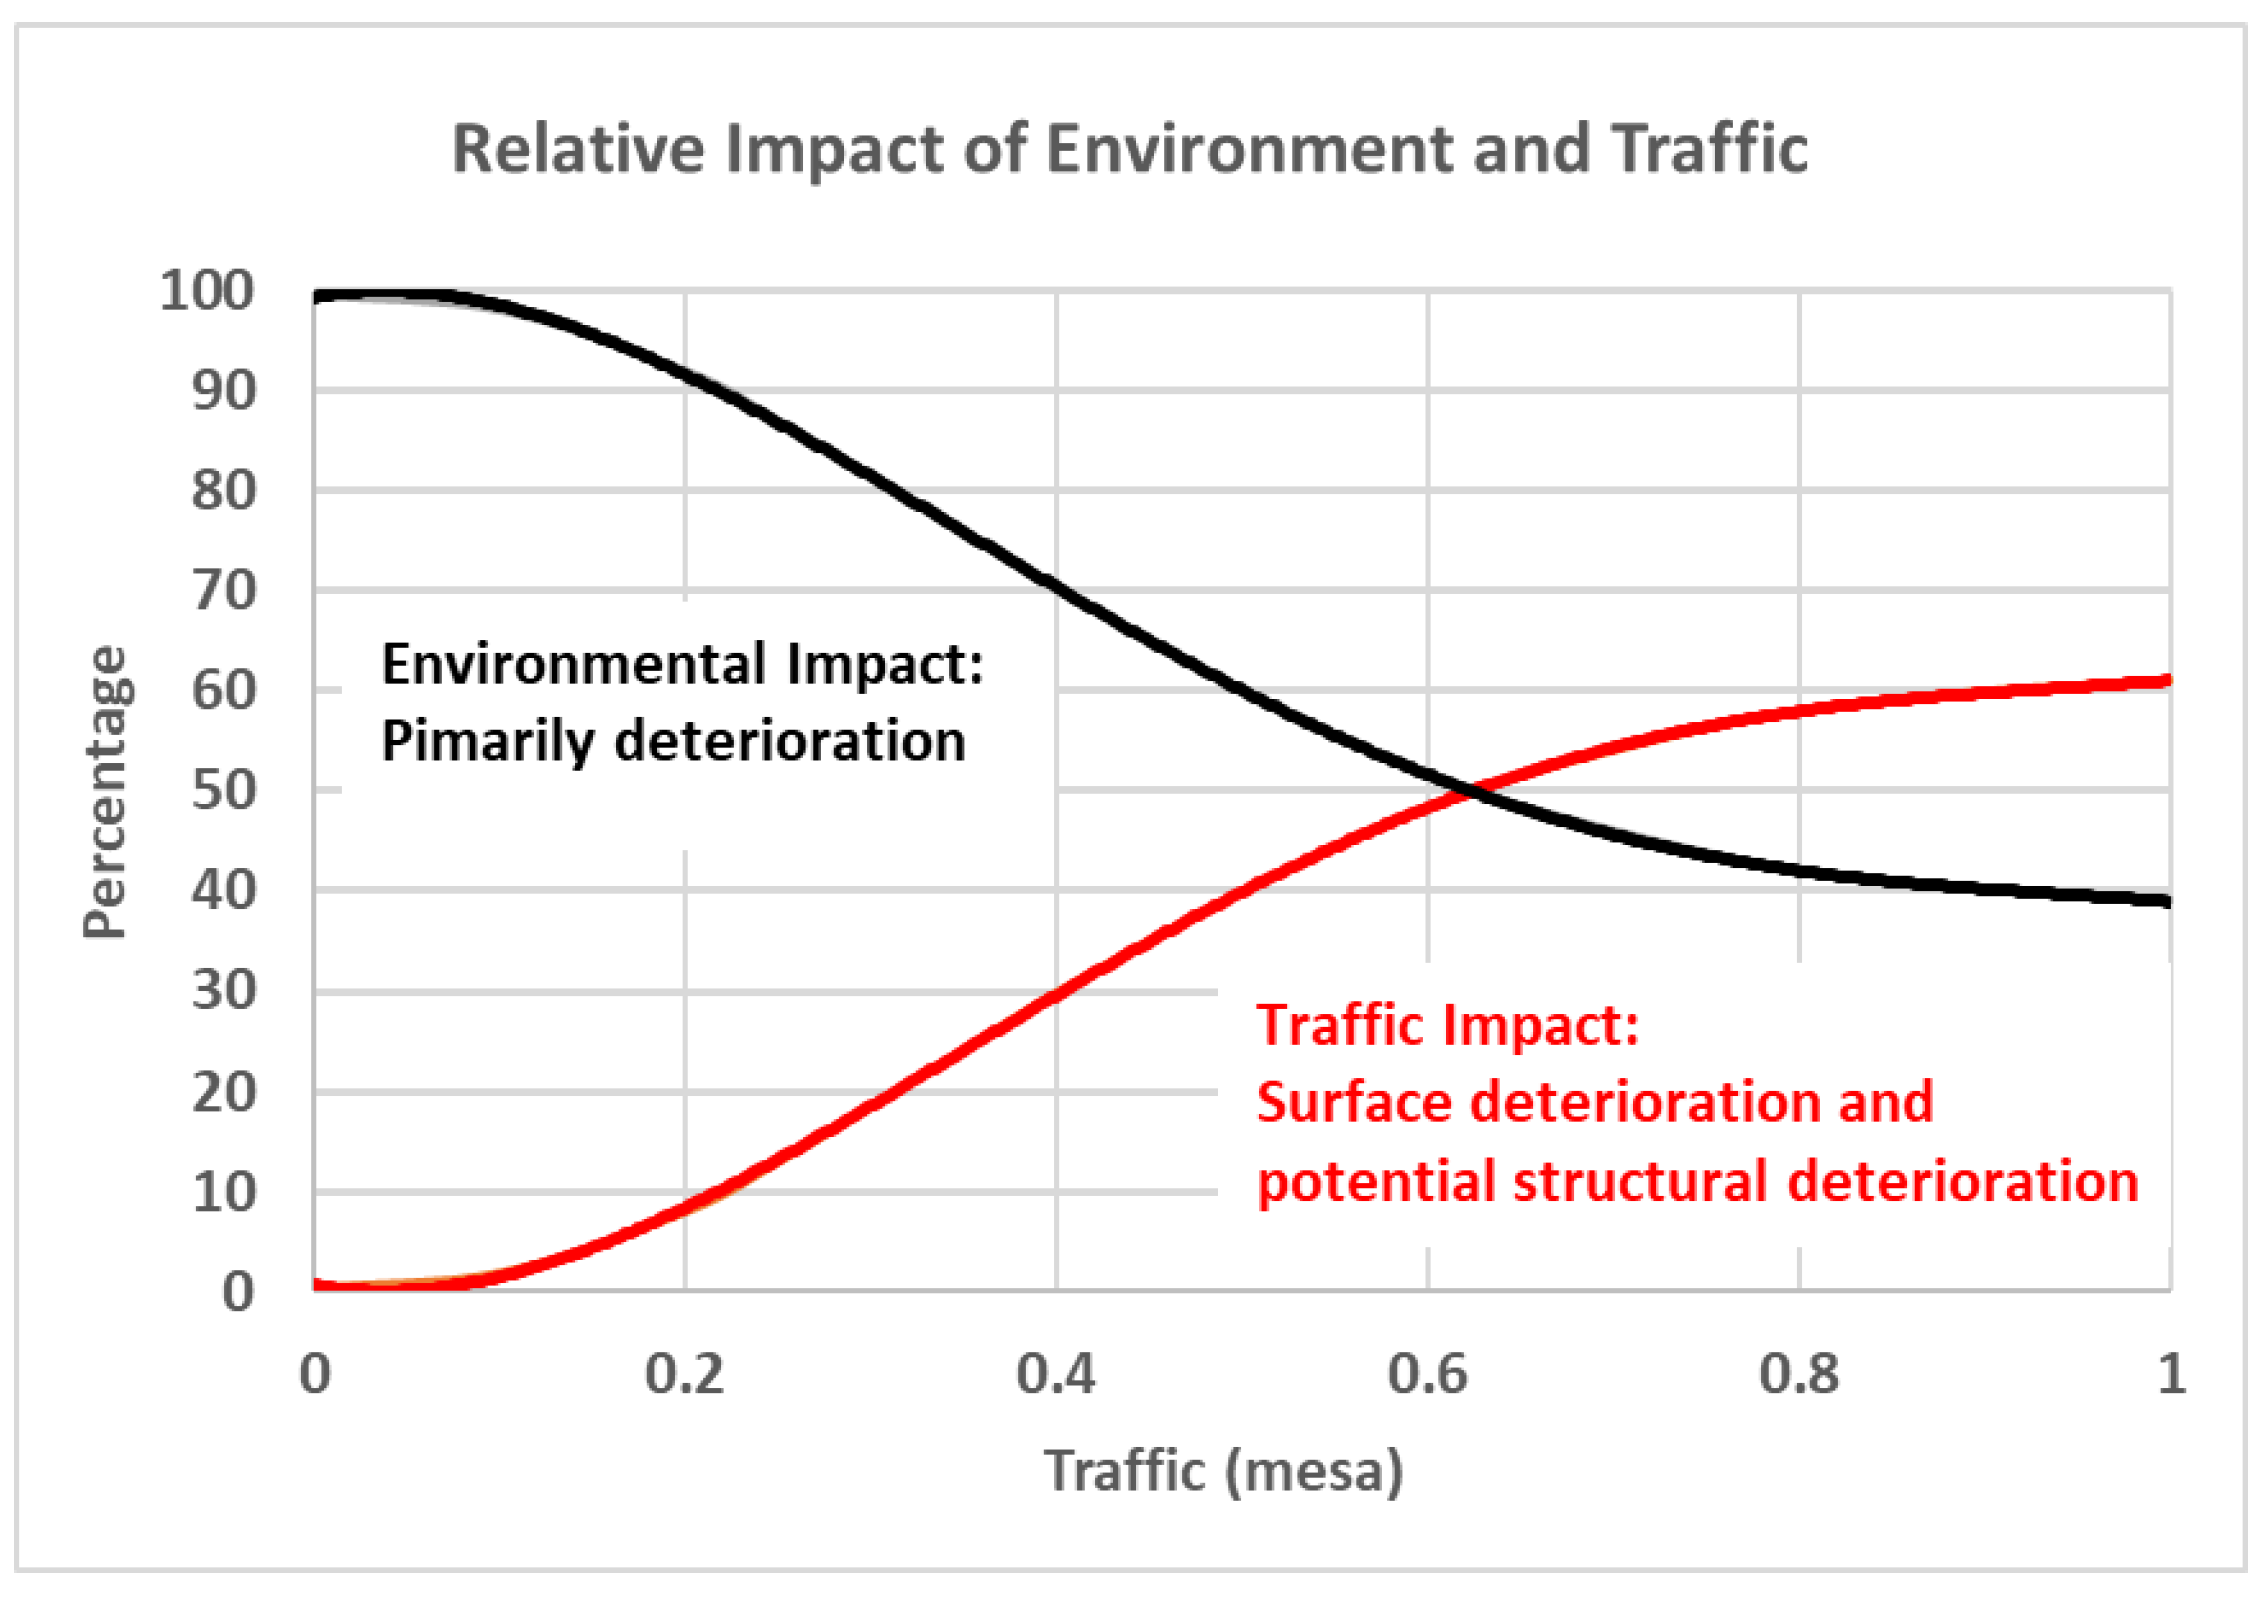
Figure 1. Contribution of environmental effects versus traffic loading to the deterioration of low volume sealed roads (LVSRs) (schematic only). Source: Southern Africa Development Cooperation (SADC) [10].
Sustainability 12 06101 g001
Figure 2. Grass and earth berms preventing run off water from flowing to the side drains.
Sustainability 12 06101 g002
Figure 3. Photograph of the study sections on Koforidua–Adukrom Road. (a) Section 1, Poor performance; (b) Section 2, Good performance.
Sustainability 12 06101 g003
Figure 4. Photograph of the study sections on Macia–Chokwe Road. (a) Section 1, Good performance; (b) Section 2, Poor performance.
Sustainability 12 06101 g004
Table 1. Description of road condition indices.
Condition DescriptionCondition Index Range
Good (including very good)70 ≤ VCI ≤ 100
Fair50 ≤ VCI < 70
Poor (including very poor)0 ≤ VCI < 50
Table 2. Range of key characteristics of the road sections analyzed.
ParameterRange
Rainfall (mm/yr)750–2200
Traffic (MESA)0.2–3.5
Crown Height (m)0.1–4.0
Camber (%)0.8–4.3
Shoulder TypesSealed, Grassed, and Unsealed
Base Layer Plasticity Index0–23
Base Layer Plasticity Modulus0–1288
Base Layer California Bearing Ratio (%)20–100
Table 3. Shoulder type vs. road visual condition.
Shoulder TypeNumber of Sections
Visual Condition Indices
VCI < 50
Poor
50 ≤ VCI < 70
Fair
70 ≤ VCI ≤ 100
Good
Sealed Shoulders4518
Unsealed shoulder6411
Grassed Shoulder029
Table 4. Comparison of base layer materials characteristics with shoulder type for good-performing sections.
Shoulder TypeBase Layer Materials Characteristics
25th Percentile Plasticity Index75th Percentile Plasticity Index25th Percentile Plasticity Modulus75th Percentile Plasticity Modulus25th Percentile Strength (CBR %)
Sealed Shoulders71610656046
Unsealed shoulder3108824040
Grassed Shoulder71420550044
Table 5. Crown height vs. road visual condition.
Crown Height (m)Numbers of Road Sections
Visual Condition Indices
VCI < 50
Poor
50 ≤ VCI < 70
Fair
70 ≤ VCI ≤ 100
Good
<0.505314
0.50–0.752111
>0.753713
Table 6. Comparison of base layer materials characteristics with crown height for good-performing sections.
Crown Height (m)Base Layer Materials Characteristics
25th Percentile Plasticity Index75th Percentile Plasticity Index25th Percentile Plasticity Modulus75th Percentile Plasticity Modulus25th Percentile Strength (CBR %)
CH < 0.502147948344
0.50 ≤ CH ≤ 0.7561116245840
CH > 0.75101518852246
Table 7. Road camber vs. road visual condition.
Camber (%)Numbers of Sections
Visual Condition Indices
VCI < 50
Poor
50 ≤ VCI < 70
Fair
70 ≤ VCI ≤ 100
Good
<1011
1 to 21313
>25615
Table 8. Section strength characteristics and performance of Case Study 1. FMC: Field moisture content, OMC: Optimum moisture content.
SectionLayerFMC/ OMCIn situ DCP–CBR of Section (%)Rut Depth (mm)Crack Index (CRI) Max = 25,
Min = 0
Pothole and Patching Index
(PPI)
Max = 50,
Min = 0
VCI
Mean90% ile
Koforidua–Adukrom 1Base1.4621627252935
Sub-base1.263
Subgrade0.931
Koforidua–Adukrom 2Base0.89161212278
Sub-base1.087
Subgrade1.421
Notes: Rut depth as measured along the wheel path at 20 m intervals; Crack Index (CRI) = the crack intensity X extent. Intensity scaled is 0 to 5, and extent scale is 1 to 5; Pothole Index = pothole intensity X extent. Intensity scaled is 0 to 5, and extent scale is 1 to 5; Patching Index = patch intensity X extent. Intensity scaled is 0 to 5, and extent scale is 1 to 5; PPI = Pothole Index + Patching Index.
Table 9. Geometric characteristics of Case Study 1.
Road/SectionCrown Height (m)Camber (%)Shoulder Description
Koforidua–Adukrom 10.11.3No shoulder. Completely silted side drain. In sag and has sunken profile.
Koforidua–Adukrom 20.72.3Gravel/grassed shoulder. Grassed drain up to edge of seal. Good side drain.
Table 10. Section strength characteristics and performance of Road 2.
SectionLayerFMC/OMCIn situ DCP-CBR of Section (%)Rut Depth (mm)Crack Index
(CRI)
Max = 2,
Min = 0
Pothole and Patching Index (PPI)
Max = 50,
Min = 0
VCI
Mean90% ile
Macia–Chokwe 1Base--6119775
Sub-base0.940
Subgrade1.650
Macia–Chokwe 2Base--4853157
Sub-base0.796
Subgrade2.910
Table 11. Geometric characteristics of Road 2.
Road/SectionCrown Height (m)Camber (%)Shoulder Description
Macia–Chokwe 10.23.5Grassed shoulders, visible shoulder camber, no ponding, Good side drain.
Macia–Chokwe 21.52.5Gravel shoulders, occasional ponding, grass berm preventing water to side drains. Ponding on shoulder coincides with pothole on carriageway. Embankment in swamp.