Article

A Structural Analysis for the Categorization of the Negative Externalities of Transport and the Hierarchical Organization of Sustainable Mobility’s Strategies

by
Ioannis Chatziioannou
1,*,
Luis Alvarez-Icaza
1,
Efthimios Bakogiannis
2,
Charalampos Kyriakidis
2 and
Luis Chias-Becerril
3
1
Institute of Engineering, UNAM, National Autonomous University of Mexico, Mexico D.F. 04510, Mexico
2
Department of Geography and Regional Planning, School of Rural and Surveying Engineering, National Technical University of Athens, 15780 Athens, Greece
3
Institute of Geography, UNAM, National Autonomous University of Mexico, Mexico D.F. 04510, Mexico
*
Author to whom correspondence should be addressed.
Sustainability 2020, 12(15), 6011; https://doi.org/10.3390/su12156011
Submission received: 23 June 2020 / Revised: 21 July 2020 / Accepted: 22 July 2020 / Published: 27 July 2020
(This article belongs to the Collection Sustainability in Urban Transportation Planning)

Abstract

:
Transport systems are capable of contributing to the economic robustness of a geographic area and the well-being of its inhabitants via the supply of the necessary assets for the mobility of people and goods. However, transport projects have the capacity to produce several negative externalities such as water pollution, air pollution, barrier effects, noise, and ecological impact, which affect the quality of people’s life. Considering these facts, the main purpose of this study is to indicate methodologically how the negative externalities of transport are interlinked, so that to promote sustainable mobility development. This paper reveals via the method of structural analysis, the interrelations between the negative externalities of transport, firstly to organize them hierarchically and secondly to evaluate the potential of sustainable mobility strategies concerning the co-benefits generated by their implementation for society. The results show that the negative externalities of transport are not isolated phenomena; on the contrary, they are interlinked and can be organised hierarchically according to the relationships between them so that certain public policies can be prioritized and the negative impacts of transport can be tackled more effectively. The most critical negative externalities are the invasion of public space for the construction of more roads, along with road accidents, congestion, and local air pollution. On the other hand, the most important group of strategies for sustainable mobility are the ones oriented to urban design, and more specifically to transit-oriented development.

1. Introduction

The twentieth century was decisive for the urbanization of the world as economic, social, cultural, and political processes such as globalization, in conjunction with population growth, caused the expansion of cities [1]. Hence, cities needed to be remodelled as they faced overpopulation, peripheral formations, and metropolization. The structure of the city has transformed into a diversified, multi-nuclear form, with high rates of environmental pollution and internal insecurity [1]. This situation has generated the degradation of public space, the disorganization of urban space, a decrease of connectivity between localities, and massive migration to the outskirts of the city, generating the phenomenon of urban sprawl [2]. Through the latter phenomenon, it has become apparent that travel within cities and from cities to other regions is essential. Transport therefore rose as a key factor for city planning [3], as it is an important element for influencing the economic robustness of an area and the well-being of its inhabitants [4,5,6]. This can be magnified within the context of urbanization where economic opportunities are strongly related to the urban centres, contrary to the residential areas, that are mainly located on the outskirts, generating an aggregate mobility demand and longer travels that start from the suburbs of the city [7,8]. Generally, through literature review it has been demonstrated that infrastructure investment positively influences growth and economic impact [9]. Nowadays, the scientific literature has expanded with implemented research using divergent perspectives, such as growth regressions and production functions. These investigations have provided evidence that transport has the ability to positively impact growth rate, productivity, output, and economic development [10,11,12,13,14,15,16,17,18,19,20,21].
Furthermore, the infrastructure of transport is an essential component to take into account in order to enhance freight mobility and urban design scenarios [22,23]. Hence, the transport of people and goods is essential for the development of a country. However, the activities of both types of transport (freight and passengers) have another characteristic in common, and that is the generation of several negative externalities, which are rarely considered by the authorities in the private and public sectors [24]. In general, there is an accord in literature that road transport is responsible for the generation of several negative externalities, such as congestion, barrier effects, road crashes, oil dependence, and water and air pollution [25].
Private auto-mobiles have the capacity to contribute to climate changes via the generation of greenhouse gases and a variety of different pollutants. The latter could severely impact the environment and consequently the health of the people [26,27]. In Mexico in 2008 there were 14,000 deaths due to poor air quality because of gasoline combustion, as well as a number of people impacted by road accidents (750,000 injured, 40,000 disabled, and 24,000 deaths) [28]. The pandemic of traffic accidents is a major contributor of the social costs generated by the road transport. For instance, in 2007, Parry, Walls, and Harrington evaluated within the geographical context of the United States of America that road accidents generated social costs equal to 4.3% of the Gross Domestic Product (GDP), while the World Health Organization (WHO) values the damage of road traffic crashes for most countries at 3% of their GDP [29].
In this gloomy panorama, it is important not to forget the degradation of public space due to the intensive use of private vehicles and associated infrastructure that has harmful effects, not only upon the psychology of the local population, but also upon the attractiveness and image of the city [30]. The studies of Putnam [31] and Hart [32] provide evidence that the long times spent in travelling (congestion) reduce the involvement of individuals in their communities and limit social relations. These negative externalities caused by the transportation sector have serious impact upon sustainable development that can be defined as the development destined to cover the needs of the present generations without endangering the capacity of future generations to cover their respective needs [33]. Sustainable development has three axes upon which the quality of life can be based: environment, economy, and society [34].
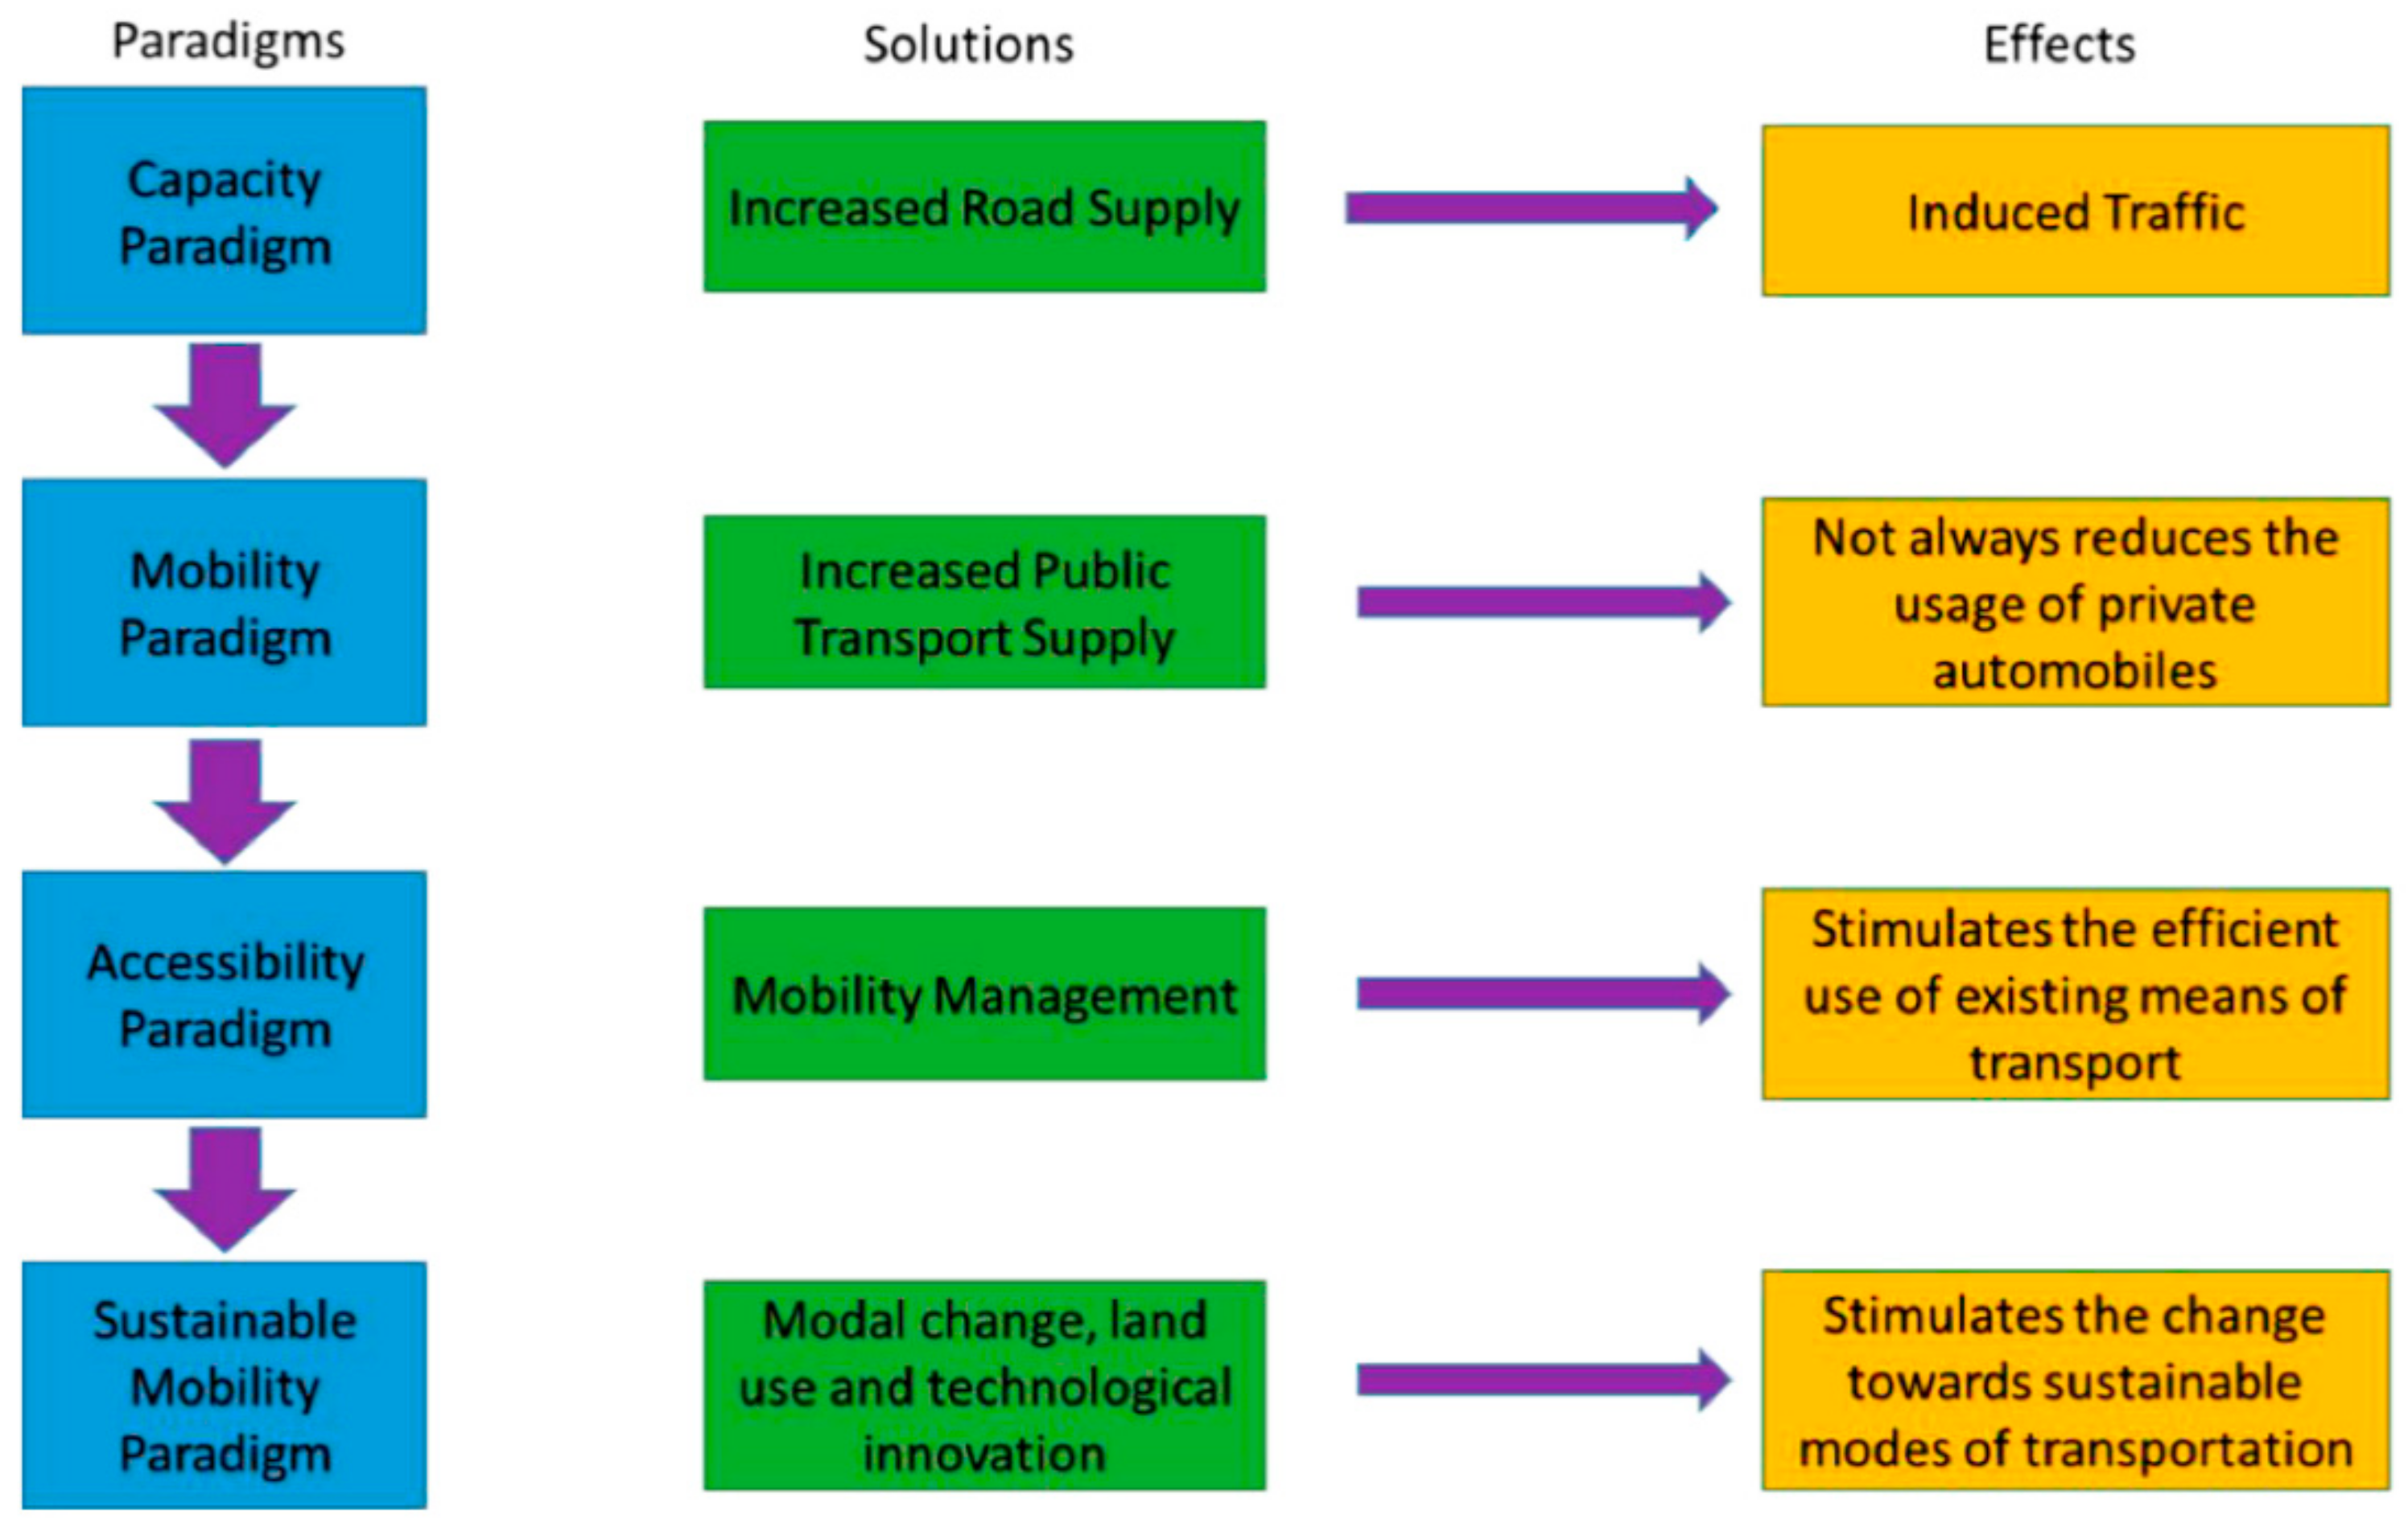
Hence, the 21st century introduced new challenges to which the mono-disciplinary concept of transport failed to respond, such as environmental problems, major congestion, the invasion of public space in order to build new roads and move vehicles, noise, barrier effects, the inclusive-equitable management, and the humanization of urban management [3,32]. Therefore, the literature shows a transition from one approach in terms of transport to one in terms of mobility [35,36,37,38,39]. It is worth mentioning that this shift from transport to mobility means moving from an approach oriented to the movement of vehicles and the infrastructure necessary for them, to a mobility approach interested in the movements of individuals [1].
Consequently, the motivation of the present study is compatible with the contemporary challenge posed by urban traffic and urban planning systems, which is more related to the promotion of sustainable mobility via a qualitative improvement based on the mitigation of transportation’s negative externalities, participation, and accessibility that incorporates social groups with different mobility necessities [40,41].
Considering these facts, the aim of this work was to apply a MICMAC-structural analysis method to the identified negative externalities of transport in order to promote sustainable transportation. This was achieved in two steps: first we identified the relationships between the different negative externalities produced by the activities of transport and organized them hierarchically. Second, we assessed the effectiveness of several public policy-strategies oriented towards sustainable mobility according to their impact upon the negative externalities and the co-benefits generated by their implementation for society.
The main research question for this study is: “How is the hierarchical organization of the negative externalities of transport via a participative-prospective method able to contribute to the promotion of sustainable mobility development?” This principal question can be divided into five sub-questions:
  • RQ1: What are the negative externalities generated by transport?
  • RQ2: What are the public policies related to sustainable mobility?
  • RQ3: How are the negative externalities of transport interlinked with each other?
  • RQ4: How are the negative externalities of transport connected to public policies oriented towards sustainable mobility?
  • RQ5: Can public policies be organized in order of importance according to their impact upon the negative externalities of transport?
The structure of the paper is as follows. Section 2 presents the negative externalities generated by transport and offers a brief presentation of the literature review related to changes in transportation paradigms and the existing strategies for sustainable mobility. Section 3 provides information about the method used to determine the interrelation between the negative externalities of transport, and applies structural analysis for their organization in order of importance. Section 4 provides the conclusions of the paper and proposes directions for future research on the issues of sustainable mobility.

2. Literature Review

In this part of the paper, we describe how the literature review was conducted, concerning matters related to the negative externalities of transport and changes in transportation paradigms along with strategies oriented towards sustainable mobility.

2.1. The Negative Externalities of Transport

An externality occurs when an agent performs an action from which effects are derived that have an impact in the form of benefits or costs to other agents. The basic characteristic of an externality is that the agent causing the external effects is not obliged to make any indemnity to those affected by the costs imposed, or is not entitled to compensation for the generated profits. There are numerous reasons why it is interesting to analyse the effects of externalities generated by transport activities. First, it allows us to understand the use of natural resources in transportation and to assess the social cost of these negative externalities. Second, it helps with determining whether the actual modal allocation is appropriate from a social perspective, or if it is decisive to apply remediating mechanisms to alter it [24].
As mentioned previously, transport is famous for generating several negative externalities such as congestion, road traffic crashes, energy dependence, road damage, and air and water pollution [25]. However, there are other types of negative externalities such as visual blight, vibration damage, barrier effects, and others that could affect the quality of life of people if not treated adequately [42,43]. In the following figure (Figure 1), the negative externalities associated with transport and their impact upon the three axes of sustainability can be seen.
The list of negative effects from transport activities is long, due to the many impacts that this industry has. The most obvious problems are air pollution, both locally–regionally and globally (greenhouse gases-ecological impact), caused by all types of vehicles using fuel and the noise generated by the engines of those vehicles. Apart from air pollution and noise, transportation activity produces other environmental externalities, including water pollution, land use modifications, vibration damage, impacts on historic monuments of human heritage, and impacts on biodiversity and ecosystems [25].
Noise is a very harmful factor for the health of the people and hinders the smooth realization of their everyday activities. In Europe, as reported by the WHO, road transport noise affects 33% of people. The main impacts from noise include hearing difficulties, frustration, radical changes in the behaviour of people, communication complications, fatigue, and difficulty in sleeping. These impacts can cause serious issues on human organization such as heart diseases and circulatory problems, hormonal reactions, as well as nutrition issues, failures of immune system, low concentration, and underachievement at work and school due to fatigue and sleeping difficulties [44].
Fossil fuels are the principal source of energy utilized for road transportation activities [45]. This causes leaks because of fuel combustion and the vaporization of petrol throughout the process of production, storage, and distribution. Moreover, evaporative emissions can be observed in the case of petrol-engine vehicles from their gas tank and carburetor. At local and regional levels there is an extensive list of air pollutants that are capable of affecting human health and the environment. The typical emissions from road transport can be categorized into three groups, carbon monoxide, nitrogen oxides, and hydrocarbons, that are responsible for 75%, 58%, and 50% of all the respective emanations in the European Union [46].
Transportation activities generate water pollution, produced by flows from auto-mobiles, such as motor oil escape and discard, salt-laden run-off from streets, particulate matter, and other air pollutants from exhaust and tire or brakes wear. In addition, infrastructure associated with railways is able to affect negatively aquatic ecosystems through gasoline escapes from containers, along with various contaminants [47]. Furthermore, the study conducted by Levengood et al. [48] provided evidence of dense gathering of heavy metals and polycyclic aromatic hydrocarbons (PAH) in water bodies near to railways that in some cases represented a risk to aquatic life.
The construction of road infrastructure for the territorial displacement of cars removes land from other potential productive uses and can also have associated negative impacts, such as [49]:
  • Habitat loss: Transportation activities demand land and therefore invade the habitats of flora and fauna.
  • Habitat fragmentation: Transport systems and their infrastructures penetrate the landscape and present, in some cases, impassable obstacles, especially for animals. The latter are therefore obliged to move within a reduced habitat (barrier effect), leading to the isolation of populations and consequently to in-breeding. The invasion of landscape has, as a result, a more frequent interaction between vehicles and wildlife, increasing in that way the number of collisions between animals and auto-mobiles.
  • Habitat quality loss via disturbance effects: Transport, as has been explained, causes noise, water pollution, airborne pollutants, visual blight, and vibration, which severely affect the quality of the animals habitat. Moreover, it should be noted that the aforementioned negative impacts are able to influence a more extensive area than the one which is directly affected and have the capacity to alter negatively the value of the land.
The risks of road accidents are included in all transport activities because of the great number of vehicles circulating at high speeds using common-shared infrastructures. These accidents can be the result of mechanical misconduct or, more frequently, can be the result of human errors. Hence, road accidents are events that occur in all means of transport. However, the mode of transportation responsible for the majority of injuries and casualties (in absolute numbers) in almost every country of the world is road transport, due to the extensive use of this mode compared to others. In studies carried out within the context of the European Union to estimate the social costs of externalities related to transport accidents it has been acknowledged that these are around 2.5% of GDP [24].
The externalities associated with road accidents have become more apparent with the entry of more vehicles to circulation, increasing non-linearly the possibility for pedestrians, cyclists, drivers and road-users in general to be part of an accident [25]. Nevertheless, it is worth mentioning that in cases of heavy traffic, vulnerable groups of road-users such as pedestrians-cyclists are more careful and drivers are obliged to move at lower speeds, and thus road accidents are not so severe [25].
Road damage externalities are generated due to the utilization of road infrastructures by numerous types of vehicles of different characteristics. The cost of road damage considers the necessary resources for the repairing of the damage produced by the flow of vehicles [26]. The deterioration generated by a vehicle changes in increments according to its dimensions (the bigger the dimensions and the weight of the vehicle, the bigger the damage provoked on transport infrastructure) [26]. Adding axle weight increases the risk of damaging pavement structures. For instance, with the same tire type and tire pressure, the estimated pavement lifetime with a 10 tonne axle can be tens of percentage points shorter than the lifetime obtained with an 8 tonne axle [50].
Congestion is caused by very high demand for the use of transport infrastructure at specific periods of time. The problem of congestion in transport arises from a gap between the existing demand for the use of infrastructure and the maximum capacity of the infrastructure to provide services to the users. This is a particular feature, as in all modes of transport demand is rarely constant over time. The impacts are well-known: longer and unreliable travel times, stress, road rage, fuel consumption and pollution, along with negative economic effects due to ineffective allocation of services and products [24].
Another negative externality that transport generates is oil dependence, which can potentially be an issue for countries that import oil as they are sensitive to oil-price shocks. This can be a threat to a country’s national security and economy, specifically if this a small country unable to influence world prices [25]. The extensive use of oil has the capacity to generate climate change due to the fact that oil combustion constitutes one of the main reasons for the generation of greenhouse gas phenomenon and consequently an essential factor in climate change, which if not considered could generate severe universal security issues. The most serious outcomes of climate change could enhance the instability of governments, intensify terrorist actions, and contribute to the displacement of people because of food and water shortages, natural catastrophes, waters rising, and more frequent cases of diseases like malaria [51].

2.2. Changes in Transportation Paradigms and Strategies Oriented towards Sustainable Mobility

Nowadays, the traditional transportation paradigm of capacity that encourages the construction of new roads in order to freely move vehicles is obsolete, as it generates the phenomenon of induced traffic and an unsustainable cycle of development [52]. Thus, it is essential to shift the way transport issues are conceptualized in order to successfully implement integral plans oriented towards the improvement of the performance of transportation system by diminishing the exaggerated usage of the car and its associated negative externalities. Now there is a need to transform the habits of territorial displacement of people and to offer incentives for using public transport and sustainable modes of mobility (Figure 2).
Capacity paradigm: This approach involves the resolution of vehicle congestion by increasing road supply, via the construction of new road infrastructure or by utilizing intelligent transportation systems to improve the performance of the existing ones. This paradigm generates the phenomenon of induced traffic, and while it is able to reduce congestion in short term, in the medium and long term it results in increased congestion and encourages the invasion of public space in order to move more vehicles [53].
Mobility paradigm: This approach focuses on moving goods and people efficiently. It aims to use road capacity intelligently and effectively, and highlights public transport systems among its proposals. However, this paradigm detracts from the “slow” transportation modes and minimizes the importance of demand management strategies, ignoring in this way the importance of urban design for the accessibility and mobility of people, and therefore it is not a comprehensive solution [53].
Accessibility paradigm: This approach values the level of multi-modal service, as well as the accessibility of multiple points of interest in order that the people are able to cover their mobility needs without use of the car, for this reason this approach promotes the densification of land uses and the creation of compact cities. This is a paradigm based on the concept of accessibility and enables the development of sustainable mobility [53], since sustainable transportation modes cannot cover very long distances. Hence, it can be said that the sustainable mobility paradigm proposed by David Banister [54] continues after that of accessibility in the evolution of the paradigms of urban mobility.
The sustainable mobility paradigm requires actions in order to reduce the realization of unnecessary travel (promotion of no-mobility concept), to inspire modal change, to shorten the travelled distance, and to strengthen the performance of the urban transportation system [54]. In the context of the sustainable mobility paradigm, the links between transport and land use must also be strengthened. In that way, the densification of land use is able to generate complete neighbourhoods where there is a balance between employment, transport, studies, green areas, and housing proximity so that people can cover their human needs without the necessity to use the car.
Sustainable urban mobility, as well as accessibility, depend on car use reduction via several public policies that need to derive from comprehensive mobility plans rather than partially implemented counter measures. In this regard, the management of mobility (that is, a very important factor both for the implementation of accessibility and sustainable mobility paradigms) has to be understood as the collection of strategies oriented towards the change of people’s territorial displacement habits, having as a priority the movement of people instead of vehicles and the establishment of more efficient systems of transport via the accomplishment of certain public policy objectives focused on sustainable development [52].
There are different groups of strategies and public policies to manage these alternative travel demands, as can be seen in Table 1, Table 2, Table 3 and Table 4. However, it should be noted that the method of filling out the following tables was by corresponding the ID of each public policy belonging to different strategies with their expected impacts and the affected negative externalities (within parenthesis).
Table 1 contains two groups of strategies (strategies oriented to efficient auto-mobile usage and strategies oriented to travel reduction), each of this group of strategies has its associated public policies with their respective ID. There are two public policies (car-pooling and high occupancy vehicle lanes) which belong to the strategies oriented to efficient auto-mobiles usage, both of these public policies are capable to reduce car usage and congestion; that’s why numbers 1 and 2 can be appreciated within the parenthesis next to the impacts “reduces car usage” and “reduces congestion”. However, there are cases where the public policies presented do not have common impacts, as is the case with car-pooling, which reduces travel times; in that case, solely the number 1 can be appreciated within parenthesis next to the impact “reduces travel times”. In its part, the strategy oriented to travel reduction includes two public policies (alternative work schedules and telecommuting), and both of them are capable to reduce car usage, to reduce congestion and to improve productivity and employee satisfaction.
Table 2 contains two strategies focused on vehicle possession and vehicle circulation with their associated public policies. The strategy focused on vehicle possession includes three public policies (vehicles tenure taxes, feebates, fleet renewal), while the strategy oriented to vehicle circulation consists of three public policies (congestion charge, charges of vehicles per kilometre travelled, and fuel taxes). The three policies belonging to the first strategy are capable, via shared impacts, of reducing emissions and promoting a shift to more efficient vehicles, while the three public policies of the second strategy have the capacity to simultaneously impact car use, congestion, emissions, road security, and the promotion of sustainable modes of transport.
On its part, Table 3 contains two strategies focused on parking places and urban planning with their derived public policies. The strategy focused on parking places consists of two public policies (parking meters, parking requirements in constructions and business), while the strategy oriented to urban planning considers three public policies (Transit Oriented Development, transit pacification, car-free planning). The common impacts of the public policies derived from the first strategy of Table 3 are: reduction of car use, reduction of congestion, improvement in terms of habitability and quality of public space, promotion of sustainable transportation modes and increase in the availability of parking places. The three public policies of the second strategy have the capacity to positively affect by the form of common impacts the promotion of sustainable modes of transportation, the efficient land-use, along with substantial improvements in terms of road security, habitability and quality of public space.
Finally, Table 4 contains two strategies oriented to public transport and to alternative modes of sustainable mobility (pedestrians and cyclists). The strategy oriented to public transport takes into account three public policies (exclusive lanes of public transport, bus rapid transit (BRT) approaches and the establishment of massive public transport networks), while the strategy oriented to cyclists and pedestrians considers three public policies (public bicycle systems, the establishment of bike lanes, and the generation of walkable spaces). The three policies belonging to the first strategy are capable, through common impacts, of reducing travel times, while the three public policies of the second strategy have the capacity to simultaneously impact the reduction of travel times, the promotion of sustainable modes of transport and the improvement of public space.
All of the previously seen tables play a double role, firstly, they help the reader to identify the strategies with their derived public policies that form part of the mobility management approach to promote the paradigm of sustainable mobility. Secondly, through the aforementioned tables it is possible to connect several strategies and pubic policies oriented to sustainable mobility with the negative externalities of transport, which will make feasible, via the structural analysis, the organization of the negative externalities of transport, in order to judge the importance and evaluate the potential of sustainable mobility strategies concerning the co-benefits generated by their implementation for society.

3. Methodology and Results

This part of the paper is separated into three sub-sections. The first one presents a brief introduction to the method of Impact Matrix Cross-Reference Multiplication Applied to a Classification (MICMAC)-structural analysis. The second section shows the application of the three steps of structural analysis to the negative externalities of transport, and the third presents the results and the discussion of this study.

3.1. Introduction to Structural Analysis: The MICMAC Method

The constant need to know what the future holds has always concerned humanity. From the beginning of civilization, the human species has tried to decipher it in different ways using arcane approaches such as magic, divinatory arts, and oracles, and later via scientific approaches such as mathematical projection and extrapolation of trends.
As time passed, humanity changed, and this also changed the conception of the future. People ceased to regard the future as a predetermined reality and tried to analyse it from a humanistic and multifaceted point of view, concluding that it was full of multiple human decisions and thus indeterminate. This new “way of addressing the future” generated a new branch of research named prospective studies, whose main premise is that the future does not happen automatically, but depends on human actions. For this reason, the prospective approach has become a fundamental planning tool, which, in addition to clarifying the future, is able to guide the human actions that will lead to its realization.
One of the most typical and well-known apparatus within the field of prospective studies is structural analysis. The latter has been applied for the first time in the distant 1961 by Jay Forrester in his research related to industrial and urban dynamics. Throughout the years, structural analysis has been enriched via the use of matrices and graphs to assist the researchers in their effort to take into account multiple qualitative and quantitative elements [73].
In 1969, Wanty and Federwish [74] utilized the method of structural analysis to evaluate the operation of projects associated with industry and transport. In the same period, Teniere-Buchot used the method of structural analysis within the context of water system analysis to promote countermeasures destined to tackle water pollution [75]. Soon after, Kane provided evidence of a model called Kane’s Simulation (KSIM) that is fundamentally based upon structural analysis [74]. Meanwhile, Roberts [75] realized research in the sector of transportation for the understanding of interrelations between approaches responsible for energy consumption and pollution. Later, Duperrin and Godet [74] conducted research by using the method of structural analysis in order to organize variables associated with nuclear energy in order of importance.
Lately, structural analysis has been used by Sharma and Gupta [75] to evaluate waste treatment. Meanwhile, Arya and Abbasi [75], led works for environmental assessment by using structural analysis. In addition, structural analysis has been applied by Kanungo, Duda and Srinivas for the estimation of information systems performance [74]. Furthermore, international relationships approaches have been combined with the method of structural analysis to identify, characterize, and perceive the nature of international conflict [74]. Finally, Qureshi, Kumar, and Kumar [75] utilized the method of structural analysis for the publication and promotion of 3PL provider’s services guidelines.
The structural method is an instrument planned to connect opinions. It permits the explanation of the system under study via a matrix that interlinks all of its elements. By identifying and studying the correlations of the system, the method is capable of emphasizing the critical variables for the behaviour and development of the system.
Structural analysis contains three phases that can be appreciated in the following lines [75]:
  • Phase 1: Creation of an inventory that includes the variables of the system.
  • Phase 2: Description of the relations among the variables of the system.
  • Phase 3: Identification of essential variables and key factors.
The structural analysis method was chosen to be used due to the following advantages: [75,76]
  • It enables the identification of the key variables that need to born in mind within the analysis of the examined system.
  • It allows the perceptions of experts to be considered within the planing process.
  • It permits the in-depth analysis of the system of variables.
  • It allows the comparison and the hierarchical organization of various variables that generate valuable information.
  • It is able, through indirect relationships, to reveal specific variables which due to their indirect interlinks are critical for the behaviour of the system and via direct classification were not identifiable.

3.2. Transportation vs Negative Externalities: A Study through the MICMAC Method

This section describes the interlinks between different negative externalities of transport in order to identify the most effective strategies-public polices according to the expected co-benefits generated by their implementation. The methodological approach of the study will be described below.

3.2.1. Phase 1: Creation of an Inventory that Includes all the Variables of the System

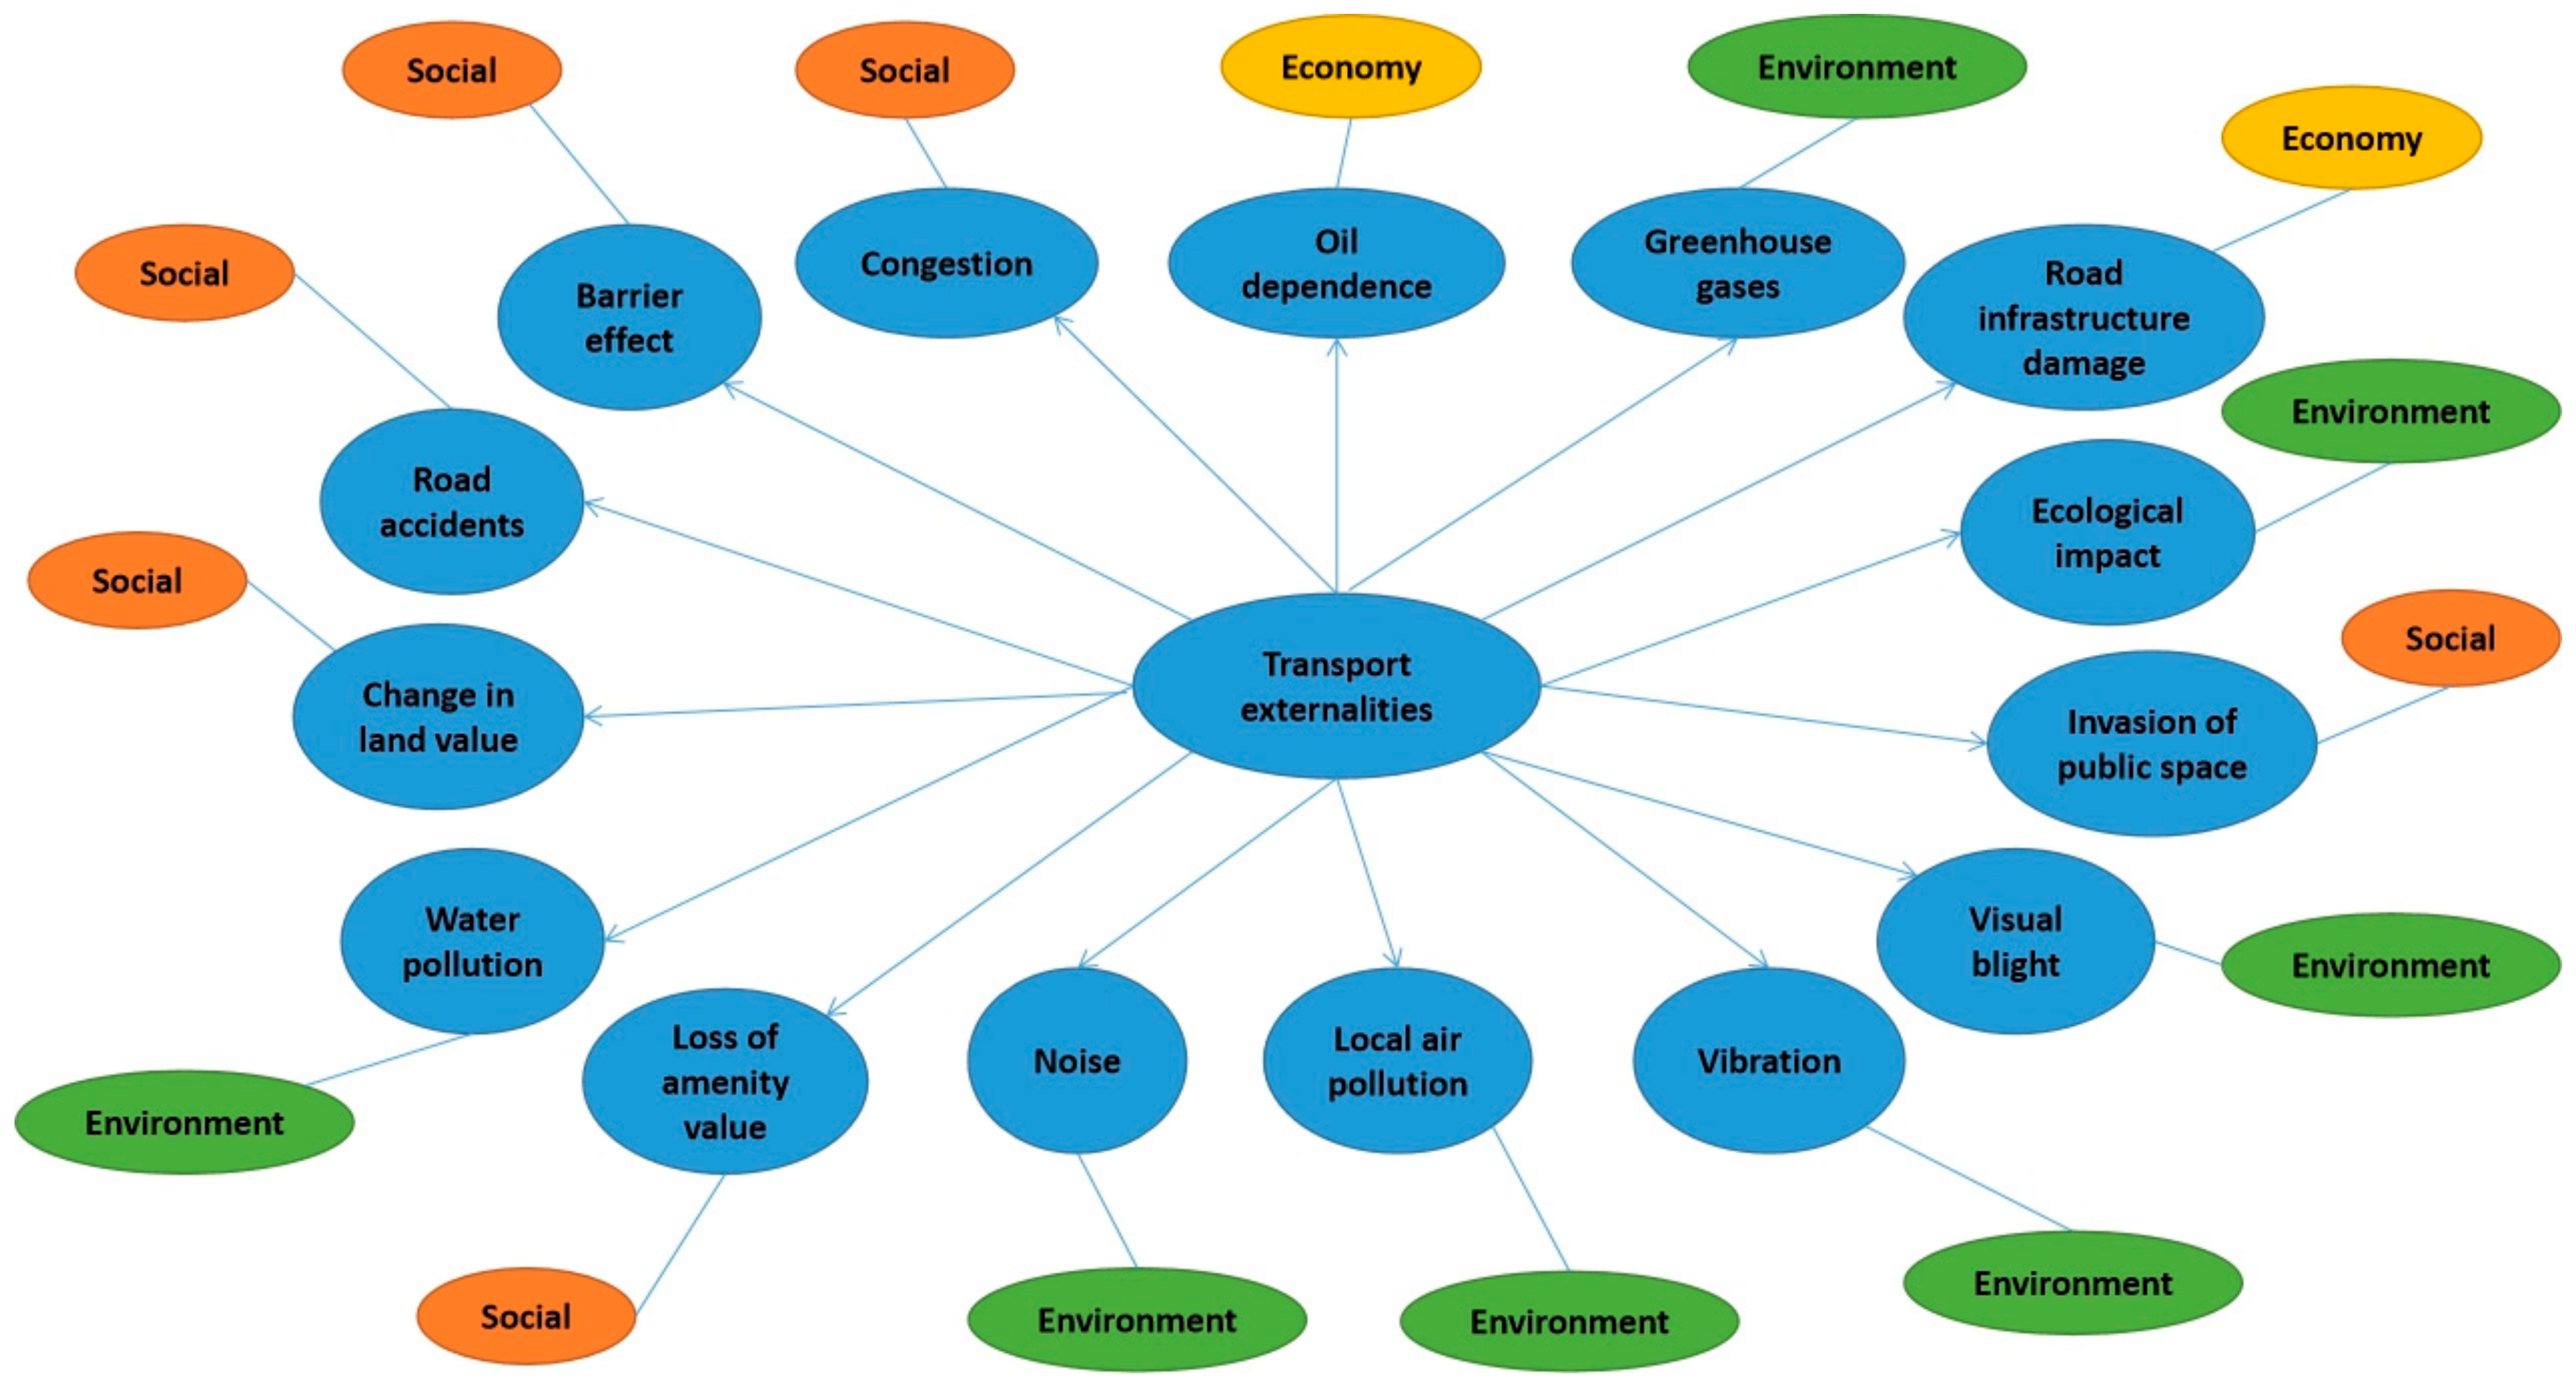
This phase considers the creation of a table (Table 5) including any of the identified variables associated to the negative externalities of transport that have been identified through the literature review as part of the system to strengthen the paradigm of sustainable mobility.

3.2.2. Phase 2: Description of the Relations among the Variables of the System

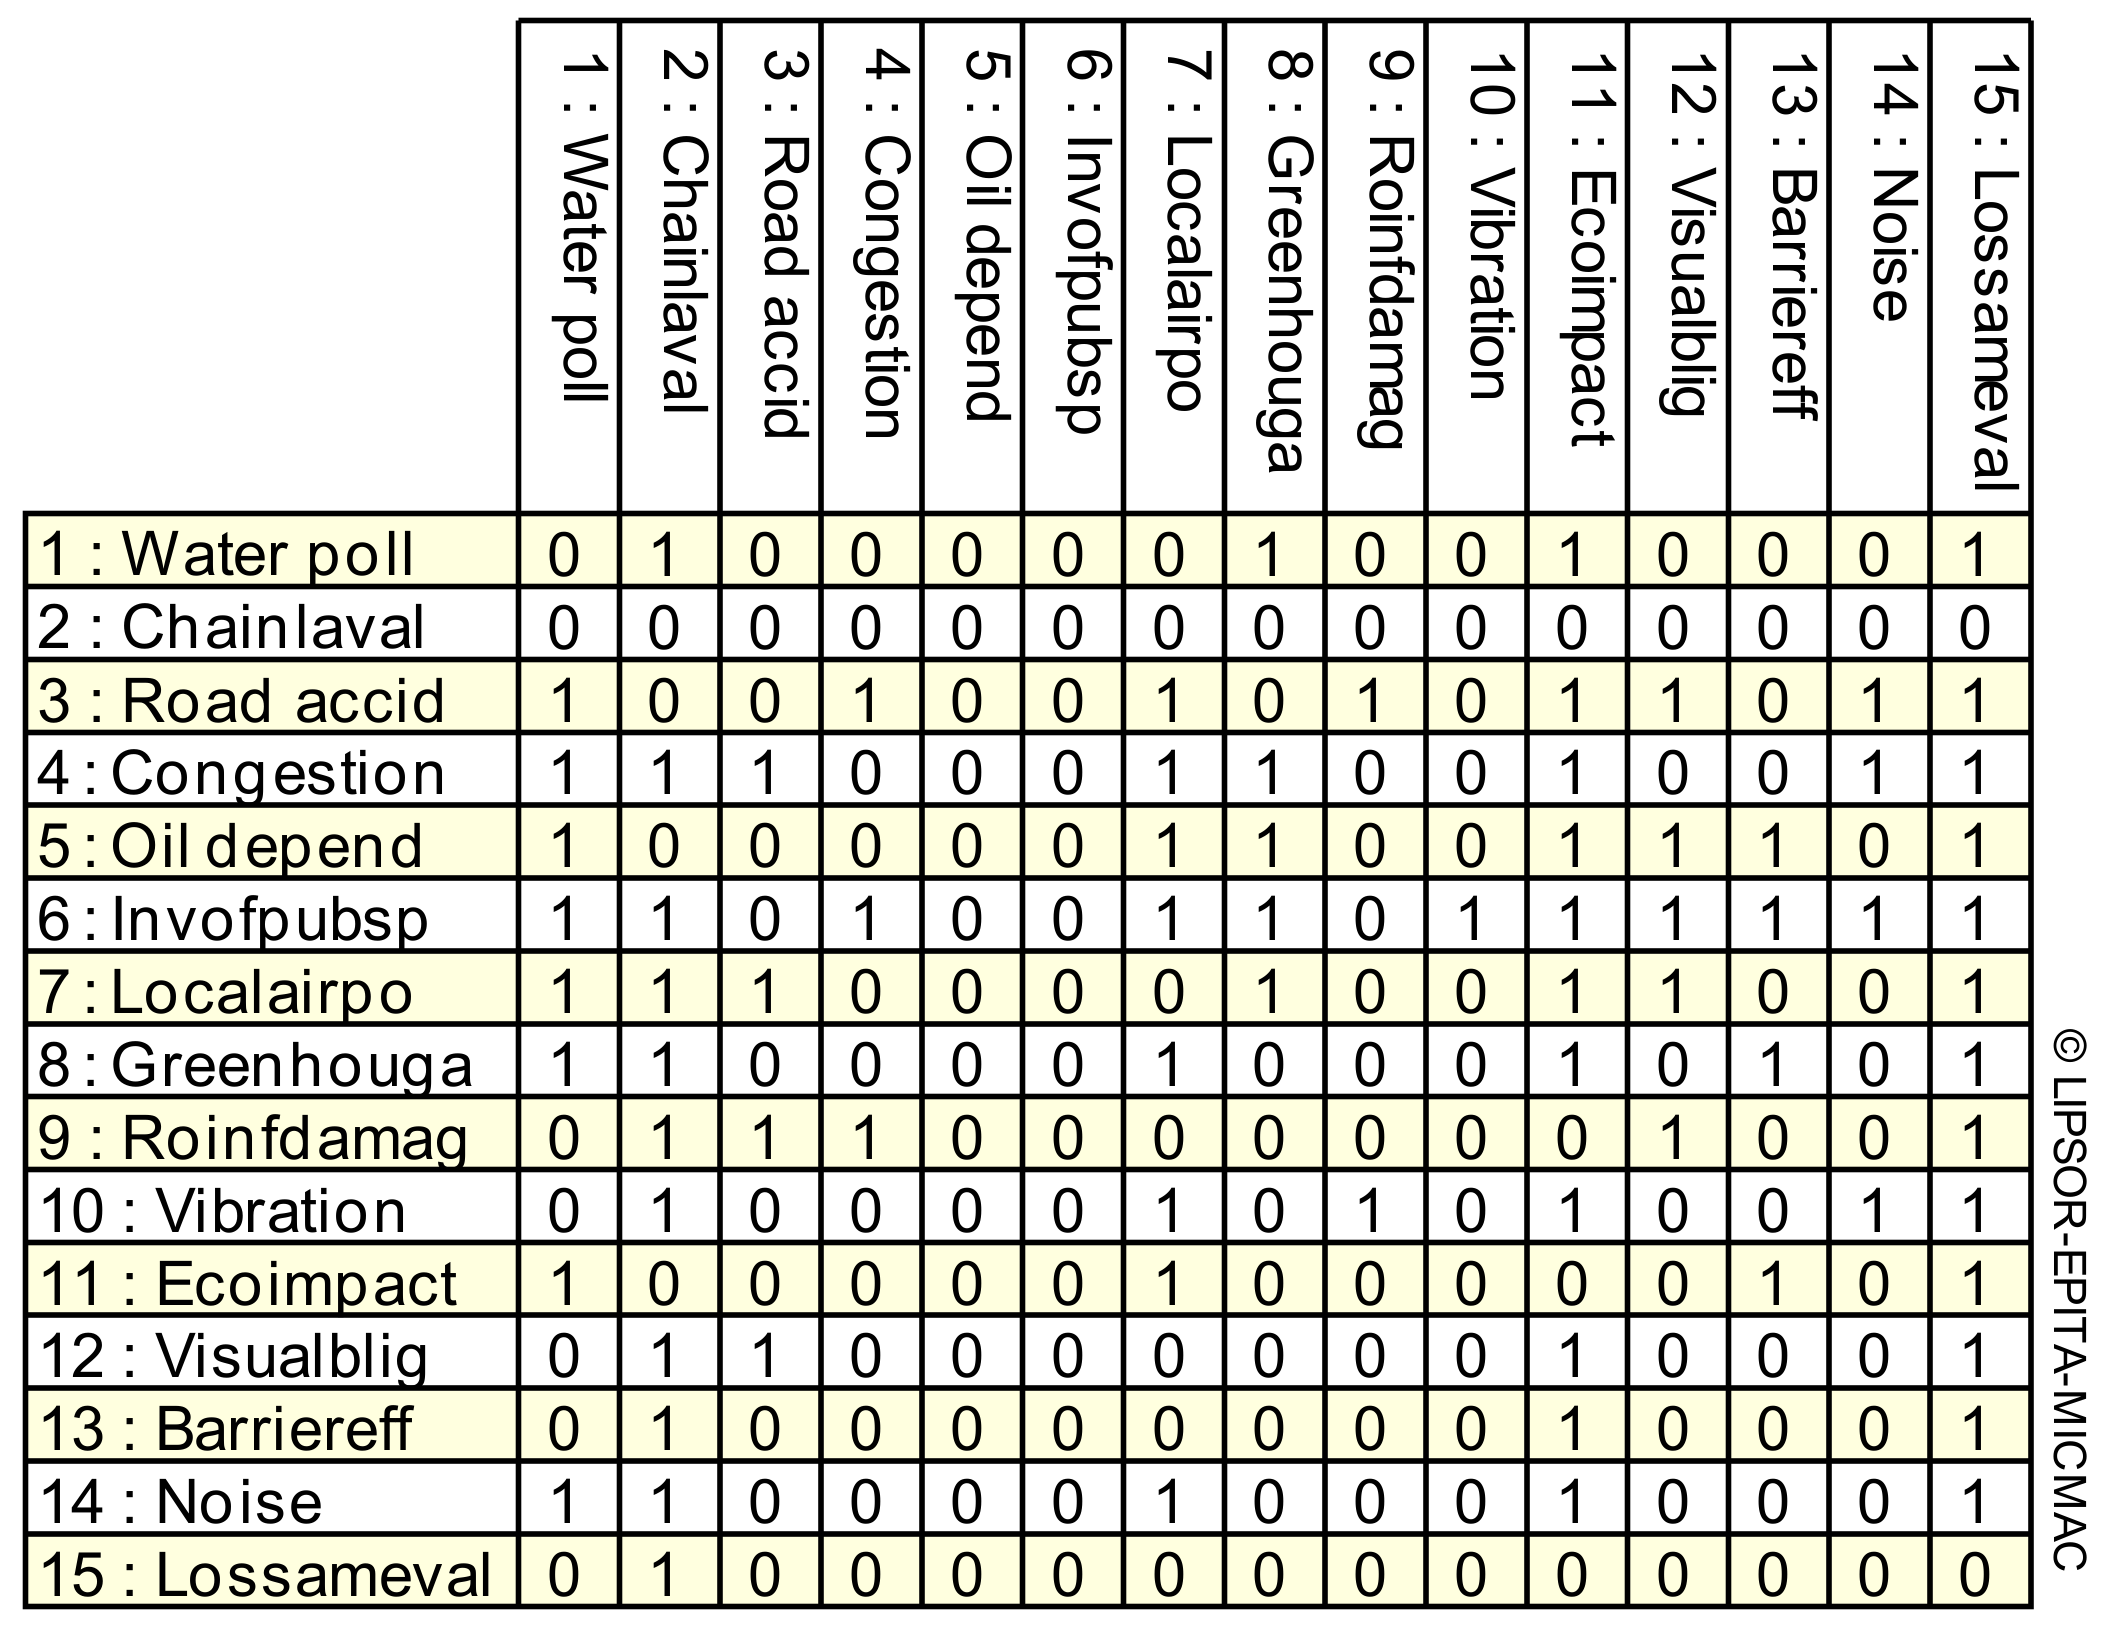
Phase 2 has as an objective the interconnection of the considered variables via a double entry matrix (Figure 3). The latter reveals at a row level the influence that a variable generates on any of the considered variables. Meanwhile, the matrix at a column level exposes the dependence that a particular variable experiences by the others [24]. In the application of classical structural analysis, every pair of variables needs to be evaluated in terms of interrelations. Hence, if between two variables there is no relation, it should be recorded as 0; otherwise, the relation is characterized as potential, strong, medium, or weak according to its nature [73]. However, in our case, for reasons of simplicity, we used only two values; zero (“0”) when there is no relationship and one (“1”) when there is a relationship between variables. Thus, the following matrix was produced:
The generation of the matrix of direct relations seen in Figure 3 would not have been possible without a consulting process with various (twelve) interdisciplinary and independent experts that helped us to identify relations between variables that at first were not obvious [75]. These sample size and group size choices were in line with the best practice literature [75]. The experts consulted are geographers, transport engineers, urban planners, experts in energy consumption, sustainable mobility-accessibility planners, and policy-makers within government agencies. The whole consulting process is described as follows:
Step 1. The matrix of direct influences was generated by the authors, without taking into account the opinion of the experts.
Step 2. The interdisciplinary group of experts was assembled, considering academic, decision-makers, professionals, and consultants.
Step 3. The first contact between the authors and the experts was established, where the necessity to explain even further the relations between the negative externalities of transport had been highlighted.
Step 4. The authors applied the criteria of Sussman in order to describe the basic characteristics of the relations between the negative externalities of transportation such as direction of influence, type of influence and detailed justification of influence.
Step 5. The second contact between the authors and the experts took place, where the need to create logical relations between the considered negative externalities of transport and public policies oriented towards sustainable mobility had been mentioned.
Step 6. The authors identified logical connections between the negative externalities of transport and public policies. In addition, logical interlinks between variables and strategies have been established.
Step 7. The third contact between the authors and the group of experts, where a consensus had been established between the experts in relation to the importance of the negative externalities of transport within a sustainable mobility framework.

3.2.3. Phase 3: Identification of Essential Variables and Key Factors

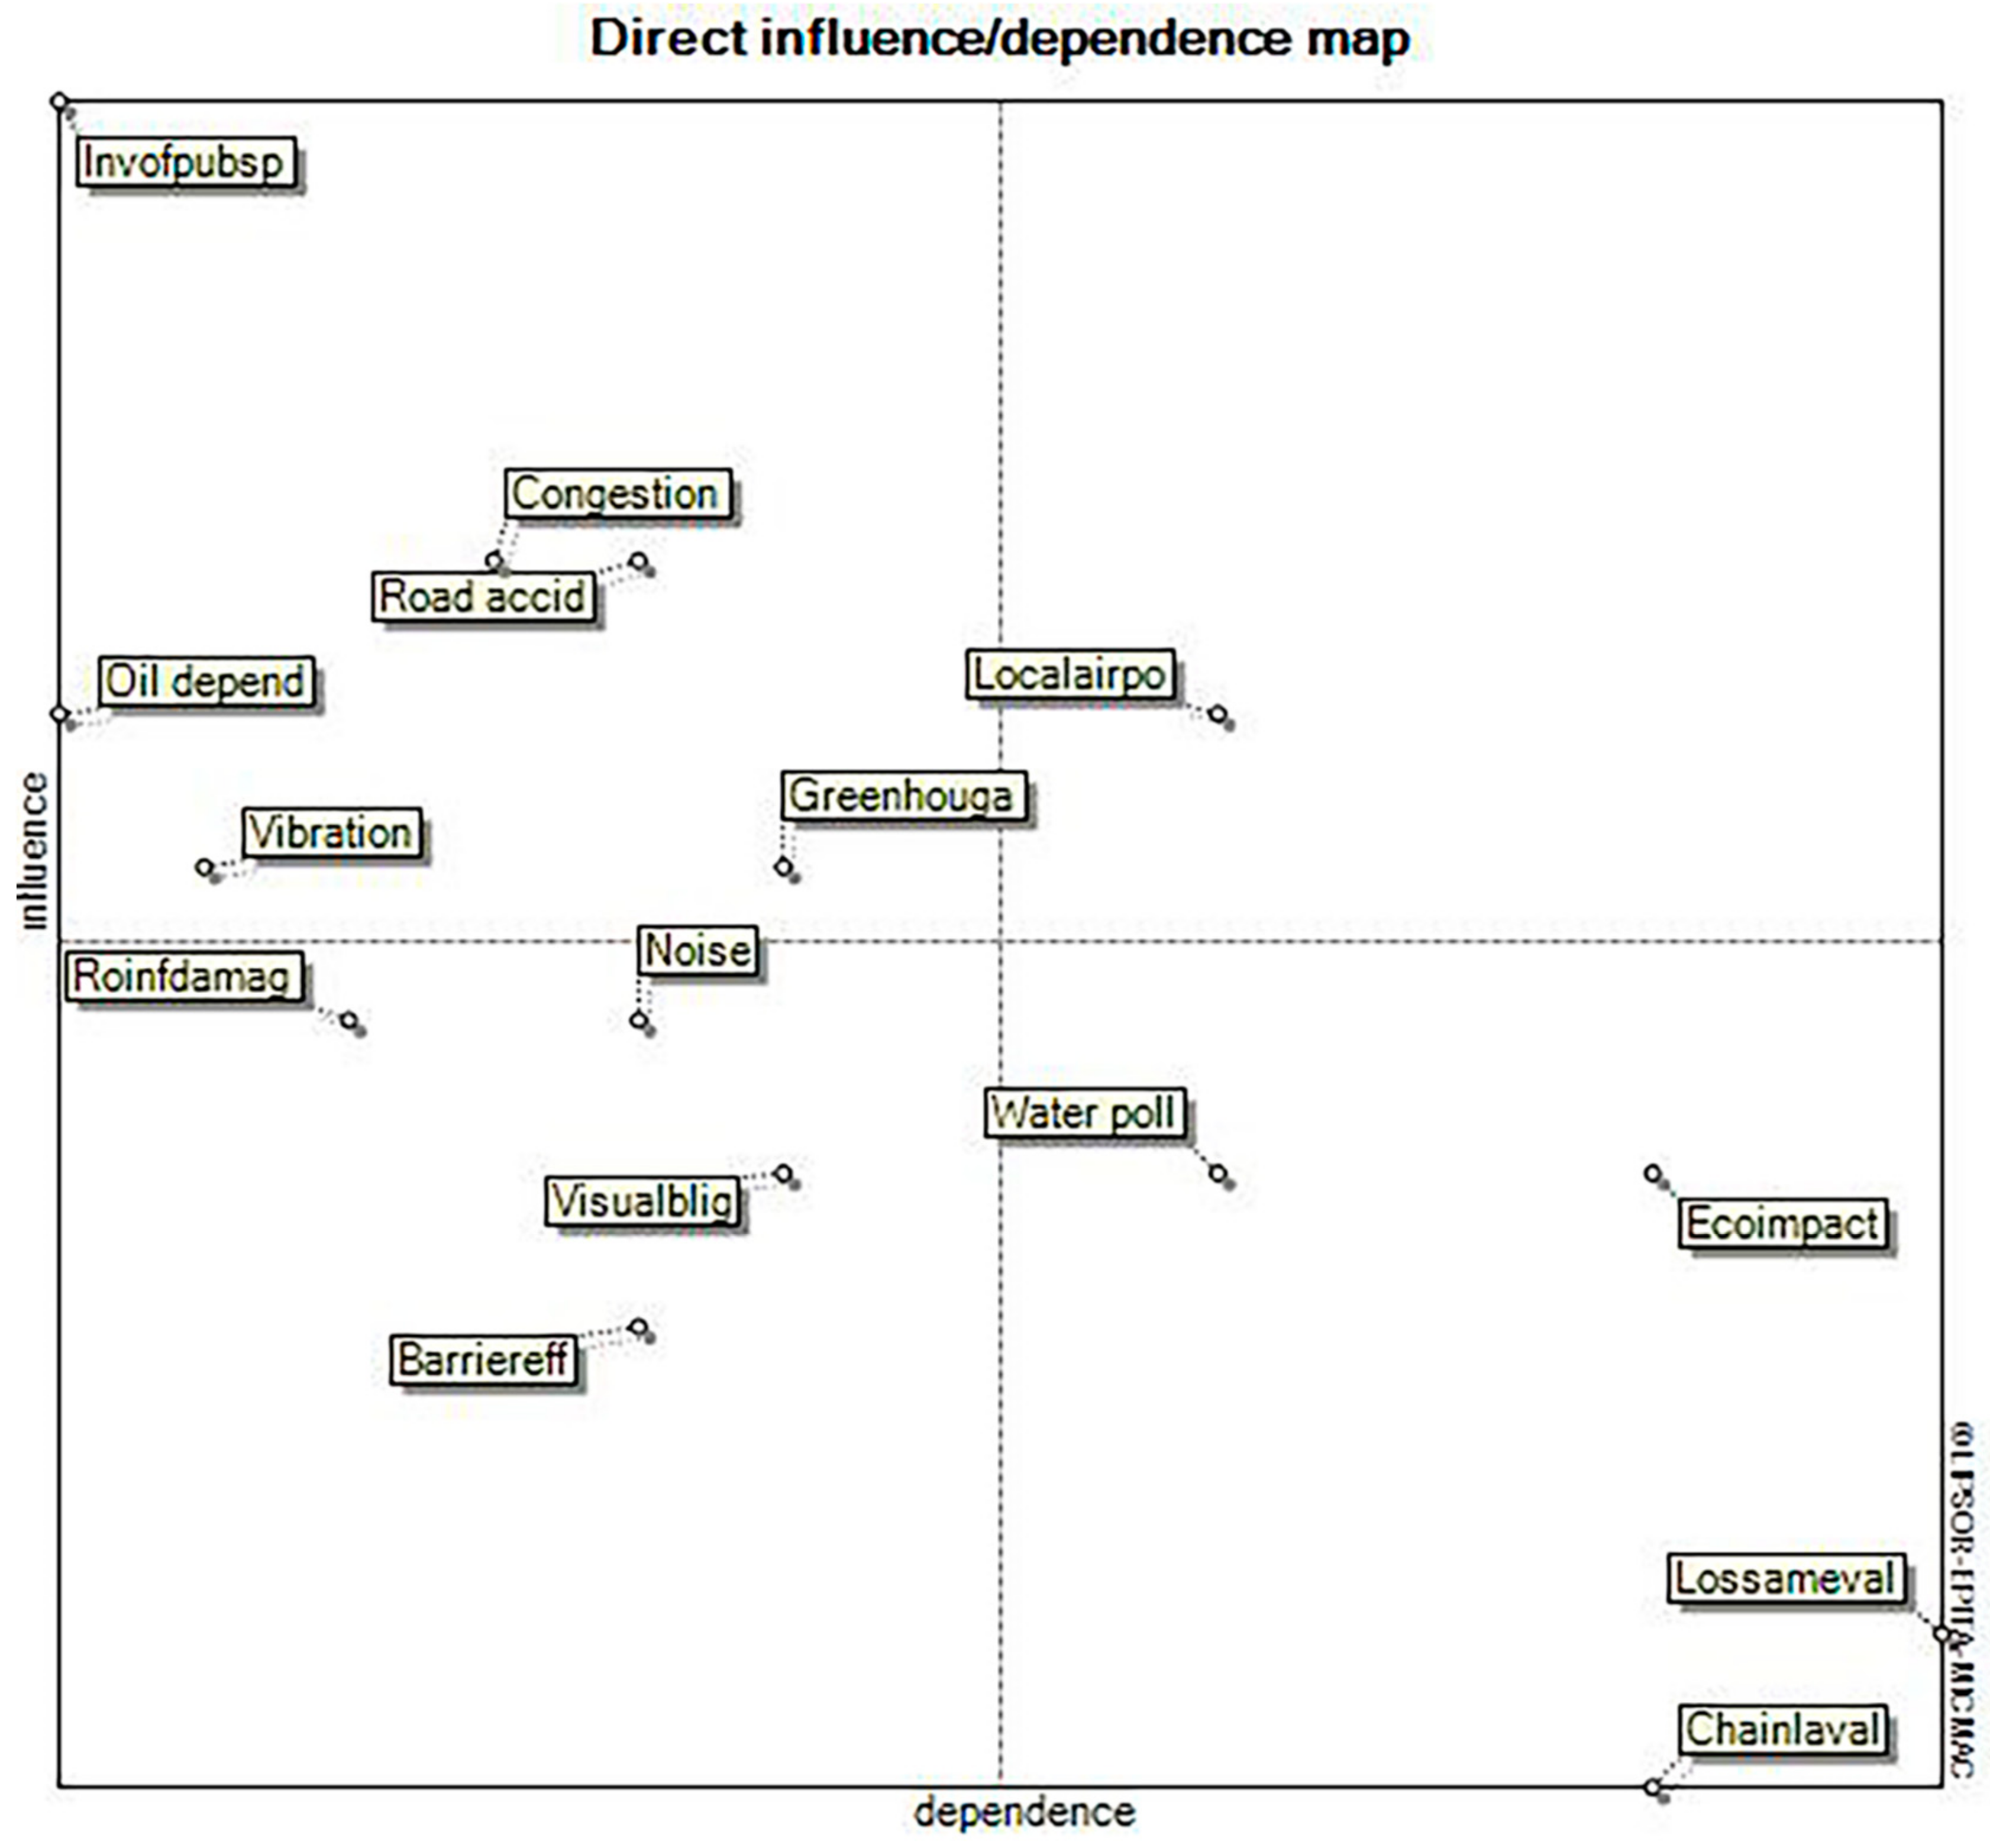
In this stage, variables of greater importance can be identified in terms of influence and dependence [77]. This can be achieved by calculating the direct connections between the variables as well as the indirect ones. For that purpose, the elements in each row and column were added. For example, the variable of water pollution generates an influence rate equal to 4 (Figure 3) because it affects four variables, while the same variable has a dependence rate equal to 6, as it is affected by six variables. We are able to generate a graphical representation of the above sums that locates and categorizes each variable in order of importance and according to the direct relationships between them (Figure 4). This map has two axes, where in X axis shows the dependence level and the Y axis the influence level. The maximum values of influence and dependence are the invasion of public space (Invpubsp) and loss of amenity value (Lossameval) whose sums are equal to 11 and 13, respectively.
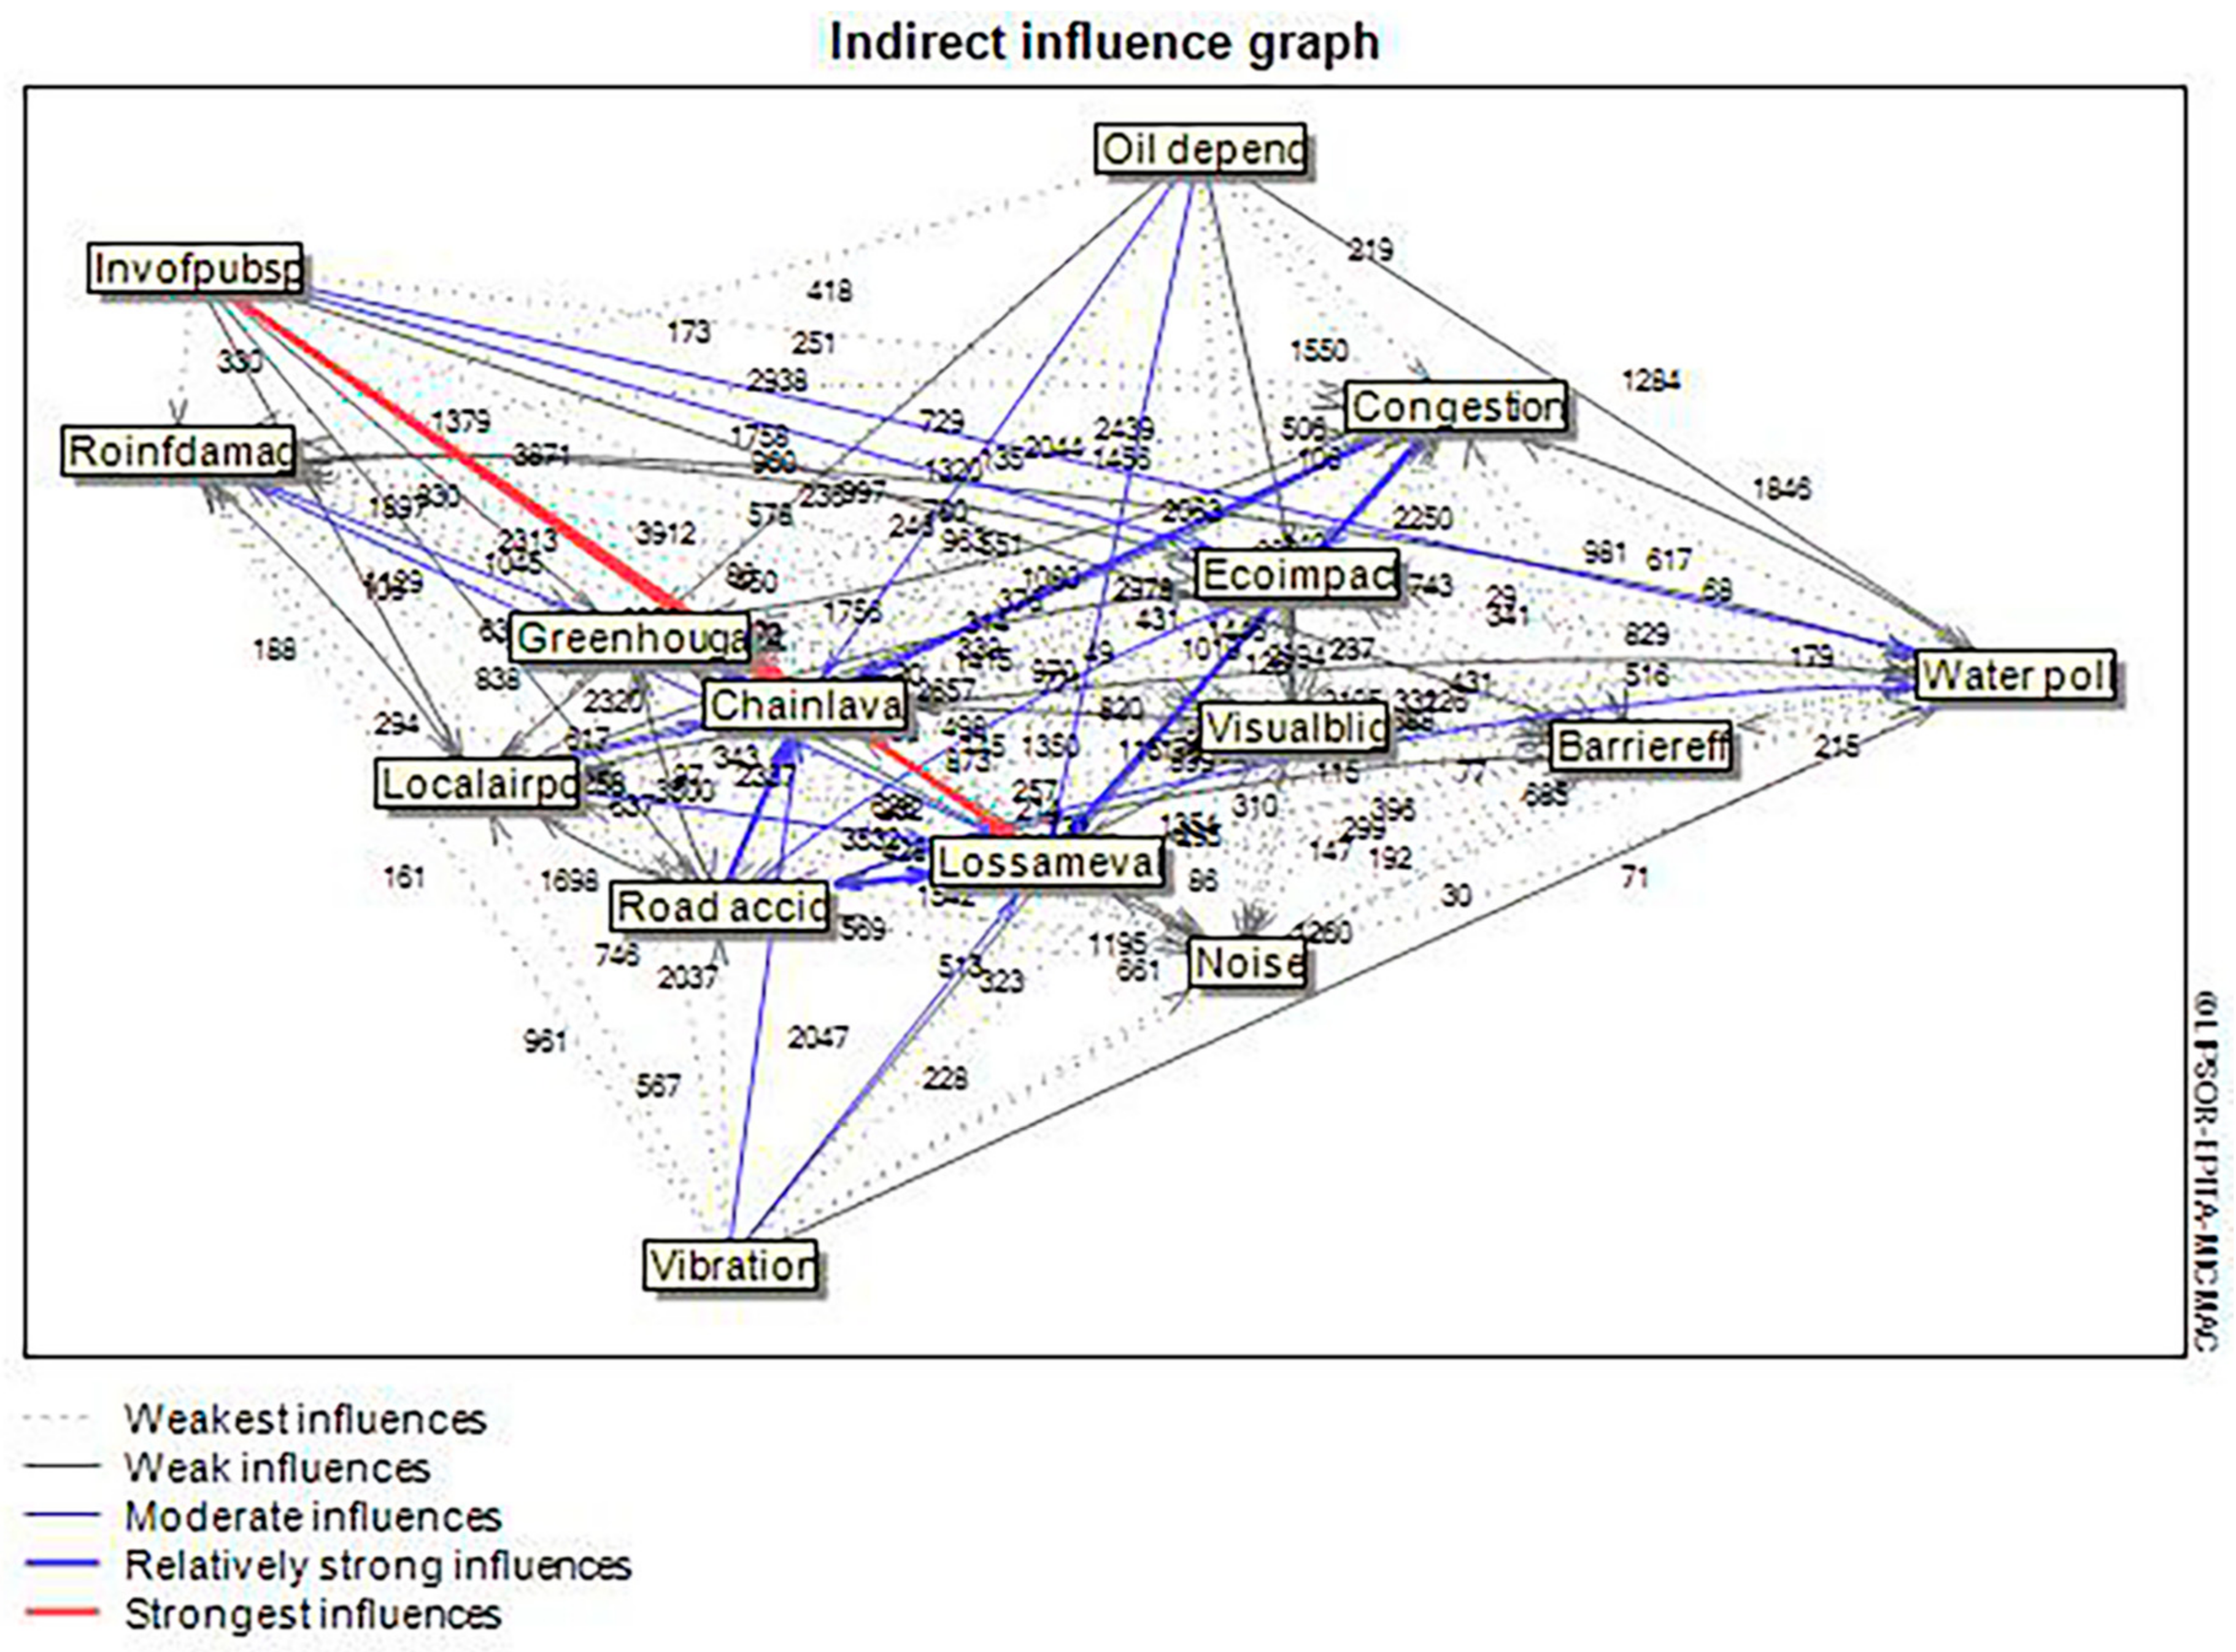
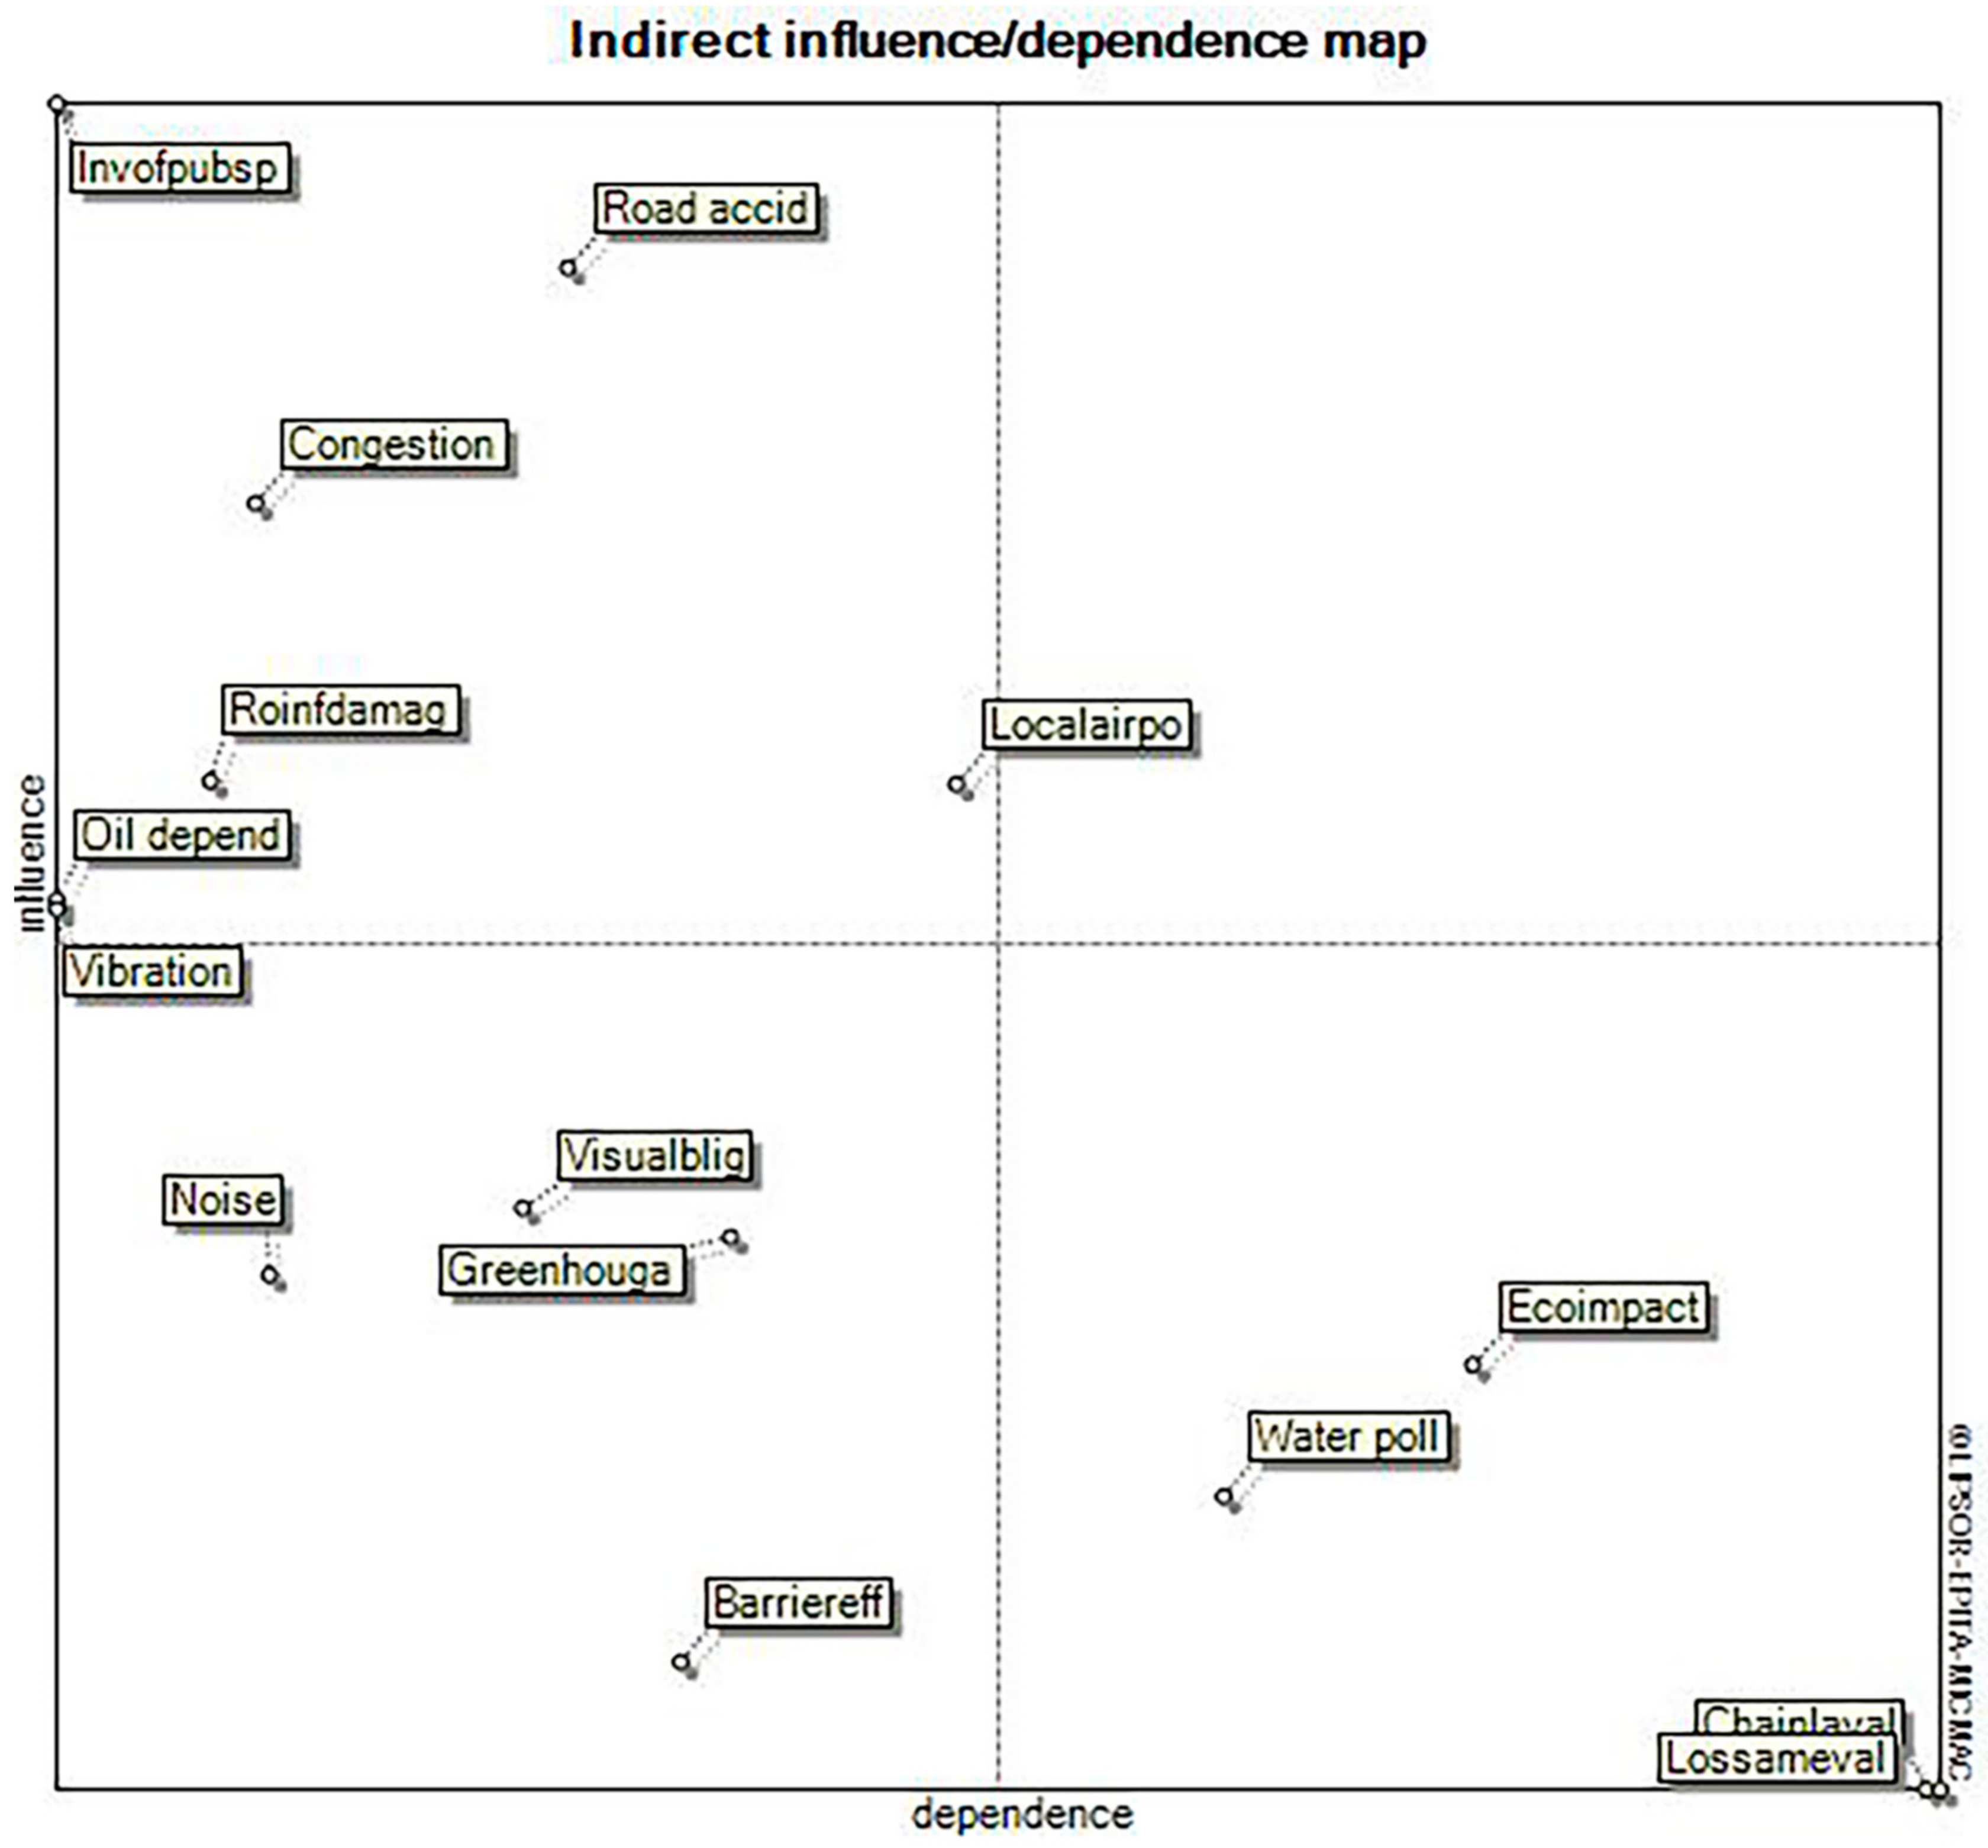
On the other hand, the indirect classification of variables is the result of elevating the matrix of direct relations to successive powers until its stabilization. The latter is achieved when the classification of variables both in terms of dependence and influence is constant between different power elevations. For instance, in our case the matrix stabilized after five elevations. This means that if we had continued elevating to the sixth, seventh, and eighth power the results and the classification of variables would remain unaffected.
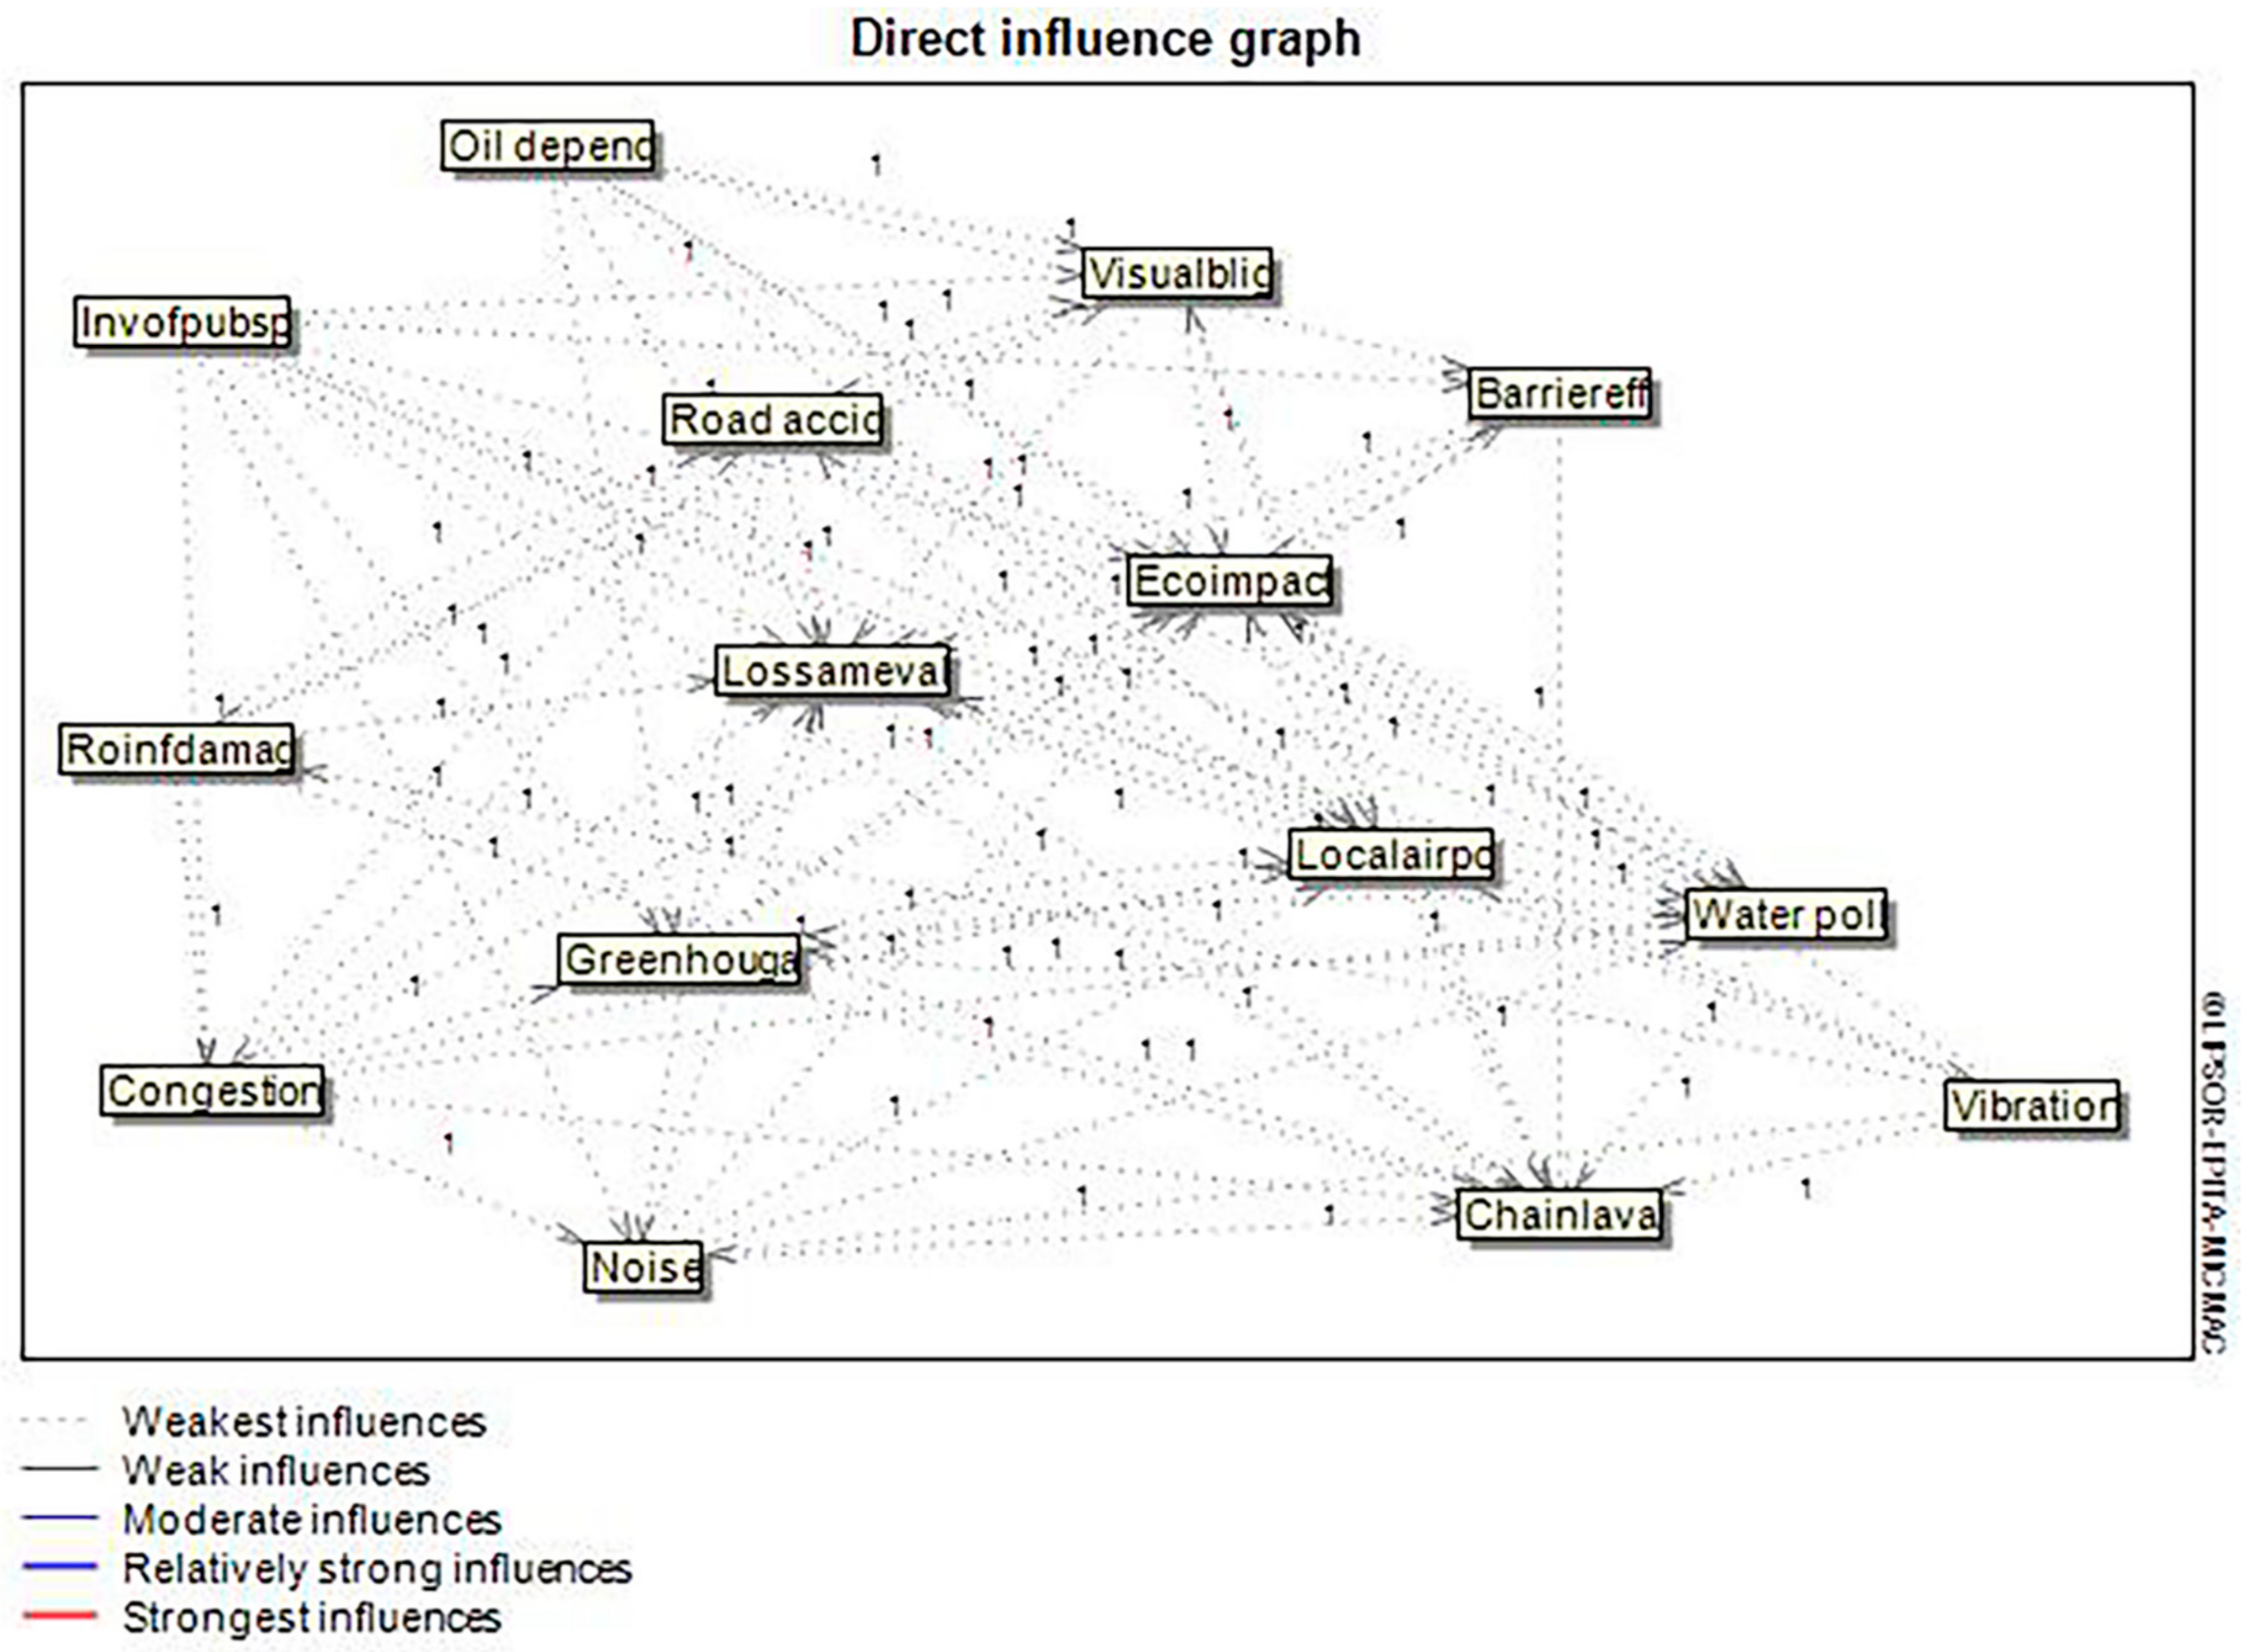
Figure 4 can be transformed into a network type diagram in Figure 5, that reveals the direct relationships among the variables considered for this study.
After the fifth elevation of the matrix of direct relationships (stabilization achieved) we have the graphical representation (Figure 6) that not only considers direct relationships but also the indirect among the negative externalities of transport. For this reason, it can be appreciated that several variables (local air pollution, infrastructure damage, and greenhouse gas) changed their sector location in comparison to the Figure 4. For its part, Figure 6 can also be transformed to a network type diagram where the connections between the negative externalities of transport along with their magnitude can be observed (Figure 7).

3.3. Justifications of the Relationships between the Negative Externalities of Transport

In this part of the paper, references coming from the open literature are added in every direct relationship to further support the opinion of the experts, concerning the influences that each one of the negative externalities generates upon the others (Table 6).

3.4. Results and Discussion

The method of structural analysis and the opinions of the experts consulted permitted the organization of the negative externalities of transport along with the strategies oriented towards sustainable mobility in order of importance. For economy of words and space, it was decided to present the results of the present study via Table 7.

4. Conclusions

Today, one of the most important matters that urban and suburban transport has to face is that of territorial ordering. The expansion of urban areas has resulted in a substantial boost in number and time of travels to the centre of the city, so that the people to reach health services and sources of employment and education. Hence, new housing projects are built on the outskirts of the city and the housing density within the city decreases so that new roads are built that only encourage the use of private cars. The latter is an important contributor to various negative externalities like traffic accidents, air pollution, noise, and climate change, which not only affect private car owners but all of the people who live in the urban-metropolitan centres.
That is why multidisciplinary long-term approaches that encourage transport and urban development integration should be adopted. Therefore, integral mobility plans should not emphasize the mitigation of a transport externality, but should try to incorporate all or at least some of the known negative externalities generated by transport and adopt integral mobility plans. Considering these facts, this study applied a MICMAC-structural analysis to the negative externalities of transport in order to organize them hierarchically via the identification of the relations between them to categorize several strategies oriented towards a sustainable environment according to their impact upon the negative externalities and the co-benefits that would be generated by their implementation for society.
The most important part of this study is the development of a network-type diagram containing the set of negative externalities generated by transportation activities that permits the identification of the most important elements and the type of connections between them (if a relation is influential or dependent). Therefore, the decision makers have the capacity to understand that the negative externalities of transport are not isolated phenomena; on the contrary, they are interlinked.
Our findings show that the most important negative externality in terms of influence and dependence upon the rest of the negative externalities established is the invasion of public places for road construction, followed by local air pollution, road accidents, congestion, vibration, road infrastructure damage, and oil dependence due to their high level of influence. The case of greenhouse gas is a particular one due to the fact that it is very close to being an influential factor for the overall behaviour of the system, therefore it must be treated accordingly and not be underestimated. The rest of the identified negative externalities of transport can be treated through the ones that heavily influence them.
However, the fact that negative externalities of transport such as the barrier effect, noise, and visual blight have been qualified as less important does not mean that they should be left aside within the urban planning process. They are truly important factors to be considered for the establishment of a sustainable environment, but they should be managed in a supplementary way along with the ones qualified as “critical” if we want to enhance their effectiveness.
Consequently, the most important strategies are the ones related to urban planning, as they tackle all of the determined transportation´s negative externalities, followed by the strategies related to alternative transportation modes (cycling, walking) and the ones associated with public transport. Once the aforementioned strategies are well established, it is preferable to continue with strategies oriented to the management of parking places and followed by strategies associated with private auto-mobiles such as vehicles circulation, efficient auto-mobile usage, and strategies focused on vehicles possession. In a supplementary manner, strategies focused on travel reduction can be adopted.
All of the abovementioned strategies should be part of an integrated long-term plan of mobility rather than partially implemented counter measures. However, cooperation and participation between the different actors involved within the urban planning process (transportation and urban design authorities, planning and public policy agents, and common people) is essential when it comes to the adoption of integrated and coherent sustainable mobility plans.
The next step to take into account is the mixture of structural analysis with quantitative and geospatial methodologies in order to evaluate mobility plans with their derived strategies and public policies and to be able to create global indexes that are capable of explaining to governmental agencies the quality of urban mobility in terms of accessibility and connectivity as they result via the coverage and functionality of urban transportation infrastructure within certain geographic areas by incorporating the perceptions of the people.

Author Contributions

Conceptualization, I.C.; Formal analysis, I.C. and L.A.-I.; Investigation, I.C., L.A.-I., E.B. and C.K.; Methodology, I.C.; Supervision, I.C.; Writing—original draft, I.C.; Writing—review & editing, L.A.-I., E.B., C.K. and L.C.-B. All authors have read and agreed to the published version of the manuscript.

Funding

This research received no external funding.

Acknowledgments

The first author specially acknowledges the support from DGAPA scholarship program.

Conflicts of Interest

The authors declare no conflict of interest.

References

  1. Dangond Gibsone, C.; Jolly, J.F.; Monteoliva Vilches, A.; Rojas Parra, F. Algunas reflexiones sobre la movilidad urbana en Colombia desde la perspectiva del desarrollo humano. Pap. Polít. Bogotá 2011, 16, 485–514. [Google Scholar]
  2. Ascher, F. Los Nuevos Principios del Urbanismo; Alianza: Madrid, Spain, 2004. [Google Scholar]
  3. Rojas, F. Mutaciones Urbanas. Memorias II Coloquio de Profesores de la Facultad de Ciencia Política y Relaciones Internacionales; Pontificia Universidad Javeriana: Bogota, Colombia, 2007. [Google Scholar]
  4. Petrakos, G.; Tsanos, E. Egnatia Odos and Regional Development: A theoretical and experimental study. Rev. Econ. Sci. 2008, 14, 127–160. [Google Scholar]
  5. Skayannis, P.; Kaparos, G. The infrastructure projects in Greece and the presence of Mega Transport Infrastructure Proects (MTIPs): Changing paradigms and priorities. Aeichoros 2013, 18, 13–65. [Google Scholar]
  6. Hanson, S.; Giuliano, G. (Eds.) The Geography of Urban Transportation, 3rd ed.; Guilford Press: New York, NY, USA, 2004. [Google Scholar]
  7. Rodrigue, J.P. The Geography of Transport Systems, 4th ed.; Routledge: New York, NY, USA, 2017. [Google Scholar]
  8. Vlastos, T.H.; Bakogiannis, E. Cities and Bicycles: A Network for Bicycles in Greek Cities; Onasis Foundation: Athens, Greece, 2017. [Google Scholar]
  9. Flores, I.; Chatziioannou, I.; Segura, E.; Hernández, S. Urban transport infrastructure: A state of the art. In Proceedings of the European modelling and simulation symposium, Athens, Greece, 25–27 September 2013; pp. 83–92. [Google Scholar]
  10. Calderon, C.; Chong, A. Labor market institutions and income inequality: An empirical exploration. Public Choice 2009, 138, 65–81. [Google Scholar] [CrossRef]
  11. Calderon, C.; Serven, L. Infrastructure and economic development in Sub-Saharan Africa. J. African Econ. 2010, 19, 13–87. [Google Scholar] [CrossRef]
  12. Estache, A.; Fay, M. Current Debates on Infrastructure Policies. (Working Paper 49 2009); Commission on Growth and Development: Washington DC, USA, 2009. [Google Scholar]
  13. Fan, S.; Zhang, X. Public expenditure, growth and poverty reduction in rural Uganda. Afr. Dev. Rev. 2008, 20, 466. [Google Scholar] [CrossRef]
  14. Khandker, S.R.; Bakht, Z.; Koolwal, G.B. The poverty impact of rural roads: Evidence from Bangladesh. Econ. Dev. Cult. Chang. 2009, 57, 685–722. [Google Scholar] [CrossRef] [Green Version]
  15. Melo, P.; Graham, D.; Brage-Ardao, R. The productivity of transport infrastructure investment: A meta-analysis of empirical evidence. Reg. Sci. Urban Econ. 2013, 43, 695–706. [Google Scholar] [CrossRef] [Green Version]
  16. Mu, R.; van de Walle, D. Rural Roads and Poor Area Development in Vietnam (World Bank Policy Research Working Paper 2007, No 4340); The World Bank: Washington, DC, USA.
  17. Schofer, J.L.; Mahmassani, H.S. (Eds.) Mobility 2050. A Vision for Transportation Infrastructure; The Transportation Center, Northwestern University: Evanston, IL, USA, 2016. [Google Scholar]
  18. Zhang, X. Transport infrastructure, spatial spillover and economic growth: Evidence from China. Front. Econ. China 2008, 3, 585–597. [Google Scholar] [CrossRef]
  19. Aschauer, D.A. Transportation Spending and Economic Growth: The Effects of Transit and Highway Expenditures; Report 1991; American Transit Association: Washington, DC, USA.
  20. Álvarez-Herranz, A.; Martínez-Ruiz, M.P. Evaluating the economic and regional impact on national transport and infrastructure policies with accessibility variables. Transport 2012, 27, 414–427. [Google Scholar] [CrossRef]
  21. Alminas, M.; Vasiliauskas, A.V.; Jakubauskas, G. The impact of transport on the competitiveness of national economy. Dep. Transp. Manag. 2009, 24, 93–99. [Google Scholar]
  22. Musolino, G.; Polimeni, A.; Vitetta, A. Freight vehicle routing with reliable link travel times: A method based on network fundamental diagram. Transp. Lett. 2016, 10, 159–171. [Google Scholar] [CrossRef]
  23. Van Wee, B. Land use and transport: Research and policy challenges. J. Transp. Geogr. 2002, 10, 259–271. [Google Scholar] [CrossRef]
  24. Romero Perea, A. Metodología Para la Jerarquización de Políticas de Transporte Urbano de Pasajeros Que Minimicen las Externalidades Negativas. Master’s Thesis, Universidad Nacional Autónoma de México, Mexico City, México, 2012. [Google Scholar]
  25. Santos, G.; Behrendt, H.; Maconi, L.; Shirvani, T.; Teytelboym, A. Part I: Externalities and economic policies in road transport. Res. Transp. Econ. 2010, 28, 2–45. [Google Scholar] [CrossRef]
  26. Bakogiannis, E.; Kyriakidis, C.; Siti, M.; Christopoulos, K. Issues on social and technical transition concerning the participatory planning process in the context of Sustainable Urban Mobility Plans. In Proceedings of the 11th International Conference of the Hellenic Geographical Society, Laurio, Greece, 12–15 April 2018. [Google Scholar]
  27. Skrúcaný, T.; Kendra, M.; Stopka, O.; Milojevic, S.; Figlus, T.; Csiszár, C. Impact of the Electric Mobility Implementation on the Greenhouse Gases Production in Central European Countries. Sustainability 2019, 11, 4948. [Google Scholar] [CrossRef] [Green Version]
  28. OMS. Available online: www.who.int/gho/en/ (accessed on 15 January 2012).
  29. World Health Organization. Road Traffic Injuries. Available online: https://www.who.int/news-room/fact-sheets/detail/road-traffic-injuries (accessed on 19 January 2020).
  30. Kyriakidis, C.; Bakogiannis, E.; Siolas, A. Identifying environmental affordances in Kypseli Square in Athens, Greece. In Proceedings of the 1st International Conference on Social Sciences, New York, NY, USA, 17–19 November 2017. [Google Scholar]
  31. Putnam, R. Bowling Alone: The Collapse and Revival of American Community; Simon & Schuster: New York, NY, USA, 2000. [Google Scholar]
  32. Hart, J. Driven to Excess: Impacts of Motor Vehicle Traffic on Residential Quality of Life in Bristol. Master’s Thesis, University of West England, Bristol, UK, 2008. [Google Scholar]
  33. Brundtland, G.H. Chairman’s Foreword in The World Commission on Environment and Development: Our Common Future; Oxford University Press: Oxford, UK, 1987. [Google Scholar]
  34. Eizenberg, E.; Jabareen, Y. Social Sustainability: A New Conceptual Framework. Sustainability 2017, 9, 68. [Google Scholar] [CrossRef] [Green Version]
  35. Avellaneda, P.; Lazo, A. Aproximación social al estudio de la movilidad cotidiana en la periferia pobre de la ciudad. Los casos de Juan Pablo II, en Lima, y de La Pintana, en Santiago de Chile. In Proceedings of the XV Congreso Latinoamericano de Transporte Público y Urbano, Buenos Aires, Argentina, 31 March–3 April 2009. [Google Scholar]
  36. Gutiérrez, A. Movilidad o inmovilidad: ¿Qué es la movilidad? Aprendiendo a delimitar los deseos. In Proceedings of the XV Congreso Latinoamericano de Transporte Público y Urbano, Buenos Aires, Argentina, 31 March–3 April 2009. [Google Scholar]
  37. Gutiérrez, A. Qué es la movilidad? Elementos para reconstruir las definiciones básicas del campo de transporte. Bitácora 2012, 21, 61–74. [Google Scholar]
  38. Hernández, D. Los desafíos del Transporte Público como canal de acceso al bienestar y mecanismo de integración social. El caso de Santiago de Chile. In Proceedings of the XV Congreso Latinoamericano de Transporte Público y Urbano, Buenos Aires, Argentina, 31 March–3 April 2009. [Google Scholar]
  39. Jara, M.; Carrasco, J.A. Indicadores de inclusión social, accesibilidad y movilidad: Experiencias desde la perspectiva del sistema de transporte. In Proceedings of the XV Congreso Latinoamericano de Transporte Público y Urbano, Buenos Aires, Argentina, 31 March–3 April 2009. [Google Scholar]
  40. Siolas, A.; Vassi, A.; Vlastos, T.h.; Kyriakidis, C.; Siti, M.; Bakogiannis, E. Methods, Applications and Tools of Urban Planning: From Theory to Practice; Kallipos Publications: Athens, Greece, 2015. [Google Scholar]
  41. Fasina, S.O.; Salisu, U.O.; Odufuwa, B.O.; Akanmu, A.A. Travel Behaviour and Mobility Challenges of Disabled Elderly in Selected Cities of Ogun State, Nigeria. LOGI–Sci. J. Transp. Logist. 2020, 11, 25–36. [Google Scholar] [CrossRef]
  42. Pratt, C. Estimation and valuation of environmental and social externalities for the transport sector. In Proceedings of the 25th Australasian Transport Research Forum. Incorporating the BTRE Transport Policy Colloquium, Canberra, Australia, 2–4 October 2002. [Google Scholar]
  43. Dobes, L. Externalities in the Transport Sector. Key issues. BTCE; information sheet 10.1; Bureau of Transport and Communications Economics: Canberra, Australia, 1998.
  44. Basner, M.; Babisch, W.; Davis, A.; Brink, M.; Clark, C.; Janssen, S.; Stansfeld, S. Auditory and non-auditory effects of noise on health. Lancet 2014, 383, 1325–1332. [Google Scholar] [CrossRef] [Green Version]
  45. Sarkan, B.; Stopka, O.; Gnap, J.; Caban, J. Investigation of exhaust emissions of vehicles with the spark ignition engine within emission control. Procedia Eng. 2017, 187, 775–782. [Google Scholar] [CrossRef]
  46. European Parliament Fact Sheets. Fact Sheet 4.9.6, Air Pollution, Prepared by Y. GOOSSENS and G. P. Menehini. 2006. Available online: http://www.europarl.europa.eu/facts/4_9_6_en.htm (accessed on 7 October 2016).
  47. Vo, P.T.; Ngo, H.H.; Guo, W.; Zhou, J.L.; Listowski, A.; Du, B.; Wei, Q.; Bui, X.T. Stormwater quality management in rail transportation—Past, present and future. Sci. Total Environ. 2015, 512, 353–363. [Google Scholar] [CrossRef] [PubMed]
  48. Levengood, J.M.; Heske, E.J.; Wilkins, P.M.; Scott, J.W. Polyaromatic hydrocarbons and elements in sediments associated with a suburban railway. Environ. Monit. Assess. 2015, 187, 1–12. [Google Scholar] [CrossRef] [PubMed]
  49. Van der Ree, R.; Jaeger, J.A.G.; van der Grift, E.A.; Clevenger, A.P. Effects of roads and traffic on wildlife populations and landscape function: Road ecology is moving towards larger scales. Ecol. Soc. 2011, 16, 48. [Google Scholar] [CrossRef]
  50. Varin, P.; Saarenketo, T. Effect of Axle and Tyre Configurations on Pavement Durability, a Pre-Study. ROADEX Network Report. Available online: http://www.roadex.org/wp-content/uploads/2014/01/ROADEX_Axle_Tyre_Prestudy_15102014-Final.pdf (accessed on 18 May 2020).
  51. Lefton, R.; Weiss, D. Oil Dependence Is a Dangerous Habit, Center for American Progress. 13 January 2019. Available online: http://www.americanprogress.org/issues/2010/01/oil_imports_security.html (accessed on 20 May 2020).
  52. Medina, S. Transformando la Movilidad Urbana en México. Hacia Ciudades Accesibles con Menor uso del Automóvil; ITDP: México City, Mexico, 2012. [Google Scholar]
  53. Institute for Transportation and Development Policy. Guía de Estrategias Para la Reducción del Uso del Auto en Ciudades Mexicanas; ITDP: México City, Mexico, 2012. [Google Scholar]
  54. Banister, D. The sustainable mobility paradigm. Transp. Policy 2008, 15, 73–80. [Google Scholar] [CrossRef]
  55. Park, Y.; Chen, N.; Akar, G. Who is Interested in Carpooling and Why: The Importance of Individual Characteristics, Role Preferences and Carpool Markets. Transp. Res. Rec. 2018, 2672, 708–718. [Google Scholar] [CrossRef]
  56. Daganzo, C.F.; Cassidy, M.J. Effects of high occupancy vehicle lanes on freeway congestion. Transp. Res. Part B Methodol. 2008, 42, 861–872. [Google Scholar] [CrossRef]
  57. Wappelhorst, S.; Mock, P.; Yang, Z. Using Vehicle Taxation Policy to Lower Transport Emissions. An Overview for Passenger Cars in Europe; ICCT: Berlin, Germany, 2018. [Google Scholar]
  58. Society of Motor Manufacturers and Traders. New car CO2 Report 2011: Driving down emissions. 2011. Available online: www.smmt.co.uk (accessed on 13 May 2019).
  59. Medina Ramírez, S.; Islas Cortés, I.; Fernández Ramírez, R.; Muñoz Alarcón, S. Propuesta de un Programa de Feebates Para México; Instituto Nacional de Ecología: Mexico City, Mexico, 2011.
  60. Fraire Cervantes, J.A. Utilización de un Modelo de Respuesta Dicotómica de Valoración Contingente Para Estimar el Tiempo de Retiro Socialmente Óptimo de un Vehículo en la ZMVM; Instituto Nacional de Ecología: Mexico City, Mexico, 2011.
  61. Litman, T. London Congestion Pricing. Implications for Other Cities; Victoria Transport Policy Institute: Victoria, BC, Canada, 2011. [Google Scholar]
  62. Federal Highway Administration, American Association of State Highway and Transportation Officials, the National Cooperative Highway Research Program. International scan: Reducing Congestion & Funding Transportation Using Road Pricing in Europe and Singapore. 2010. Available online: http://international.fhwa.dot.gov/pubs/roadpricing/roadpricing.pdf (accessed on 9 April 2020).
  63. Litman, T. Carbon Taxes: Tax What You Burn, not WHAT you Earn; Victoria Transport Policy Institute: Victoria, BC, Canada, 2011. [Google Scholar]
  64. Sumner, J.; Bird, L.; Smith, H. Carbon Taxes: A Review of Experience and Policy Design Considerations. Colorado: National Renewable Energy Laboratory. 24/11/2011. Available online: http://www.nrel.gov/docs/fy10osti/47312.pdf (accessed on 29 March 2020).
  65. ITDP. Planes Integrales de Movilidad; ITDP: Mexico City, Mexico, 2012. [Google Scholar]
  66. Litman, T. Parking Management: Strategies, Evaluation and Planning; Victoria Transport Policy Institute: Victoria, BC, Canada, 2011. [Google Scholar]
  67. Sohoni, A.V.; Thomas, M.; Rao, K.V.K. Application of the Concept of Transit Oriented Development to a Suburban Neighborhood. Transp. Res. Procedia 2017, 25, 3220–3232. [Google Scholar] [CrossRef]
  68. Arrazola, V. Barcelona Alega Que su Zona 30 Reduce Accidentes. Diario ABC, 2011. 12/01/2012. Available online: http://www.abc.es/20110202/local-cataluna/abci-barcelona-presume-zona-dias-201102021826.html (accessed on 12 May 2020).
  69. Gobierno de Distrito Federal. Corredor Peatonal Madero: Ícono del Espacio Público. 2011. Available online: http://www.df.gob.mx/index.php/noticias-df/406-corredor-peatonal-madero-icono-del-espacio-publico (accessed on 18 December 2019).
  70. Wright, L.; Hook, W. (Eds.) Bus Rapid Transit Planning Guide; ITDP: New York, NY, USA, 2007. [Google Scholar]
  71. Litman, T. Rail Transit in America: A Comprehensive Evaluation of Benefits; Victoria Transport Policy Institute: Victoria, BC, Canada, 2012. [Google Scholar]
  72. Litman, T. Economic Value of Walkability; Victoria Transport Policy Institute: Victoria, BC, Canada, 2011. [Google Scholar]
  73. Ballesteros Riveros, D.P.; Ballesteros Silva, P.P. Análisis estructural prospectivo aplicado al sistema logístico. Sci. Tech. Año XIV 2008, 39, 194–199. [Google Scholar]
  74. Chatziioannou, I.; Alvarez-Icaza, L. A structural analysis method for the management of urban transportation infrastructure and its urban surroundings. Cogent Eng. 2017, 4, 1326548. [Google Scholar] [CrossRef]
  75. Chatziioannou, I.; Alvarez-Icaza, L.; Bakogiannis, E. A structural analysis method for the promotion of Mexico City’s integral plan of mobility. Cogent Eng. 2020, 7, 1759395. [Google Scholar] [CrossRef]
  76. Khan, U.; Haleem, A. Smart organisations: Modelling of enablers using an integrated ISM and fuzzy-MICMAC approach. Int. J. Intell. Enterp. 2012, 1, 248–269. [Google Scholar] [CrossRef]
  77. Colodni, L. Construcción de la Base de Escenarios del Modelo MEDEE-S, Aplicación al Transporte de Caracas; Universidad Simón Bolivar: Venezuela, Caracas, 1987. [Google Scholar]
  78. Nicholls, S.; Crompton, J. A comprehensive review of the evidence of the impact of surface water quality on property values. Sustainability 2018, 10, 500. [Google Scholar] [CrossRef] [Green Version]
  79. Guignet, D.B.; Walsh, P.J.; Northcutt, R. Impacts of ground water contamination on property values: Agricultural run-off and private wells. Agric. Resour. Econ. Rev. 2016, 45, 293–318. [Google Scholar] [CrossRef] [Green Version]
  80. Sunda, W.G.; Cai, W.J. Eutrophication induced CO2-acidification of subsurface coastal waters: Interactive effects of temperature, salinity, and atmospheric P-CO2. Environ. Sci. Technol. 2012, 46, 10651–10659. [Google Scholar] [CrossRef] [PubMed]
  81. Denchak, M. Water Pollution: Everything You Need to Know. NRDC Publications. 2018. Available online: https://www.nrdc.org/stories/water-pollution-everything-you-need-know (accessed on 5 February 2020).
  82. Chen, W.Y.; Li, X.; Hua, J. Environmental amenities of urban rivers and residential property values: A global meta-analysis. Sci. Total Environ. 2019, 693, 133628. [Google Scholar] [CrossRef]
  83. Olofsson, B.; Rasul, H.; Lundmark, A. Spread of Water-Borne Pollutants at Traffic Accidents on Roads. Water Air Soil. Pollut. 2017, 228, 323. [Google Scholar] [CrossRef] [Green Version]
  84. Pasidis, I. Urban transport externalities. Ph.D. Thesis, University of Barcelona, Barcelona, Spain, 2017. [Google Scholar]
  85. Blue and Green Tomorrow. Available online: https://blueandgreentomorrow.com/environment/traffic-accidents-harm-environment/ (accessed on 20 December 2019).
  86. Bharadwaj, S.; Ballare, S.; Chandel, M.K. Impact of congestion on greenhouse gas emissions for road transport in Mumbai metropolitan region. Transp. Res. Procedia 2017, 25, 3542–3555. [Google Scholar] [CrossRef]
  87. Kellner, F. Exploring the impact of traffic congestion on CO2 emissions in freight distribution networks. Logist. Res. 2016, 9, 21. [Google Scholar] [CrossRef] [Green Version]
  88. Levkovich, O.; Rouwendal, J.; van Marwijk, R. The effects of highway development on housing prices. Transportation 2016, 43, 379–405. [Google Scholar] [CrossRef] [Green Version]
  89. Hou, Y. Traffic congestion, accessibility to employment, and housing prices: A study of single-family housing market in Los Angeles County. Urban Stud. 2017, 54, 3423–3445. [Google Scholar] [CrossRef]
  90. National Research Council. Oil in the Sea III: Inputs, Fates, and Effects; National Academy Press: Washington, DC, USA, 2002. [Google Scholar]
  91. Barth, M.; Boriboonsomsin, K. Energy and emissions impacts of a freeway-based dynamic eco-driving system. Transp. Res. Part D 2009, 14, 400–410. [Google Scholar] [CrossRef]
  92. Matz, C.J.; Egyed, M.; Hocking, R.; Seenundun, S.; Charman, N.; Edmonds, N. Human health effects of traffic-related air pollution (TRAP): A scoping review protocol. Syst. Rev. 2019, 8, 223. [Google Scholar] [CrossRef] [PubMed] [Green Version]
  93. Whangarei District Council. Available online: http://www.wdc.govt.nz/PlansPoliciesandBylaws/Plans/DistrictPlan/Pages/default.aspx#Expand (accessed on 19 December 2019).
  94. Norwegian Environment Agency. Available online: https://www.environment.no/Topics/Air-pollution/Local-air-pollution/ (accessed on 19 December 2019).
  95. Mardones, C.; Cabello, M. Effectiveness of local air pollution and GHG taxes: The case of Chilean industrial sources. Energy Econ. 2019, 83, 491–500. [Google Scholar] [CrossRef]
  96. Environmental Conscience. Available online: https://environmental-conscience.com/visual-pollution-causes-effects-solutions/ (accessed on 6 June 2020).
  97. Sager, L. Estimating the Effect of Air Pollution on Road Safety Using Atmospheric Temperature Inversions. J. Environ. Econ. Manag. 2019, 98, 1–20. [Google Scholar]
  98. Nunez, C. Available online: https://www.nationalgeographic.com/environment/global-warming/greenhouse-gases/ (accessed on 17 December 2019).
  99. Intergovernmental Panel on Climate Change. In Climate Change 2014: Synthesis Report. Contribution of Working Groups I, II and III to the Fifth Assessment Report of the Intergovernmental Panel on Climate Change; Core Writing Team; Pachauri, R.K.; Meyer, L.A. (Eds.) IPCC: Geneva, Switzerland, 2014. [Google Scholar]
  100. Hoegh-Guldberg, O. Climate change, coral bleaching and the future of the world’s coral reefs. Mar. Freshw. Res. 1999, 50, 839–866. [Google Scholar] [CrossRef] [Green Version]
  101. Balling, R.C. Impact of desertification on regional and global warming. Bull. Am. Meteorol. Soc. 1991, 72, 232–234. [Google Scholar]
  102. Hasegawa, T.; Fujimori, S.; Havlík, P.; Valin, H. Risk of increased food insecurity under stringent global climate change mitigation policy. Nat. Clim. Chang. 2018, 8, 699–703. [Google Scholar] [CrossRef] [Green Version]
  103. Kamal-Chaoui, L.; Alexis, R. (Eds.) Competitive Cities and Climate Change, OECD Regional Development Working Paper No 2; OECD Publishing: Paris, France, 2009; p. 172. [Google Scholar]
  104. McMichael, A.J.; Campbell-Lendrum, D.H.; Corvalán, C.F.; Ebi, K.L.; Githeko, A.; Scheraga, J.D.; Woodward, A. Climate Change and Human Health RISKS and RESPONSES; WHO Publishing: Geneva, Switzerland, 2003; p. 322. ISBN 92-4-156248-X. [Google Scholar]
  105. Luber, G.; Prudent, N. Climate Change and Human Health. Trans. Am. Clin. Climatol. Assoc. 2009, 120, 113–117. [Google Scholar]
  106. International Organization for Migration. Migration and Climate Change; International Organization for Migration: Grand-Saconnex, Switzerland, 2008; ISSN 1607-338X. [Google Scholar]
  107. Fares, H.; Shahata, K.; Elwakil, E.; Eweda, A.; Zayed, T.; Abdelrahman, M.; Bash, I. Modelling the performance of pavement marking in cold weather conditions. Struct. Infrastruct. Eng. 2012, 8, 1067–1079. [Google Scholar] [CrossRef]
  108. Kumar, P.; Gupta, A. Case studies on Failure of Bitumious Pavements. In Proceedings of the 1st International Conference on Pavement Preservation, University of California, Berkeley Institute of Transportation Studies, Berkeley, CA, USA, 13–15 April 2010. [Google Scholar]
  109. Schiappa de Azevedo, F.; Patricio, J. Annoyance and Damage in Buildings Caused by Vibrations. Considerations for a Vibration Control Good Practice. Acústica 2004, 9, 2004. [Google Scholar]
  110. Korzeb, J.; Chudzikiewicz, A. Evaluation of the vibration impacts in the transport infrastructure environment. Arch. Appl. Mech. 2015, 85, 1331–1342. [Google Scholar] [CrossRef] [Green Version]
  111. Silva Lucas, P.; Gomes Carvalho, R.; Grilo, C. Railway Disturbances on Wildlife: Types, Effects, and Mitigation Measures. In Railway Ecology; Springer: Cham, Switzerland, 2017. [Google Scholar]
  112. United Nations. Glossary of Environment Statistics, Studies in Methods; Series F, No. 67; United Nations: New York, NY, USA, 1997. [Google Scholar]
  113. European Environment Agency. The European Environment—State and Outlook 2010: Synthesis; European Environment Agency: Copenhagen, Denmark, 2010. [Google Scholar]
  114. Disberry, W.; Gibson, A.; Inkpen, R.; Whitworth, M.; Dashwood, C.; Winter, M. The impact (blight) on house value caused by urban landslides in England and Wales. In Workshop on World Landslide Forum; Springer: Berlin, Germany, 2017. [Google Scholar]
  115. Kellett, J. The Environmental Impact of Wind Energy Developments. Town Plann. 1990, 61, 139. [Google Scholar] [CrossRef]
  116. Kitano, M.; Shiraki, S. Estimation of Bird Fatalities at Wind Farms with Complex Topography and Vegetation in Hokkaido, Japan. Wildlife Soc. Bull. 2013, 37, 41. [Google Scholar] [CrossRef]
  117. Smallwood, K.S. Comparing Bird and Bat Fatality-Rate Estimates Among North American Wind-Energy Projects. Wildlife Soc. Bull. 2013, 37, 19. [Google Scholar] [CrossRef]
  118. Los Angeles Public Works. Available online: https://streetsla.lacity.org/illegal-signs-and-public-safety (accessed on 6 July 2020).
  119. Habib, L.; Bayne, E.M.; Boutin, S. Chronic industrial noise affects pairing success and age structure of ovenbirds Seiurus aurocapilla. J. Appl. Ecol. 2007, 44, 176–184. [Google Scholar] [CrossRef]
  120. Francis, C.D.; Barber, J.R. A framework for understanding noise impacts on wildlife: An urgent conservation priority. Front. Ecol. Environ. 2013, 11, 305–313. [Google Scholar] [CrossRef] [Green Version]
  121. Peng, C.; Zhao, X.; Liu, G. Noise in the sea and its impacts on marine organisms. Int. J. Environ. Res. Public Health 2015, 12, 12304–12323. [Google Scholar] [CrossRef] [Green Version]
Figure 1. The negative externalities of transport.
Sustainability 12 06011 g001
Figure 2. The evolution of the paradigms of urban mobility. Adapted from [52].
Sustainability 12 06011 g002
Figure 3. Matrix of direct influences and dependencies.
Sustainability 12 06011 g003
Figure 4. The location of variables as they result from the matrix of direct influences-dependencies.
Sustainability 12 06011 g004
Figure 5. A network type diagram of the direct relationships among the negative externalities of transport.
Sustainability 12 06011 g005
Figure 6. The location of variables as they result from the matrix of indirect influences-dependencies.
Sustainability 12 06011 g006
Figure 7. A network type diagram of the indirect relationships among the negative externalities of transport.
Sustainability 12 06011 g007
Table 1. Strategies oriented to the reduction of auto-mobile dependence and efficient auto-mobile usage.
Strategies Oriented to Efficient Auto-mobile Usage
IDPublic PoliciesPolicy DefinitionBased InstrumentImpactsAffected Negative Externalities
1Car-pooling [55].Two or more people regularly share a car to get to the same destination. This is usually driven within formal and secure schemes established within companies, educational institutions or governmental bodies.Planning-Economic
-
Reduces car usage (1,2).
-
Reduces congestion (1,2).
-
Reduces travel times (1).
-
Reduces emissions (1,2).
-
Promotes sustainable modes (1).
-
Promotes social interactions (1).
-
Improves the image of companies (1).
-
Improves productivity and employees satisfaction (1).
-
Reduces companies costs (1).
-
Promotes efficient land use (2).
-
Promotes car-pooling (2).
-
Soil & Water pollution (1,2).
-
Air Pollution (1,2).
-
Green House Gases (1,2).
-
Ecological Impact (1,2).
-
Congestion (1,2).
-
Loss of amenity value (1,2).
2High occupancy vehicle lanes [56].Sections of fast lanes or avenues that are restricted for the circulation of certain type of vehicles. These may be used by buses, taxis or private vehicles carrying a minimum number of passengers. Regulation
Strategies Oriented to Travel Reduction
IDPublic PoliciesPolicy DefinitionBased InstrumentImpactsAffected Negative Externalities
1Alternative work schedules [53].Alternative work schedules involve a change in check-in and check-out times in order the employees to avoid peak traffic hours.Regulation
-
Reduces car usage (1,2).
-
Reduces congestion (1,2).
-
Reduces travel times (1).
-
Improves habitability (1).
-
Promotes sustainable modes (1).
-
Promotes car-pooling (1).
-
Improves productivity and employee satisfaction (1,2).
-
Soil & Water pollution (1).
-
Air Pollution (1).
-
Green House Gases (1).
-
Ecological Impact (1).
-
Congestion (1,2).
-
Loss of amenity value (1,2).
-
Vibration (2).
-
Noise (2).
-
Oil dependence (2).
2Telecommuting [53].Telecommuting involves the use of telecommunications (phone, email, instant messaging, video conferencing) to help people working while staying at home.Regulation
Table 2. Strategies oriented to vehicles possession and vehicles circulation.
Strategies Focused on Vehicles Possession
IDPublic PoliciesPolicy DefinitionBased InstrumentImpactsAffected Negative Externalities
1Vehicle tenure taxes based on environmental parameters [57,58].It is a recurring tax which is imposed for the possession of a motor vehicle, depending on the impact that the vehicle causes to the environment.Economic
-
Reduces car usage (1,3).
-
Reduces emissions (1,2,3).
-
Promotes sustainable modes (1,3).
-
Reduces the total number of auto-mobiles (1,3).
-
Generates income (1,2).
-
Promotes shift to more efficient vehicles (1,2,3).
-
Reduces energy consumption (2).
-
Promotes technological innovation (2).
-
Soil & Water pollution (1,2,3)
-
Air Pollution (1,2,3).
-
Green House Gases (1,2,3).
-
Ecological Impact (1,2,3).
-
Loss of amenity value (1,2,3).
-
Oil dependence (2,3).
-
Noise (3).
-
Vibration (3).
2Feebates, discount or surcharge on the purchase based on performance vehicles [59].The feebates establish payments or surcharges (fees) and discounts or rebates to the purchase of private vehicles based on energy efficiency parameters.Economic
3Fleet renewal [60].It consists of renovating and modernizing the vehicles fleet circulating in a given geographical area to shorten the environmental implications of archaic and ineffective units. Economic
Strategies Oriented to Vehicles Circulation
IDPublic PoliciesPolicy DefinitionBased InstrumentImpactsAffected Negative Externalities
1Congestion charge [61].It consists of setting a fare for motorists who circulate in certain areas, days and times; as well as discounts for taxis, vehicles of disabled people, buses, emergency vehicles, bicycles, hybrid vehicles and residents of the areas where the fare applies.Planning-Economic
-
Reduces car usage (1,2,3).
-
Reduces congestion (1,2,3).
-
Reduces travel times (1).
-
Reduces emissions (1,2,3).
-
Promotes sustainable modes (1,2,3).
-
Improves road security (1,2,3).
-
Improves habitability (1).
-
Generates income (1,3).
-
Improves productivity (1).
-
Promotes economic efficiency (2).
-
Reduces energy consumption (2).
-
Promotes the shift to more efficient vehicles (3).
-
Soil & Water pollution (1,2,3)
-
Air Pollution (1,2,3).
-
Green House Gases (1,2,3).
-
Ecological Impact (1,2,3).
-
Congestion (1,2,3).
-
Vibration (1,3).
-
Noise (1,3).
-
Road Infrastructure Damage (1,2,3).
-
Loss of amenity value (1,2,3).
-
Road accidents (1,2,3).
-
Change in land value (1).
-
Oil dependence (2).
2Charges of vehicles kilometres travelled [62].It consists of applying a tax to the cars for each kilometre travelled by them.Economic
3Fuel taxes based on environmental parameters [63,64].Taxes based on some environmental parameters that apply to the purchase offuel used for transport.Economic
Table 3. Strategies oriented to parking places and urban planning.
Parking Places Strategies
IDPublic PoliciesPolicy DefinitionBased InstrumentImpactsAffected Negative Externalities
1Parking meters [53].A parking meter is a device installed on public roads whose goal is to regulate (by charging an amount of money) the use of spaces formally set in the street for the parking of vehicles.Economic
-
Reduces car usage (1,2).
-
Reduces congestion (1,2).
-
Reduces travel times (1).
-
Reduces emissions (1).
-
Promotes sustainable modes (1,2).
-
Improves road security (1).
-
Improves habitability (1,2).
-
Improves public space (1,2).
-
Generates income (1,2).
-
Increases the availability of parking places (1,2).
-
Promotes efficient land-use (2).
-
Reduces construction cost (2).
-
Promotes real estate development (2).
-
Soil & Water pollution (1,2).
-
Air Pollution (1,2).
-
Green House Gases (1,2).
-
Ecological Impact (1,2.
-
Congestion (1,2).
-
Vibration (1,2).
-
Noise (1,2).
-
Road Infrastructure Damage (1,2).
-
Loss of amenity value (1,2).
-
Road accidents (1,2).
-
Change in land value (1,2).
2Parking requirements in constructions and business [65,66].Building regulations in cities usually include minimum parking places requirements according to the type of construction. These requirements can generate a parking offer that, without wishing, encourages the use of cars.Economic
Strategies Oriented to Urban Planning
IDPublic PoliciesPolicy DefinitionBased InstrumentImpactsAffected Negative Externalities
1Transit oriented development [67].Transit-oriented development (TOD) is a model of urban design that seeks to build neighbourhoods around public transport. A TOD usually has as its centre a bus station, BRT or subway, which is surrounded by a high density development and mixed land uses.Planning
-
Reduces car usage (1,3).
-
Reduces congestion (1,3).
-
Reduces emissions (1,3).
-
Promotes sustainable modes (1,2,3).
-
Promotes efficient land-use (1,2,3).
-
Improves road security (1,2,3).
-
Improves habitability (1,2,3).
-
Improves public space (1,2,3).
-
Promotes local economic development (1).
-
Promotes urban renovation (1).
-
Improves the amenity value of the area (2).
-
Improves urban image (3).
-
Soil & Water pollution (1,2,3).
-
Air Pollution (1,2,3).
-
Green House Gases (1,2,3).
-
Ecological Impact (1,2,3).
-
Congestion (1,2,3).
-
Vibration (1,3).
-
Noise (1,3).
-
Road Infrastructure Damage (1,2,3).
-
Loss of amenity value (1,2,3).
-
Road accidents (1,2,3).
-
Change in land value (1,2,3).
-
Invasion of public space (1,3).
-
Visual blight (1,3).
-
Barrier effect (1,3).
-
Oil dependence (3.
2Transit Pacification [68].Transit pacification encompasses a collection of design policies and principles that seek to reduce the volume and speed of transit on a particular road or area.Regulation-Planning
3Car-free planning [65,69].Car-free planning involves the design of particular areas in order to encourage the use of non-motorized modes of transport and consequently reduce the use of cars. Regulation-Planning
Table 4. Strategies related to efficient mobility and alternatives to auto-mobile usage.
Strategies Oriented to Public Transport
IDPublic PoliciesPolicy DefinitionBased InstrumentImpactsAffected Negative Externalities
1Exclusive lanes for public transport [69,70].Exclusive lanes are a confined and reserved section of the road for the use of trolleybuses or for high-occupancy vehicles. This segregation from all other transit, gives priority to public transport by reallocating the road space.Planning
-
Reduces travel times (1,2,3).
-
Improves quality of public transport (1,2).
-
Improves reliability and the efficiency of public transport (1,3).
-
Reduces car usage (2,3).
-
Reduces congestion (2).
-
Reduces emissions (2,3).
-
Promotes sustainable modes (2,3).
-
Improves accessibility (2,3).
-
Improves the image of public transport (2,3).
-
Improves road security (3).
-
Improves security (3).
-
Improves productivity and generates job opportunities (3)
-
Congestion (1,2).
-
Road Infrastructure Damage (1,3).
-
Loss of amenity value (1,2,3).
-
Road accidents (1,3).
-
Invasion of public space (1,2,3).
-
Soil & Water pollution (2,3)
-
Air Pollution (2,3).
-
Green House Gases (2,3).
-
Ecological Impact (2,3).
-
Change in land value (2,3).
2Bus rapid transit (BRT) [70].The BRT is a mass transportation system which is characterized by confined lanes, high stations, pre-boarding payment system, low emission units and intelligent transport systems. BRT systems are designed to provide a similar service to other massive systems such as the subway or light rail, but with lower construction costs.Planning
3Establishment of other massive systems, such as suburban train, metro, tram [70,71].The construction or expansion of public transport systems in order to provide alternative transportation modes and improve the quality of public transport.Planning
Strategies Focused on Bicycles and Pedestrians
IDPublic PoliciesPolicy DefinitionBased InstrumentImpactsAffected Negative Externalities
1Public bicycle system [53].A public bicycle system is a public service of individual transport that operates via the rental of bikes in urban centres. Planning
-
Reduces travel times (1,2,3).
-
Promotes sustainable modes (1,2,3).
-
Promotes efficient land-use (1).
-
Improves public space (1,2,3).
-
Promotes intermodality (1).
-
Enhances the social identity of the city-social cohesion (1,3).
-
Reduces emissions (2,3).
-
Reduces car usage (2).
-
Improves road security (2).
-
Reduces transportation’s cost (2).
-
Improves accessibility (3).
-
Soil & Water pollution (1,2,3)
-
Air Pollution (1,2,3).
-
Green House Gases (1,2,3).
-
Ecological Impact (1,2,3)
-
Vibration-Noise (1,2,3)
-
Road Infrastructure Damage (1,2).
-
Loss of amenity value (1,2,3).
-
Change in land value (1,2,3).
-
Invasion of public space (1,2,3).
-
Barrier effect (1,3).
-
Oil dependence (1,2,3).
2Establishment of bike lanes [53].The establishment of bike lanes in order to provide the people with alternative transportation modes.Planning
3Generation of walk-able spaces [70,71,72].The establishment of pedestrian-friendly neighbourhoods.Planning
Table 5. The identified variables for the case study.
IDNomenclature of Considered Negative ExternalitiesSymbolization of Considered Negative Externalities within the Software MICMAC
1Water & Soil PollutionWater poll
2Change in Land ValueChainlaval
3Road AccidentsRoad accid
4CongestionCongestion
5Oil DependenceOil depend
6Invasion of Public SpaceInvofpubsp
7Local Air PollutionLocalairpo
8Greenhouse GasesGreenhouga
9Road Infrastructure DamageRoinfdamag
10Vibration DamageVibration
11Ecological ImpactEcoimpact
12Visual BlightVisualblig
13Barrier EffectBarriereff
14NoiseNoise
15Loss of Amenity ValueLossameval
Table 6. Justification of the relationships between the negative externalities of transport.
IDExamined Negative ExternalityDirectly Interlinked Negative Externalities
1Water pollutionChange in land value, greenhouse gases, ecological impact, loss of amenity value [78,79,80,81,82].
2Road accidentsWater quality, congestion, air pollution. visual blight, loss of amenity value, ecological impact, noise, road infrastructure damage [83,84,85].
3CongestionWater pollution, local air pollution, noise, greenhouse gas, ecological impact, road accidents, loss of amenity value, change in land value [25,31,32,46,86,87,88,89].
4Oil dependenceLocal air pollution, loss of amenity value, water pollution, visual blight, greenhouse gases, ecological impact, barrier effect [25,51,90,91].
5Transportation invasion of public spaceWater pollution, congestion, local air pollution, noise, vibration, greenhouse gases, ecological impact, barrier effects, visual blight, change in land/property value and loss of amenity value [25,31,32,46,47,86,87,88,89,90,91].
6Local air pollutionWater pollution, loss of amenity value, change in land value, ecological impact, visual blight, road accidents [92,93,94,95,96,97].
7Greenhouse gasesWater pollution, local air pollution, ecological impact, change in land value, loss of amenity value, barrier effect [98,99,100,101,102,103,104,105,106].
8Road infrastructure damageChange in land value, road accidents, congestion, visual blight, loss of amenity value [107,108].
9VibrationChange in land value, local air pollution, road infrastructure damage, ecological impact, noise, loss of amenity values [108,109,110,111].
10Ecological impactWater pollution, local air pollution, barrier effect, loss of amenity value [25,112,113].
11Visual blightChange in land value, road accidents, ecological impact, loss amenity value [93,114,115,116,117,118]
12Barrier effectChange in land value, ecological impact, loss of amenity value [49].
13NoiseWater pollution, change in land value, local air pollution, ecological impact, loss of amenity [44,93,119,120,121].
14Loss of amenity valueChange in land value [93].
Table 7. The hierarchical organization of transportation’s negative externalities and strategies oriented toward sustainable mobility.
IDNegative ExternalitiesSectorObservationsStrategies Hierarchical ClassificationDistinguished Public Policies
1Invasion of public space1The variables seen in sector 1 are critical, as they have the capacity to define the behaviour of the system. Invasion of public space for roads construction, congestion, road accidents, oil dependence, and local air pollution negative externalities are located in this sector and they are negative externalities primarily related to private car use. Therefore, reduction of its use is a priority for the establishment of a sustainable environment because private cars may influence in a negative way the quality of people’s life via ecological impact, urban image degradation, several health issues, visual blight, barrier effects, loss of land value, and loss of amenity value.Urban DesignTransit Oriented Development.
Car-free planning.
Transit pacification.
2Road accidents1Strategies oriented towards alternative mobility modes (public transport and non-motorized mobility).Creation of walk-able neighbourhoods.
3Congestion1Establishment of bike lanes.
4Local air pollution1Promotion of public bicycle systems.
5Oil dependence1Bus Rapid Transit approach.
6Vibration1The phenomenon of urban sprawl and the increase in traffic intensity are capable of generating vibrations. The latter cause severe negative effects (such as stress, sleep disturbance, problems of concentration and communication among others) on people and serious negative effects on engineering (both housing and transport) infrastructures via the extension of traffic patterns.Establishment of other kind of massive transit systems (suburban train, metro and tram).
7Road infrastructure damage1The last negative externality located in sector 1 is road infrastructure damage that not only generates health impacts via the increase of road insecurity but also affects economic and social matters such as changes in amenity values, congestion, and barrier effect.Strategies related to parking placesParking meters.
8Ecological impact3In sector 3 variables such as loss of amenity value, ecological impact, water pollution and changes in land value are observed, which are truly important for the creation of a sustainable environment and the improvement of people´s quality of life. Nevertheless, at the same time, these variables are influenced heavily by many of the other variables considered for this study such as air pollution, congestion, road accidents, oil dependence, and invasion of public space for the construction of roads and therefore it is preferable to be managed through them.Establishment of minimum parking requirements in houses and business.
9Water pollution3Strategies oriented towards vehicles circulationCongestion charge.
10Change in land value3Charges of vehicles kilometres travelled, fuel taxes.
11Loss of amenity value3Strategies oriented to efficient auto-mobile usageHigh occupancy vehicle lanes.
12Noise4In the last sector that is close to the origin of X and Y axes, the variables of oil dependence, noise, greenhouse gases, visual blight, and barrier effect can be located. However, greenhouse gases negative externality is equally close to sector 1 and 3 respectively and therefore should be prioritized in terms of urban management in order to not cause instability to the behaviour of the system. The negative externality of noise can be managed through the variables that heavily influence it, such as vibration, congestion, invasion of public space, and road accidents, while the externalities of barrier effect and visual blight should be incorporated via the externalities of public space invasion, ecological impact-greenhouse gases, road infrastructure damage, and road accidents. Car-pooling.
13Visual blight4Strategies focused on vehicles possession.Vehicle tenure based on environmental parameters.
14Greenhouse gases4Feebates, fleet renewal.
15Barrier Effect4No-mobility strategiesalternative work schedules, telecommuting.

