1. Introduction
Economic development, globalization, change of lifestyle and consumer expectations cause specific changes in the operation of the economy. Requirements for companies are growing—everything should be done as fast as can and in a good quality. Enterprises have to react very quickly to challenges and opportunities of the business world [
1]. The Industry 4.0 concept has been disseminated for almost 10 years [
2]. In Industry 4.0, dynamic business and engineering processes enable last-minute changes to production and deliver the ability to respond flexibly to disruptions [
3,
4,
5,
6,
7]. This attitude had an impact on the way companies function, particularly transportation companies. The main key is time, given that the most popular form of transport is road transport. Transport volumes are growing (along with the volumes of small orders), which has certain effects: more trucks on the road, higher fuel consumption and higher exhaust emissions. As a result of the steadily growing transport orders, it is important to develop sustainability concepts. In the context of supply chain, sustainability means sustainable development, which focuses on three aspects: environmental protection, economic growth and social equity [
8]. Companies should consider all three dimensions in making decisions regarding their activities. These dimensions have to be connected. Considered any other way, the ecologic protection of our planet cannot be full. A simulation model is presented to show the advantages of order consolidation. By using a simple simulation model, the authors present the benefits of cooperation at realization transport order level in all three dimensions. Some experiments will be made to show the advantages of consolidating the transportation order. By analyzing the costs of realizing every order and their influence on the environment, two of three benefits will be considered—economic and environmental. From the social aspect, order consolidation means less traffic, and potentially fewer accidents.
For the purpose of this article, a literature research about simulation of the sustainable supply chain was made. The authors wanted to show the usefulness of the simulation model, and to show the context of using this tool in global terms. The literature review confirms the experiences of the authors about the advantages of using a simulation model in aspects of supply chain and sustainability supply chain.
The article consists of five parts. In
Section 2, the literature review about using the simulation tool in sustainable supply chain is described. In
Section 3, the authors present a detailed built simulation model to show the advantages of a sustainable supply chain. The experiments and results are described in
Section 4. Finally, the conclusion and development possibilities are presented in
Section 5.
2. Literature Review
Supply chain management (SCM) has developed into a major conceptual approach inside management and business administration [
9]. Supply chains are inherently complex, dynamic [
10], dispersed and open systems [
11]. Supply chains are in a state of transformation. The better we understand future needs, the better modern and future supply chain will function [
12,
13,
14].
In the last two decades, aspects of sustainable supply chain (SSC) have become more and more popular [
15], both in academia and practical application. The trend recognized as sustainable supply chain refers to the idea of sustainability and its implementation in a supply chain structure [
16]. Seuring and Muller (2008) define sustainable supply chain management (SSCM) as the management of material, information and capital flows as well as cooperation among companies in the supply chain while taking goals from all three dimensions of sustainable development (environmental, social and economic) into account, which are derived from customer and stakeholder requirements [
17]. Sustainability outcomes encompass the adoption of environmentally and socially responsible practices as well as the achievement of environmental, social or economic performance [
18]. Unfortunately, it can be said that most organizations are indifferent or even opposed to the SSC idea—their many unsustainable activities confirm this [
19].
The literature review about the popularity of aspect of simulation of sustainable supply chain was made using the Scopus database. Simulation is an important element in the study of sustainable supply chains [
11], sustainable world [
20], supply chain simulation [
21], production and distribution [
22], food supply chain management [
23] and discrete production processes [
24]. The authors decided to use different searching methods for showing differences in the number of articles. Using the sentence simulation sustainable supply chain, many more articles are acquired when searching each word separately. When the searching is restricted using quotation marks, more adequate documents are found. The results of the searches are presented in
Table 1. They included all articles until 2019. It is worth mentioning that a detailed literature analysis in case of searching keywords in all fields should be expanded by looking at every article and checking its exact range. However, for the purpose of this article it is not necessary. The actual literature review shows the importance and usefulness of using simulation in aspects of sustainable supply chain. As can be noticed using quotation marks in searching, the statistics change a lot, from about 18,500 articles to 2500 in the analyzed field.
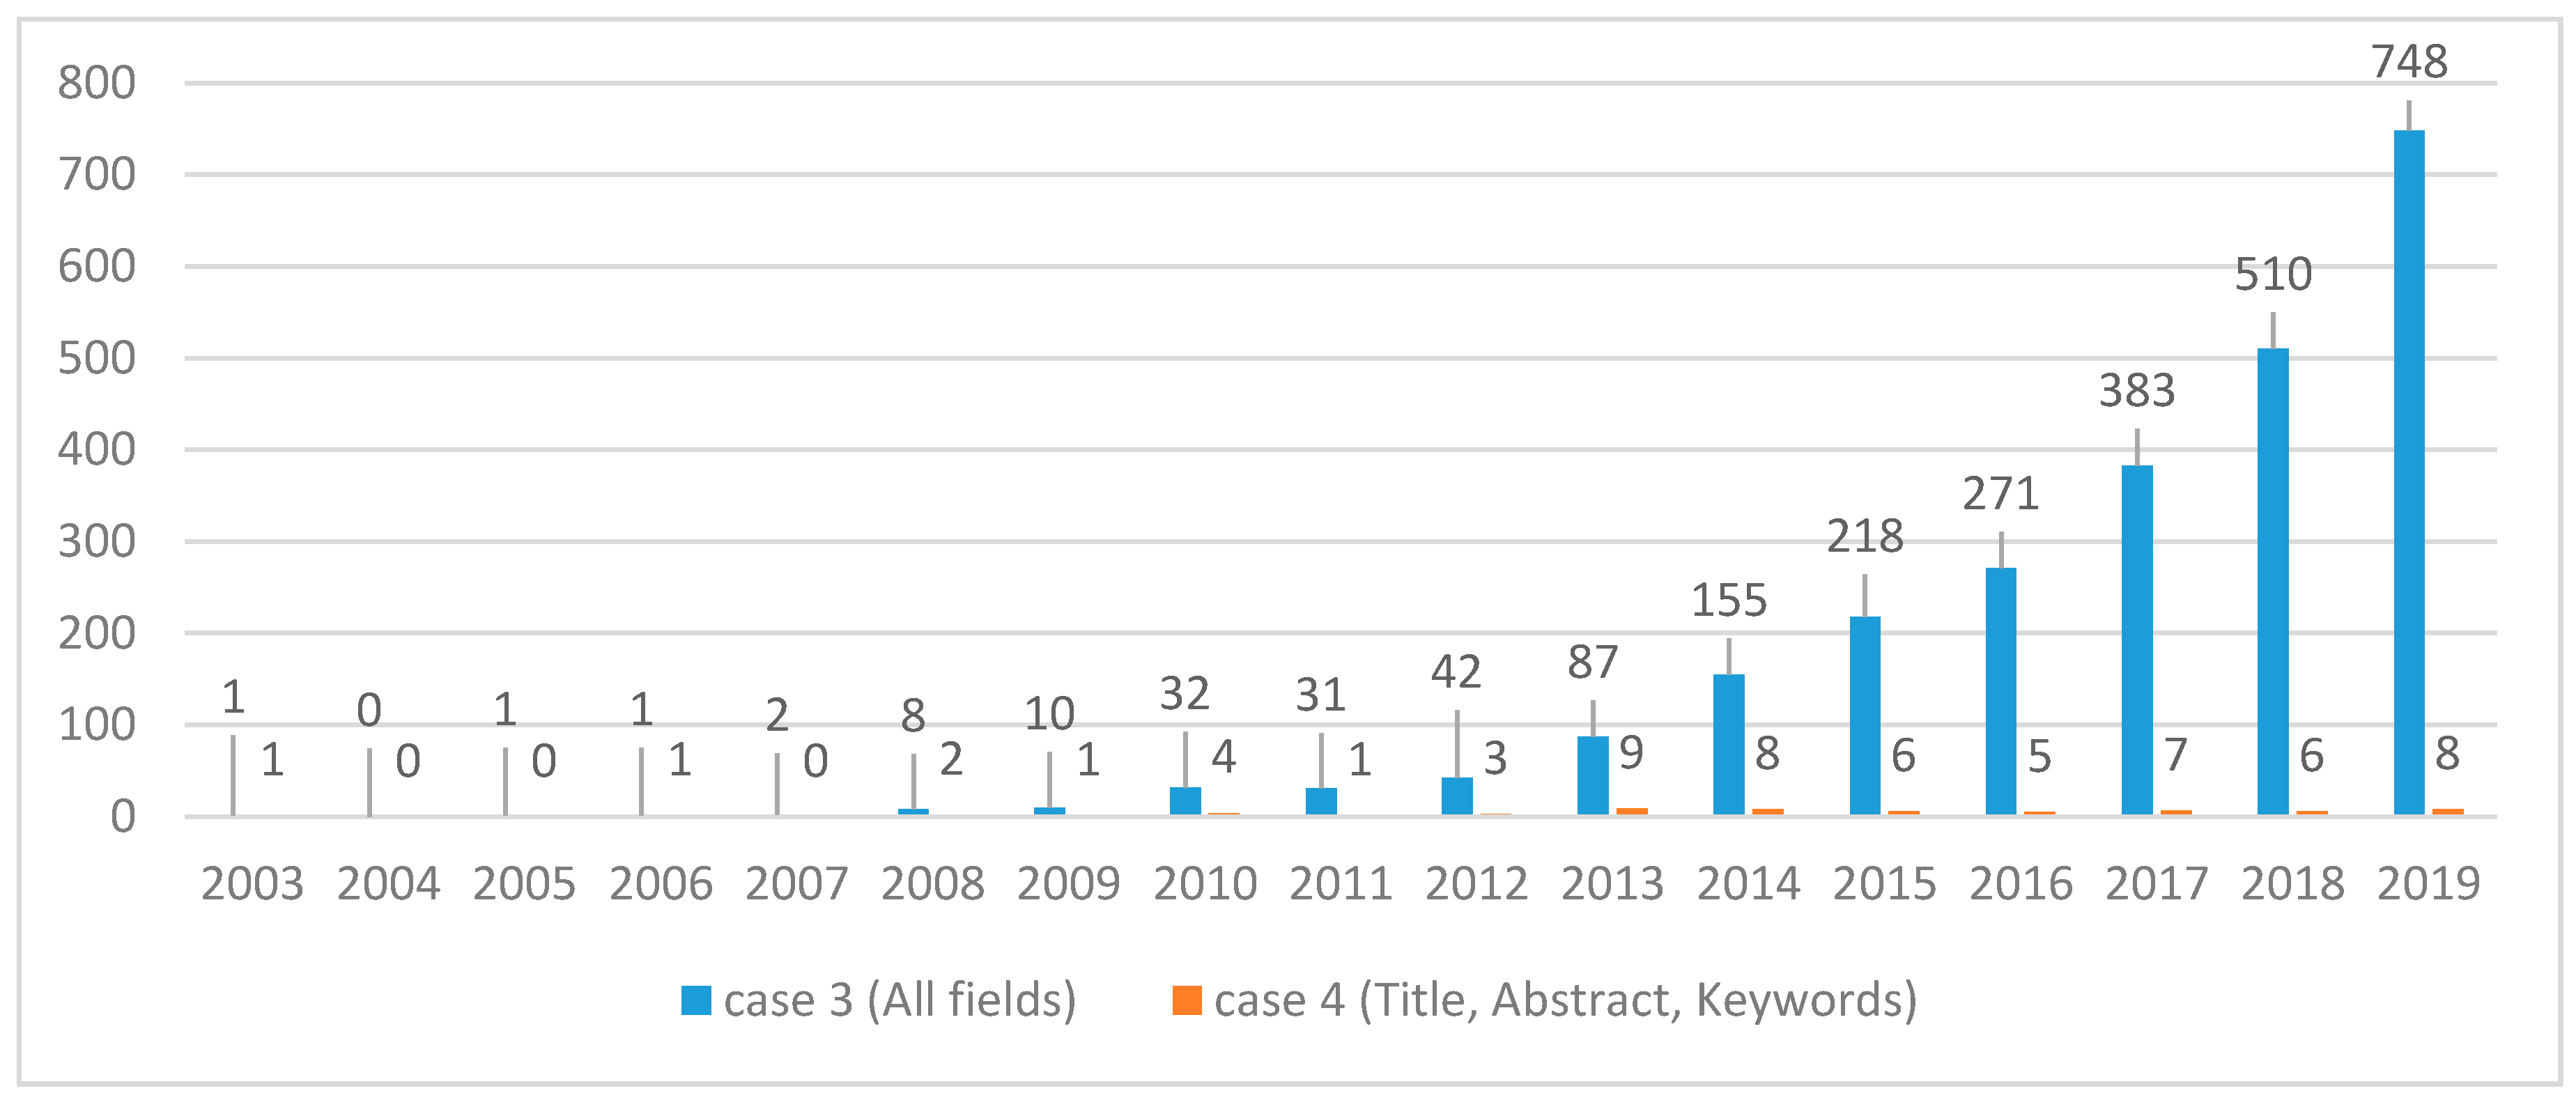
In the next step authors analyzed only articles find by restricted searching method—using quotation marks—case 3 and 4. The number of articles for case 3 and 4 in 2003–2019 are compared at
Figure 1. By searching analyzed topic in all fields, the growing interesting can be noticed. In more restricted searching methods, the unabated interesting can be noticed.
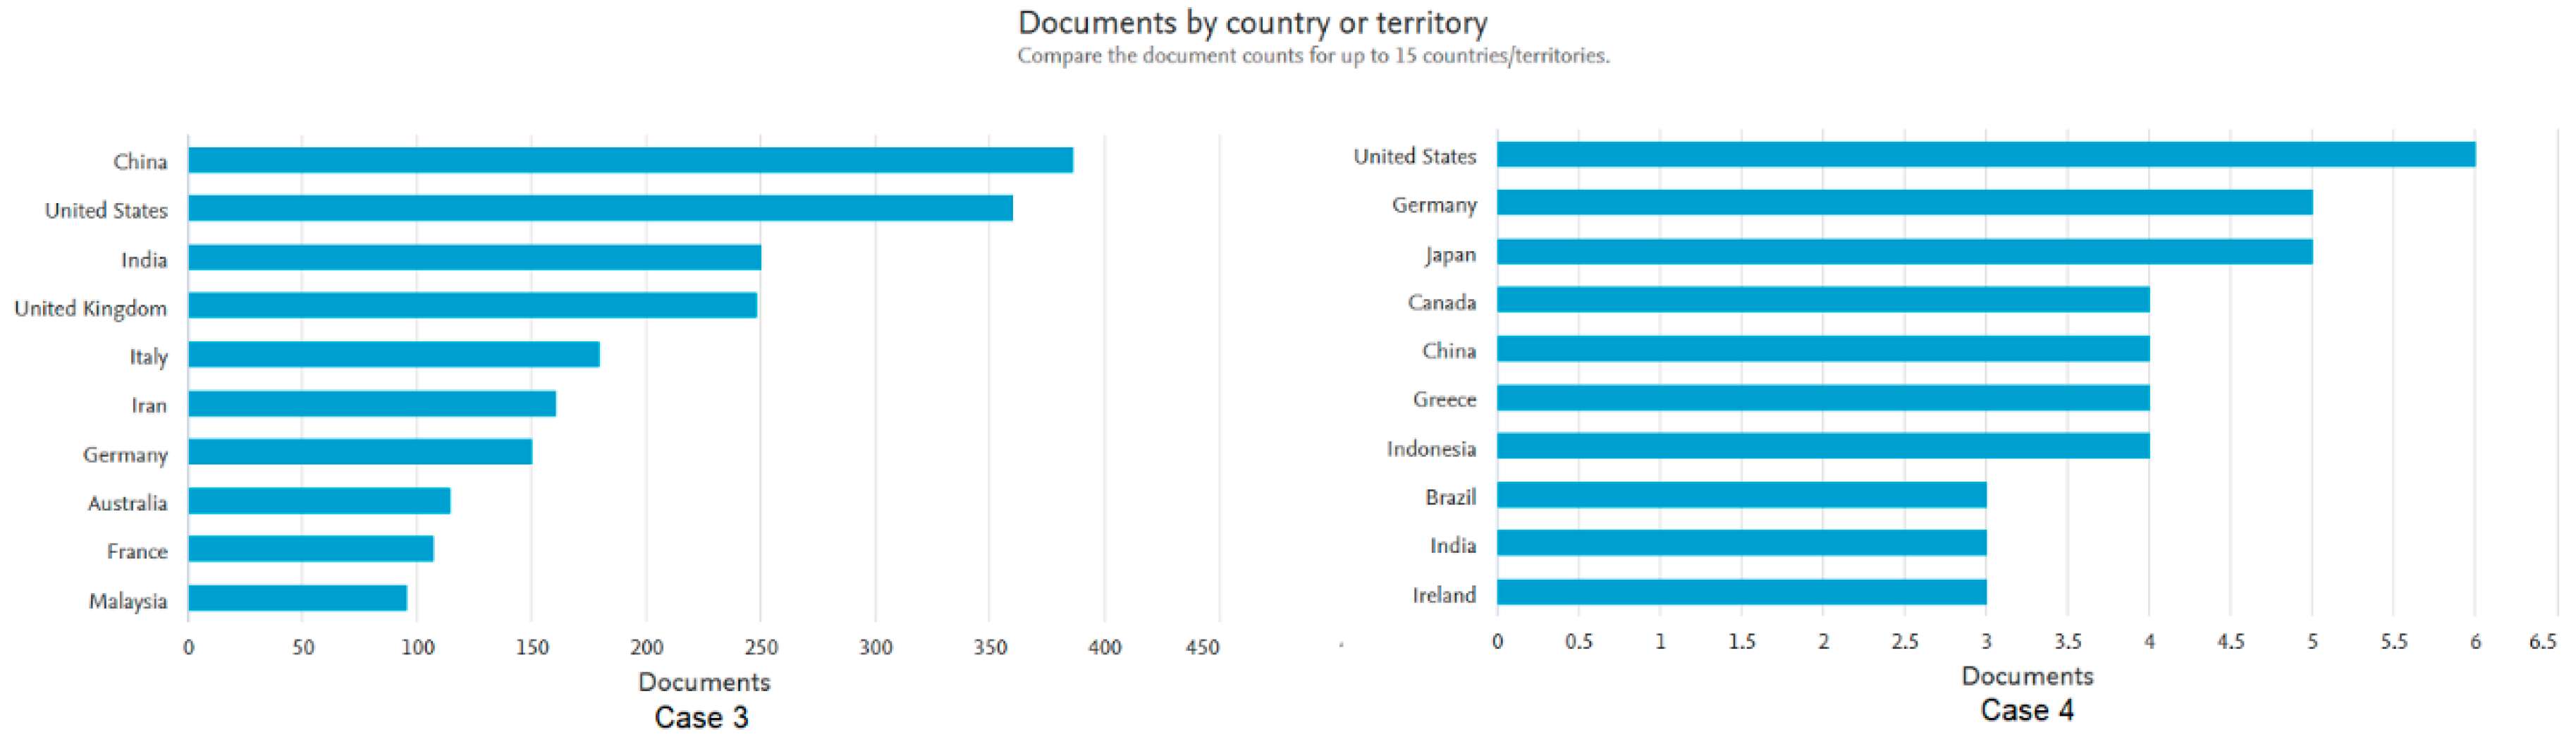
The comparison of searched papers in case 3 and 4 by country or territory is presented at
Figure 2. In 10 countries, in both cases are China, United States, and India.
The aspects of sustainable supply chain are simulated, as confirmed in the literature review. The different area, range and type of economic branches of supply chains are simulated. Chanchaichujit et al. [
25] present a literature review of mathematical modelling approaches for sustainable supply chain. Rebs et al. [
26] describe a literature review and systems thinking approach for system dynamics modeling for SSC management.
Complex analysis (including economic, environmental and social indicators) for sustainable supply chain is presented by Wang et al. [
27]. In their paper, they propose “a framework for evaluating the sustainability of a detergent supply chain through integration of supply chain dynamic simulation and environmental- and societal—Life Cycle Assessment (LCA)”. The life cycle assessment (LCA) methodology is an ideal tool not only to quantify the related environmental impacts [
28,
29].
Hong et al. [
30] describe using Monte Carlo simulation for sustainable supply chain. Hong and the other focus in paper not only on economic aspect but also ecological—they pay attention for carbon emissions and PM2.5, which have a negative impact on human health. Authors in the paper “constructs a mathematical programming model that minimizes the transportation costs and the undesirable social medical costs for remedying the release of PM2.5 into the atmosphere”. The ecological aspects are also described in articles [
31,
32].
Examples of case studies for using simulation in aspect of sustainable supply chain are presented in
Table 2.
3. Simulation Model
The authors decided to build the simulation model of supply chain/sustainable supply chain to show the advantages of cooperation in order and transportation level. A simple model for presentation the realization of transportation order was created. In first step, the authors, by using this model, will show situation of individual realization the transport order. In the next step, they will present the advantages of cooperation and combine the orders. In the context of sustainable supply chain, the cooperation between transportation companies is very important. The advantages are important in economic, ecological and social site. By using built simulation model, these advantages will be shown in further part of this article.
The simulation model consists of two basic parts:
First are global tables in which data are included;
Second are logical process, which look like algorithm.
The simulation model was built by using FlexSim simulation software [
39]. It is a modern 3D simulation software. The logic process was built by using process flow module, which is built in the FlexSim software. This module is very useful for programming decision, business aspects in the simulation model.
3.1. Global Tables in Simulation Model
The built model of supply chain consists of 11 global tables. Ten of them contain entry information, in one of them the results from model are presented. All tables can be easily modified—by adding next row or column, more information can be added.
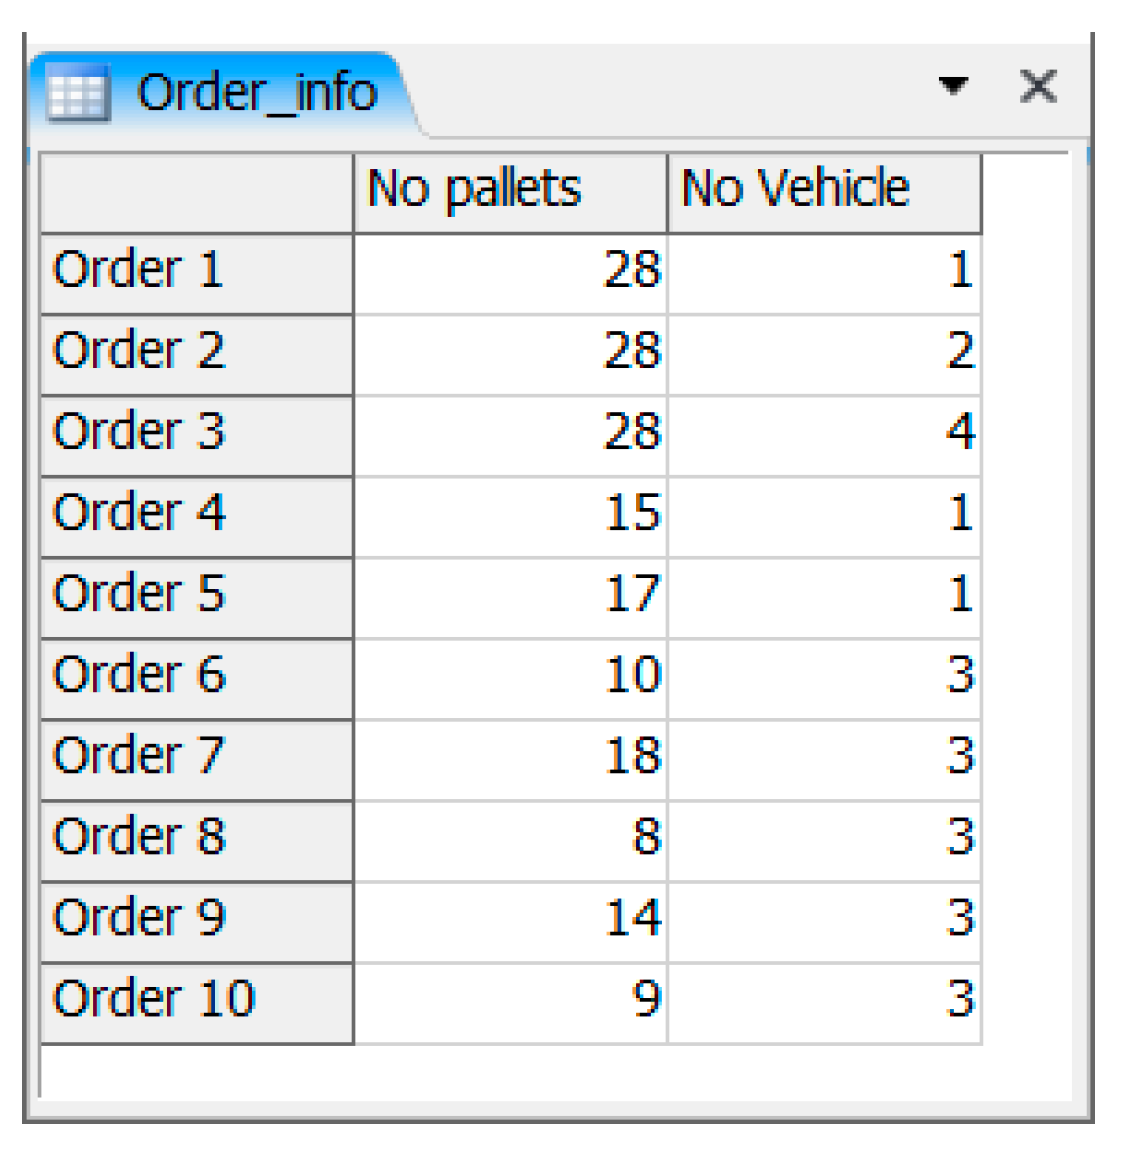
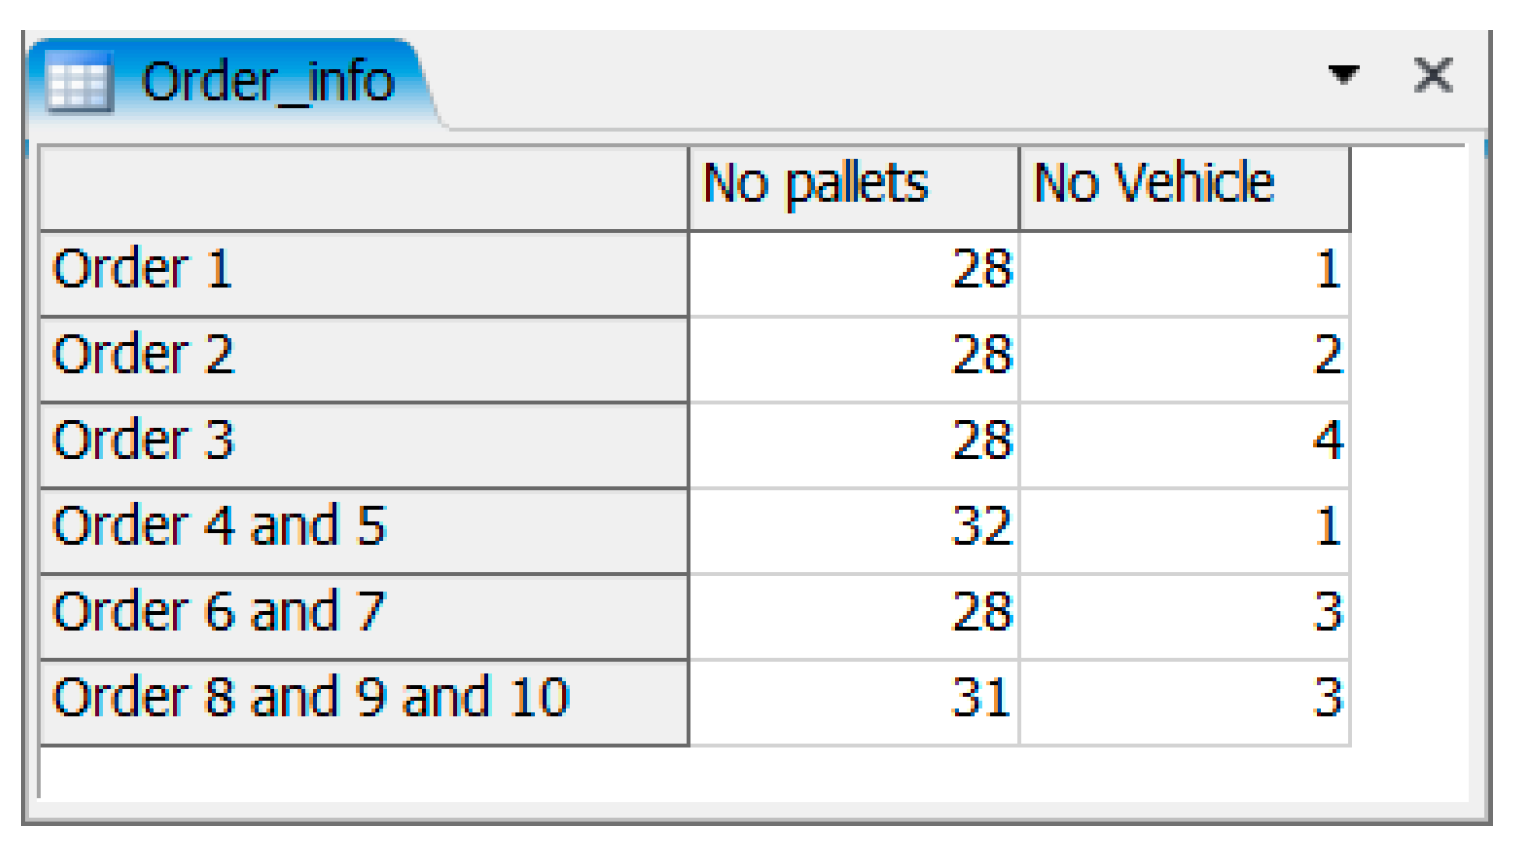
The first table in the model is named “Order_info” (
Figure 3). In this table, the information about order are quantity of pallets to transport for every order and the number of vehicles which will be used for this transport order. At this table, only 10 orders are added. But they can be easily extended by adding next rows.
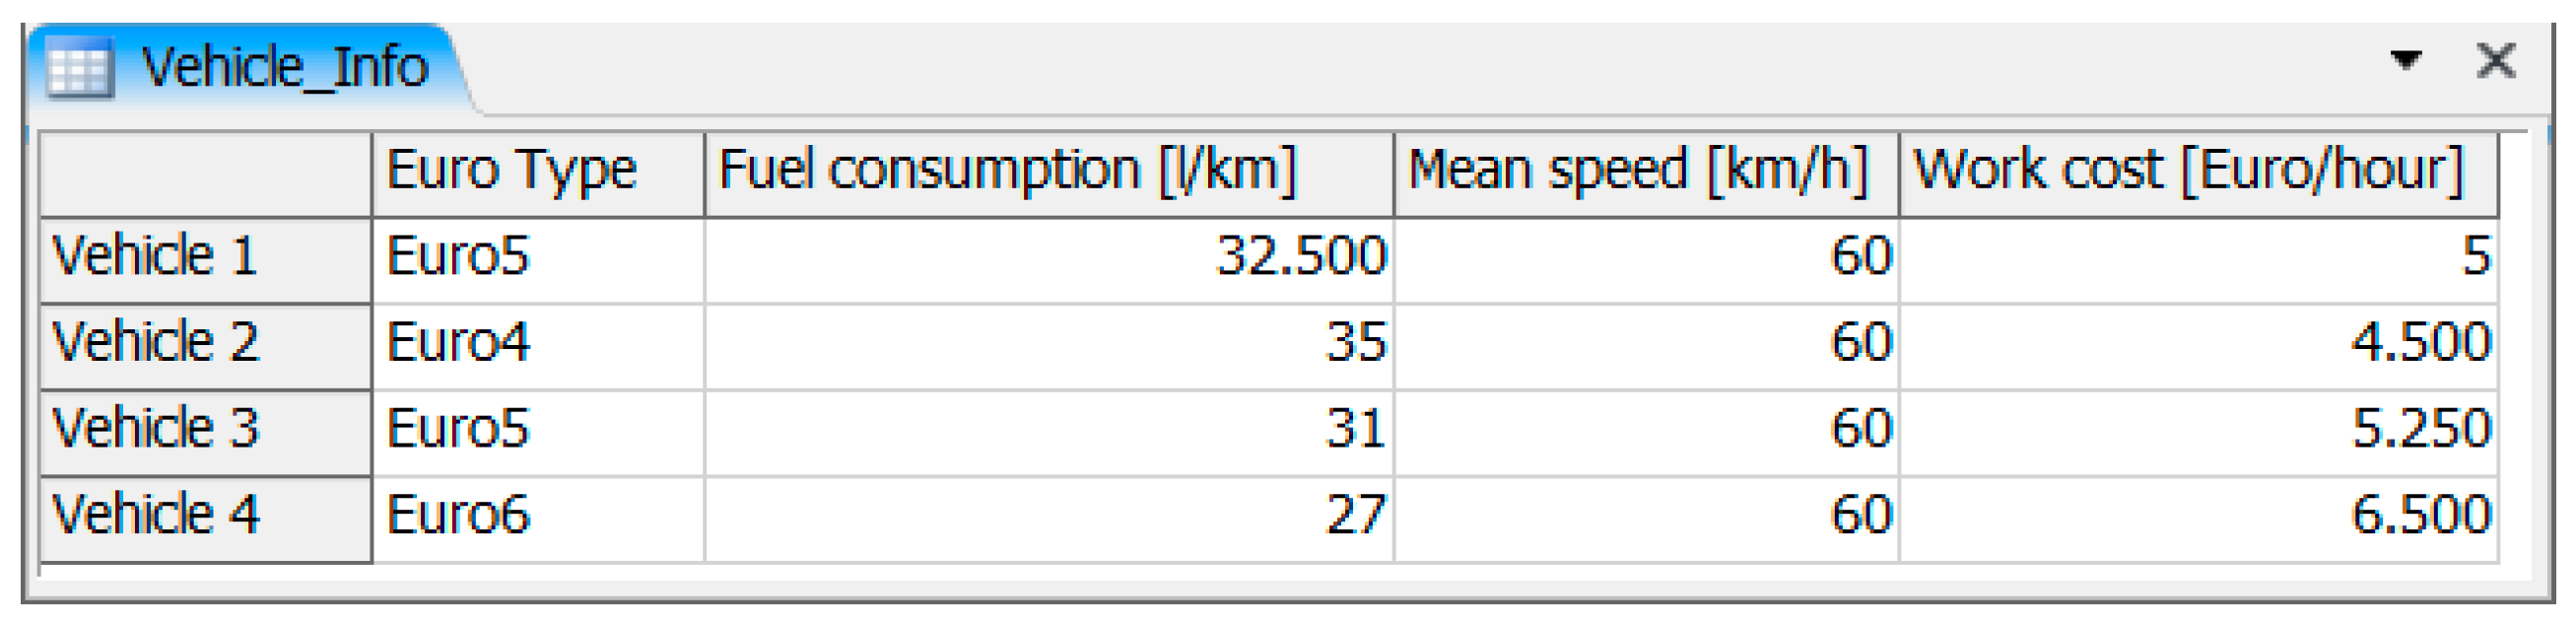
The second table is named “Vehicle_info” (
Figure 4). In this table, the basic information for vehicle are added: EUR type, fuel consumption [L/km], mean speed [km/h], work cost [EUR/hour]. This information is used for calculating time of realization order and cost, which is important for two of three dimensions of sustainable supply chain (economic and ecological). Depending on the number of vehicle from table ”Order_info”, the proper information into the simulation is loaded.
The third table is named “Euro_Standards” (
Figure 5). In this table, the information about exhaust emission are included [
40,
41]. Based on these data, for used vehicle in every order the exhaust emissions are calculated. This is very important from an ecological point of view.
Table “Info” in the model is created for added additional basic information into simulation model, which is important from different calculating aspects (
Figure 6). In this model, at this table only information about fuel cost is saved.
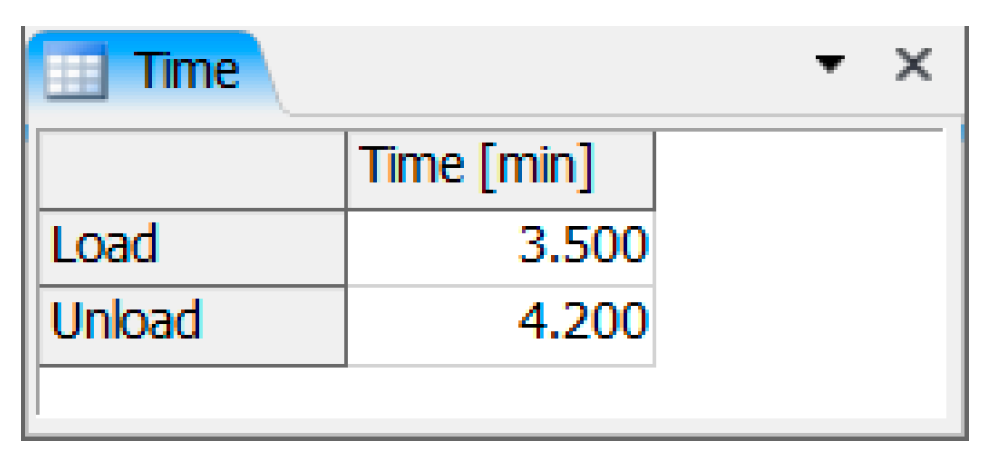
Analyzing supply chain from three dimensions—economic, ecological and social—authors decided to calculate time of realization transport order not only based on a distance–speed relationship, but they also take into account time of loading and unloading pallets into the vehicle. In table “Time”, basic information of time of load/unload one pallet are restored (
Figure 7). Including these variables, the time of realization, what means also cost of them, will depend on volume of pallets for transport in each order.
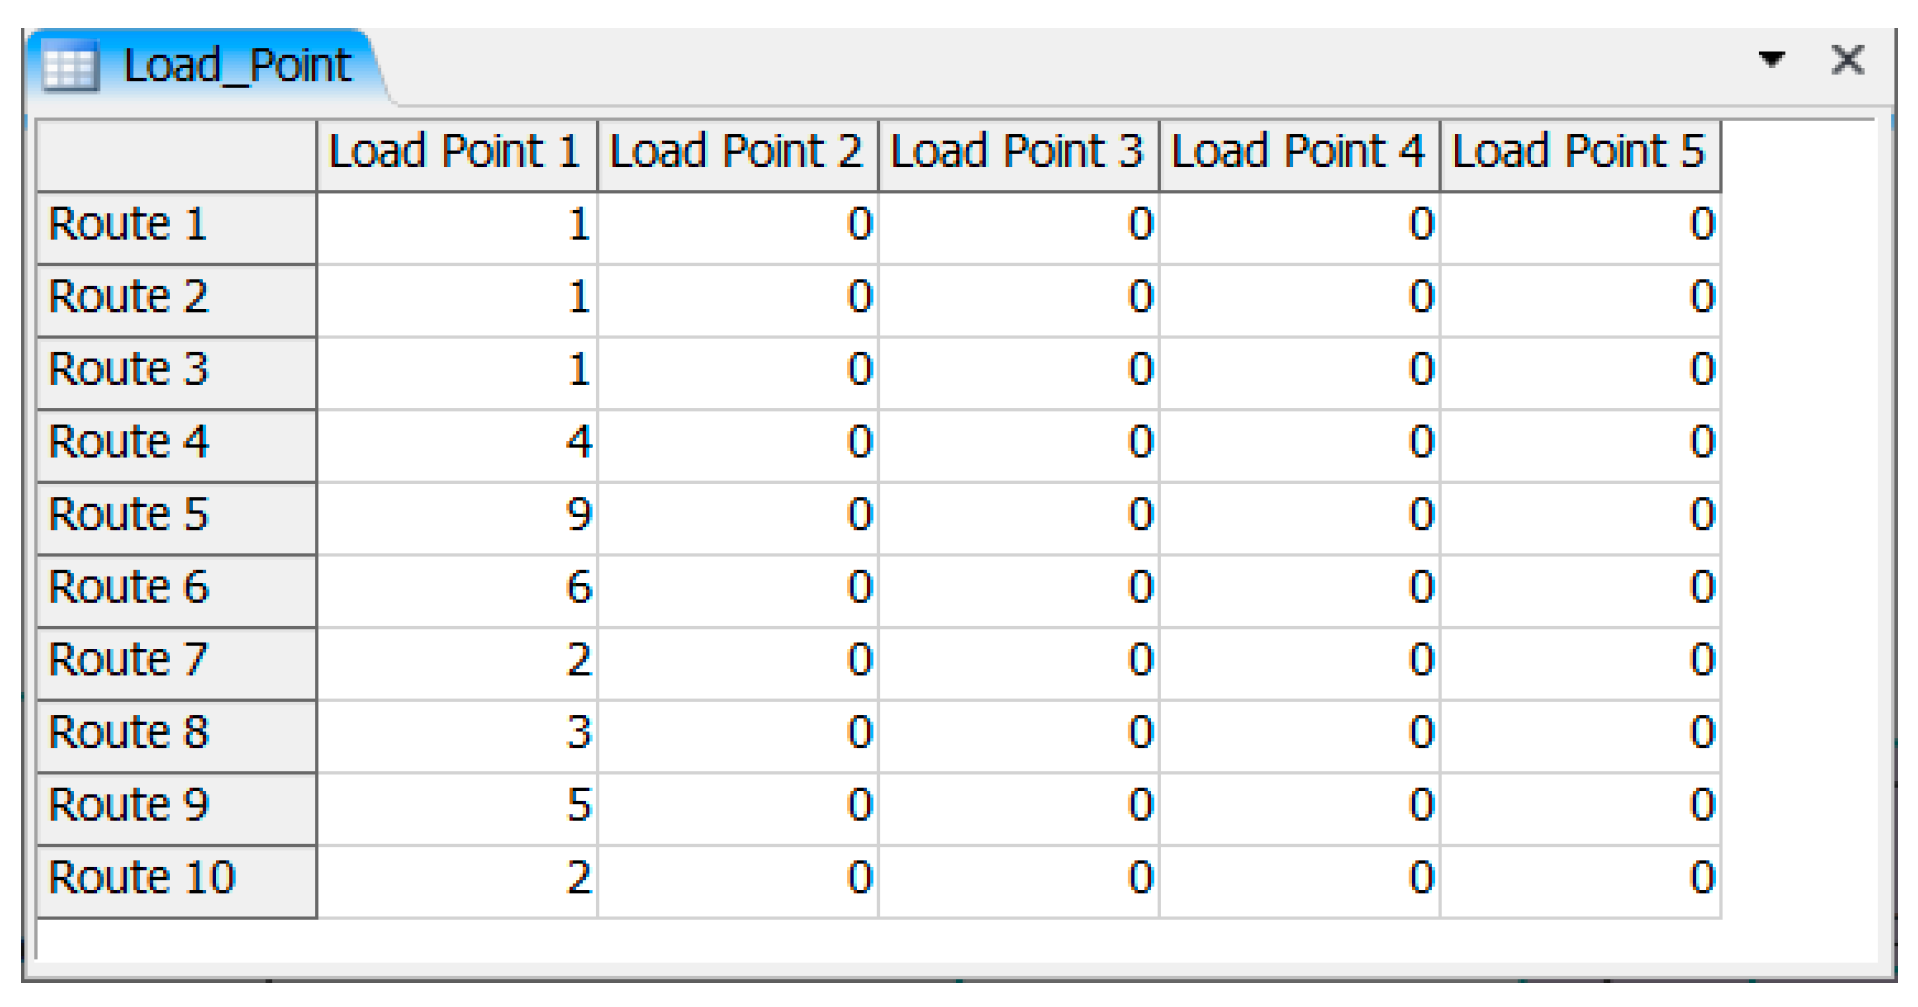
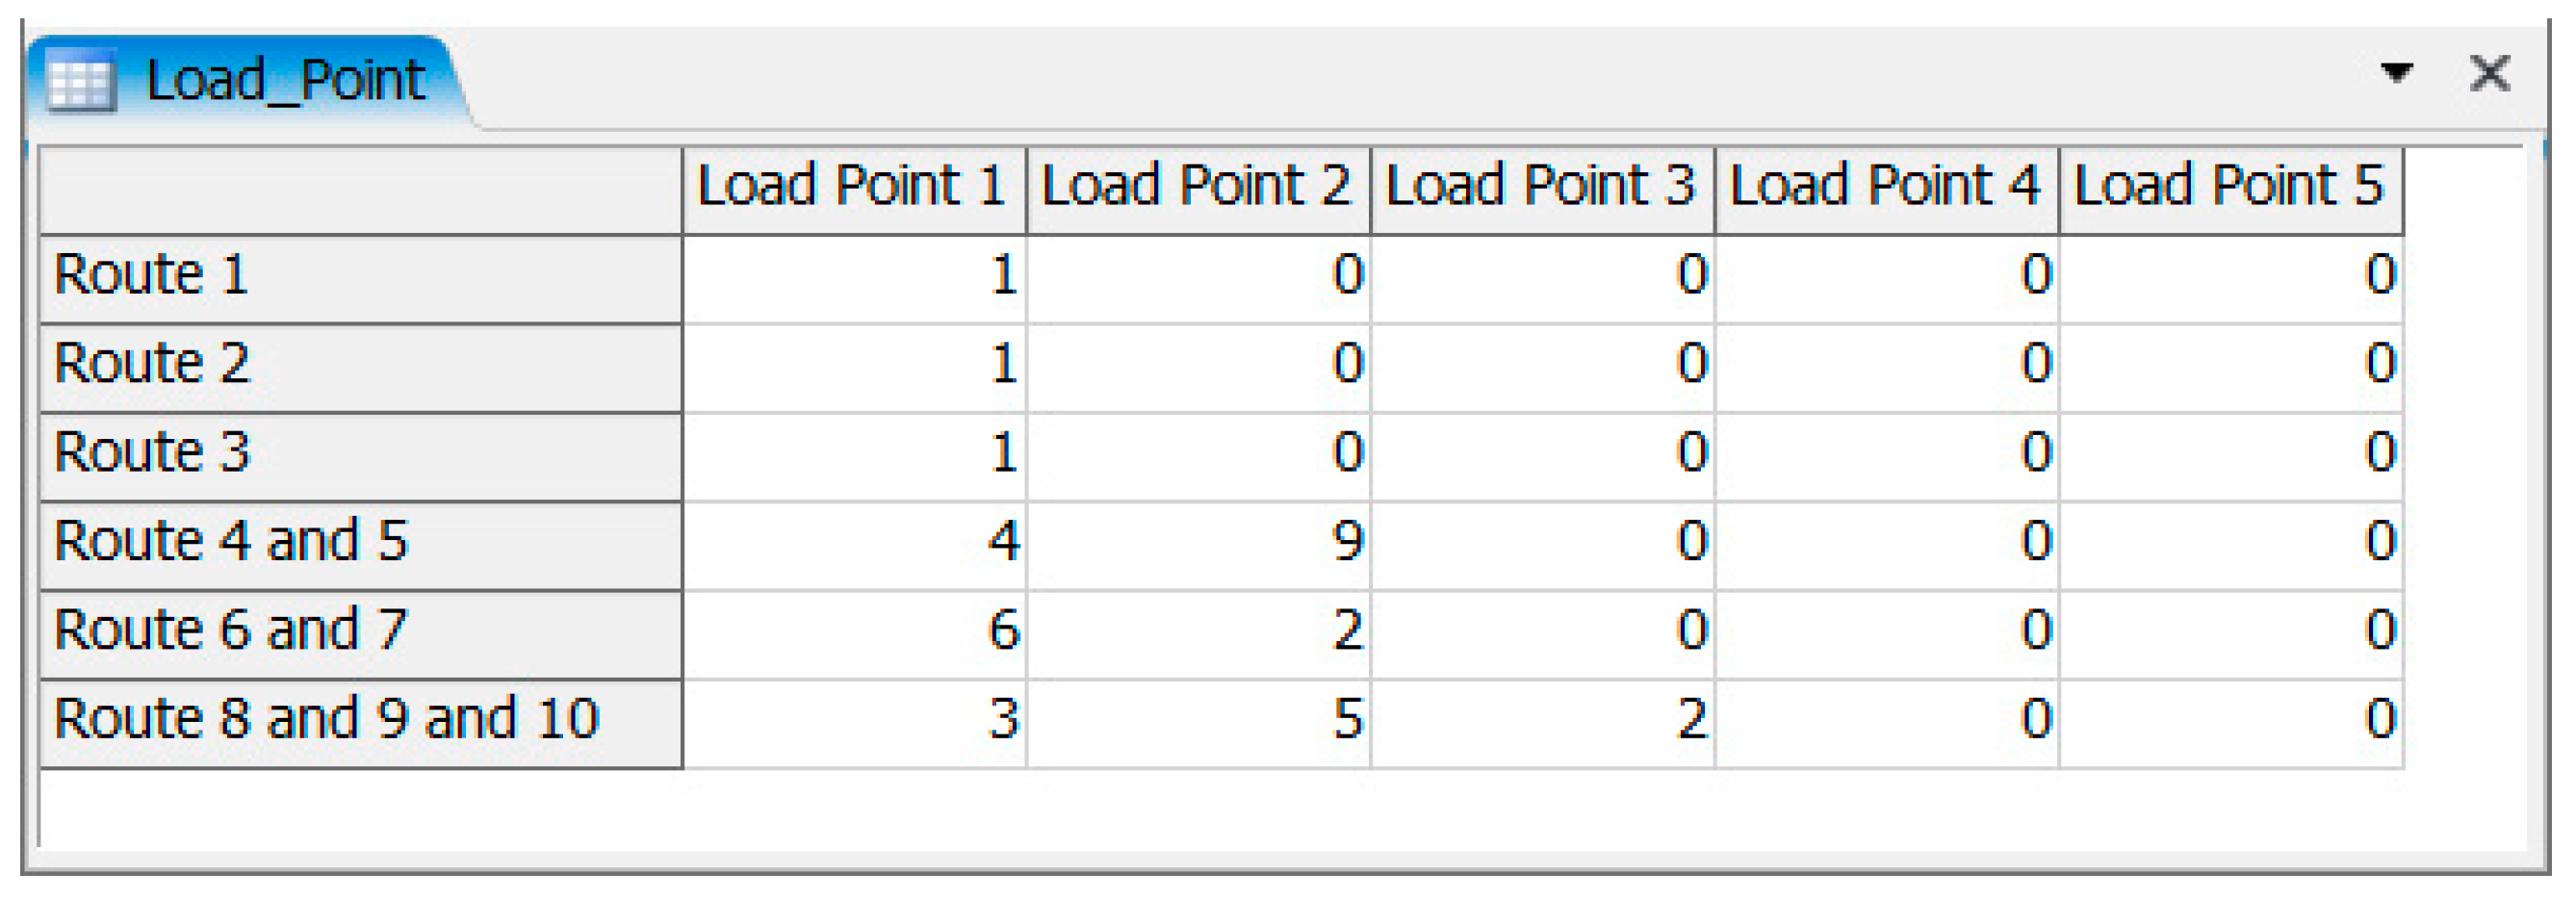
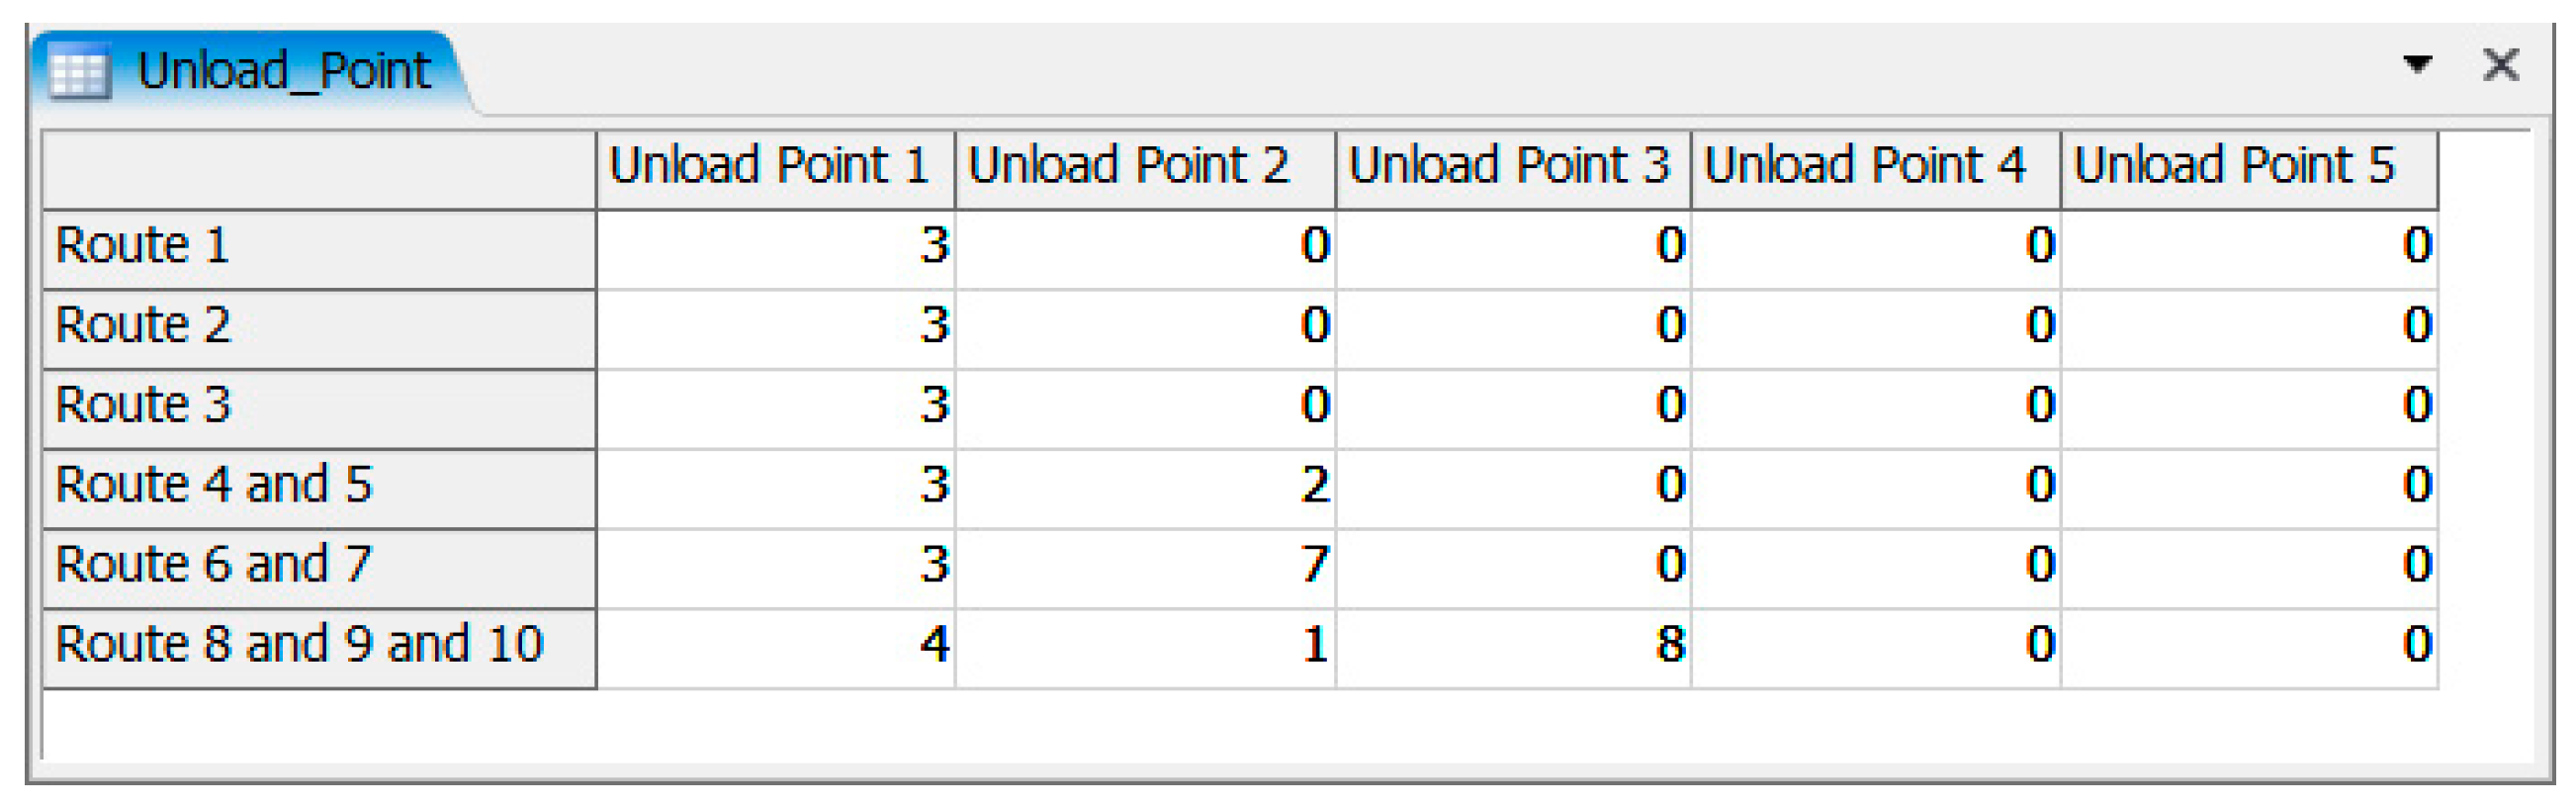
The simulation model is built in that way, that can be used both for simple supply chain (load point–unload point) but also for sustainable supply chain, which can include few load points and few unload points in one order. Depending on the entry information in tables “Load_Point” (
Figure 8) and “Unload_Point” (
Figure 9), the different supply chain will be simulated. Moreover, it was assumed that in one order maximum five load points and maximum five unload points can be added. But the table can be extended by adding next columns. The number 1 in these tables means place 1, 2–place 2, etc. These tables must have the same number of rows as table “Order_info”.
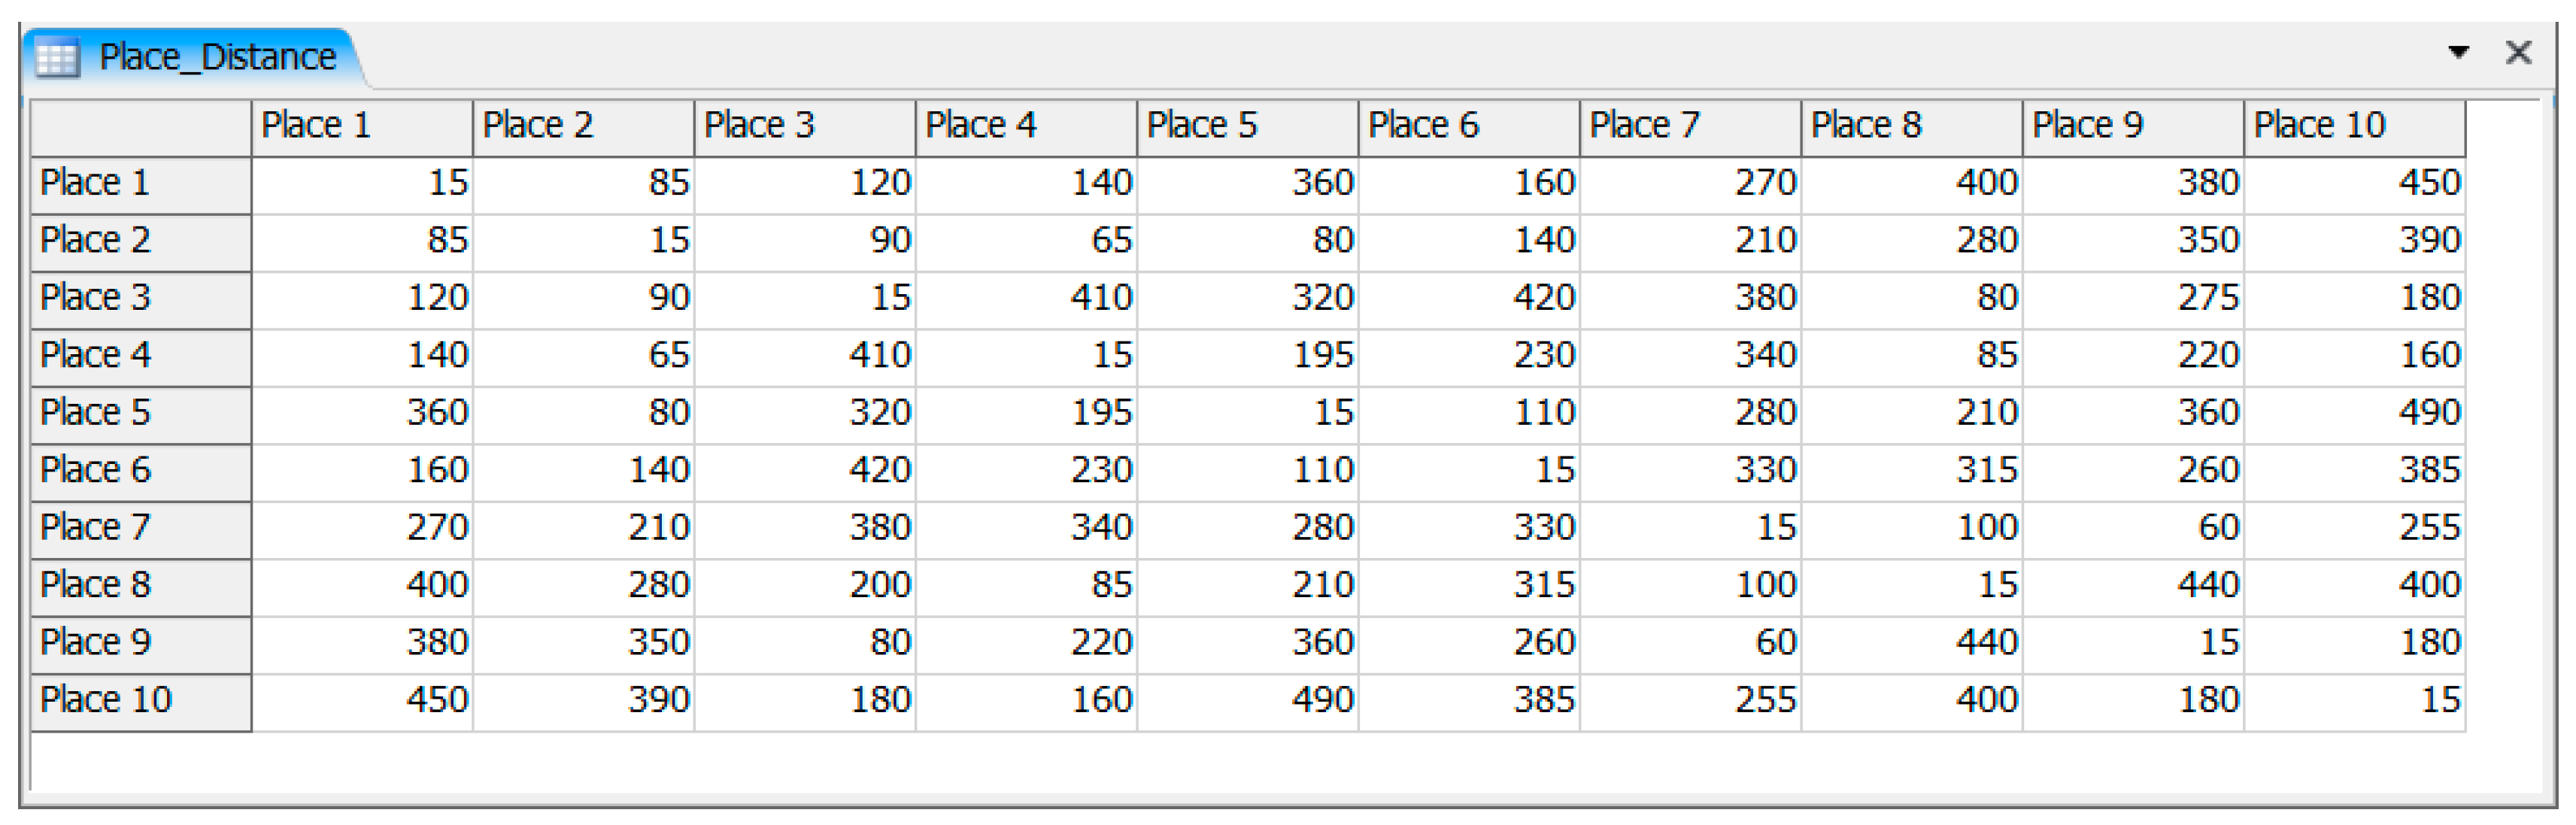
Next table “Place_Distance” (
Figure 10) is connected with tables “Load_Point” and “Unload_Point”. In this table, are added information about distance between each place. These distances are expressed in km units. The places intentionally do not have a city name, because for the purpose of this article it is not necessary. Analyzing one example of order–order first, it can be noticed that orders are loaded in point 1 and unloaded in point 3. From “Place_Distance” table can be read, that distance between this point is equal 120 km.
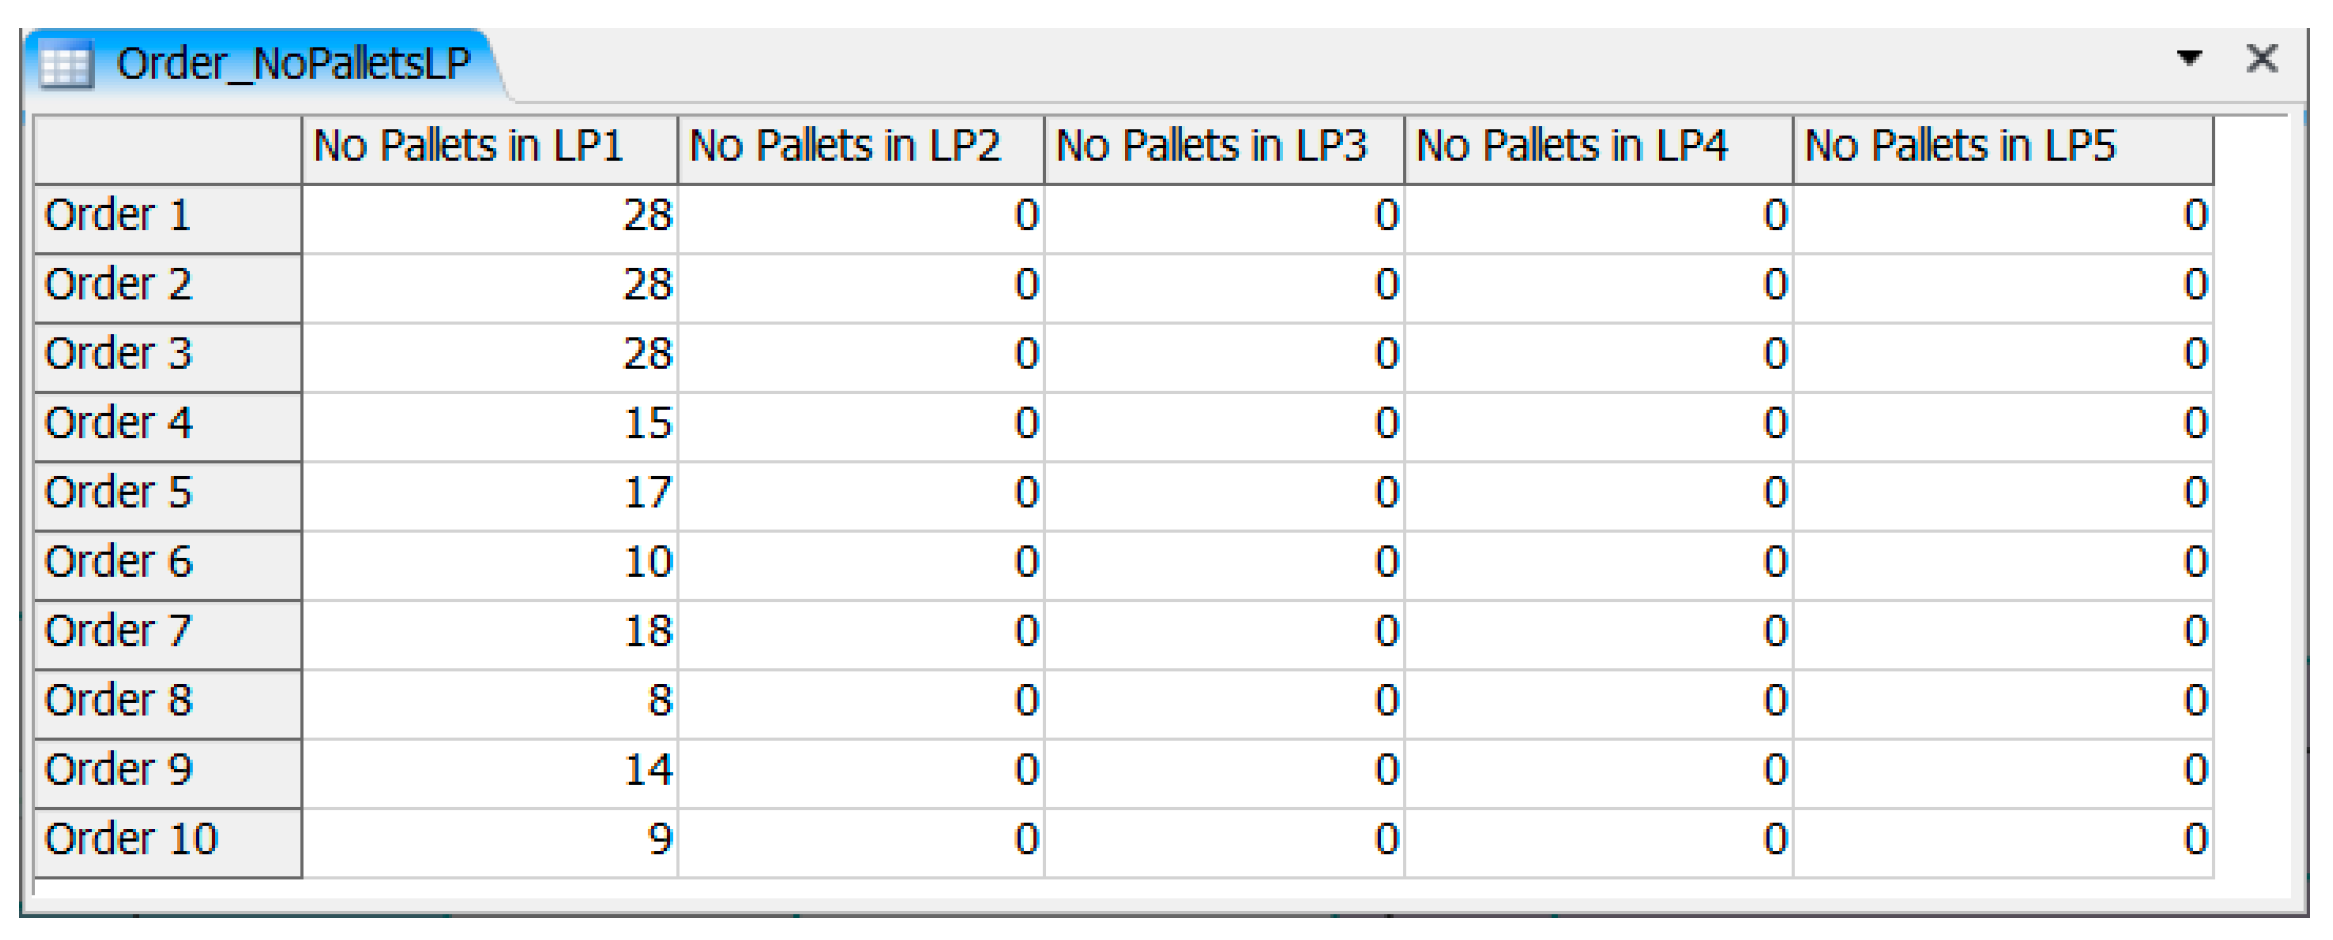
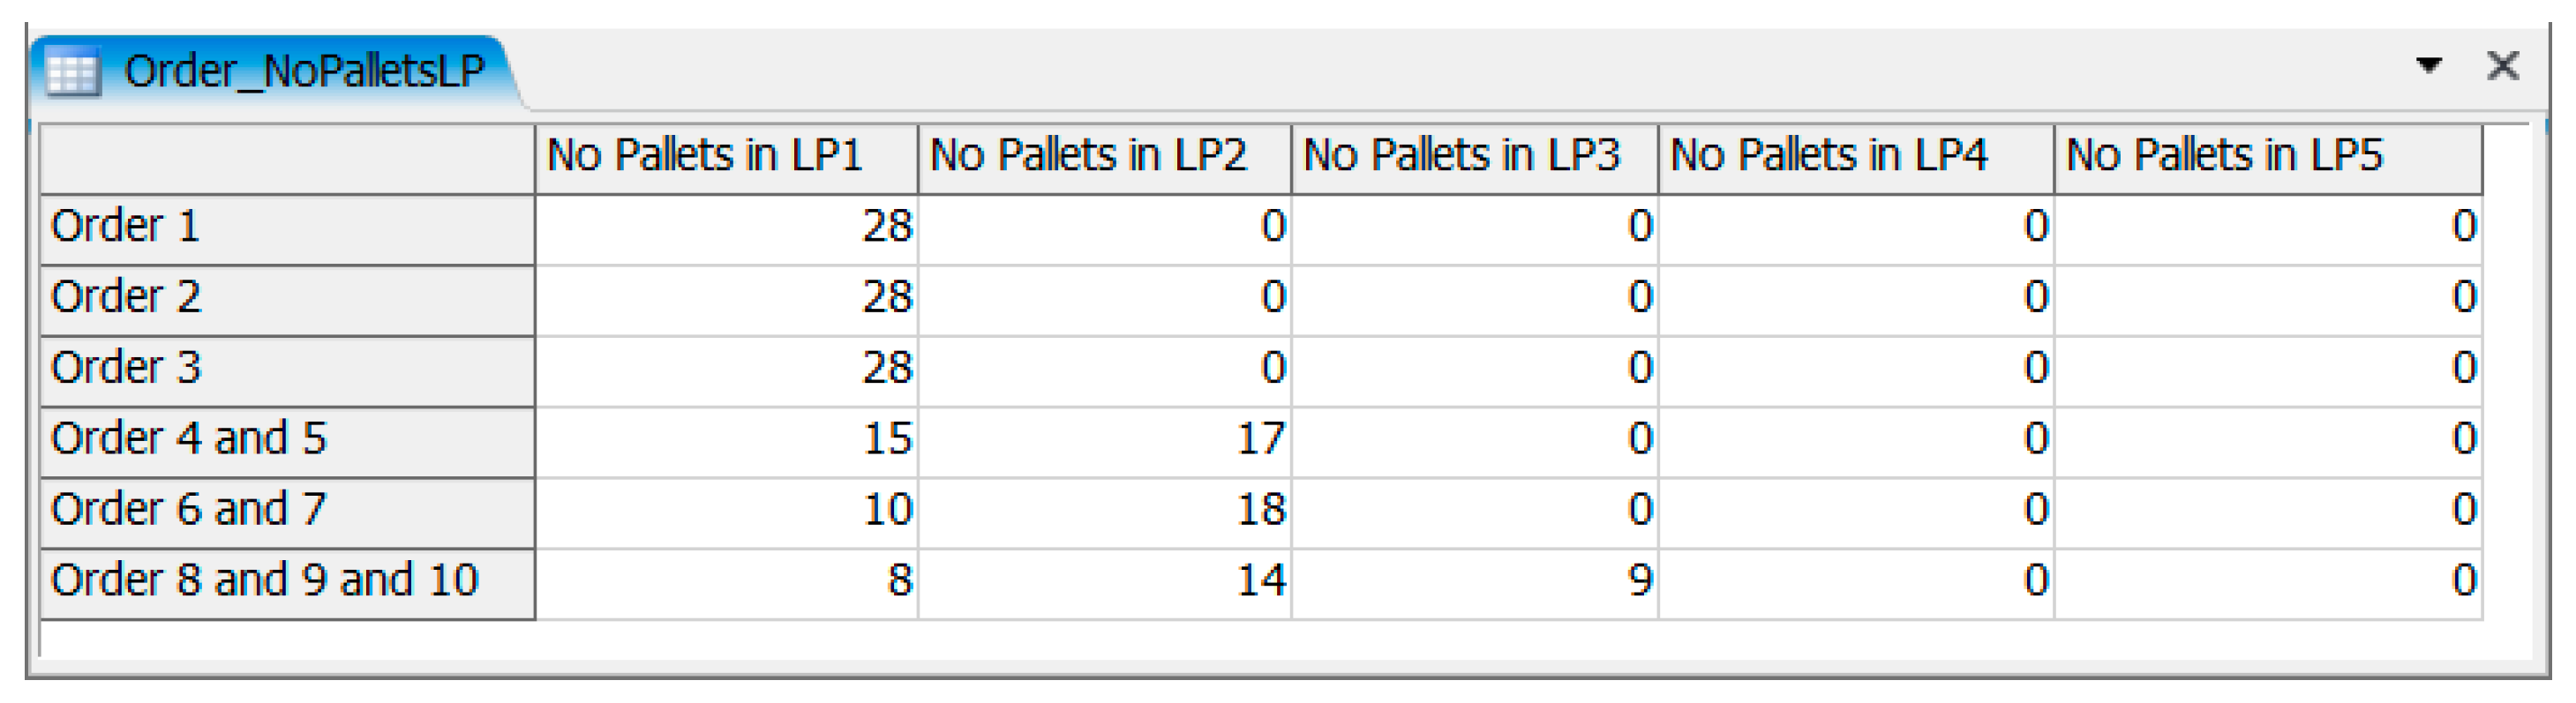
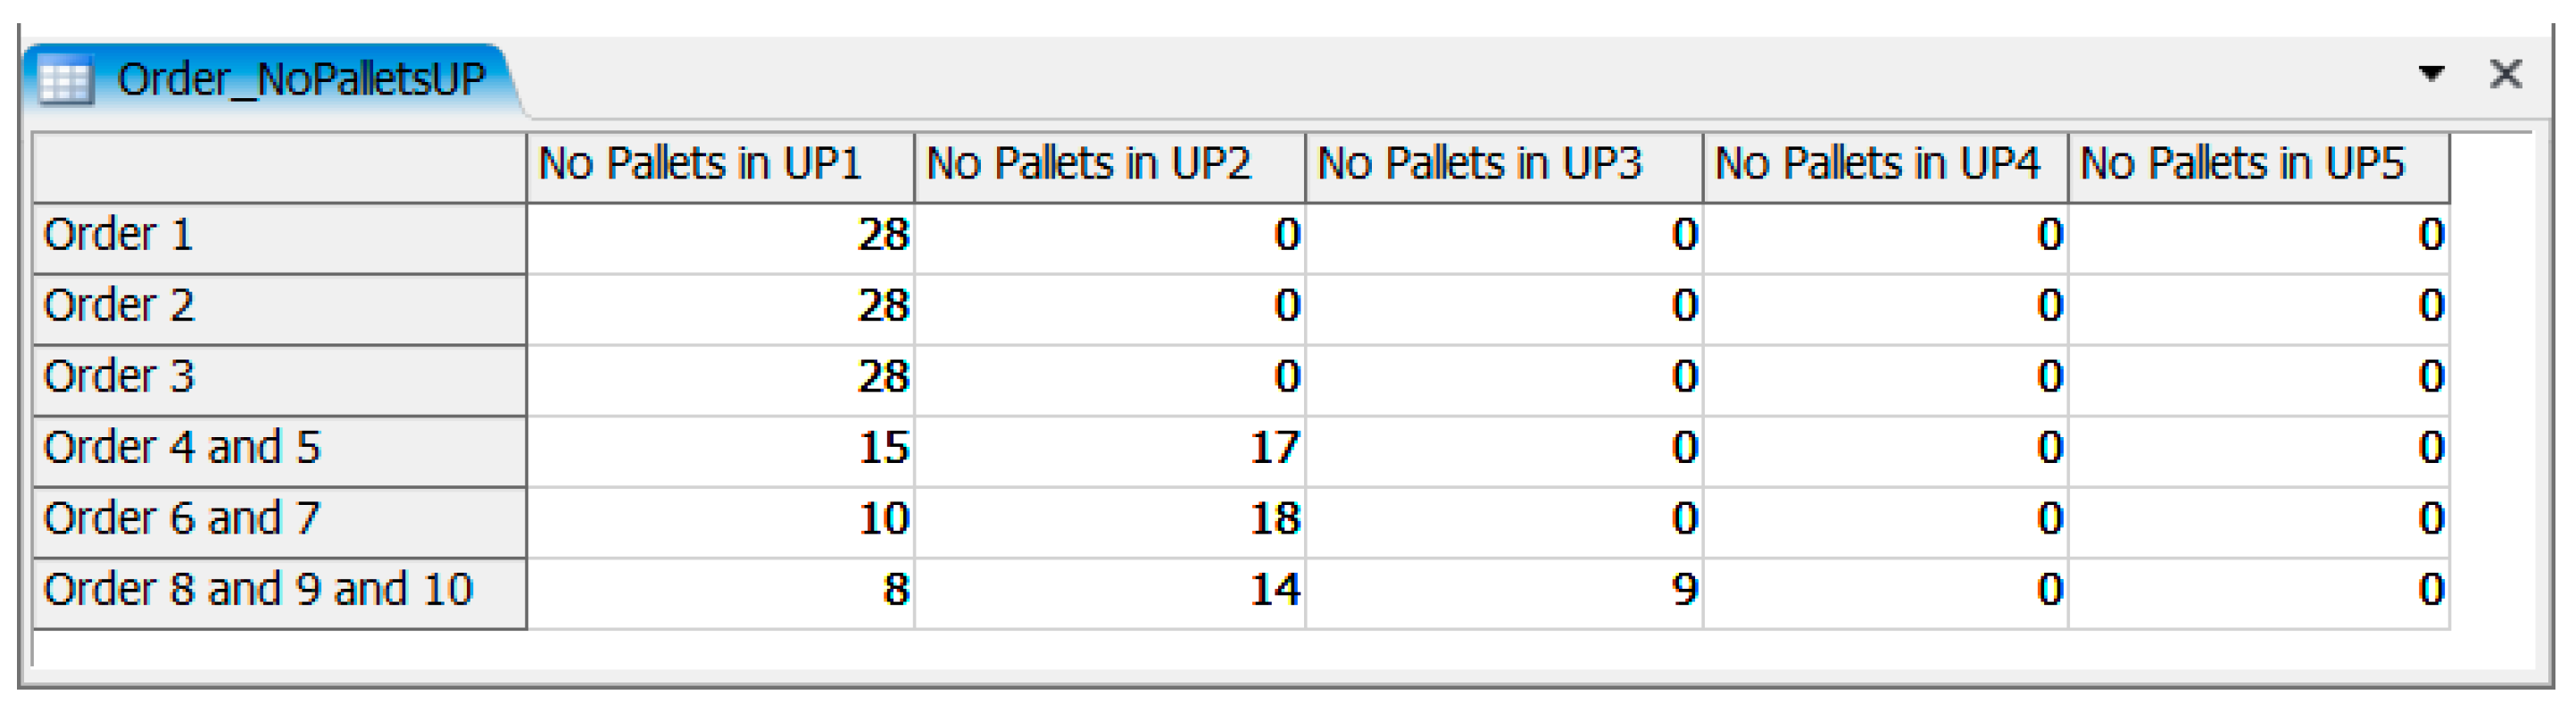
Building one simulation model, which can be used for simple transportation order (one load point—one unload point) and also collaboration transportation order (few load point—few unload point) additional information about number of pallets which are loaded in every load point, and unloaded in every unload points are needed. This information is included in tables “Order_NoPalletsLP” (
Figure 11) and “Order_NoPalletsUP” (
Figure 12). In these tables, the number of rows (orders) has to be the same as in table “Order_info”. Moreover, the sum of number pallets in every row have to be equal the number of pallets in table “Order_info” for the proper order. It has to be checked by person who used the simulation model. The quality of results depends of the quality of input data.
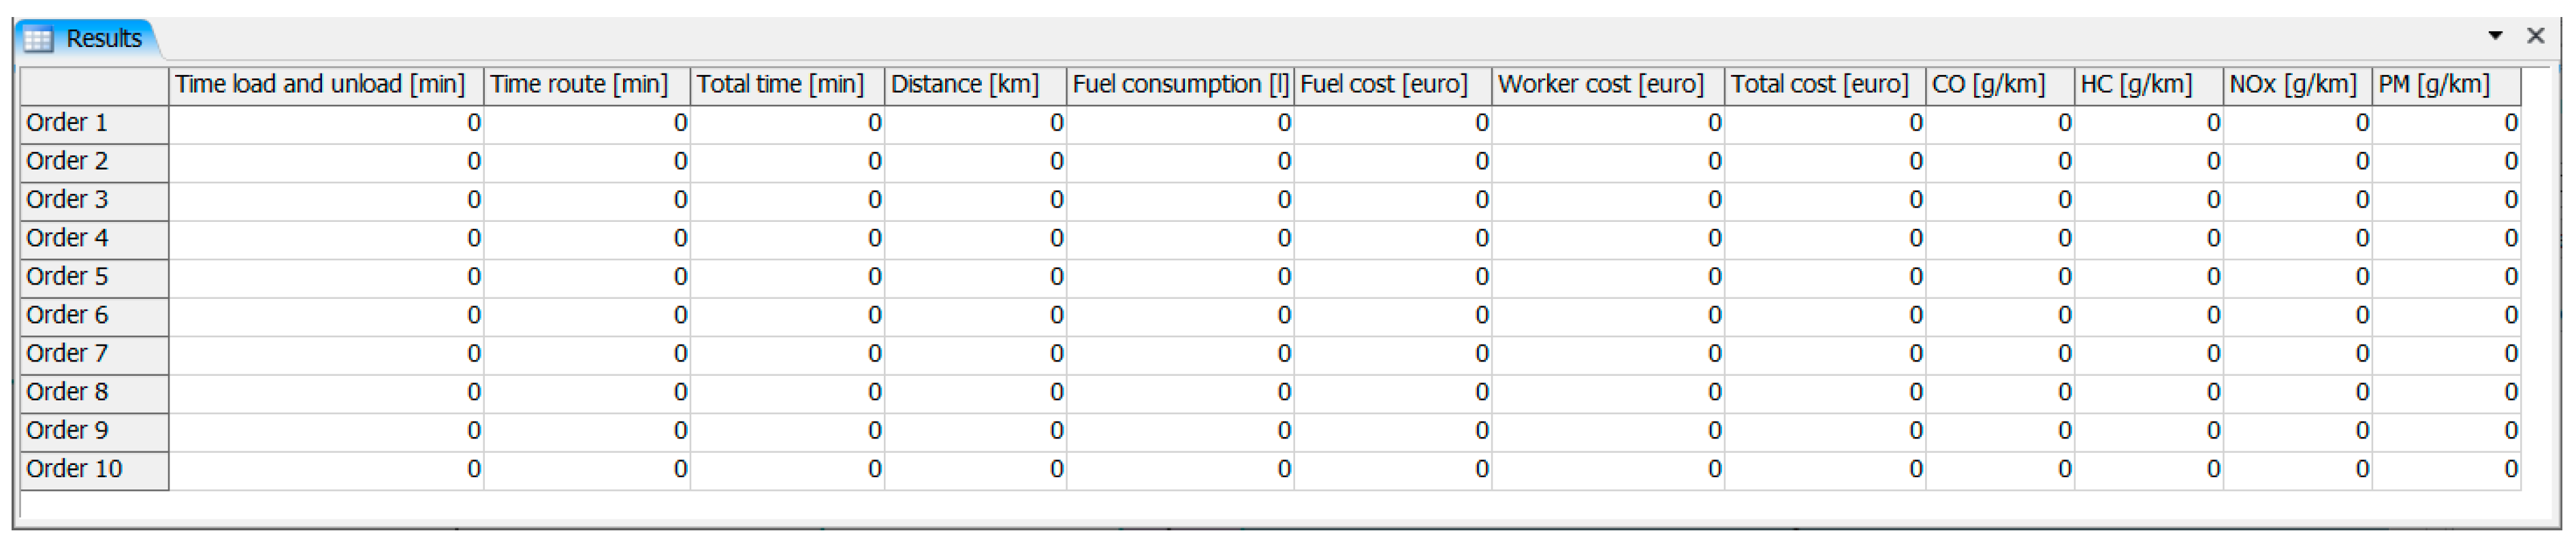
The last table is table “Results” (
Figure 13), in which during simulation results are saved. Based on created simulation model the time, cost and ecological aspects are counted for every transport order.
3.2. Logical Process in Simulation Model
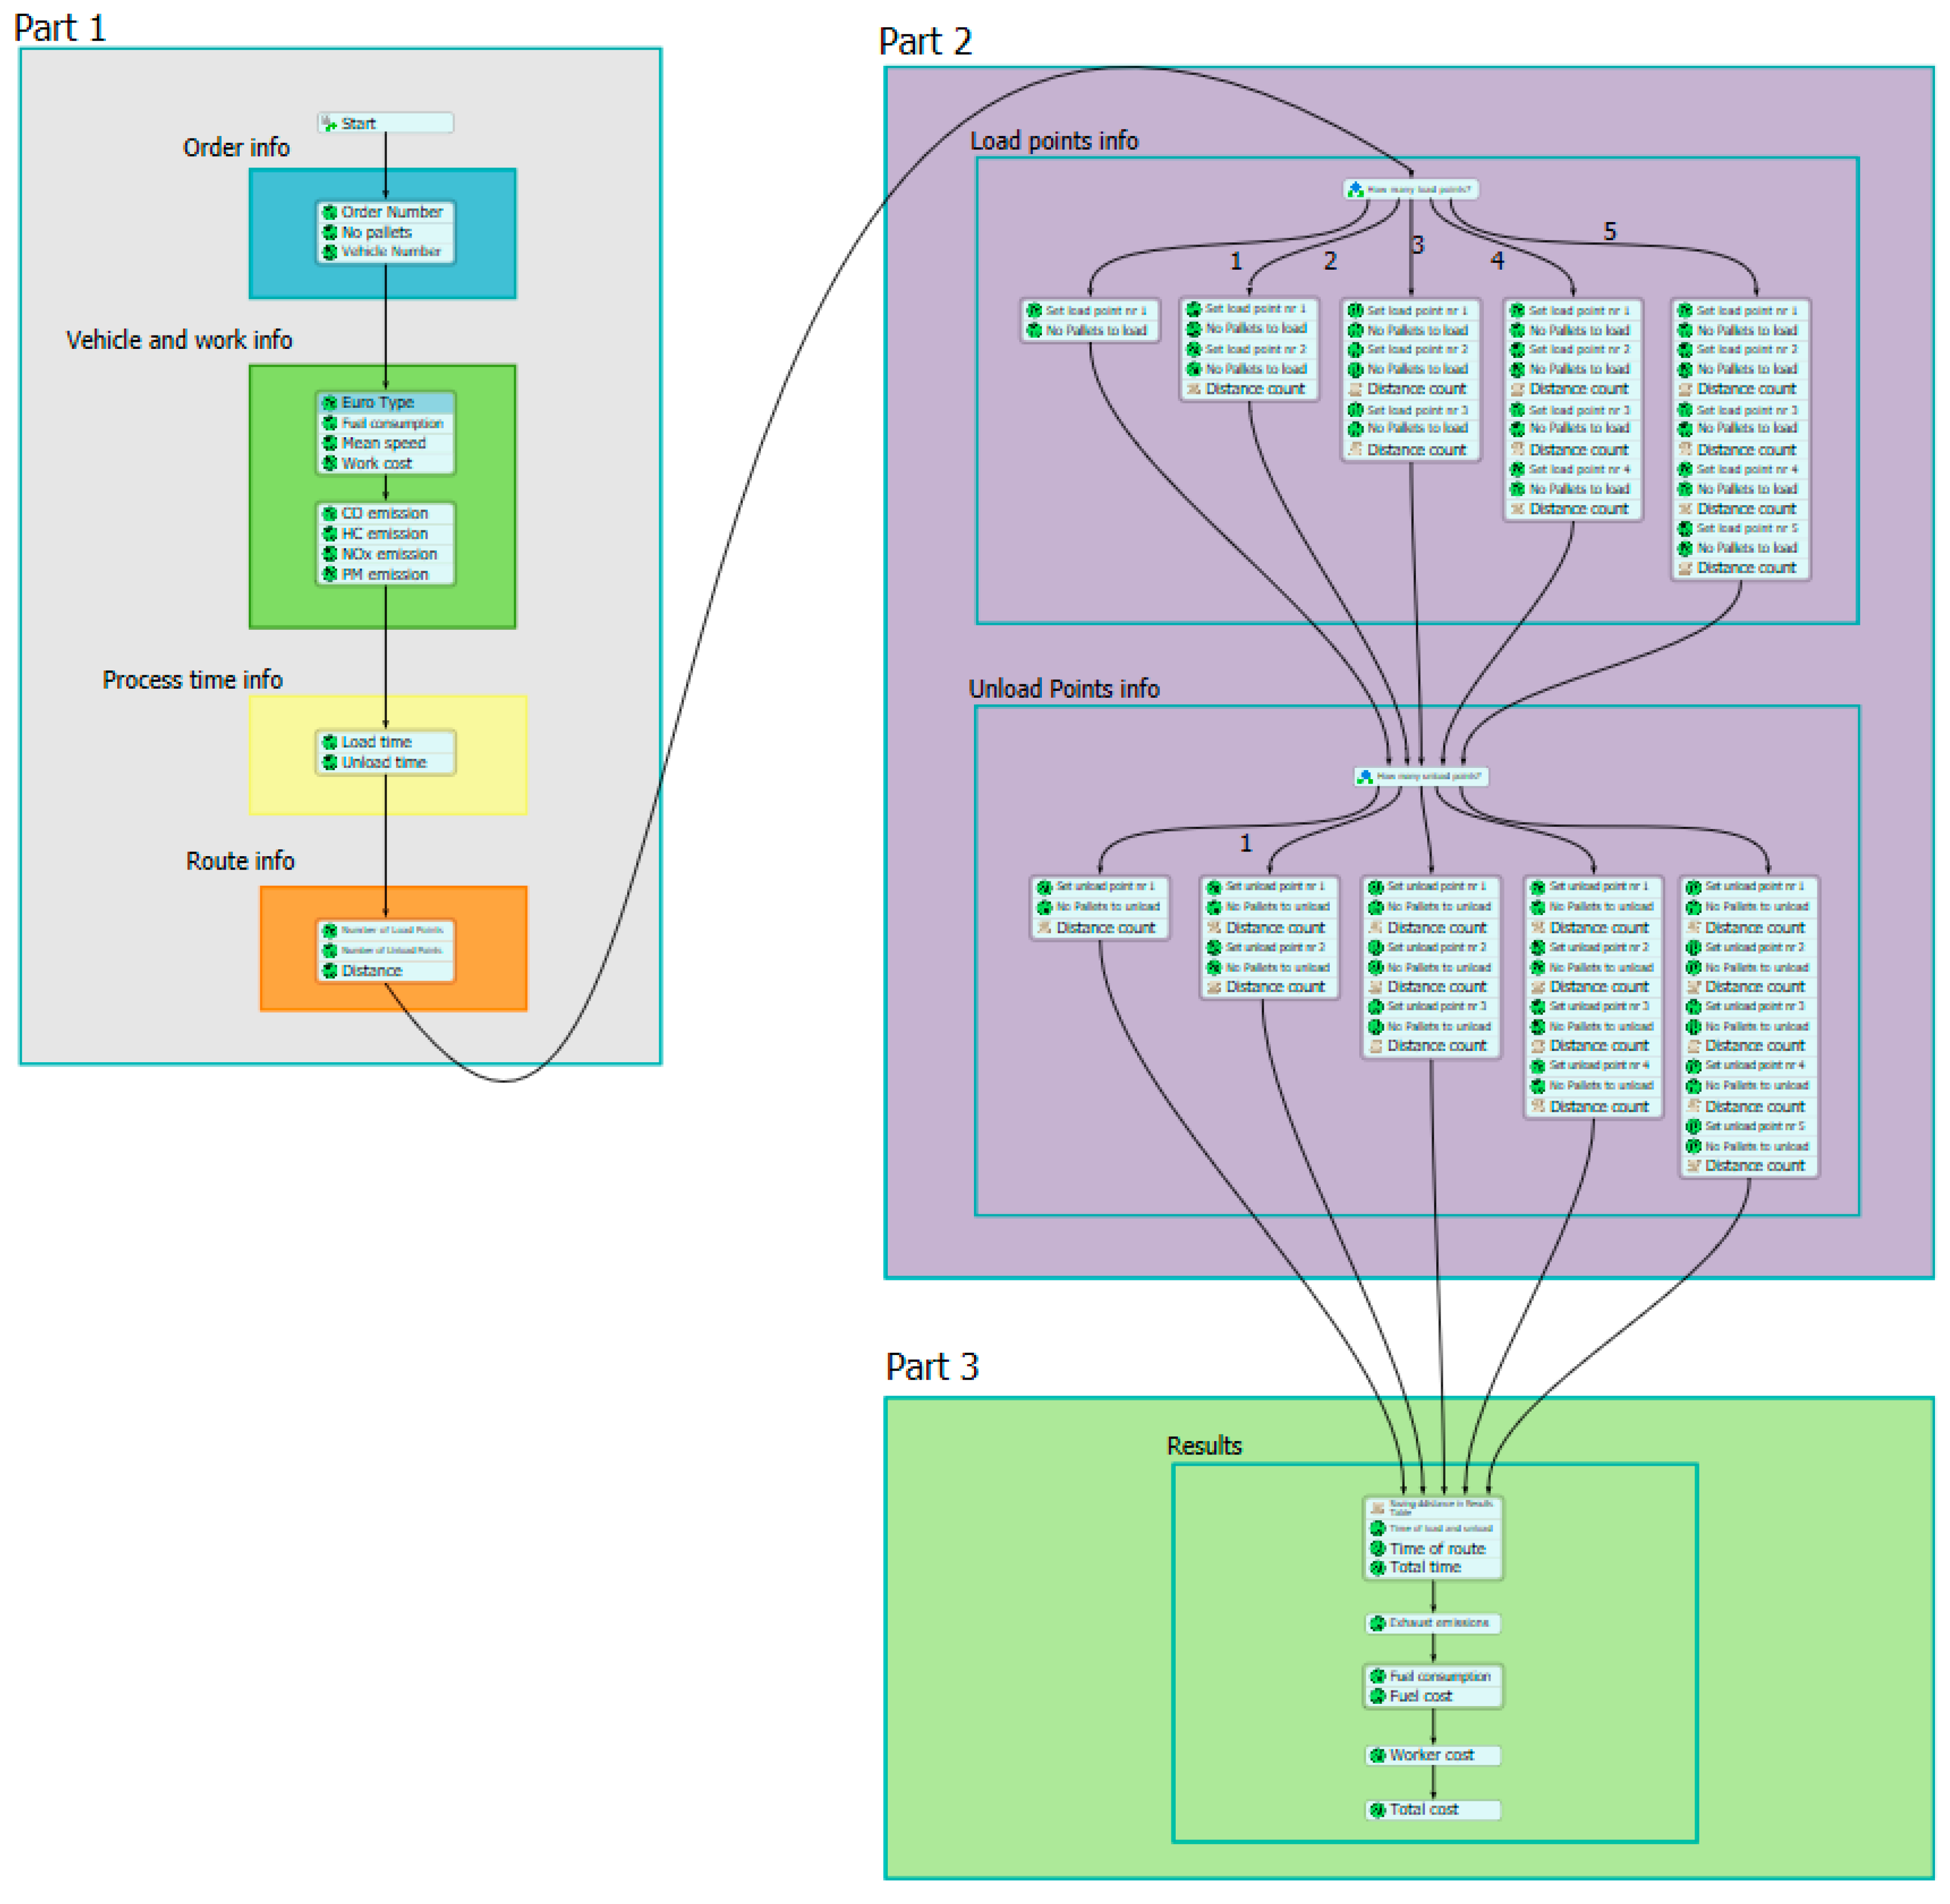
Second part in described simulation model is the logical process, which looks like an algorithm (
Figure 14). This logical process can be divided into three parts:
Part 1—in which the basic information from global tables are downloaded, as: order info, vehicle and worker info, process time and route info;
Part 2—in which information about load points and unload points for every order are complemented;
Part 3—in which results are calculated and saved in table “Results” for future presentation.
The logical process looks simple. However, in every point (cube) some programming code is added. For purpose of this article—to present the advantages of sustainable supply chain (in which the cooperation and connection of transport orders are taken into account)—a comparison to a simple supply chain this model is adequate. In next chapter, this will be proven based on results. Currently, at part 2 is permanently determined that maximum 5 load or unload point can be defined in order. The authors intentionally defined this step like that, to better illustrate the idea of describing the number of, and quantity on, the load point.
4. Experiments
Sixteen experiments were made. The experiments were divided into two cases:
In the first case, authors made experiments of single supply chain (10 order);
In second case, some orders from step 1 were combined to show the advantages of cooperation. In case 2, the following orders are combined: orders 4 and 5, orders 6 and 7, and orders 8, 9 and 10.
Defined next, the first three experiments that the authors made were intentionally very similar—the same route, the same order quantity, but changed the vehicle used (with different Euro norm). Thank to this, the economic and ecologic benefits of using truck with higher norm standard can be showed in simple way. The experiments 1 and 2 and 3 are cases of it—in first truck with norm 5 was used, in second with norm 4, and in third with norm 6.
All entry data for case 1 are presented at point 3.1 in this article. In case 2 these tables were changed:
“Order_info” (
Figure 15)—for consolidated orders, the quantity of number pallets was summed up;
“Order_NoPalletsLP” (
Figure 16)—for consolidated orders, the number of pallets to load are assigned in the right places;
“Order_NoPalletsUP” (
Figure 17)—for consolidated orders, the number of pallets to unload are assigned in the right places;
“Load_point” (
Figure 18)—for consolidated orders, the number of load points are assigned in the right places;
“Unload_Point” (
Figure 19)—for consolidated orders, the number of unload point are assigned in the right places.
For every simulated experiment, the time, distance, cost, and exhaust emissions were calculated. The calculations in these models are simple, but for showing advantages of consolidation orders they are enough. By building a simple model and showing few experiments specific benefits can be presented. The differences of every measurement between situation of consolidation the orders (experiments case 2) and realization single orders (experiments case 1) are presented at
Table 3 and
Table 4. For consolidated orders (line 4, 5 and 6 at
Table 3 and
Table 4), the result was calculated according to the following formula:
where:
—results for calculated factor;
—results for calculated factor for consolidated orders;
—results for calculated factor for single order;
—number of order.
In the presented situation of order’s cooperation, the distance for consolidated orders decreased. Thanks to this, fuel consumption and costs are also lower. Lower distance means lower route time (the simple assumption that route time depends on distance and mean speed of vehicle). It is also equivalent to lower worker cost and total cost. Moreover, thanks to the consolidation of routes, which contributed to decreased of number of kilometers in analyzed cases, the emission exhaust decreased. From environmental point of view it is very important.
In made experiments the first three of them intentionally are the same, but the type of used vehicle is another. In order 1 was used vehicle with Euro 5, in order 2—Euro 4, in order 3—Euro 6. The differences for every measurement between order with using vehicle with the best Euro norm (Euro 6, order 3) and between other orders (1 and 2) are presented at
Table 5 and
Table 6.
The result is calculated according to the following formula:
where:
—results for calculated factor;
—results for calculated factor for order number 3;
—results for calculated factor for order number m;
—number of order,
Analyzing data from
Table 5 and
Table 6, it can be notice that fuel consumption and cost decreased. The worker cost is higher, because it was assumed that hour of work of driver is growing with growing of Euro standard of vehicle. It is also important that the level of NO
x and PM is decreased.
5. Conclusions and Future Work
The simulation is a tool with huge possibilities. At this article’s authors show, the measurable benefits from a simple simulation model of the supply chain and consolidation of transport order to strive for the sustainable supply chain.
Analyzing the obtained results from the simulation model, it can be noticed that consolidation of transportation orders has many advantages. For the presented examples of orders, the cost and emission exhaust decreased. The quantities are not very big—but including scale of realized orders in terms of months, or for big company which have about 250 or more vehicles—the volume of savings will be huge. From the results, it can be noticed also that, depending on the type of vehicle, the exact Euro norm, exhaust emission differences, a higher Euro norm means lower NOx and PM emissions. However, it should be remembered that buying a new car is expensive. Analyzing cost, ecologic and social aspects it should be consider not only the cost of realization orders and amount of exhaust emission in that cases, but also during considering the option of using newer vehicle (with higher Euro norm) the cost of buying it, and the influence for environment (also from production point of view). Instead of buying a new car, the hire of a vehicle can be considered or for the order to be outsourced to another company.
The basic benefits of consolidation’s transport orders are presented by the built model. It is worth distinguishing that, thanks to consolidating the orders, the amount of trucks on the road will decrease, which will also have a positive impact on social aspects, such as less traffic and potentially fewer accidents.
The simulation model can be improved in further work. Firstly, part 2 presented at
Figure 14 should be rebuilt, to be universal for every number of load points and unload points. Secondly, the way of combine orders should be extended—in this paper, the authors present simple way—they combine them only by looking at quantity of pallets to move. In reality, the orders should be also analyzed in terms of dependence of location load and unload point. In addition, the type of used vehicle should be chosen. Thirdly, the calculation of fuel consumption can be extended—different consumption depends on speed of truck, which means also including changed speed for vehicle in model in a different section of road. Besides, getting real data from transport company—their orders, and base of vehicle with all information—will be an invaluable contribution.
Author Contributions
Conceptualization, P.H.-D. and K.G.; methodology, P.H.-D. and K.G.; software, P.H.-D. and K.G.; formal analysis, P.H.-D. and K.G.; resources, P.H.-D. and K.G.; data curation, P.H.-D. and K.G.; writing—original draft preparation, P.H.-D. and K.G.; writing—review and editing, P.H.-D. and K.G.; visualization, P.H.-D. and K.G.; funding acquisition, P.H.-D. and K.G. All authors have read and agreed to the published version of the manuscript.
Funding
This research was funded by POZNAN UNIVERSITY OF TECHNOLOGY, grant number 0812-SBAD-4170.
Conflicts of Interest
The authors declare no conflict of interest.
References
- Saniuk, A.; Saniuk, S.; Caganova, D.; Cambál, M. Control of Strategy Realization in Metallurgical Production. In Proceedings of the 23rd International Conference on Metallurgy and Materials, Brno, Czech Republic, 21–23 May 2014; pp. 1876–1881. [Google Scholar]
- Pawłyszyn, I.; Fertsch, M.; Stachowiak, A.; Pawłowski, G.; Oleśków-Szłapka, J. The Model of Diffusion of Knowledge on Industry 4.0 in Marshallian Clusters. Sustainability 2020, 12, 3815. [Google Scholar] [CrossRef]
- Jasiulewicz-Kaczmarek, M.; Gola, A. Maintenance 4.0 Technologies for Sustainable Manufacturing—An Overview. IFAC PapersOnLine 2019, 52, 91–96. [Google Scholar] [CrossRef]
- Burduk, A. The Role of Artificial Neural Network Models in Ensuring the Stability of Systems. In 10th International Conference on Soft Computing Models in Industrial and Environmental Applications; Herrero, A., Sedano, J., Baruque, B., Quintián, H., Corchado, E., Eds.; Springer: Berlin, Germany, 2015; pp. 427–437. [Google Scholar]
- Saniuk, S.; Grabowska, S.; Gajdzik, B. Social Expectations and Market Changes in the Context of Developing the Industry 4.0 Concept. Sustainability 2020, 12, 1362. [Google Scholar] [CrossRef]
- Grzybowska, K.; Łupicka, A. Future Competencies in the Automotive Industry–Practitioners’ Opinions. In Proceedings of the 30th IBIMA Conference, Madrid, Spain, 8–9 November 2017; pp. 5199–5208. [Google Scholar]
- Grabowska, S. Improvement of the Heat Treatment Process in the Industry 4.0 Context. In Proceedings of the 27th International Conference on Metallurgy and Materials, Brno, Czech Republic, 23–25 May 2018; pp. 1985–1990. [Google Scholar]
- Souza, J.P.E.; Alves, J.M. Lean-integrated Management System: A Model for Sustainability Improvement. J. Clean. Product. 2018, 172, 2667–2682. [Google Scholar] [CrossRef]
- Seuring, S. Assessing the Rigor of Case Study Research in Supply Chain Management. Supply Chain Manag. 2008, 13, 128–137. [Google Scholar] [CrossRef]
- Surana, A.; Kumara, S.; Greaves, M.; Raghavan, U.N. Supply Chain Networks: A Complex Adaptive Systems Perspective. Int. J. Product. Res. 2005, 43, 4235–4265. [Google Scholar] [CrossRef]
- Grzybowska, K.; Hoffa, P. Approving with Application of an Electronic Bulletin Board, as a Mechanism of Coordination of Actions in Complex Systems. In Distributed Computing and Artificial Intelligence, 12th International Conference Advances in Intelligent Systems and Computing; Springer: Cham, Switzerland, 2015; Volume 373, pp. 357–365. [Google Scholar]
- Grzybowska, K.; Stachowiak, A. Classification of Trends and Supply Chains Development Directions. In Smart and Sustainable Supply Chain and Logistics–Trends, Challenges, Methods and Best Practices; Golińska, P., Ed.; Springer Nature: Cham, Switzerland, 2020; in press. [Google Scholar]
- Kiciński, M.; Witort, P.; Merkisz-Guranowska, A. Multiple Criteria Optimization for Supply Chains—Analysis of Case Study. In Integration as Solution for Advanced Smart Urban Transport Systems; Sierpiński, G., Ed.; Springer: Berlin, Germany, 2019; Volume 844, pp. 150–160. [Google Scholar]
- Wieczerniak, S.; Cyplik, P.; Milczarek, J. Root Cause Analysis Methods as a Tool of Effective Change. In Proceedings of the 17th International Scientific Conference on Business Logistics in Modern Management, Osijek, Croatia, 12–13 October 2017; pp. 611–627. [Google Scholar]
- Oelze, N.; Gruchmann, T.; Brandenburg, M. Motivating Factors for Implementing Apparel Certification Schemes–A Sustainable Supply Chain Management Perspective. Sustainability 2020, 12, 4823. [Google Scholar] [CrossRef]
- Mardani, A.; Kannan, D.; Hooker, R.E. Evaluation of Green and Sustainable Supply Chain Management Using Structural Equation Modelling: A Systematic Review of the State of the Art Literature and Recommendations for Future Research. J. Clean. Prod. 2020, 249. in press. [Google Scholar] [CrossRef]
- Seuring, S.; Muller, M. From A Literature Review to a Conceptual Framework for Sustainable Supply Chain Management. J. Clean. Prod. 2008, 16, 1699–1710. [Google Scholar] [CrossRef]
- Koberg, E.; Longoni, A. A Systematic Review of Sustainable Supply Chain Management in Global Supply Chains. J. Clean. Prod. 2019, 207, 1084–1098. [Google Scholar] [CrossRef]
- Etzion, D. Management for Sustainability. Nat. Sustain. 2018, 1, 744–749. [Google Scholar] [CrossRef]
- Wróbel, G.; Oleśków-Szłapka, J. Simulation Method for the Benefits of a Small Business in Sustainable World. In Energy Audit Methodology and Energy Savings Plan in the Nautical Industry; Pawlewski, P., Greenwood, A., Eds.; Springer: Cham, Switzerland, 2014; pp. 3–21. [Google Scholar]
- Kleijnen, J. Supply Chain Simulation Tools and Techniques: A Survey. Int. J. Simul. Process Model. 2005, 1, 82–89. [Google Scholar] [CrossRef]
- Sitek, P.; Wikarek, J. A Multi-level Approach to Ubiquitous Modeling and Solving Constraints in Combinatorial Optimization Problems in Production and Distribution. Appl. Intell. 2018, 48, 1344–1367. [Google Scholar] [CrossRef]
- Sitek, P.; Wikarek, J.; Nielsen, P. A Constraint-driven Approach to Food Supply Chain Management. Ind. Manag. Data Syst. 2017, 117, 2115–2138. [Google Scholar] [CrossRef]
- Juszczyński, M.; Kowalski, A. Achieving Desired Cycle Times by Modelling Production Systems. In Lecture Notes in Computer Science; Saeed, K., Chaki, R., Cortesi, A., Wierzchoń, S., Eds.; Springer: Berlin, Germany, 2013; Volume 8104, pp. 476–486. [Google Scholar]
- Chanchaichujit, J.; Pham, Q.C.; Tan, A. Sustainable Supply Chain Management: A Literature Review of Recent Mathematical Modelling Approaches. Int. J. Logist. Syst. Manag. 2019, 33, 467–496. [Google Scholar] [CrossRef]
- Rebs, T.; Brandenburg, M.; Seuring, S. System Dynamics Modeling for Sustainable Supply Chain Management: A Literature Review and Systems Thinking Approach. J. Clean. Product. 2019, 208, 1265–1280. [Google Scholar] [CrossRef]
- Wang, P.C.; Halim, I.; Adhitya, A.; Srinivasan, R. Integrating Economic, Environmental and Social Indicators for Sustainable Supply Chains. Comput. Aided Chem. Eng. 2011, 29, 1220–1224. [Google Scholar]
- Pomponi, F.; Moncaster, A. Circular Economy for the Built Environment: A Research Framework. J. Clean. Prod. 2017, 143, 710–718. [Google Scholar] [CrossRef]
- Kakkos, E.; Heisel, F.; Hebel, D.E.; Hischier, R. Towards Urban Mining—Estimating the Potential Environmental Benefits by Applying an Alternative Construction Practice. A Case Study from Switzerland. Sustainability 2020, 12, 5041. [Google Scholar] [CrossRef]
- Hong, J.; Alzaman, C.; Diabat, A.; Bulgak, A.A. Sustainability Dimensions and PM2.5 in Supply Chain Logistics. Ann. Oper. Res. 2019, 275, 339–366. [Google Scholar] [CrossRef]
- Alzaman, C. Impact of Optimisation on Idle Time’s Fuel Consumption and CO2 Emissions in Urban Transportation. Int. J. Bus. Perform. Supply Chain Model. 2016, 8, 157–179. [Google Scholar] [CrossRef]
- Georgiadis, P.; Iakovou, E.; Vlachos, D.; Besiou, M. A System Dynamics Modeling Approach of Ecological Motivation in Sustainable Supply Chains. WSEAS Trans. Syst. 2006, 5, 48–55. [Google Scholar]
- Hidayatno, A.; Zulkarnain; Hasibuan, R.G.; Nimpuno, G.C.W.; Destyanto, A.R. Designing a Serious Simulation Game as a Learning Media of Sustainable Supply Chain Management for Biofuel Production. Energy Procedia 2019, 156, 43–47. [Google Scholar] [CrossRef]
- Li, C. An Integrated Approach to Evaluating the Production System in Closed-loop Supply Chains. Int. J. Product. Res. 2013, 51, 4045–4069. [Google Scholar] [CrossRef]
- Mehmann, J.; Teuteberg, F. The Fourth-party Logistics Service Provider Approach to Support Sustainable Development Goals in Transportation–A Case Study of the German Agricultural Bulk Logistics Sector. J. Clean. Product. 2016, 126, 382–393. [Google Scholar] [CrossRef]
- Sahay, N.; Ierapetritou, M. Supply Chain Management Using an Optimization Driven Simulation Approach. AIChE J. 2013, 59, 4612–4626. [Google Scholar] [CrossRef]
- Shamsuddoha, M.; Quaddus, M.; Klass, D. Sustainable Poultry Production Process to Mitigate Socio-Economic Challenge. Humanomics 2015, 31, 242–259. [Google Scholar] [CrossRef]
- Yan, M.-R.; Chein, K.-M.; Yang, T.-N. Green Component Procurement Collaboration for Improving Supply Chain Management in the High Technology Industries: A Case Study from the Systems Perspective. Sustainability 2016, 8, 105. [Google Scholar] [CrossRef]
- FlexSim Home Page. Available online: https://www.flexsim.com/ (accessed on 22 May 2020).
- NGK SPARK PLUG Home Page. Available online: http://www.ngk.de/pl (accessed on 15 October 2015).
- NOXy Home Page. Available online: http://noxy.eu/pl/normy-technologia-scr (accessed on 10 October 2015).
Figure 1.
Comparison of number of articles for searching case 3 and 4; own study by Scopus data (access data: May 2020).
Figure 1.
Comparison of number of articles for searching case 3 and 4; own study by Scopus data (access data: May 2020).
Figure 2.
Comparison of searched papers in case 3 and 4 by country or territory. Source: Scopus data (access data: May 2020).
Figure 2.
Comparison of searched papers in case 3 and 4 by country or territory. Source: Scopus data (access data: May 2020).
Figure 3.
Table “Order_info”; own study with use FlexSim program.
Figure 3.
Table “Order_info”; own study with use FlexSim program.
Figure 4.
Table “Vehicle_info”; own study with use FlexSim program.
Figure 4.
Table “Vehicle_info”; own study with use FlexSim program.
Figure 5.
Table “Euro_Standards”; own study with use FlexSim program.
Figure 5.
Table “Euro_Standards”; own study with use FlexSim program.
Figure 6.
Table “Info”; own study with use FlexSim program.
Figure 6.
Table “Info”; own study with use FlexSim program.
Figure 7.
Table “Time”; own study with use FlexSim program.
Figure 7.
Table “Time”; own study with use FlexSim program.
Figure 8.
Table “Load_Point”; own study with use FlexSim program.
Figure 8.
Table “Load_Point”; own study with use FlexSim program.
Figure 9.
Table “Unload_Point”; own study with use FlexSim program.
Figure 9.
Table “Unload_Point”; own study with use FlexSim program.
Figure 10.
Table “Place_Distance”; own study with use FlexSim program.
Figure 10.
Table “Place_Distance”; own study with use FlexSim program.
Figure 11.
Table “Order_NoPalletsLP”; own study with use FlexSim program.
Figure 11.
Table “Order_NoPalletsLP”; own study with use FlexSim program.
Figure 12.
Table “Order_NoPalletsUP”; own study with use FlexSim program.
Figure 12.
Table “Order_NoPalletsUP”; own study with use FlexSim program.
Figure 13.
Table “Results”; own study with use FlexSim program.
Figure 13.
Table “Results”; own study with use FlexSim program.
Figure 14.
Logical process for transportation simulation model; own study with use FlexSim program.
Figure 14.
Logical process for transportation simulation model; own study with use FlexSim program.
Figure 15.
Table “Order_info” in experiment case 2; own study with use FlexSim program.
Figure 15.
Table “Order_info” in experiment case 2; own study with use FlexSim program.
Figure 16.
Table “Order_NoPalletsLP” in experiment case 2; own study with use FlexSim program.
Figure 16.
Table “Order_NoPalletsLP” in experiment case 2; own study with use FlexSim program.
Figure 17.
Table “Order_NoPalletsUP” in experiment case 2; own study with use FlexSim program.
Figure 17.
Table “Order_NoPalletsUP” in experiment case 2; own study with use FlexSim program.
Figure 18.
Table “Load_Point” in experiment case 2; own study with use FlexSim program.
Figure 18.
Table “Load_Point” in experiment case 2; own study with use FlexSim program.
Figure 19.
Table “Unload_Point” in experiment case 2; own study with use FlexSim program.
Figure 19.
Table “Unload_Point” in experiment case 2; own study with use FlexSim program.
Table 1.
Search results for simulation sustainable supply chain; (access data: May 2020); own work.
Table 1.
Search results for simulation sustainable supply chain; (access data: May 2020); own work.
| No Case | Keyword Kit | Where (Place of Searching) | Search Results (Number of Documents) |
|---|
| 1 | simulation sustainable supply chain | All fields | 18,659 |
| 2 | simulation sustainable supply chain | Article title, Abstract, Keywords | 464 |
| 3 | “simulation” AND “sustainable supply chain” | All fields | 2500 |
| 4 | “simulation” AND “sustainable supply chain” | Article title, Abstract, Keywords | 62 |
| 5 | “simulation” AND “sustainable supply chain” AND “case study” | All fields | 1848 |
| 6 | “simulation” AND “sustainable supply chain” AND “case study” | Article title, Abstract, Keywords | 10 |
Table 2.
Case studies for using simulation in aspects of the sustainable supply chain; Source: [
33,
34,
35,
36,
37,
38].
Table 2.
Case studies for using simulation in aspects of the sustainable supply chain; Source: [
33,
34,
35,
36,
37,
38].
| Author and Data | Article Title | Content |
|---|
| Hidayatno, A. et al., 2019 [33] | Designing a serious simulation game as a learning media of sustainable supply chain management for biofuel production | At this article the Serious Simulation Game (SSG) that focuses on the purchasing, production, sales, and finance functions, using case studies of companies that run crude palm oil mills is designed. |
| Mehmann J., Teuteberg F., 2016 [35] | The fourth-party logistics service provider approach to support sustainable development goals in transportation—A case study of the German agricultural bulk logistics sector | Authors used a mixed-methods approach (qualitative insights based on semi-structured interviews and quantitative insights based on simulations) for integrate a fourth-party logistics service provider in the German Agricultural Bulk Logistics sector for achieve sustainable in transportation, i.e., by realizing full truck loads. |
| Yan et al., 2016 [38] | Green component procurement collaboration for improving supply chain management in the high technology industries: A case study from the systems perspective | In the paper two different supply chain collaboration models, from multi-layer ceramic capacitor (MLCC) and universal serial bus 3.0 (USB 3.0) cable procurements, were benchmarked and statistically validated. The System Dynamics simulation analysis were used. Moreover, the statistical validations with empirical data were made. The data were collected from Taiwanese manufacturing chains. |
| Shamsuddoha M. et al., 2015 [37] | Sustainable poultry production process to mitigate socio-economic challenge | In this paper, a sustainable model for the poultry industry in Bangladesh was developed. The model was developed with using SIMUL8 software package. The goal of this model was mitigating existing socio-economic problems in the poultry industry. |
| Sahay N., Ierapetritou M., 2013 [36] | Supply chain management using an optimization driven simulation approach | A hybrid simulation-based optimization framework to solve the supply chain management problem is presented in this article. The optimal allocation of resources in realistic supply chain are analyzed in this case. |
| Li C., 2013 [34] | An integrated approach to evaluating the production system in closed-loop supply chains | In this paper, authors presented the problem of comprehensively evaluating the production system in closed-loop supply chains. For a better understanding, they described simulation and case studies. |
Table 3.
Differences in results for experiments in case 2 and case 1; own study.
Table 3.
Differences in results for experiments in case 2 and case 1; own study.
| | Time Load and Unload [min] | Time Route [min] | Total Time [min] | Distance [km] | Fuel Consumption [l] | Fuel Cost [EUR] |
|---|
| Order 1 | 0.00 | 0.00 | 0.00 | 0.00 | 0.00 | 0.00 |
| Order 2 | 0.00 | 0.00 | 0.00 | 0.00 | 0.00 | 0.00 |
| Order 3 | 0.00 | 0.00 | 0.00 | 0.00 | 0.00 | 0.00 |
| Order 4 and 5 | 0.00 | −3.17 | −3.17 | −190.00 | −61.75 | −61.75 |
| Order 6 and 7 | 0.00 | −0.33 | −0.33 | −20.00 | −6.20 | −6.20 |
| Order 8 and 9 and 10 | 0.00 | −0.75 | −0.75 | −45.00 | −13.95 | −13.95 |
Table 4.
Differences in results for experiments in case 2 and case 1 (cont.); own study.
Table 4.
Differences in results for experiments in case 2 and case 1 (cont.); own study.
| | Worker Cost [EUR] | Total Cost [EUR] | CO [g/km] | HC [g/km] | NOx [g/km] | PM [g/km] |
|---|
| Order 1 | 0.00 | 0.00 | 0.00 | 0.00 | 0.00 | 0.00 |
| Order 2 | 0.00 | 0.00 | 0.00 | 0.00 | 0.00 | 0.00 |
| Order 3 | 0.00 | 0.00 | 0.00 | 0.00 | 0.00 | 0.00 |
| Order 4 and 5 | −0.26 | −62.01 | −95.00 | −9.50 | −34.20 | −0.95 |
| Order 6 and 7 | −0.03 | −6.23 | −10.00 | −1.00 | −3.60 | −0.10 |
| Order 8 and 9 and 10 | −0.07 | −14.02 | −22.50 | −2.25 | −8.10 | −0.22 |
Table 5.
Differences in realization of orders depends of type of Euro of vehicle; own study.
Table 5.
Differences in realization of orders depends of type of Euro of vehicle; own study.
| | Time load and Unload [min] | Time Route [min] | Total Time [min] | Distance [km] | Fuel Consumption [L] | Fuel Cost [EUR] |
|---|
| Order 3–Order 1 | 0.00 | 0.00 | 0.00 | 0.00 | −6.60 | −6.60 |
| Order 3–Order 2 | 0.00 | 0.00 | 0.00 | 0.00 | −9.60 | −9.60 |
Table 6.
Differences in realization of orders depends of type of Euro of vehicle (cont.); own study.
Table 6.
Differences in realization of orders depends of type of Euro of vehicle (cont.); own study.
| | Worker Cost [EUR] | Total Cost [EUR] | CO [g/km] | HC [g/km] | NOx [g/km] | PM [g/km] |
|---|
| Order 3–Order 1 | 5.44 | −1.16 | 0.00 | 4.80 | −12.00 | 0.00 |
| Order 3–Order 2 | 7.25 | −2.35 | 0.00 | 4.80 | −20.40 | −0.48 |
© 2020 by the authors. Licensee MDPI, Basel, Switzerland. This article is an open access article distributed under the terms and conditions of the Creative Commons Attribution (CC BY) license (http://creativecommons.org/licenses/by/4.0/).


