Article

Regionalization of Green Building Development in China: A Comprehensive Evaluation Model Based on the Catastrophe Progression Method

School of Economics and Management, Tongji University, Shanghai 200092, China
*
Authors to whom correspondence should be addressed.
Sustainability 2020, 12(15), 5988; https://doi.org/10.3390/su12155988
Submission received: 29 June 2020 / Revised: 18 July 2020 / Accepted: 21 July 2020 / Published: 24 July 2020

Abstract

:
As an effective measure to reduce energy and material consumption, green building has drawn much attention all over the world. Under the background of ecological city construction, the development speed of green building is extremely high in China. However, it is unclear about the overview of regional green building development. This study puts forward an evaluation model to scientifically measure the regional development of green building. The rough set theory and the catastrophe progression method optimized by entropy method are utilized in the model. A case study is conducted to clarify the application of the evaluation model, and the spatial distribution of regional green building development in 2015 is shown in the end. The result shows that the evaluation model is scientific and applicable. The spatial distribution of green building development in China was uneven. Green building development concentrated on the Beijing-Tianjin-Hebei area, Jiangsu-Zhejiang-Shanghai Area, Guangdong and Chongqing. Tibet was almost the bottom in every aspect, but it performed the best in economic efficiency. This study not only contributes to the research area of green building development, but also helps to promote green buildings in practice.

1. Introduction

Climate change has widely aroused public attention all over the world, especially global warming [1]. A report published by the Intergovernmental Panel on Climate Change (IPCC) forecasted that global temperature would increase 1.1–6.4 °C by 2100 [2], which will increase the possibility of extreme weather, leading to natural disasters [3]. Numerous natural and human resources are consumed in the construction industry, emitting vast greenhouse gas that gives rise to global warming [4]. A report from the International Energy Agency (IEA) showed that buildings consume more than 40% of energy in many countries [5]. More than 50% of greenhouse gas emission and 80–85% energy consumption are consumed in the operational phase [6]. Besides, the renovation, refurbishment, and retrofitting of buildings, which are easy to neglect, also consume natural resources, energy, and emit greenhouse gas [4]. Therefore, the concept of green building has been proposed to reduce or eliminate the negative impact of buildings on the environment and climate change as far as possible.
The United States Environmental Protection Agency (USEPA) has defined green building as “the practice of creating structures and using processes that are environmentally responsible and resource-efficient throughout a building’s life-cycle from siting to design, construction, operation, maintenance, renovation, and deconstruction” [7]. Green buildings, which are considered as the upgrading of traditional buildings [8], concentrate on five sustainable goals: energy saving, land saving, water conservation, material saving, and environmental protection [9].
On the one hand, green building development cannot be separated from the development of green building rating systems [10]. They provide guidelines for green buildings in the aspects of green characteristics and green innovations during the design, construction, and operation phases [11]. The green performance of buildings is evaluated based on the rating systems [12]. Only those buildings that get through the evaluations will be labeled. Furthermore, they provide specific interventions aiming at promoting the green building market [13]. According to regional characteristics, climate, and culture, countries around the world have proposed various green building rating systems [14]. The first green building rating scheme in the world is the Building Research Establishment Assessment Method (BREEAM), which was proposed by the United Kingdom in 1990 [15,16]. More than 600 rating systems have been established to promote GB development, e.g., Leadership in Energy and Environmental Design (LEED) in the United States, Building Environmental Performance Assessment Criteria (BEPAC) in Canada, Comprehensive Assessment System for Building Environmental Efficiency (CASBEE) in Japan, Green Star in Australia, Green Mark in Singapore, Green Rating for Integrated Habitat Assessment (GRIHA) in India, and Evaluation Standard for Green Building (ESGB) in China [17]. Several were established by non-profit third parties such as BREEAM, LEED, and Green Star, while others were put forward by the government, such as ESGB in China and CASBEE in Japan [11,14]. On the other hand, green building development, including new green buildings and green retrofit of existing buildings, cannot live without the support of local economy, technologies, and policies [18,19]. In order to realize a better promotion of green buildings, it is critical to know more about the knowledge of green building development. Six paradigms have been identified in the research area: project delivery attributes, critical success factors, barriers, drivers, risks, and benefits [20]. Sixty-four drivers were identified and sorted into five categories: external drivers, corporate-level drivers, property-level drivers, project-level drivers, and individual-level drivers [21]. The green premium is a potential driver of green building development, although it cannot provide an independent explanation for the development of green-labelled commercial buildings in the UK and the USA [22]. Zhang et al. (2019) compared the backgrounds and current statuses of green building development in various countries [23]. The external and internal factors that influence green building development were concluded. Research shows that green buildings in China only account for a small proportion comparing the booming construction market [23]. Potential barriers to green building development in China, such as a lack of environmental awareness, an immature market environment, and a lack of policy guidance, were identified [24]. Furthermore, a partial least squares structural equation model (PLS-SEM) was built to reveal the impacts of different barriers on green building development
The distribution of certified green buildings can directly reflect the regional green building development. An increase in the number of green buildings is critical for realizing sustainable urbanism [25]. Research shows that green buildings in the United States concentrated in major coastal cities at first, then spread to other cities across the country [26]. Metropolitans and sub-metropolitans were the main clustering regions of LEED and Energy Star certified buildings in the United States [27]. A strong spatial correlation was found in the diffusion of commercial green buildings [28]. The spatial distribution of LEED-India and GRIHA projects was provided, and the difference between them has been compared [29]. Although green buildings have been promoted for decades in China, the overall development is not optimistic, and the distribution is uneven [23,30].
In summary, the studies concerning regional green building development merely consider the number of local certified buildings [27]. However, green building development is determined by various external factors and internal factors [11]. It will miss an overall picture of regional green building development when they only focus on the number of local certified buildings. Therefore, this study attempts to answer two questions. The first question is how to scientifically measure green building development in different regions. The second question is to investigate the distribution of regional green building development in China. To fill the research gap and answer the questions, this study aims at proposing a comprehensive evaluation model to access green building development in different regions and visualizing its spatial distribution to shed light on the spatial patterns hiding behind. According to the result, this study has implications for governments in publishing effective policies to reduce geographical differences. It also helps investors understand regional green building development and market environment, leading to wiser investment decisions.
By analyzing the characteristics of the green building clusters, this study is useful to promote green buildings diffusion and take advantage of the geographical spillover effects. The main contributions of this study include: (1) A scientific and applicable evaluation model is proposed to measure regional green building development. Comprehensive indicators are selected, and the catastrophe progression method is utilized. (2) The uneven spatial distribution of green building development in China is displayed vividly. (3) The catastrophe progression method is optimized and introduced to the evaluation model, which is rare in previous studies.
The paper is organized as follows: Section 2 illustrates the research methodology of this study. Section 3 establishes an evaluation model after the process of indicator selection, attribute reduction, and applying catastrophe progression method. Data from 31 provinces and municipalities in the Chinese mainland are collected, then a case study is conducted to verify the feasibility of the evaluation model in Section 3. In Section 4, further analysis is presented to discuss the model results and visualize the spatial distribution of green building development. Section 5 draws a conclusion and clarifies the limitations of this paper and future research directions.

2. Research Methodology

As we have mentioned in the introduction, this study aims at establishing a holistic evaluation model for measuring green building development in different regions. This evaluation model contains four aspects: certification, economy, policy, and technology, so we utilize the first letters of the four aspects to name this model, i.e., CEPT model. The methodology framework is shown in Figure 1. Four procedures are designed, and a brief interpretation is presented.
The first step is indicator selection. The criteria for indicator selection are proposed based on previous literature. Research articles, government policies and industry reports are selected as the sources of indicators [31]. They represent the cognitions on the factors influencing green building development from three critical stakeholders: researchers, governments, and industry practitioners. Three rounds of selection are conducted to establish a draft of the indicator system scientifically. In the first round, an extensive literature review on research articles is conducted to pick out the indicators relating to green building development. In the second round, complementary indicators are selected from the policy documents and industry reports. In the third round, theoretical analysis is conducted to discuss the reasons for choosing a specific indicator. After indicator selection, the draft of CEPT framework is established as an output.
The second step is attribute reduction. In the first step, as many indicators as possible are selected to avoid omission. On the contrary, it leads to redundant information in the CEPT framework. Therefore, the rough set theory is applied to reduce the redundant attributes of the indicators. Rough set theory was proposed by Pawlak in 1982 to solve the problem of incomplete and uncertain information systems [32]. It is widely applied in many research fields, e.g., real estate appraisals, indicator system optimization, and automated valuation model [33,34]. The CEPT framework can be optimized through the attribute reduction process based on rough set theory. The excess indicators are deleted, while the information is kept as much as possible [35]. However, the data must be discrete when using the rough set theory. K-means clustering is applied to change continuous data into discrete data. After attribute reduction, the formal CEPT framework is proposed as a critical output.
The third step is score calculation. A wide range of methods can be adopted in the evaluation, such as the fuzzy analytic hierarchical process [36], the technique for order preference by similarity to ideal solution [37], the principal components analysis [38], and the artificial neural network [39]. Different methods have different calculation rules, which may result in slightly different results. Two criteria are put forward to choose the method in score calculation. One is objective, which means it can minimize the effect of subjective opinions. The other one is comprehensive, which means it can handle an extensive range of indicators. An optimized catastrophe progression method is selected because it has objective and comprehensive advantages.
The catastrophe progression method, which is applied in multi-indicator evaluation, is derived from the catastrophe theory [40]. As a branch of dynamic system theory, catastrophe theory was put forward in 1976 and was utilized to study discontinuous changes and catastrophes in the beginning [41]. The importance of indicators should be determined in the process of catastrophe progression method. It is critical because it can influence the calculation results. In previous studies, indicator weighting is based on subjective judgment, like drawing a conclusion from the literature review [42] or expert experience [35]. This procedure is subjective. Therefore, the entropy method is introduced to calculate the weighting of indicators objectively with the purpose of optimizing the catastrophe progression method [31,43]. After that, the CEPT evaluation model is established.
The fourth step is a case study. Using the data from 31 provinces and municipalities in China, a case study is conducted to show the application of the CEPT evaluation model. The unbalanced development of green buildings in different regions is visualized. A further discussion of the CEPT evaluation model and case study results is conducted.

3. Regional Green Building Development Evaluation Model

3.1. Indicator Selection

Three overarching attributes (salience, credibility, and legitimacy) are the primary concerns for the indicator selection [44]. Besides these requirements, other criteria of indicator selection, including data availability, completeness, and relevance, are also paid attention in selection [45]. According to these criteria, twenty-five candidate indicators of regional green building development are selected from research articles, government policies, and industry reports. They are classified into four categories: certification, economy, policy, and technology. Therefore, a holistic indicator framework for measuring regional green building development, named CEPT, is established in this section. Detailed information about the CEPT framework is shown in Table 1.

3.1.1. Certification Indicators

The ancient architecture in China had contained sustainable thoughts, but the contemporary concept of green building was introduced after international green building development [4,46]. The Evaluation Standard for Green Building (ESGB), the first version of green building rating system in China, was promulgated by the Ministry of Housing and Urban-Rural Development (MOHURD) in 2006. Green buildings were issued with design labels or operation labels in the old versions of ESGB. According to the green performance, buildings were classified into three levels: one-star level, two-star level and three-star level. The latest version, published in 2019, made some changes. The critical changes are as follows: (1) It reconstructed the evaluation system in six categories, including safety and durability, health and comfort, occupant convenience, resource conservation, environmental livability, promotion, and innovation. (2) Except for the one-star, two-star and three-star level, the basic level was added. It will be issued when the building meets all basic requirements in the evaluation system. (3) The classification of design labels and operation labels was canceled to strengthen the importance of green building performance during building operations. The green building evaluation can be carried out after the construction work is completed, and the pre-evaluation can be carried out after the construction drawing design is completed.
On the basis of the green building rating system, numerous certifications are issued to the buildings that meet green building criteria. The diffusion of green buildings aligns with the development of green building rating systems [11], so the number of local certified green buildings can directly reflect the regional green building development [26,30]. Therefore, the number of certified green buildings is chosen as an indicator. Furthermore, most green buildings in China are the one-star level or two-star level. The proportion of buildings with high-level certification (the ratio of buildings certified three-star level) can reflect a higher quality of regional green building development, so it is chosen as a critical indicator.
However, it will miss a larger picture if we only concentrate on the factors relating to green building rating systems. Green building development is not determined by an isolated element. Other external factors and internal factors can influence it at the same time [11]. Promoting the diffusion of green buildings needs holistic improvements in all factors considered. Although certification is the most critical aspect and it is the symptom of local green building development, the evaluation framework should take more factors into consideration in compliance with the principle of completeness, a significant criterion for indicator selection. Therefore, more indicators involving the aspects of economy, policy, and technology are included.

3.1.2. Economy Indicators

Research shows that regional green building development has a positive relationship with the local economy [30], so economic growth is a significant aspect when explaining green building development. Although the proportion of green buildings remains low in China, we believe the local economic level can reflect the potential of regional green building development to some extent. Seventeen candidate indicators are selected based on the criteria of data availability. Furthermore, they are sorted into three categories according to the different aspects they represent: industry, enterprise, and efficiency.
In the category of industry, four indicators are selected. Gross Domestic Product (GDP) was commonly selected to reveal the local economic condition in previous studies. Prum and Kobayashi made a regression analysis between GDP and the number of green buildings with certification, and results showed that there was a positive correlation [47]. Zou et al. (2017) chose GDP as the economy-related variable when establishing the model to verify the hypothesis that the local economic fundamentals can explain the growth in green buildings [30]. Despite the positive correlation between GDP and green building development, GDP contains all the products in commercial activities, including agriculture, manufacture, and service. As a result, the scope of GDP is too broad to show the growth in green buildings accurately. Therefore, we substitute GDP with four other economic indicators relating to the construction industry, which have a closer relationship with green buildings. They are the total output value in construction industry, the output value of construction, the value added in construction industry, and the output value of building construction.
In the category of enterprise, nine indicators are selected. Despite the slow occupation of green building market in some areas, the global green building market is on the rise [11]. Construction enterprises are the enterprises engaged in the building construction and equipment installation. Their role is significant in the market because they take the primary responsibility to produce green buildings. Two indicators, number of construction enterprises and number of staff and workers in these enterprises, are selected to represent the local scale of producers for green buildings. Besides, four indicators, which can present the financial status of regional enterprises, are selected into the CEPT framework, including total profits of construction enterprises, paid-up capitals of construction enterprises, total assets of construction enterprises, and business revenue of construction enterprises. Furthermore, three indicators, total value of contracts, value from contracts signed in last year, and value from new contracts signed in this year are selected to show the value from contracts signed.
In the category of efficiency, four indicators are selected. These are proportional indicators, which are obtained from the calculation of multiple indicators. They can interpret the relationship between indicators and show economic efficiency better than a single indicator. These indicators are labor productivity, value of machines per laborer, ratio of profits to gross output value, and ratio of pre-tax profit to gross output value.

3.1.3. Policy Indicators

The government’s role is significant in driving the green building agenda [48,49]. As the most critical external force, governments around the world are involved in green building promotion tasks through making policies [21]. The policies published by the government can be split into two categories: positive incentives (e.g., subsidies, tax reduction, density bonuses and floor area ratio bonuses), and negative incentives (e.g., penalties and compensations) [11,49]. Research shows that governmental incentives help to promote spatial diffusion of certified green buildings [47]. The most effective policies in Taiwan are the additional incentive for private buildings and the mandatory requirement for public buildings [36]. The most important national policy in the Chinese mainland is the Green Building Action Programme, which stipulates that the government should promote green building development with local policies, including technical standards and financial methods [50]. National policies commonly set the principles and goals, while local policies develop more detailed plans according to the specific circumstances of the provinces or cities [21]. Policies are difficult to be quantified because it is hard to compare their contents and effects. Therefore, the number of local policies is selected in this category to simplify the process of quantification.

3.1.4. Technology Indicators

Green building technology provides a benchmark for green buildings [20], but its importance has always been underestimated [11]. Five goals, including energy conservation, environment protection, material utilization, water conservation, and land utilization, should be paid attention when applying green building technology. The first indicator we select is the number of green building innovation awards. The Green Building Innovation Award, which is established by MOHURD and elected every two years in China, consists of three levels. It aims at encouraging construction projects, enterprises, and individuals that make great contributions to the research or application of green building technologies. These award-winners also do excellent work in promoting green building development [51]. The second indicator is the number of green building patents. In order to reduce environmental pollution, the number of green patents is increasing under the guidance of more and more strict environmental regulations [52]. Green building patents can reveal the new technologies applied in buildings. The number of local patents shows the capabilities of regional innovations in science and technology, which is needed in green building development. The third indicator is the number of green building material labels. Materials have a significant influence on the living environment and human health in the life cycle of buildings [53]. Mandatory incorporation of green building materials into public government procurement is an effective policy in Taiwan [36]. Because of the barriers to the material selection, standard forms are established in various countries (e.g., GreenSpec in the UK, Sweets Catalog in the United States, green construction material information system in Korea, green building material label in China) [54]. The first batch of green building material labels in China was released in May 2016 [55]. Besides those mentioned above, the machinery and equipment applied in the construction stage partly represent the technical level of green building projects. Therefore, the total power and the net value of machinery and equipment owned are selected in this category.

3.2. Attribute Reduction Based on Rough Set Theory

Although the candidate indicators are grouped into four categories, they may contain overlapping information when the researchers pursue comprehensive indicators, which is easy to lead a deviation from the real situation [35]. The rough set theory is commonly utilized to optimize the indicator system. The process of attribute reduction based on rough set theory can be utilized to achieve the purpose of optimizing the evaluation framework by deleting excess indicators. At the same time, it can keep the maximum information with the original classification [35]. There are three steps to conduct attribute reduction.

3.2.1. Data Normalization

In the first step, because different indicators present different dimensions and magnitudes, it is necessary to normalize the data for the purpose of eliminating the discrepancy among the raw data [43]. After data normalization, valid comparisons between indicators can be conducted [42]. All the indicators in the CEPT framework have positive attributes. Thus, they are processed by the following Equation (1).
r i j = x i j M i n j { x i j } M a x j { x i j } M i n j { x i j }
where xij is the original value of the region i for the indicator j (i = 1,2,3,…,m; j = 1,2,3,…,n); rij is the normalized value of xij; M a x j { x i j } and M i n j { x i j } are the maximum original value and the minimum original value among the regions for a specific indicator j, respectively.

3.2.2. K-Means Clustering

The second step is to adopt the K-means clustering. Most of the indicators in the CEPT framework are continuous data, which cannot be applied based on the rough set theory. Therefore, after comparing different clustering methods, K-means clustering is chosen to change the continuous data into discrete data. Statistical Product and Service Solutions (SPSS) is utilized as a convenient operating software to conduct the clustering [35].

3.2.3. Attribute Reduction

The third step is to conduct attribute reduction. We assume the domain U is a non-empty finite set of the objects discussed, and K= (U, R) is a knowledge base, where R and U have an equivalence relation. If P is a non-empty set and P R , P means an indistinguishable relationship for P, so it can be presented as ind(P). U/ind(R) is the set of equivalent classes that consists of all ind(R). We assume r is a cluster of equivalence relation, and r R . If i n d ( R ) = i n d ( R { r } ) , we can draw the conclusion that r is not necessary for R [35]. Therefore, r can be deleted from the indicators, and the process of attribute reduction can finish. If i n d ( R ) i n d ( R { r } ) , r is a significant factor that cannot be removed.

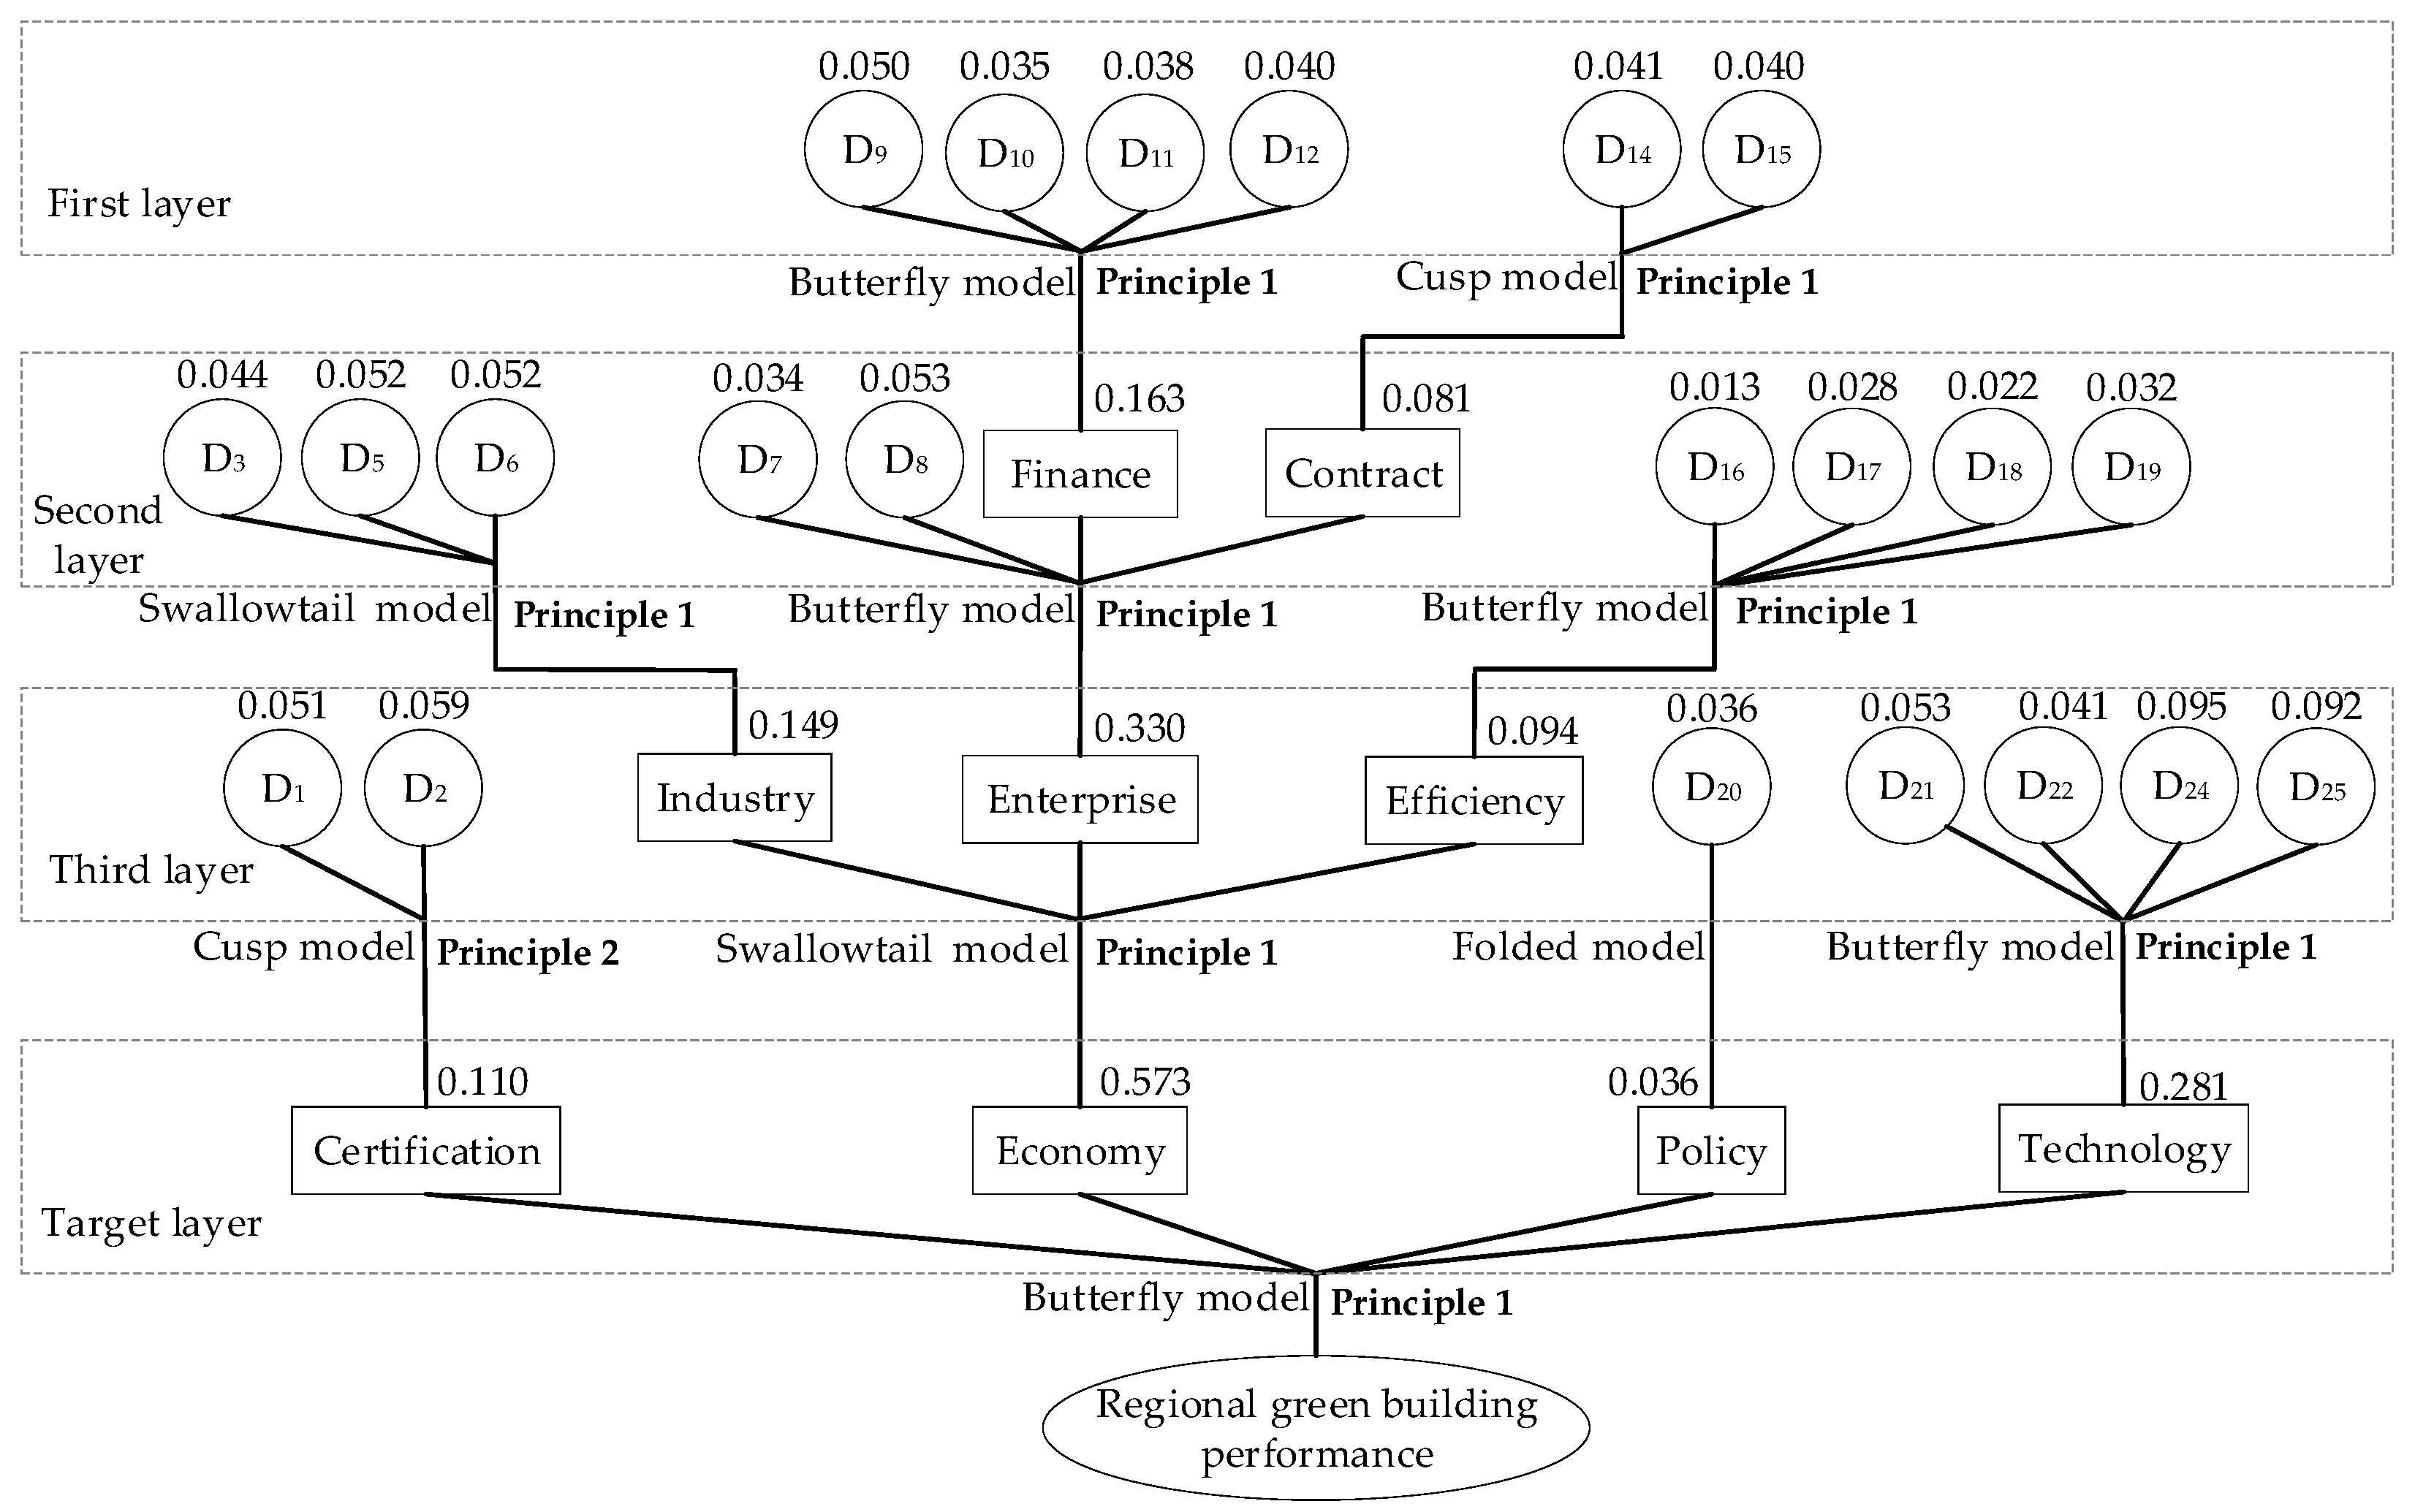
3.3. Evaluation Models Based on the Catastrophe Progression Method

There are seven types of basic models: fold model, cusp model, swallowtail model, butterfly model, the umbilic point of hyperbolic model, elliptic model, and the umbilic point of parabolic model [35]. The first four models are commonly utilized in research. If x is the state variable, we often assume f is the potential function of x, and the parameters a, b, c, and d represent the control variables of the state variable x. Based on the catastrophe theory, an equilibrium surface can be formed by all the critical points. However, sudden changes will occur in the dynamic system when the control variable meets some requirements. The details of the common catastrophe models and their potential functions are shown in Table 2.
Four steps are necessary to complete: data normalization, evaluation framework establishment, indicator importance determination, and result calculation. The process of data normalization is the same as Section 4.2.1. The other three procedures are clarified in the following.

3.3.1. Evaluation Framework Establishment

If there are several indicators in the framework (usually more than four), it is generally accepted that the indicators can be classified into different categories because of the number limit of control variables. As a result, a multi-layer evaluation framework will appear. The CEPT framework, shown in Table 1, has taken the number requirement into consideration for the convenience of applying catastrophe progression method, but considering attribute reduction, it does not obey the rule of fewer than five indicators in a category strictly.

3.3.2. Indicator Importance Determination

As control variables, different indicators have different impacts on the state variable. The importance of indicators can be concluded from previous studies [42] or be determined by expert experience [35]. The disadvantage is that evaluation results can be easily influenced by subjective opinions. The entropy method is commonly used in calculating indicators’ weighting value because of its privilege of subjectivity [31,43]. Hence, we choose it to calculate and optimize catastrophe models. The entropy values of indicators, denoted as wj (j = 1,2,3,…,m), can be obtained through Equations (2)–(4). Therefore, the parameters a, b, c, and d can find the corresponding control variables based on the importance of them (the importance of a, b, c, and d decreases in turn).
y i j = r i j i = 1 m r i j
e j = 1 ln m i = 1 m y i j ln y i j
w j = 1 e j n j = 1 n e j
where rij is the normalized value of the region i for the indicator j (i = 1,2,3,…,m; j = 1,2,3,…,n); m is the number of sample regions; wj is the entropy value of indicator j; if yij = 0, yij lnyij is also equal to 0 in Equation (3).

3.3.3. Result Calculation

The relationship between control variables should be confirmed before calculating the result. If there is only one control variable, the calculation principle is fixed. If there is more than one control variable, they should follow a specific calculation principle according to the correlations between control variables [35]. The details of the principles are in the following.
  • Principle 1 (complementary principle): If several control variables have high correlation coefficients, the complementary principle will be applied. The value of state variable is the average value of the normalization formulas determined by control variables, e.g., x = ( x a , x b , x c , x d ) / 4 in the butterfly model.
  • Principle 2 (non-complementary principle): If there is no obvious correlation between control variables, the non-complementary principle will be applied. The value of state variable is the minimum value among the normalization formulas determined by control variables, e.g., x = min { x a , x b , x c , x d } in the butterfly model.
In the CEPT framework, indicators in every layer can be state variables in a model and be control variables in other models at the same time, except the indicators in the top layer or bottom layer. The calculations start from the bottom layer, go up gradually, and end with the top layer.

4. Case Study

31 provinces and municipalities in the Chinese mainland are selected as the research objects in this study. Hong Kong, Macao, and Taiwan are out of research scope because they have different green building rating systems. The last year of the data on regional green building numbers published by government is 2015. There is no comprehensive official data released from 2016. Therefore, the data in the year of 2015 is chosen as a demonstration to verify the evaluation framework and reveal the unbalance development of green buildings in different regions of China. Although the green building material label is a significant part of green building technology, the first batch of it was released in 2016. Therefore, the indicator D23 cannot be used in this case study.

4.1. Data Collection

The data sources of indicators for measuring green building development in different regions are listed in Table 3. The raw data of D1 and D2 is collected on the website of the Chinese Building Evaluation Label. D2 is obtained after calculation. The value of it is the number of three-star green buildings divided by the number of certified green buildings in one region. D20 is collected by searching the keyword “green building” on the website of the Chinalawinfo Database. Policies have cumulative effects, which means new policies take effects on the basis of old policies to give better guidance on green building development. Due to this characteristic, the number of local policies is a cumulative value, while other indicators show the values in a specific year. Therefore, policies issued in and before 2015 are taken into account. Among them, some policies which do not have critical impacts on regional green building development are deleted by hand, e.g., the notice of government administration. Same as D20, D25 is collected by searching the keyword “green building” on the website of National Intellectual Property Administration. Patents published in 2015 are collected and analyzed. Inventors can be sorted into three categories: enterprises, research institutions, and individuals. Patents invented by enterprises and research institutions have clear geographical affiliations, but patents invented by individuals have no geographic information. Therefore, we delete the patents invented by individuals and some patents which have no relationship with green buildings by hand, resulting in reducing the number of patents from 94 to 70.

4.2. Calculation Process

4.2.1. Attribute Reduction Based on Rough Set Theory

The normalized data is calculated based on Equation (1). The K-means clustering is applied as the part of Section 4.2.2 mentioned. The results of them can be seen in Table A1 and Table A2 of Appendix A. The rough set theory is applied to reduce the attributes in the layer of indicators. As a result, D4 and D13 are deleted after the attribute reduction. The calculation procedure of deleting D4 is shown in the following as an example to clarify the process.
We assume S = ( U , A ) in the industry category, where U = { 1 , 2 , 3 , 30 , 31 } , A = { D 3 , D 4 , D 5 , D 6 } . Then, we can get the following result:
U / i n d ( A ) = U / i n d ( A { D 3 } ) = U / i n d ( A { D 4 } ) = U / i n d ( A { D 5 } ) = U / i n d ( A { D 6 } ) = { { 1 , 12 , 13 , 15 , 16 , 17 , 18 , 19 , 22 , 23 } , { 2 , 4 , 5 , 7 , 8 , 14 , 20 , 21 , 24 , 25 , 26 , 27 , 28 , 29 , 30 , 31 } , { 3 } , { 6 } , { 9 } , { 10 , 11 } }
According to the rough set theory, anyone among the four indicators can be deleted without any impact on the evaluation result. Deleting two indicators is impossible since U / i n d ( A ) U / i n d ( A { D i , D j } ) , where i = 3 , 4 , 5 , 6 , j = 3 , 4 , 5 , 6 and i j . Therefore, we delete D4 because there is a high correlation between D3 and D4, and D3 is a critical indicator that reflects the total output value in the industry.

4.2.2. Evaluation Model Based on the Catastrophe Progression Method

Based on the result of attribute reduction, the modified CEPT evaluation framework is established. The types of catastrophe models in each middle node are determined according to the number of control variables. The entropy method is applied to calculate the weighting values of indicators and to reveal the significance of control variables for further processing. According to the entropy method, the weighting value of the state variable in the upper layer is the sum of the weight values of control variables in the CEPT framework. The calculation principle of each model can be determined by the correlation coefficients of indicators, which is shown in Table A3 of Appendix A. The weighting values, types of catastrophe models, and calculation principles in the modified CEPT framework are shown in Figure 2.

4.3. Calculation Result

The calculation results and ranks of certification category (A1), economy category (A2), policy category (A3), and technology category (A4) are shown in Table 4. Therefore, the evaluation results of regional green building development (defined as P) can be calculated based on the catastrophe progression method.

5. Discussion

The results of the case study reveal that the CEPT evaluation framework is applicable and effective in measuring regional green building development. The spatial distribution of green building development can be drawn on the basis of evaluation results. Further analysis of strengths and weaknesses in different regions is conducted, and vivid pictures of regional differences are shown in this section.

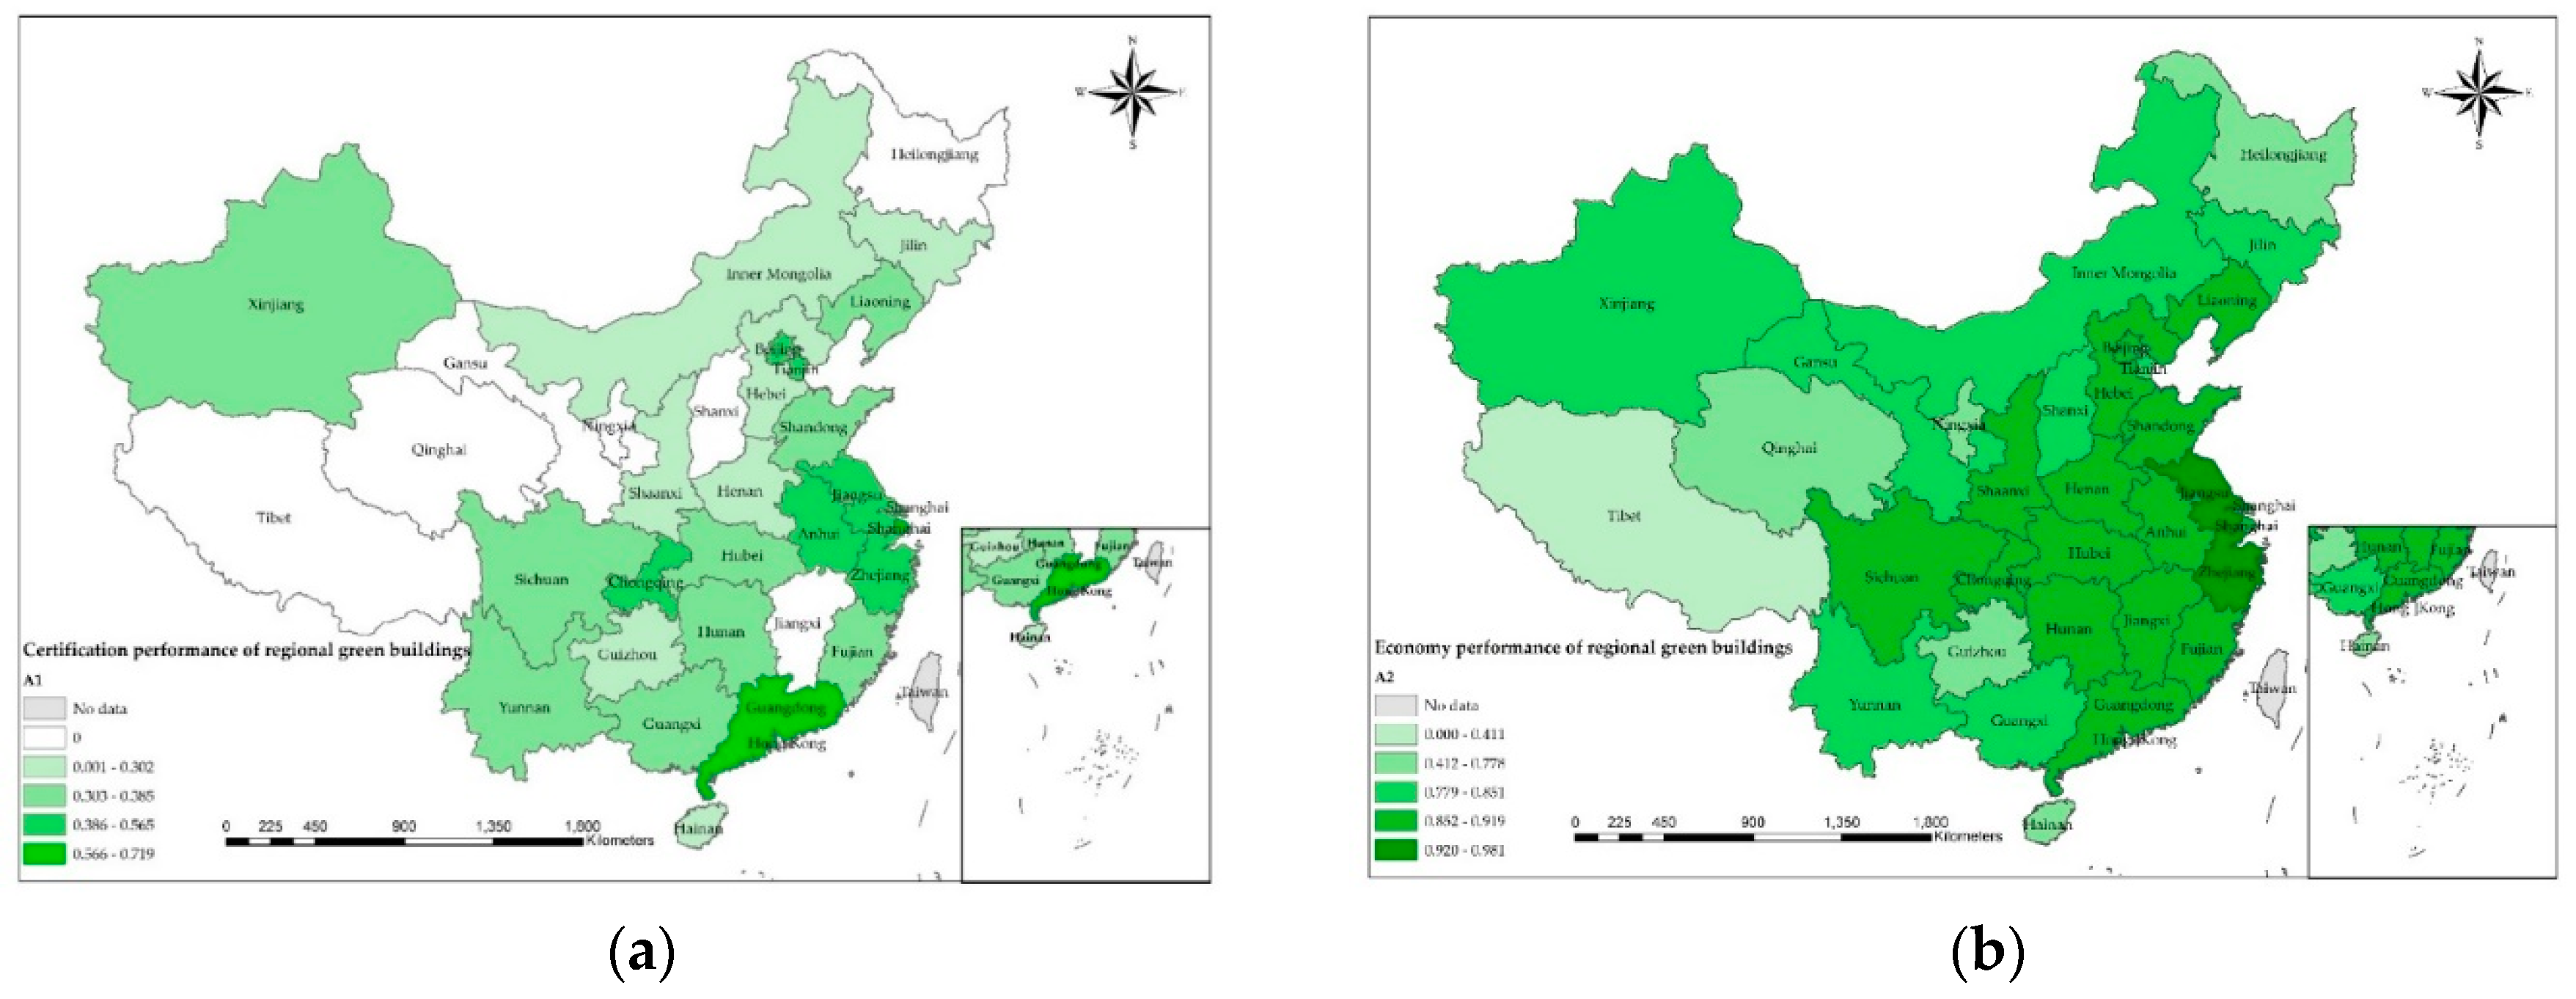
5.1. Spatial Distribution of Regional Green Building Development in Different Aspects

The spatial distribution of regional certification performance is shown in the panel (a) of Figure 3. The certification performance in southeast China was better than in northwest China. Shanghai ranks first, followed by Guangdong and Tianjin. Shanghai has privileges in the number of green buildings. Besides obtaining green building certifications under the system of ESGB in China, some buildings invested by foreign capital obtain LEED certifications. As an important financial center, port center, and economic center of China, Shanghai is an attractive city for foreign investments, and it has the largest number of LEED buildings in China. In addition, although Beijing was the fifth, it had a large proportion of high-level buildings in 2015. Because of the low correlation between the indicator D1 and indicator D2, Principle 2 is applied to calculate the value of A1, which means the minimum values are picked out. As the blank regions in the panel (a) of Figure 3, seven provinces in China do not have three-star green buildings in 2015. Among the seven provinces, Tibet was the only one that had no green buildings.
We further explore the spatial distribution of green buildings in several provinces to show the green density. We want to find out whether big cities have more green buildings than in other cities. The top ten provinces which have privilege in the number of green buildings are chosen. Their capitals are commonly big cities. The relationship of green building number between provinces and their capitals are revealed in Table 5. We can conclude from the table that green buildings do concentrate in big cities. The highest percentage is 71.93%, which is extremely high and means most of the green buildings in Hunan are built in one city. The fact that percentages in seven provinces are more than 50% is further revealed the uneven spatial distribution in China, not only among provinces but also among cities.
The spatial distribution of regional economic performance is shown in the panel (b) of Figure 3. Jiangsu performed the best among these regions, followed by Zhejiang and Hubei. Tibet was the worst in the overall economic performance, and there was a big gap between Tibet and other regions. According to Table 1, regional economy performance is comprised of the performance of finance, contract, industry, enterprise, and efficiency. Tibet and Zhejiang were two special regions. Zhejiang was the first or the second in every aspect expect the efficiency, while Tibet performed the best in the aspect of efficiency. Compared with other regions, Tibet was the bottom because of its small size in the construction industry and low level of economic development, but the construction efficiency was very high, especially the ratio of profits to gross output value. The same characteristic of high economy and low efficiency was also observed in Sichuan, Beijing and Shanghai.
The spatial distribution of regional policy performance is shown in the panel (c) of Figure 3. Chongqing and Hebei were the top two regions. The number of green building policies in Chongqing was much larger than elsewhere. Tibet had no green building policy, and Liaoning was the penultimate region. However, there are different approaches when making policies in different areas. For example, some places published policies with other titles, e.g., energy-saving renovation, but there are contents relating to green buildings. Therefore, the results have a slight deviation but do not affect the overall situation.
The spatial distribution of regional technology performance is shown in the panel (d) of Figure 3. The rank of Hainan was the last. As a tourist city, Hainan was weak in green building technologies because it was one of seven regions that had no green building patent and innovation award.

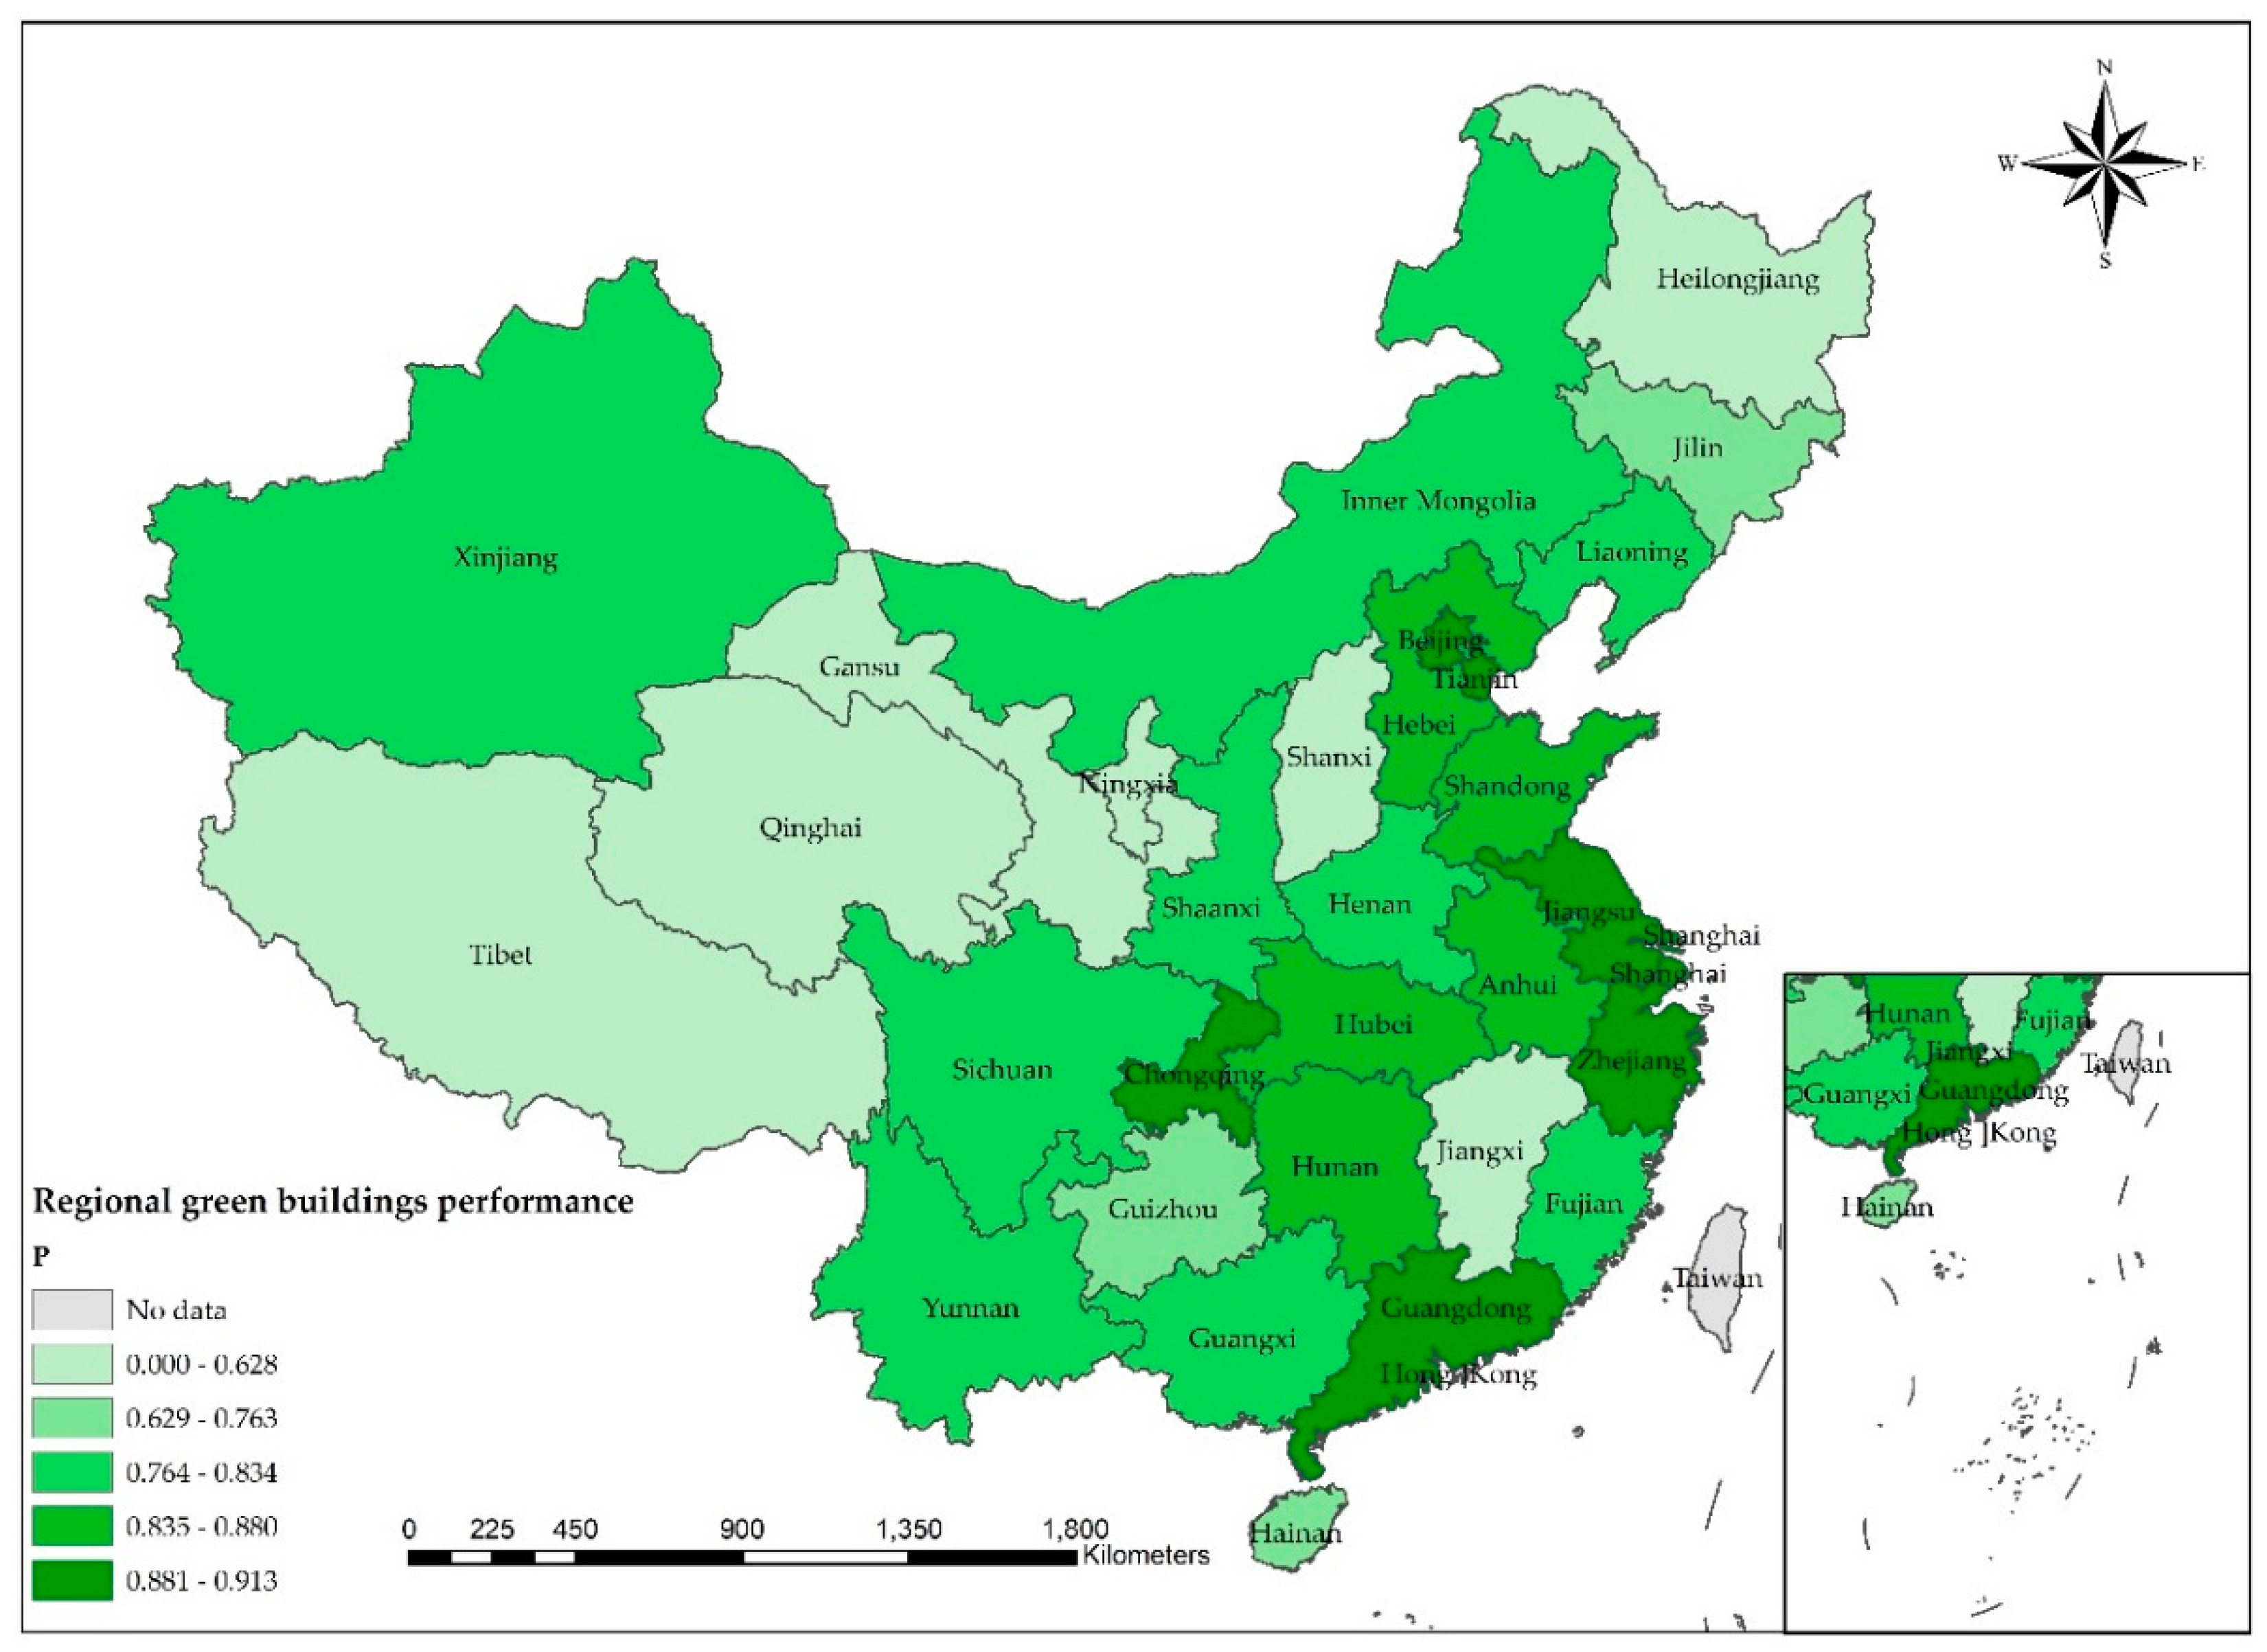
5.2. Spatial Distribution of Green Building Development in Different Regions

According to the calculation results, the map (Figure 4) is drawn to show the spatial distribution of regional green building development of 31 provinces in China. By observing Figure 4, we can conclude that regional differences existed in the Chinese mainland. Overall, the green building development in the provinces along the southeast coast was better than the inland. Eastern and central areas in China could be considered as regions economically developed and population concentrated. The regions are divided into five categories: undeveloped regions, developing regions, less developed regions, developed regions, and highly developed regions. The better the regional green building development is, the darker the region color is in Figure 4. From the picture, we can see regions with dark green concentrate on the Beijing-Tianjin-Hebei area, Jiangsu-Zhejiang-Shanghai Area, Guangdong and Chongqing. Beijing-Tianjin-Hebei area, Jiangsu-Zhejiang-Shanghai Area and Guangdong are along the coast, while Chongqing is inland.
Different areas have different development paths. Beijing-Tianjin-Hebei area is the political center of China. The high score in this area represented the focus of sustainable development at the national level. Beijing, Tianjin, and Hebei had the same characteristic that they performed better in policy than in economy, which means that the driver of regional green building development was from the government. Although the political status of Chongqing is not as important as Beijing-Tianjin-Hebei area, they have the same characteristics, which means the driver is the same. Jiangsu-Zhejiang-Shanghai Area is the economic center of China. Green buildings in this area were driven by regional economy. Same as the economic situation, the construction industry in this area remained the top in China. The privilege of green building development was formed through the spontaneous transformation and upgrading of the industry. It occurs when the industry has reached a relatively mature stage, trying to seek new development space by providing optimized products. Guangdong is famous for its high-tech industries. It has higher R&D inputs and more effective patents than other regions in China. Supported by high-tech industries, it has obvious advantages of green building technologies. Therefore, the green building development in Guangzhou was driven by technology.
There were seven regions in the category of undeveloped regions: Tibet, Qinghai, Gansu, Ningxia, Heilongjiang, Shanxi, and Jiangxi. Apart from the efficiency indicator, Tibet was almost the bottom in all indicators. Tibet is the region with much land and few people. It remains the traditional culture, and it is more like an agricultural society in many places. Tourism has become a pillar industry in Tibet. Its geographical characteristics determined its weakness in green building development. In addition, the regional spillover effect existed in most areas, but Shanxi and Jiangxi were very special. Although they were surrounded by higher developed regions, their development in the green building was not very well.

6. Conclusions

This study put forward a CEPT model to evaluate regional green building development based on the catastrophe progression method. Afterwards, a case study is conducted to verify the evaluation model, and the spatial distribution of green building development in different regions is revealed. The results of this research show that the CEPT evaluation model is applicable in measuring regional green building development. Furthermore, the spatial distribution of green building development in the Chinese mainland is uneven, which is in line with the previous study [23,30]. Overall, the green building development in southeast China was better than in northwest China. The better-developed regions concentrate on the Beijing-Tianjin-Hebei area, Jiangsu-Zhejiang-Shanghai Area, Guangdong, and Chongqing. They have different development paths according to their geographical characteristics. Tibet performed the best in the aspect of efficiency, while it was almost the bottom in any other aspect.
This study has several implications for governments. First, the government should take measures to eliminate the imbalance of regional green building development as far as possible. Under the guidance of governments, highly developed regions should share their successful experiences with undeveloped regions. In addition, policies aiming at developing green buildings should take regional geographical characteristics into consideration, including local climate, economy and market environment. Nevertheless, there are some limitations in our research. First, due to the constraints of available data, different types of green buildings are not discussed separately, e.g., residential buildings and public buildings. Their spatial distribution and driving forces may be different. Second, green buildings with LEED certifications have mentioned in this study, but the number of it is not included in the evaluation model. In future research, the patterns behind the spatial distribution of regional green building development should be further discussed.

Author Contributions

Conceptualization, L.C. and X.G.; methodology, L.C. and S.G.; visualization, L.C. and Z.L.; writing—original draft, L.C.; writing—review & editing, L.C., S.G., and Z.L. All authors have read and agreed to the published version of the manuscript.

Funding

This research received no external funding.

Acknowledgments

The authors are extremely grateful to Sustainability Journal editorial team’s valuable comments on improving the quality of this article.

Conflicts of Interest

The authors declare no conflict of interest.

Appendix A

Table A1. Normalized data in the case study.
RegionIndicator
D1D2D3D4D5D6D7D8D9D10D11D12D13D14D15D16D17D18D19D20D21D22D24D25
Beijing0.161.000.340.340.200.230.320.070.480.921.000.520.590.710.490.790.550.620.000.300.090.131.001.00
Tianjin0.180.380.180.160.110.090.160.100.160.270.310.200.220.240.210.741.000.210.110.480.120.270.910.36
Hebei0.160.070.210.180.120.190.250.160.150.300.240.230.230.220.230.380.480.180.370.650.310.260.270.09
Shanxi0.080.000.110.110.070.060.240.090.090.220.210.140.160.170.140.240.580.200.050.170.170.170.000.09
Inner Mongolia0.020.480.040.040.040.030.080.030.040.110.090.050.050.050.040.530.840.480.080.220.040.080.000.09
Liaoning0.050.260.220.190.170.150.620.190.160.590.370.280.240.250.230.530.280.280.140.040.390.220.090.18
Jilin0.190.060.090.080.060.070.240.080.090.160.120.100.080.080.090.160.390.460.390.090.050.110.000.00
Heilongji-ang0.030.000.060.050.040.040.170.060.040.130.090.070.060.050.070.000.550.180.220.130.080.100.090.00
Shanghai0.370.610.220.200.140.170.300.140.190.410.470.350.400.460.350.600.170.310.060.220.050.130.270.27
Jiangsu1.000.221.001.001.001.001.000.961.001.000.891.000.940.930.950.710.220.340.800.221.001.000.820.55
Zhejiang0.330.310.970.930.790.960.681.000.560.850.630.881.001.001.000.500.020.000.750.350.520.610.000.18
Anhui0.150.230.230.210.200.180.300.210.180.290.250.240.250.250.250.720.140.230.430.300.190.180.000.27
Fujian0.150.110.300.300.380.290.370.370.260.460.230.320.340.320.350.810.100.331.000.090.250.290.000.09
Jiangxi0.110.000.180.170.140.170.180.180.160.240.140.200.200.200.210.320.120.340.960.090.130.150.000.00
Shandong0.250.120.380.340.340.330.660.380.410.560.540.430.390.340.420.620.300.410.360.130.440.460.180.91
Henan0.160.070.320.300.270.230.520.330.340.490.330.360.360.320.380.450.480.440.700.090.820.530.360.00
Hubei0.220.130.420.400.320.340.350.330.480.470.480.530.520.490.550.940.290.520.670.300.330.400.270.45
Hunan0.200.120.260.240.210.250.210.270.210.290.210.290.360.400.330.450.350.330.890.090.280.350.090.82
Guangdo-ng0.460.400.350.330.320.240.480.280.390.660.580.470.530.610.461.000.410.460.290.130.410.400.550.55
Guangxi0.160.150.120.110.090.120.110.120.050.120.090.120.140.140.140.380.020.020.570.130.070.070.090.18
Hainan0.030.630.010.010.000.010.000.010.000.000.000.010.010.020.010.650.000.430.690.090.000.000.000.00
Chongqi-ng0.130.310.250.240.250.250.270.240.310.270.260.260.250.260.230.770.060.520.761.000.100.170.270.18
Sichuan0.030.170.350.330.230.310.380.350.220.460.420.370.450.460.440.240.280.080.250.090.250.400.090.00
Guizhou0.140.040.070.070.040.060.070.070.040.080.130.080.130.150.110.290.100.080.000.220.050.050.000.00
Yunnan0.040.560.130.120.090.110.260.120.120.230.190.130.150.150.150.280.350.300.230.090.130.160.090.00
Tibet0.000.000.000.000.000.000.000.000.000.000.000.000.000.000.000.650.591.000.430.000.000.000.000.00
Shaanxi0.400.070.190.180.150.130.200.140.120.320.250.220.250.250.250.690.510.180.250.260.170.240.090.09
Gansu0.080.000.070.070.050.070.130.070.060.110.080.080.070.060.080.380.360.280.390.090.090.090.000.00
Qinghai0.010.000.010.010.010.000.020.010.010.030.020.020.020.020.010.530.680.260.140.170.020.020.000.00
Ningxia0.000.000.020.020.010.020.040.010.010.030.030.020.020.020.020.240.250.360.170.170.010.010.090.00
Xinjiang0.040.420.090.080.090.080.110.050.040.110.100.100.090.070.100.620.280.070.230.090.050.050.090.00
Table A2. The result of K-means clustering in the case study.
RegionIndicator
D1D2D3D4D5D6D7D8D9D10D11D12D13D14D15D16D17D18D19D20D21D22D24D25
Beijing313133211111111132111111
Tianjin322222313322222123131212
Hebei333223313332232333233133
Shanxi332222313232232233111123
Inner Mongolia322222313232232322111123
Liaoning333232213321222332113123
Jilin332222313232232232211123
Heilongj-iang332222313232232233111123
Shanghai123122213321121312111132
Jiangsu231311122113313112312312
Zhejiang121311221123313313333223
Anhui333133233332222113211122
Fujian333133233331121112313223
Jiangxi332222313232232212311123
Shandong133133231321121332213221
Henan333133231321121332312233
Hubei333133231321121132313232
Hunan333133333331121332313221
Guangd-ong123133231121121132213232
Guangxi332222313232232313211123
Hainan322222313232232312311123
Chongqi-ng323133331331222112321133
Sichuan333133233321121233113223
Guizhou332222313232232213111123
Yunnan322222313232232232111123
Tibet332222313232232331211123
Shaanxi132222313332222133111123
Gansu332222313232232332211123
Qinghai332222313232232322111123
Ningxia332222313232232212111123
Xinjiang322222313232232333111123
Table A3. Correlation coefficients of indicators for measuring regional green building development.
IndicatorIndicator
D1D2D3D5D6D7D8D9D10D11D12D14D15D16D17D18D19D20D21D22D24D25
D11.000.090.760.800.750.710.710.810.680.670.780.730.740.39−0.16−0.040.260.130.690.780.520.45
D20.091.000.130.080.090.08−0.020.220.360.470.230.330.200.420.000.15−0.230.15−0.09−0.040.500.39
D30.760.131.000.980.990.870.970.930.870.800.980.940.980.32−0.29−0.130.420.180.810.910.410.45
D50.800.080.981.000.980.880.970.930.830.740.950.880.940.36−0.31−0.090.490.150.830.920.380.42
D60.750.090.990.981.000.840.980.900.810.730.940.890.950.27−0.34−0.150.470.180.780.890.330.38
D70.710.080.870.880.841.000.850.880.890.790.890.800.860.27−0.22−0.060.290.040.890.900.400.46
D80.71−0.020.970.970.980.851.000.860.770.650.910.850.930.23−0.36−0.190.520.130.810.910.230.31
D90.810.220.930.930.900.880.861.000.900.880.960.900.930.46−0.200.100.390.210.820.890.610.61
D100.680.360.870.830.810.890.770.901.000.960.940.930.910.43−0.140.020.190.120.750.800.610.63
D110.670.470.800.740.730.790.650.880.961.000.890.910.860.46−0.060.080.030.190.630.710.720.72
D120.780.230.980.950.940.890.910.960.940.891.000.970.990.41−0.25−0.050.350.180.800.890.520.56
D140.730.330.940.880.890.800.850.900.930.910.971.000.980.41−0.23−0.070.270.180.690.810.540.59
D150.740.200.980.940.950.860.930.930.910.860.990.981.000.37−0.27−0.110.370.170.780.890.460.52
D160.390.420.320.360.270.270.230.460.430.460.410.410.371.00−0.020.380.210.270.230.270.470.50
D17−0.160.00−0.29−0.31−0.34−0.22−0.36−0.20−0.14−0.06−0.25−0.23−0.27−0.021.000.23−0.520.01−0.12−0.110.320.06
D18−0.040.15−0.13−0.09−0.15−0.06−0.190.100.020.08−0.05−0.07−0.110.380.231.000.12−0.03−0.05−0.100.200.24
D190.26−0.230.420.490.470.290.520.390.190.030.350.270.370.21−0.520.121.000.050.410.42−0.120.06
D200.130.150.180.150.180.040.130.210.120.190.180.180.170.270.01−0.030.051.000.000.090.330.12
D210.69−0.090.810.830.780.890.810.820.750.630.800.690.780.23−0.12−0.050.410.001.000.940.380.33
D220.78−0.040.910.920.890.900.910.890.800.710.890.810.890.27−0.11−0.100.420.090.941.000.440.43
D240.520.500.410.380.330.400.230.610.610.720.520.540.460.470.320.20−0.120.330.380.441.000.62
D250.450.390.450.420.380.460.310.610.630.720.560.590.520.500.060.240.060.120.330.430.621.00

References

  1. Shi, Q.; Chen, J.; Shen, L. Driving factors of the changes in the carbon emissions in the Chinese construction industry. J. Clean. Prod. 2017, 166, 615–627. [Google Scholar] [CrossRef]
  2. IPCC. Climate Change 2007—The Physical Science Basis. Available online: https://www.ipcc.ch/report/ar4/wg1/ (accessed on 20 May 2020).
  3. IPCC. Climate Change 2013—The Physical Science Basis. Available online: https://www.ipcc.ch/report/ar5/wg1/ (accessed on 20 May 2020).
  4. Zuo, J.; Pullen, S.; Rameezdeen, R.; Bennetts, H.; Wang, Y.; Mao, G.; Zhou, Z.; Du, H.; Duan, H. Green building evaluation from a life-cycle perspective in Australia: A critical review. Renew. Sustain. Energy Rev. 2017, 70, 358–368. [Google Scholar] [CrossRef]
  5. IEA Policy Pathways Brief: Modernising Building Energy Codes 2017. Available online: https://webstore.iea.org/policy-pathways-brief-modernising-building-energy-codes-2017 (accessed on 20 May 2020).
  6. Sharma, A.; Saxena, A.; Sethi, M.; Shree, V. Varun Life cycle assessment of buildings: A review. Renew. Sustain. Energy Rev. 2011, 15, 871–875. [Google Scholar] [CrossRef]
  7. USEPA Definition of Green Building. Available online: https://archive.epa.gov/greenbuilding/web/html/about.html (accessed on 20 May 2020).
  8. Hwang, B.G.; Zhu, L.; Ming, J.T.T. Factors affecting productivity in green building construction projects: The case of Singapore. J. Manag. Eng. 2017, 33. [Google Scholar] [CrossRef]
  9. Wang, W.; Zhang, S.; Su, Y.; Deng, X. An empirical analysis of the factors affecting the adoption and diffusion of GBTS in the construction market. Sustainability 2019, 11, 1795. [Google Scholar] [CrossRef] [Green Version]
  10. Chen, X.; Yang, H.; Lu, L. A comprehensive review on passive design approaches in green building rating tools. Renew. Sustain. Energy Rev. 2015, 50, 1425–1436. [Google Scholar] [CrossRef]
  11. Zhang, Y.; Wang, H.; Gao, W.; Wang, F.; Zhou, N.; Kammen, D.M.; Ying, X. A survey of the status and challenges of green building development in various countries. Sustainability 2019, 11, 5385. [Google Scholar] [CrossRef] [Green Version]
  12. Li, Q.; Long, R.; Chen, H.; Chen, F.; Wang, J. Visualized analysis of global green buildings: Development, barriers and future directions. J. Clean. Prod. 2020, 245. [Google Scholar] [CrossRef]
  13. Todd, J.A.; Pyke, C.; Tufts, R. Implications of trends in LEED usage: Rating system design and market transformation. Build. Res. Inf. 2013, 41, 384–400. [Google Scholar] [CrossRef]
  14. Doan, D.T.; Ghaffarianhoseini, A.; Naismith, N.; Zhang, T.; Ghaffarianhoseini, A.; Tookey, J. A critical comparison of green building rating systems. Build. Environ. 2017, 123, 243–260. [Google Scholar] [CrossRef]
  15. Illankoon, I.M.C.S.; Tam, V.W.Y.; Le, K.N.; Shen, L. Key credit criteria among international green building rating tools. J. Clean. Prod. 2017, 164, 209–220. [Google Scholar] [CrossRef]
  16. Shan, M.; Hwang, B. gang Green building rating systems: Global reviews of practices and research efforts. Sustain. Cities Soc. 2018, 39, 172–180. [Google Scholar] [CrossRef]
  17. Zhang, C.; Cui, C.; Zhang, Y.; Yuan, J.; Luo, Y.; Gang, W. A review of renewable energy assessment methods in green building and green neighborhood rating systems. Energy Build. 2019, 195, 68–81. [Google Scholar] [CrossRef]
  18. Liu, G.; Li, X.; Tan, Y.; Zhang, G. Building green retrofit in China: Policies, barriers and recommendations. Energy Policy 2020, 139. [Google Scholar] [CrossRef]
  19. De Santoli, L.; Lo Basso, G.; Nastasi, B. Innovative Hybrid CHP systems for high temperature heating plant in existing buildings. Energy Procedia 2017, 133, 207–218. [Google Scholar] [CrossRef]
  20. Ahmad, T.; Aibinu, A.A.; Stephan, A. Managing green building development—A review of current state of research and future directions. Build. Environ. 2019, 155, 83–104. [Google Scholar] [CrossRef]
  21. Darko, A.; Zhang, C.; Chan, A.P.C. Drivers for green building: A review of empirical studies. Habitat Int. 2017, 60, 34–49. [Google Scholar] [CrossRef]
  22. Oyedokun, T.B. Green premium as a driver of green-labelled commercial buildings in the developing countries: Lessons from the UK and US. Int. J. Sustain. Built Environ. 2017, 6, 723–733. [Google Scholar] [CrossRef]
  23. Zhang, L.; Wu, J.; Liu, H. Policies to enhance the drivers of green housing development in China. Energy Policy 2018, 121, 225–235. [Google Scholar] [CrossRef]
  24. Wu, Z.; Jiang, M.; Cai, Y.; Wang, H.; Li, S. What Hinders the Development of Green Building? An Investigation of China. Int. J. Environ. Res. Public Health 2019, 16, 3140. [Google Scholar] [CrossRef] [Green Version]
  25. Smith, R.M. Planning for urban sustainability: The geogrpahy of LEED®-neighborhood developmentTM (LEED®-NDTM) projects in the United States. Int. J. Urban Sustain. Dev. 2015, 7, 15–32. [Google Scholar] [CrossRef]
  26. Cidell, J. Building green: The emerging geography of LEED-certified buildings and professionals. Prof. Geogr. 2009, 61, 200–215. [Google Scholar] [CrossRef]
  27. Kaza, N.; Lester, T.W.; Rodriguez, D.A. The Spatio-temporal Clustering of Green Buildings in the United States. Urban Stud. 2013, 50, 3262–3282. [Google Scholar] [CrossRef]
  28. Qiu, Y.; Tiwari, A.; Wang, Y.D. The diffusion of voluntary green building certification: A spatial approach. Energy Effic. 2015, 8, 449–471. [Google Scholar] [CrossRef]
  29. Smith, R.M. “Green” building in India: A comparative and spatial analysis of the LEED-India and GRIHA rating systems. Asian Geogr. 2015, 32, 73–84. [Google Scholar] [CrossRef]
  30. Zou, Y.; Zhao, W.; Zhong, R. The spatial distribution of green buildings in China: Regional imbalance, economic fundamentals, and policy incentives. Appl. Geogr. 2017, 88, 38–47. [Google Scholar] [CrossRef]
  31. Shen, L.; Huang, Z.; Wong, S.W.; Liao, S.; Lou, Y. A holistic evaluation of smart city performance in the context of China. J. Clean. Prod. 2018, 200, 667–679. [Google Scholar] [CrossRef]
  32. Pawlak, Z. Rough Sets. Int. J. Comput. Inf. Sci. 1982, 11, 341–356. [Google Scholar] [CrossRef]
  33. Del Giudice, V.; De Paola, P.; Cantisani, G.B. Rough Set Theory for Real Estate Appraisals: An Application to Directional District of Naples. Buildings 2017, 7, 12. [Google Scholar] [CrossRef]
  34. Renigier-Bilozor, M.; Janowski, A.; d’Amato, M. Automated Valuation Model based on fuzzy and rough set theory for real estate market with insufficient source data. Land Use Policy 2019, 87. [Google Scholar] [CrossRef]
  35. Zhang, W.; Xu, X.; Chen, X. Social vulnerability assessment of earthquake disaster based on the catastrophe progression method: A Sichuan Province case study. Int. J. Disaster Risk Reduct. 2017, 24, 361–372. [Google Scholar] [CrossRef]
  36. Kuo, C.-F.J.; Lin, C.-H.; Hsu, M.-W.; Li, M.-H. Evaluation of of intelligent green building policies in Taiwan—Using fuzzy analytic hierarchical process and fuzzy transformation matrix. Energy Build. 2017, 139, 146–159. [Google Scholar] [CrossRef]
  37. Streimikiene, D.; Skulskis, V.; Balezentis, T.; Agnusdei, G.P. Uncertain multi-criteria sustainability assessment of green building insulation materials. Energy Build. 2020, 219. [Google Scholar] [CrossRef]
  38. Mao, P.; Qi, J.; Tan, Y.; Li, J. An examination of factors affecting healthy building: An empirical study in east China. J. Clean. Prod. 2017, 162, 1266–1274. [Google Scholar] [CrossRef]
  39. Ma, G.; Liu, Y.; Shang, S. A Building Information Model (BIM) and Artificial Neural Network (ANN) Based System for Personal Thermal Comfort Evaluation and Energy Efficient Design of Interior Space. Sustainability 2019, 11, 4972. [Google Scholar] [CrossRef] [Green Version]
  40. Chen, Y.; Zhang, S.; Zhang, Y.; Xu, L.; Qu, Z.; Song, G.; Zhang, J. Comprehensive assessment and hierarchical management of the sustainable utilization of urban water resources based on catastrophe theory. J. Taiwan Inst. Chem. Eng. 2016, 60, 430–437. [Google Scholar] [CrossRef]
  41. Zeeman, E.C. Catastrophe Theory. Sci. Am. 1976, 234, 65–83. [Google Scholar] [CrossRef]
  42. Wang, J.; Shen, L.; Ren, Y.; Wei, X.; Tan, Y.; Shu, T. An alternative model for evaluating the balance of carrying capacity between functional urban infrastructures. Environ. Impact Assess. Rev. 2019, 79. [Google Scholar] [CrossRef]
  43. Jia, Z.; Cai, Y.; Chen, Y.; Zeng, W. Regionalization of water environmental carrying capacity for supporting the sustainable water resources management and development in China. Resour. Conserv. Recycl. 2018, 134, 282–293. [Google Scholar] [CrossRef]
  44. Hak, T.; Janouskova, S.; Moldan, B. Sustainable Development Goals: A need for relevant indicators. Ecol. Indic. 2016, 60, 565–573. [Google Scholar] [CrossRef]
  45. Wang, J.; Ren, Y.; Shu, T.; Shen, L.; Liao, X.; Yang, N.; He, H. Economic perspective-based analysis on urban infrastructures carrying capacity—A China study. Environ. Impact Assess. Rev. 2020, 83. [Google Scholar] [CrossRef]
  46. Xiao, Y.; Qiao, Z. The problems and countermeasures for implementing green building in China. In Proceedings of the 2009 International Conference on Information Management, Innovation Management and Industrial Engineering, Xi’an, China, 26–27 December 2009; Volume 1, pp. 114–118. [Google Scholar] [CrossRef]
  47. Prum, D.A.; Tetsuo, K. Green building geography across the United States: Does governmental incentives or economic growth stimulate construction? Real Estate Law J. 2014, 43. [Google Scholar] [CrossRef]
  48. Darko, A.; Chan, A.P.C. Critical analysis of green building research trend in construction journals. Habitat Int. 2016, 57, 53–63. [Google Scholar] [CrossRef]
  49. Zuo, J.; Zhao, Z.-Y. Green building research-current status and future agenda: A review. Renew. Sustain. Energy Rev. 2014, 30, 271–281. [Google Scholar] [CrossRef]
  50. Green Building Action Programme. Available online: http://www.gov.cn/zwgk/2013-01/06/content_2305793.htm (accessed on 20 May 2020).
  51. Implementation Rules and Evaluation Criteria of the National Green Building Innovation Award. Available online: http://www.mohurd.gov.cn/wjfb/201101/t20110130_202254.html (accessed on 20 May 2020).
  52. Kesidou, E.; Wu, L. Stringency of environmental regulation and eco-innovation: Evidence from the eleventh Five-Year Plan and green patents. Econ. Lett. 2020, 190. [Google Scholar] [CrossRef]
  53. Moncaster, A.M.; Symons, K.E. A method and tool for ‘cradle to grave’ embodied carbon and energy impacts of UK buildings in compliance with the new TC350 standards. Energy Build. 2013, 66, 514–523. [Google Scholar] [CrossRef] [Green Version]
  54. Nguyen, T.H.; Toroghi, S.H.; Jacobs, F. Automated Green Building Rating System for Building Designs. J. Archit. Eng. 2016, 22, A4015001. [Google Scholar] [CrossRef]
  55. Release of the First Green Building Materials Evaluation Label. Available online: http://www.mohurd.gov.cn/zxydt/201605/t20160530_227640.html (accessed on 20 May 2020).
Figure 1. Methodology framework.
Sustainability 12 05988 g001
Figure 2. Weighting values, catastrophe model types and calculation principles in the modified CEPT framework.
Sustainability 12 05988 g002
Figure 3. Spatial distribution of regional green building development in the aspects of certification, economy, policy and technology.
Sustainability 12 05988 g003aSustainability 12 05988 g003b
Figure 4. Spatial distribution of regional green building development in China.
Sustainability 12 05988 g004
Table 1. The certification, economy, policy, and technology (CEPT) framework for measuring regional green building development in China.
CategoryFirst LayerSecond LayerIndicator LayerUnits
Certification (A1)Certification (B1)Certification (C1)Number of certified green buildings (D1)Unit
Proportion of buildings with high-level certification (D2)%
Economy (A2)Industry (B2)Industry (C2)Total output value in construction industry (D3)Billion yuan
Output value of construction (D4)Billion yuan
Value added in construction industry (D5)Billion yuan
Output value of building construction (D6)Billion yuan
Enterprise (B3)Enterprise (C3)Number of construction enterprises (D7)Unit
Number of staff and workers in construction enterprises (D8)Person
Finance (C4)Total profits of construction enterprises (D9)Billion yuan
Paid-up capitals of construction enterprises (D10)Billion yuan
Total assets of construction enterprises (D11)Billion yuan
Business revenue of construction enterprises (D12)Billion yuan
Contract (C5)Total value of contracts (D13)Billion yuan
Value from contracts signed in last year (D14)Billion yuan
Value from new contracts signed in this year (D15)Billion yuan
Efficiency (B4)Efficiency (C6)Labor productivity (D16)Yuan/person
Value of machines per laborer (D17)Yuan/person
Ratio of profits to gross output value (D18)%
Ratio of pre-tax profit to gross output value (D19)%
Policy (A3)Policy (B5)Policy (C7)Number of local policies (D20)Unit
Technology (A4)Technology (B6)Technology (C8)Total power of machinery and equipment owned (D21)kw
Net value of machinery and equipment owned (D22)Yuan
Number of green building material labels (D23)Unit
Number of green building innovation awards (D24)Unit
Number of green building patents (D25)Unit
Note: Yuan is the legal currency of China, 1 yuan ≈ 0.14 US dollar.
Table 2. Common catastrophe models and their potential functions.
CategoryDimension of Control VariablesPotential FunctionNormalization Formula
Folded model1 f ( x ) = x 3 + a x x a = a
Cusp model2 f ( x ) = x 4 + a x 2 + b x x a = a ; x b = b 3
Swallowtail model3 f ( x ) = x 5 + a x 3 + b x 2 + c x x a = a ; x b = b 3 ; x c = c 4
Butterfly model4 f ( x ) = x 6 + a x 4 + b x 3 + c x 2 + d x x a = a ; x b = b 3 ;
x c = c 4 ; x d = d 5
Table 3. Data sources of indicators for measuring regional green building development.
IndicatorData SourcePublication Institution
D1, D2The website of Chinese Green Building Evaluation Label
(http://www.cngb.org.cn/)
The Development Centre for Science, Technology and Industrialization of MOHURD
D3, D4, D5, D6, D7, D8, D9, D10, D11, D12, D13, D14, D15, D16, D17, D18, D19, D21, D22The website of National Bureau of Statistics
(http://www.stats.gov.cn/)
The National Bureau of Statistics
D20The website of Chinalawinfo Database
(http://www.lawinfochina.com/)
The Legal Information Center and Yinghua Company of Peking University
D24The website of MOHURD
(http://www.mohurd.gov.cn/wjfb/201507/t20150714_222929.html)
The MOHURD
D25The website of National Intellectual Property Administration
(http://pss-system.cnipa.gov.cn/sipopublicsearch/portal/uiIndex.shtml)
The National Intellectual Property Administration
Table 4. Calculation results and ranks of regional green building development in China.
RegionA1RankA2RankA3RankA4RankPRank
Jiangsu0.46980.98110.46690.93010.9131
Tianjin0.56530.851180.69230.75550.9072
Chongqing0.50960.88991.00010.588110.9063
Beijing0.53950.881110.55250.80220.9034
Guangdong0.63620.91050.361160.79730.8975
Zhejiang0.55940.93620.59040.581120.8926
Shanghai0.71910.860170.466100.578130.8857
Hubei0.367100.91930.55260.72060.8808
Hebei0.266220.866140.80820.62180.8659
Anhui0.48270.874120.55270.506150.86310
Shandong0.343140.91440.361170.76640.86311
Hunan0.342150.89380.295200.69370.84412
Shaanxi0.269210.861160.51180.536140.83413
Henan0.272200.90870.295210.60990.82614
Guangxi0.38590.816220.361180.490160.82415
Fujian0.337160.90960.295220.485170.82116
Liaoning0.356110.872130.209300.599100.82017
Sichuan0.326170.886100.295230.461180.81318
Inner Mongolia0.290190.793250.466110.379210.80219
Yunnan0.347120.842190.295240.397200.80120
Xinjiang0.347130.812240.295250.335230.78721
Jilin0.246230.826200.295280.281260.76322
Guizhou0.204240.777270.466120.256280.76223
Hainan0.303180.678300.295290.055310.68224
Shanxi0.000250.825210.417130.449190.62825
Heilongjiang0.000260.778260.361190.366220.60326
Jiangxi0.000270.865150.295260.320240.59927
Gansu0.000290.815230.295270.291250.58728
Ningxia0.000280.742280.417140.259270.58529
Qinghai0.000300.728290.417150.211290.57230
Tibet0.000310.411310.000310.065300.26131
Table 5. Number of green buildings in the top ten provinces and their capitals in 2015.
ProvinceNumberCapitalNumberPercentage
Jiangsu288Nanjing2910.07%
Guangdong132Guangzhou2921.97%
Shaanxi115Xi’an7867.83%
Zhejiang96Hangzhou3839.58%
Shandong71Jinan2230.99%
Hubei62Wuhan3759.68%
Hunan57Changsha4171.93%
Jilin55Changchun1834.55%
Hebei47Shijiazhuang612.77%
Henan45Zhengzhou1431.11%
Total1035 31232.23%

