Article

Green Cities and Waste Management: The Restaurant Industry

1
Gabelli School of Business, Roger Williams University, Bristol, RI 02809, USA
2
School of Health Administration, Texas State University, San Marcos, TX 78666, USA
3
College of Business, Western New England University, Springfield, MA 01119, USA
*
Authors to whom correspondence should be addressed.
Sustainability 2020, 12(15), 5964; https://doi.org/10.3390/su12155964
Submission received: 16 June 2020 / Revised: 14 July 2020 / Accepted: 22 July 2020 / Published: 24 July 2020
(This article belongs to the Section Economic and Business Aspects of Sustainability)

Abstract

:
“Green Cities” are cities with the ultimate goal of achieving a net zero-carbon footprint in energy, transportation, architecture, and the activity cost chain of businesses. These cities define the future of our planet by emphasizing the efficient use of resources and the well-being of communities. This study focuses on “Green Cities” and the restaurant industry. It examines the beliefs of restaurant owners/managers on the positive impact of sustainability practices on financial situation, reputation, and attraction of customers, and the relationship between such beliefs and the extent of engagement in sustainability practices. The research also explores whether declaring a city “Green” enhances the sustainability practices in that city. The results indicate that the restaurant owners/managers in all three studied cities strongly believe that sustainability practices enhance the financial performance, reputation of the restaurant, and attraction of customers, yet a significant percentage of the wastes and by-products of the operations of the studied restaurants are discarded. In addition, the results of the study show no significant impact on sustainability practices in the studied restaurants for the declared “Green” cities of Providence (U.S.) and Nancy (France) versus the city of Springfield (U.S.). The study concludes by highlighting the potential reasons underlying the lack of sustainability practices in the restaurant industry and proposes recommendations that can enhance such practices in this industry.

1. Introduction

Energy, water, health of customers and employees, supply materials, logistics, and the produced wastes place the restaurant industry on the top of the list of industries that have major impacts on greening the planet. The restaurant industry is not only the largest consumer of water and energy, but it also produces a diverse array of wastes and by-products with the most potential for recycling, reselling, reusing, and the possibility of donation. On average, a restaurant produces 25,000 to 75,000 pounds of waste per year [1]. A report by the Food Waste Reduction Alliance [2] indicates that only 14.3% of the leftover food is recycled, 1.4% donated, and the rest, 84.3% of such food, is discarded.
The studies on the restaurant industry and eco-operations across various countries all indicate that green practices do have positive impacts on the performance of the restaurants—the financial situation, resource efficiency, and customer attraction (e.g., [3,4]). In addition, the research indicates that the restaurant owners/managers believe that green practices have significant positive impacts on the financial situation, competitive advantage, and efficient use of resources (e.g., [5,6]).
In order to address the sustainability practices in the restaurant industry, this study expands upon the current research by exploring the relationship between the perception of restaurant owners/managers on the impacts of sustainability practices on financial performance, reputation, and attraction of customers, both in the U.S. and the European Union cities. In addition, the study examines the profile of these restaurants including services provided, capacity, and the type of the restaurant. Furthermore, this research investigates how owners/managers treat a comprehensive list of diverse wastes and by-products of the operations of their restaurants along different aspects of the sustainability practices—recycle, resell, reuse, and in appropriate cases, donation. The study also considers other factors, such as the extent of the training of the owners/managers, and their willingness to have training on enhancing the sustainability practices in this industry.
Another area that this study expands upon the current literature on sustainability practices in the restaurant industry is by investigating whether governmental and/or municipal regulations and declaring a city “Green” enhance the sustainability practices in this industry. The selected cities for this study include two declared “Green” cities, one in the U.S. and one in the European Union, versus a non-declared “green” city in the U.S.
Different sections of the study include one that covers the literature review, followed by sections on research goals, materials and methods, results, and discussion. The final section of the study highlights the impediments in practicing sustainability in the restaurant industry and proposes strategies that can enhance waste management in this industry.

2. Literature Review

Several studies on the restaurant industry in Taipei, Taiwan [3,4,7,8] concentrated on different factors, such as the compatibility of the equipment/technology with green practices, the ease of implementation of green practices, the efficient use of resources, and the personal values of customers. These studies concluded that these factors were essential in enhancing green operations in restaurants in Taiwan with positive impacts on the economic situation of the restaurant.
Chiu and Hsieh [3], in their study of the restaurants in Taiwan, concluded that the cost of implementation of green operations in restaurants can be compensated by better economic performance of the restaurants. Chou et al. [4] conducted research on the attitude and perception of restaurant managers towards green practices in the restaurant industry in Taipei, Taiwan. According to the results of the research, several factors influenced the perception of the managers in regard to green practices and positive impacts on the economic situation of the restaurant [4]. These factors included the compatibility of the equipment/technology with green practices, the ease of implementation of green practices, and the more efficient use of resources [4]. The result of the study indicated that the above factors had a positive influence on adopting and implementing green practices by the restaurant managers of the surveyed restaurants in Taipei [4].
Teng et al. [7] studied the relationship between green restaurants and customers’ visits in Taipei, Taiwan. The results of the study indicated that the personal values of customers influenced their decision in patronizing green restaurants [7]. The recommendation of the research was that the managers of the restaurants needed to identify and enhance the customers’ attitudes in patronizing green restaurants [7].
Chou et al. [8] conducted another study of the restaurants in Taipei, Taiwan, in regard to the “sustainable service innovation”. The authors interviewed scholars, restaurant managers, and government experts. The results of their research indicated that for eco-operations in restaurants, several factors were important. These factors included “sustainable service innovation,” technology for food service, knowledge, organizational environment, and adoption of innovation [8]. The authors concluded that the above factors were not only essential in enhancing green operations in restaurants, but they also had a positive impact on their financial performance [8].
Llach et al. [9] studied the relationship between “quality and environmental practices “and the performance of restaurants in Madrid, Spain. The dimensions of the performance studied included the efficient use of resources, financial improvement, and enhancing the competitive advantage of the restaurants. The findings indicated that a combination of quality and environmental management practices had a significant positive impact on the financial situation of the restaurants, gaining competitive advantage, and the market success for restaurants [9].
Filimonau and Krivcova [5] explored the green operations of restaurants in the light of consumer’s choice in Bournemouth, England. They contended that the menus of restaurants needed to be re-designed to inform customers of environmental and social impacts of their choices [5]. The authors also discussed the restaurant owners’ perspective on re-designing the menus. According to their findings, even though the restaurant owners were aware of the importance of eco-operations and re-design of the menu, the lack of resources, complexity in the operations of a restaurant, and inconsistency in customers’ demands were the impediments in re-designing the menu for a greener and more responsible food choice [5].
In their study of the restaurants in Brazil, Bossle et al. [6] investigated the eco-innovative practices on the supply and the demand sides in the food industry. The findings indicated that technology, strategies, the mission, and the personal motivation of managers of the companies concentrating on the health of the consumers were important factors in adopting eco-practices [6]. The results also indicated that legislations and regulations were ineffective in enforcing eco-operation practices [6]. In addition, the Brazilian consumers regarded technology as a major factor in producing healthy and eco-friendly food products [6].
Several studies on the restaurant industry in the U.S. focus on the customers along other factors (e.g., [10,11,12]). Dewald et al. [10] conducted a research of the U.S. restaurant industry. Their research focused on customers frequenting a green restaurant and their willingness to pay more for dining in such restaurants. The results of their study indicated that 90% of the customers in their sample data had eaten in a green restaurant, and more than half were willing to pay more for dining in green restaurants. However, the research indicated that the customers were not clear about the term “green restaurant”, and that the word of mouth was the factor in frequenting such restaurants [10].
Another study on 512 restaurants in the U.S. by Namkunga and Jang [11] showed that customers with greater knowledge and information about health and environment cared about green practices of restaurants. As a result, the type of restaurants, upscale casual diners, had more eco-operations than other types of restaurants [11].
According to the research in the fast-service restaurants in the Midwest of the U.S. conducted by DiPietro et al. [12], customers were not willing to pay more for the fast food due to the green practices of the restaurants even though they thought restaurants should adopt green practices. The authors concluded that increasing customers’ knowledge through marketing practices was important to enhance patronization of green restaurants [12].
The study by Kim and Hall [13] of Korean restaurants concentrated on the relationship between sustainability practices and customer loyalty. The authors tested several hypotheses concerning the sustainability practices and positive impact on customer “hedonic” and “utilitarian” values. The study concluded that restaurants needed to consider practicing food sustainability and waste management beyond cost reduction since such practices had the potential of increasing the loyalty of the customers and the enjoyment of dining in a restaurant [13].
In summarizing the results of the research in this area, the pronounced impediments to practicing sustainability in the restaurant industry indicate: (1) Lack of adequate knowledge and information on the side of both restaurant owners/managers and customers [6,7,8,11,13]; (2) the nature of the restaurant industry [11,12]; (3) regular customers and tourists that can impact the increase of food wastes in restaurants [6]; (4) lack of appropriate knowledge and technology in dealing with eco-waste management [4,8]; (5) design of the menus [5]; and (6) complexity in operations of a restaurant [5,6].
This study builds upon the reviewed literature, expands upon the current studies along several dimensions, and examines the sustainability practices of 126 different restaurants in three cities, two in the U.S. and one in the European Union. The analysis is the first of its type in that it assesses whether declaring a city “Green” has an influence on sustainability practices in the restaurant industry. In addition, the study includes an extensive list of the wastes and by-products of the operations of the restaurants in investigating the proposed hypotheses.

3. The Research Goals

In order to address the sustainability practices in the restaurant industry, this research explores the relationship between the perception of restaurant owners/managers regarding the impact of sustainability practices on financial performance, reputation, and attraction of customers, and expands upon the current studies by exploring the following questions: Do restaurant owners/managers believe that sustainability practices have positive impacts on financial situation, reputation, and attraction of customers? If so, do they engage in sustainability practices? In addition, the study examines the profile of these restaurants, services provided, capacity, type of the restaurant, and how owners/managers treat a comprehensive list of diverse wastes and by-products of the operations of their restaurants along different aspects of the sustainability practices—recycle, resell, reuse, and in appropriate cases, donation. Furthermore, the study considers other factors, such as the extent of the training of the owners/managers and their willingness to have training to enhance the sustainability practices in their restaurants.
Another area that this study expands upon the current literature on sustainability practices in the restaurant industry is by investigating whether governmental and/or municipal regulations and declaring a city “green” enhance the sustainability practices in this industry. The study analyzes the collected data for any differences in sustainability practices between the restaurants in the two declared “Green” cities in the U.S. and the European Union versus a non-declared “green” city in the U.S. The final section of the study highlights different hurdles in practicing sustainability in the restaurant industry and proposes strategies that can enhance waste management in this industry.

4. Materials and Methods

4.1. Selected Cities

The research on waste management concentrates on turning the waste materials into energy or other usable materials [14,15]. Several cities across the U.S., such as San Francisco, Seattle, New York, Denver, Boston, and Providence, have undertaken initiatives for sustainability practices in utilization of energy, land, buildings, transportation, and waste management among other areas. The goals of declaring a city “Green” are achieving not only a green eco-system, but also improving the humanitarian part of the operations management [16]. In order to investigate how the restaurant industry can contribute to the sustainability of the physical environment and human population, the data for this research were collected from three cities, Providence, Rhode Island, Springfield, Massachusetts, and Nancy, France.
The three cities for this study were selected based on the number of restaurants per capita, Green city designation, and accessibility of the locations to the researcher. The two selected cities located in the northeast of the U.S. were Providence, a declared Green city with the largest number of restaurants per capita, and Springfield, not a declared Green city, the fourth largest city in the states of New England. Nancy, in the northeast of France, is a declared Green City, represents an EU city for the comparative base for the study, and it was accessible to the researcher. These three cities have high concentration of restaurants, and since the survey questionnaire was filled out in the presence of the researcher, accessibility to the restaurants was essential. Furthermore, the studied restaurants in these three cities had very similar profiles, such as the capacity of the restaurants, the services provided, and the types of the restaurants.
Providence, a declared “Green” city, is the third largest city in the states of New England after Boston and Worcester [17]. In addition, Providence has the highest number of restaurants per capita in the nation [18]. Some of the current green goals of the city of Providence are incorporated in the following documents—“Collaborative Research and Sustainable Practices” and “Connecting Public Policy & Academic Research for Rhode Island” [19].
Springfield is the fourth largest city in the states of New England [17], but not a declared “Green” city. In Massachusetts, 49 cities and towns are currently declared green communities [20,21]. However, the focus of the green communities in Massachusetts is on “energy” and assisting the communities and cities in becoming more energy efficient and decreasing their carbon footprint.
In the European Union (EU), achieving a net-zero carbon emission economy by the year 2050 [22] and the European Union Commission’s food waste goals [23] concentrate on decarbonization of different industries and reduction of wastes to achieve these goals. In addition, the EU has directives per each industry as to its sustainability practices [24]. Nancy, as an EU city, is subject to the European Union Commission goals and directives for the year 2050 to establish a net-zero carbon emission economy [23,24]. Furthermore, Nancy, as a declared “Sustainable Green City,” is required to implement the sustainability goals set by the city [25]. Some of these goals include concentration on creating a green environment through reduction of food wastes, recycling, and reusing of the wastes produced by different businesses across the city [25]. As a result, the city of Nancy, with a high concentration of restaurants similar to Providence and Springfield, is selected to further study the operations of the restaurants in an environment that not only needs to meet the directive of the EU, but also the goals of a city that is declared “Green”.

4.2. Wastes and By-Products of the Operations of the Restaurants

This research included a comprehensive list of the wastes and by-products produced by the operations of the restaurants. These wastes and by-products included in the study were cardboard, glass containers, plastic containers, metal, and plastic bags. In addition, the study included the following by-products: Leftover cooking oil, leftover trimmings of meat and vegetables, leftover customer food, spoiled food, and the unused prepared food and bread at the end of the day. The list of the wastes and by-products of the operations of the restaurants was compiled based upon a discussion with six restaurant owners/managers in Providence, in addition to the university cafeteria of the researcher.

4.3. Research Hypotheses

A major focus of this study was to investigate the relationship between the perception of restaurant owners/managers as far as the impacts of sustainability practices on financial performance, reputation, and attraction of customers. The following Hypotheses (H1–H3) address this part of the research.
Hypothesis 1 (H1).
Restaurant owners/managers believe that sustainability practices have a positive impact on the financial situation of the restaurant.
Hypothesis 2 (H2).
Restaurant owners/managers believe that sustainability practices have a positive impact on reputation of the restaurants.
Hypothesis 3 (H3).
Restaurant owners/managers believe that sustainability practices have a positive impact on attraction of customers.
Another major goal of the study was to examine if the restaurant owners/managers believed that sustainability practices enhanced the financial performance, reputation, and attraction of their customers, and did they practice sustainable waste management in their restaurants? The following Hypothesis (H4) examines this question.
Hypothesis 4 (H4).
The beliefs of the restaurant owners/managers in regard to the positive impacts of sustainability practices on performance of their restaurants enhance recycling, reusing, reselling, and in appropriate cases donation of the wastes and by-products of the operations of their restaurants.
In addition, this research explored whether the restaurant owners/managers had any training in sustainability practices and if so, the impact of such training on the sustainability practices by the restaurant owners/managers. Hypothesis (H5) addresses this part of the study.
Hypothesis 5 (H5).
Training of the restaurant owners/managers enhances the sustainability practices in the restaurants.
Another major goal of the study was to investigate if governmental and municipal rules and regulations set for “Green” cities versus a non-declared “Green” city had any impact on enhancing the sustainability practices in the studied restaurants. Hypothesis (H6) examines this goal.
Hypothesis 6 (H6).
Declaring a city “Green” enhances sustainability practices in that city’s restaurants.

4.4. Sampling Frame and Sample Size

The sampling frame for selecting restaurants within the studied cities was based on the results from the Google search engine, aggregation of the restaurants in different part of the selected cities, and their accessibility. The restaurant owners/manager were then contacted by phone to check the availability and their willingness to participate in the study. To collect the data, a questionnaire was given to the owners/managers, who completed it in the presence of the researcher, who reviewed each question and provided explanation if needed.
In the city of Providence, 110 restaurants were identified as potential subjects and 45 questionnaires were completed, yielding a 40% rate of return. In Springfield, 66 restaurants were identified with 31 questionnaires completed, yielding a rate of return of 46%. For the city of Nancy, the survey questionnaire was translated into French. A total of 78 restaurants were identified, and the data were collected from 50 restaurants, yielding a rate of return of 64%. The total number of participating restaurants was 126.

4.5. Instrument

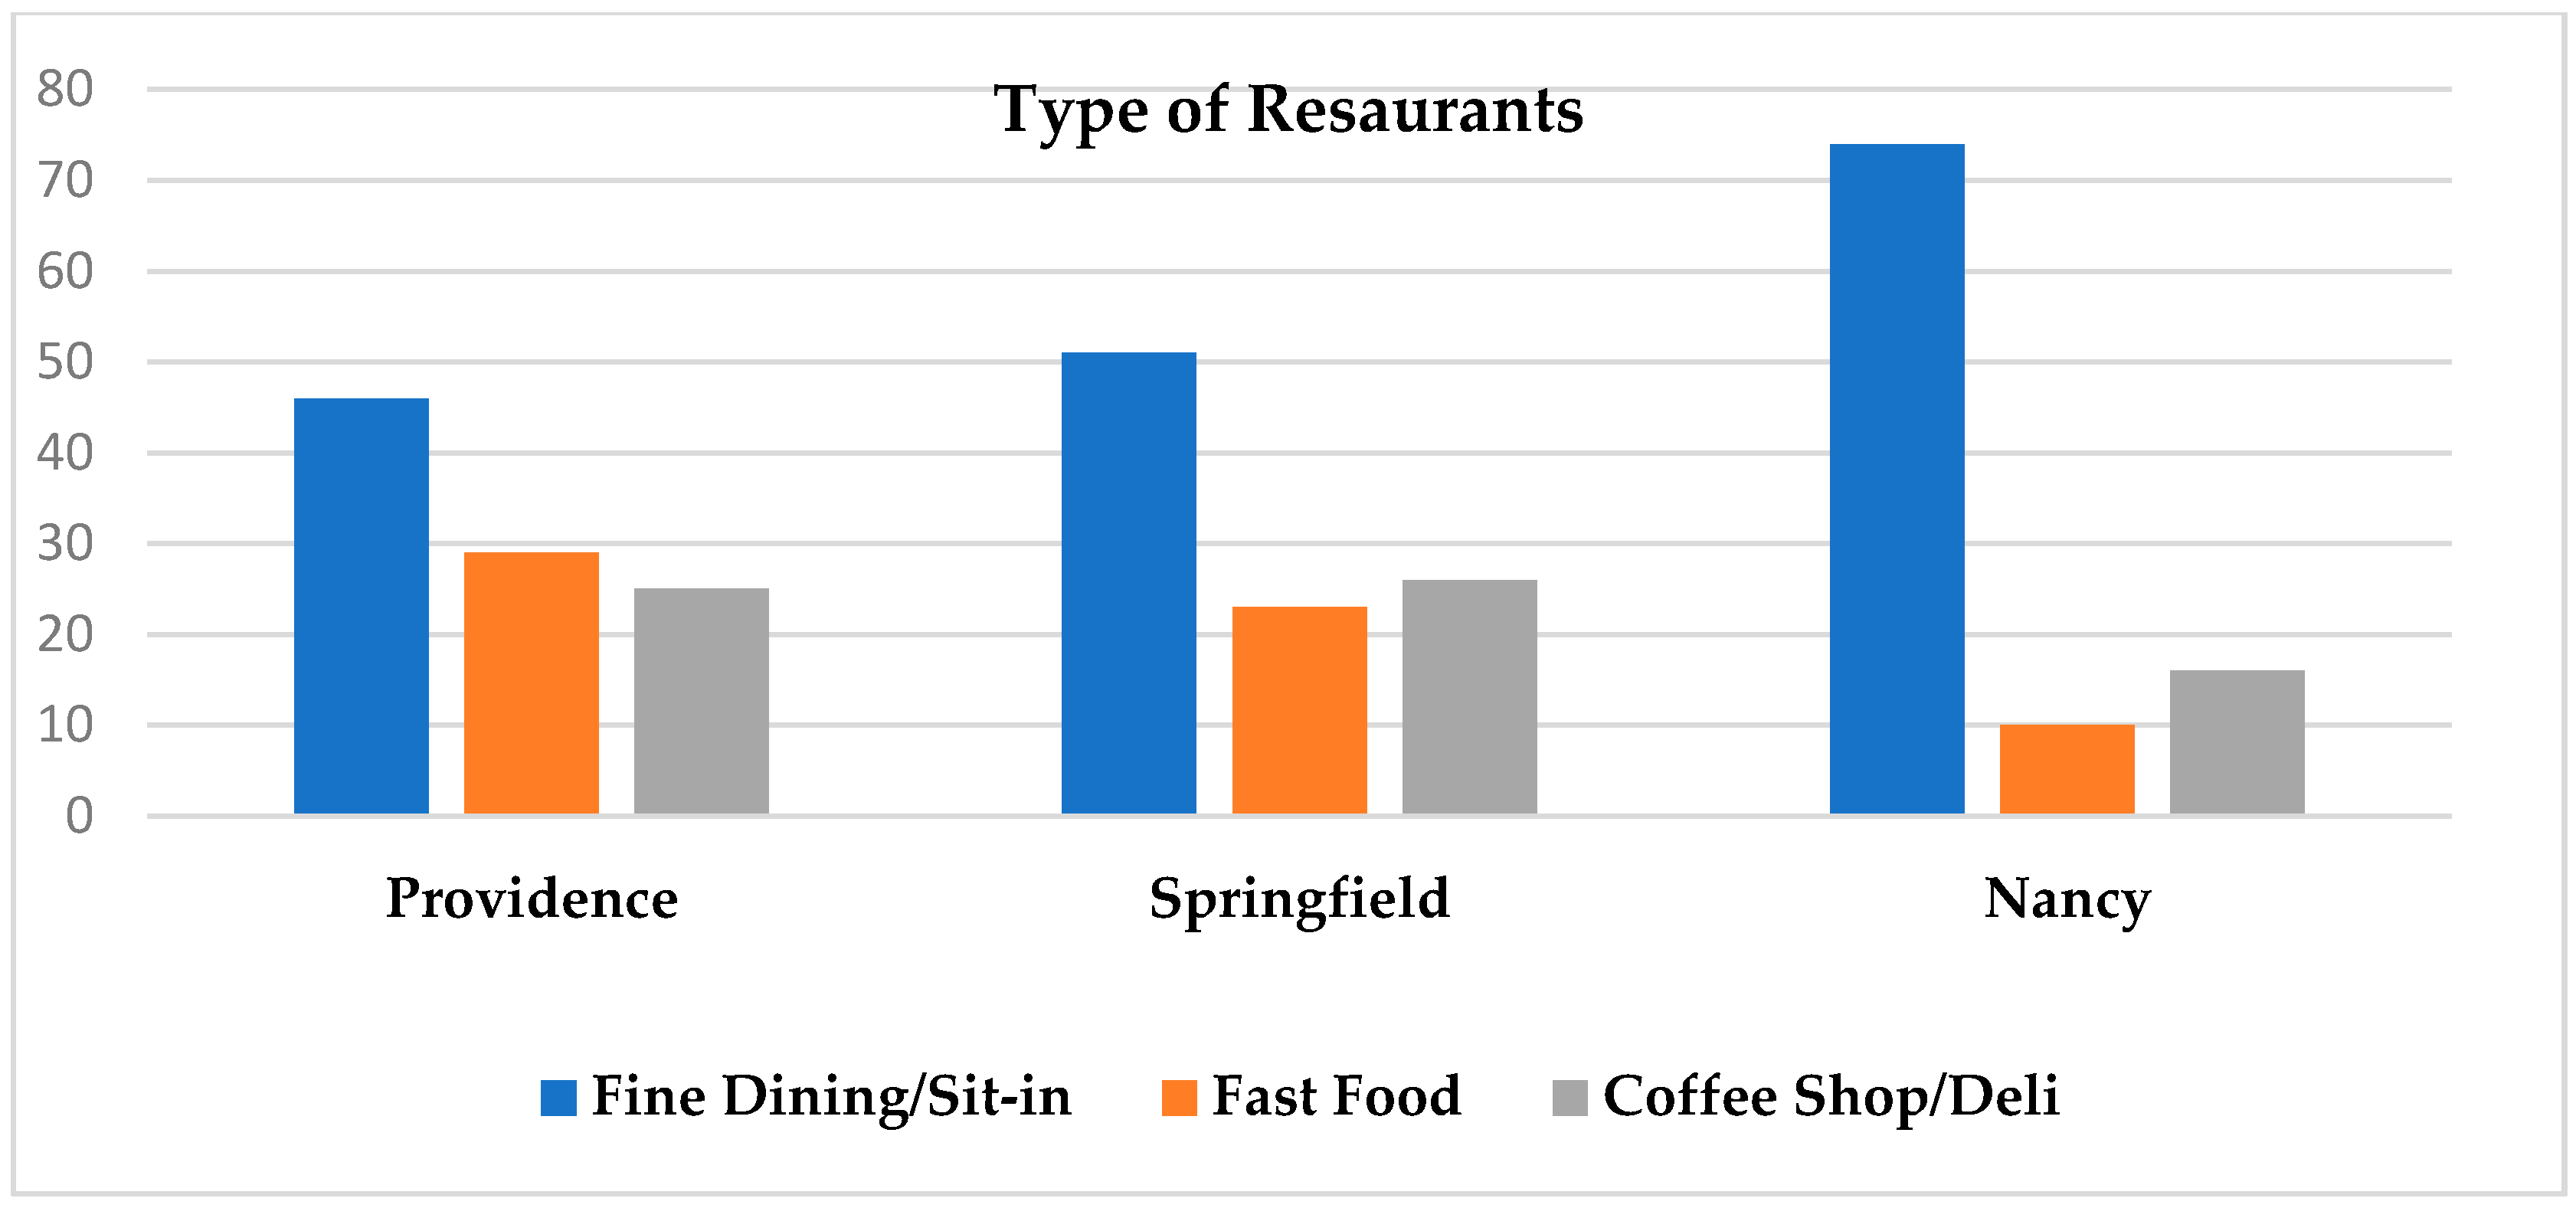
The questionnaire used in this research included several sections. The first section focused on demographic information—the number of services provided per day (breakfast, lunch, and dinner) and the capacity of the restaurant, from fewer than 25 customers to more than 100 customers. In addition, the restaurants were categorized as fine dining and sit-in, fast food, or coffee shops and delis. The next part of the survey included Likert scaled questions requiring restaurant managers/owners to self-asses their beliefs about the statement that sustainability operations in their restaurants improved financial performance, reputation, and customer attraction.
The following part of the survey was designed to measure the sustainability practices performed by each restaurant. These practices included recycling, reselling, reusing, and in relevant cases, donation of the diverse wastes and by-products from the operations of the restaurants—cardboard, glass bottles, plastic bottles, straws, and containers, metal containers, and plastic bags. The third part of the survey concentrated on the leftover food by-products of the operations of the restaurant at the end of day—leftover cooking oil, leftover meat and vegetable trimmings, leftover customer food, and spoiled food. In addition, the survey measured sustainability practices in regard to the food products remaining unused at the end of the day—day-old bread and unused food. Furthermore, the restaurant owners/managers were asked about any training they had in waste management, as well as their willingness to participate in training sessions for implementation of effective sustainability practices. Both descriptive and quantities analyses were used to study the collected data.

5. Results

5.1. Profiles of the Studied Restaurants

Of the 126 respondents, 75% of the restaurants in the data were from “Green“ cities—Providence: 35%, (45), Nancy: 40% (50), and Springfield (not a declared Green city): 25%. Checking the studied restaurants in Providence and Springfield, none was a member of the “Green Restaurant Association”. As for the Michelin list, only two of the studied restaurants in Nancy were members.
The combined demographic results of the surveyed restaurants as per the number of services provided per day (breakfast, lunch, dinner, the type, and the capacity of restaurants) are presented in Table 1.
The combined demographic results of the surveyed restaurants as per the number of services provided per day (breakfast, lunch, and dinner) and the capacity of the restaurants indicated that 16% of the surveyed restaurants provided three services per day (breakfast, lunch, and dinner), 64% provided two services per day (lunch and breakfast or lunch and dinner), and 20% offered one service per day (breakfast, lunch, or dinner). The combined results of this part of the survey also showed that 64% of the restaurants were fine dining and sit-in restaurants, 10% fast food, and 16% were categorized as coffee shops and delis. In addition, 39% of the restaurants had a capacity of more than 100, 28% had a capacity between 5–100, 23% had a capacity between 25–49, and 10% had a capacity below 25. Figure 1, Figure 2 and Figure 3 present the results for the services per day, the capacity, and the type of the restaurants per each city.
Based on the results presented in Figure 1, the percentages of the restaurants in each city providing three services per day included (Providence: 9%, Springfield: 29%, and Nancy: 12%), two services per day (Providence: 56%, Springfield: 58%, and Nancy: 76%), and one service per day (Providence: 35%, Springfield: 13%, and Nancy: 12%). As per these results, a majority of the restaurants in each city provided two services per day.
The results in Figure 2 for each city show that the majority of the surveyed restaurants in each city had a capacity of 100 or more (Providence: 40%, Springfield: 39%, and Nancy: 40%), a capacity of 100–50 (Providence: 32%, Springfield: 28%, and Nancy: 28%), a capacity between 49–25 (Providence: 16%, Springfield: 19%, and Nancy: 22%), and a capacity below 25 (Providence: 16%, Springfield: 10%, and Nancy: 11%).
Figure 3 indicates that majority of the surveyed restaurants were fine dining and sit-in restaurants (Providence: 46%, Springfield: 51%, Nancy: 74%), the fast food restaurants (Providence: 29%, Springfield: 23%, Nancy: 10%), and coffee shops and delis (Providence: 25%, Springfield: 26%, Nancy: 16%).
The results of this part of the survey indicate that the selected restaurants in the three cities have very similar profiles as far as services provided, capacity, and the type pf the restaurants.

5.2. Sustainability and Financial Performance, Reputation, and Attracting Customers (H1, H2, H3)

A main goal of the study was to examine the beliefs of the restaurant owners/managers regarding the impact of sustainability practices on financial performance, reputation of the restaurants, and attraction of customers. The combined results of this part of the survey are shown in Table 2.
As indicated in Table 2, a significant majority of the restaurant owners/managers believe (strongly agree, agree) that sustainability practices have a positive impact on financial performance (42% + 31% = 73%), reputation of the restaurant (47% + 30% = 77%), and attraction of customers (38% + 26% = 64%). Between 20–31% were not sure, a very small percentage (2–5%) disagreed, and only 1% strongly disagreed as to the positive impact of sustainability practices on the three categories under study. Figure 4 presents these results for each city.
As indicated in Figure 4, a large majority of the restaurant owners/managers in each city believe (strongly agree, agree) that sustainability practices have a positive impact on financial performance (Providence: 76%, Springfield: 72%, Nancy: 70%), reputation of the restaurant (Providence: 81%, Springfield: 80%, Nancy: 70%), and attraction of customers (Providence: 70%, Springfield: 74%, Nancy: 49%). The percentages of those that are unsure as to the impact of sustainability practices on financial performance indicate Providence at 19%, Springfield at 24%, and Nancy at 22%, unsure of the impact on reputation of the restaurants: Providence at 14%, Springfield at 20%, and Nancy at 26%, and unsure as to the attraction of the customers: Providence at 23%, Springfield at 26%, and Nancy at 43%. The percentages for disagreement and strong disagreement are low across these cities along the three categories (0% to 12%).
To further validate the findings of this part of the study, consensus was also utilized to analyze the results of this section. Consensus around an issue can be loosely defined as the shared group feelings about that issue, and is often measured using a Likert scale-based question. Tastle and Wierman [26] created a consensus measure (Cns) as shown in Equation (1) [26].
C n s ( X ) = 1 + t = 1 n p i L o g 2 ( 1 | X i μ x | d x )
In this equation, Xi is the response to the Likert scale question (5-point Likert scale in this study), pi is the probability (or relative frequency) of Xi, µx is the mean of X, and dx is the width of X (i.e., dx = XmaxXmin). In using this consensus measure, a Likert scale question requiring responses ranging from 1 = Strongly Agree, 2 = Agree, 3 = Not Sure, 4 = Disagree, and 5 = Strongly Disagree will have a Cns score of 1 if all respondents chose Strongly Agree, and a Cns score of 0 if responses were evenly split between Strongly Agree and Strongly Disagree. All other combinations of responses fall between zero and 1. Table 3 presents the results of this part of the study.
The consensus measures in Table 3 show that the restaurants polled in this sample collectively feel stronger about the potential positive impact on financial performance (Cns = 0.71) due to sustainability practices, followed by the impact on attracting customers (Cns = 0.65), and the impact on the reputation of the restaurant (Cns = 0.64).
Additionally, the consensus measures for those restaurants operating in the two “Green” cities were examined. The results are presented in Table 4.
As presented in Table 4, similar results are found for the two “Green” city restaurants. There is a stronger consensus around the potential positive financial impact than either the impact on reputation or attracting of new customers similar to the findings for the entire sample indicated in Table 3.
The results of this part of the survey support Hypotheses H1–H3, restaurant owners/managers very strongly/strongly believe that the sustainability practices have significant positive impact on financial performance (H1), followed by reputation of the restaurant (H2), and attraction of the customers (H3). The findings of this part of the study are aligned with findings of the reviewed research that restaurant managers believe sustainability practices can enhance financial performance of the restaurants (e.g., [4,9]) and attraction of the customers (e.g., [7,10,11,13].

5.3. Sustainability and Recycling, Reselling, Reusing, and Discarding of Wastes and By-Products of the Operation of the Restaurants (H4 Part 1)

In the next part of the study, the owners/managers were asked as to how their restaurant treated the wastes and by-products of their operations using the following categories: Cardboard, glass bottles and containers, plastic bottles, straws, and containers, metal containers, and plastic bags. Did they recycle, resell, or reuse these wastes and by-products or discard them? Table 5 indicates the combined results of this part of the survey.
As indicated in Table 5, the waste material with the highest percentage of recycling is cardboard (71%), followed by glass bottles (56%), plastic bottles, straws, and containers (34%), and metal containers, such as aluminum cans (31%). The results show a minimal percentage of resale of the above items (0–3%). In addition, only 5% of cardboard, 6% of glass bottles, 1% of plastic bottles, straws, and containers, 12% of metal wastes, and 6% of plastic bags are reused. Furthermore, a large percentage of these wastes and by-products are discarded (cardboard: 24%, glass bottles: 37%, plastic bottles/straws/containers: 65%, metal containers: 54%). The results also show that the highest percentage of waste materials discarded is plastic bags (79%). A graphical depiction of the data for this part of the survey per each city is shown in Figure 5.
As indicated in Figure 5, the restaurants in Springfield recycle a higher percentage of cardboard (Springfield: 77%, Providence: 69%, Nancy: 68%), glass (Springfield: 59%, Providence: 50%, Nancy: 58%), and metal (Springfield: 43%, Providence: 33%, Nancy: 18%) than the restaurants in the other two cities. The Providence restaurants recycle more of the plastic bottles, straws, and containers than the restaurants in Springfield and Nancy (Providence: 47%, Springfield: 39%, Nancy: 18%), and also plastic bags (Providence: 20%, Springfield: 7%, Nancy: 17%).
Figure 5 shows that there is no reselling of cardboard, glass, and plastic containers by the studied restaurants in Springfield and Providence, and a low percentage (2%) resale of glass containers by the restaurants in Nancy. The Springfield restaurants resell 3% of their metal containers versus Providence (2%), and there is no reselling of such wastes in Nancy (0%). In addition, for the plastic bags, the Springfield restaurants resell 4% of plastic bags versus the restaurants in Providence and Nancy, with no resale of such by-products (0%).
Furthermore, Figure 5 indicates that the surveyed restaurants in Providence, Springfield, and Nancy reuse the metal container by-products of their operations at a very similar percentage (Providence: 13%, Springfield: 13%, Nancy: 12%), while the restaurants in Nancy reuse more of their glass containers (12%) than the restaurants in Providence (5%), with no indication of any such reuse in the restaurants in Springfield (0%). However, the reuse of the cardboard by-products of the restaurants is higher in Providence (9%) and Springfield (9%) than the restaurants in Nancy (0%).
As shown in Figure 5, the lowest percentage of the discarded wastes in the studied restaurants is cardboard (Providence: 22%, Springfield: 17%, Nancy: 32%). As for the other items, in each city, large percentages of other wastes and by-products of the operations of the restaurants are discarded—plastic bottles, straws, and containers (Providence: 57%, Springfield: 61%, Nancy: 82%), metal containers (Providence: 51%, Springfield: 40%, Nancy: 70%), and plastic bags, (Providence: 73%, Springfield: 86%, Nancy: 76%). The restaurants in Nancy show lower percentage of glass bottles being discarded (28%) versus Providence (44%), and Springfield (41%).
The next part of the survey concentrated on the treatment of the leftover items from food preparation, leftover cooking oil, meat trimmings, and vegetable trimmings. The combined results of this part of the survey are shown in Table 6.
As shown in Table 6, 56% of the leftover cooking oil is recycled, 14% is resold, and 6% is reused, while 23% is discarded. In addition, 9% of the leftover meat trimmings are recycled, 0% resold, and 6% reused. As for the leftover vegetable trimmings, 7% are recycled, 0% are resold, and 10% are reused. A large percentage of the leftovers from meat trimmings (85%) and preparing vegetables (83%) are discarded. Figure 6 shows the results of this part of the survey in each city.
As indicated in Figure 6, the leftover cooking oil is recycled at a high percentage in each city (Providence: 49%, Springfield: 50%, Nancy: 70%). As for reselling of the leftover cooking oil, Providence restaurants show a much lower percentage (4%) than the restaurants in Springfield (23%) and those in Nancy (16%). Providence restaurants show a higher percentage of reusing the leftover cooking oil (16%) than the restaurants in Springfield (3%) and Nancy (0%). Meanwhile, 31% of this oil is discarded in Providence, 24% in Springfield, and 14% in the studied restaurants in Nancy.
As for recycling meat trimmings, the restaurants in Providence recycle 13% of the meat trimmings, Springfield 8%, and Nancy 8%. The results show that the restaurants in these cities do not resell any meat trimmings (0%). There is no reuse of meat trimmings in Providence restaurants. Meanwhile, there is a 15% reuse of meat trimmings in Springfield and 3% in Nancy. The results of the study show that a large percentage of the meat trimmings are discarded (Providence: 87%, Springfield: 77%, Nancy: 90%).
As shown in Figure 6, the recycling of the vegetable trimmings indicates that 13% of such trimmings are recycled in Providence, but only 3% in Springfield and 5% in Nancy are recycled. There is no reselling of vegetable trimmings in the restaurants in Providence, Springfield, and Nancy (0%). As for the reuse of the vegetable trimmings, Springfield restaurants show a higher percentage of reusing vegetable trimmings (24%) versus Providence (0%) and Nancy (7%). Again, a significant percentage of vegetable trimmings are discarded (Providence: 87%, Springfield: 73%, Nancy: 88%).

5.4. Sustainability and Donations, Recycling, Reselling, Reusing, and Discarding of the Unused Food of the Day (H4 Continued)

The focus of the next section of the survey was on the unused food of the day (e.g., soups, vegetables, prepared salad, and meat) and the day-old bread and whether they were donated, recycled, reused, resold, or discarded. The combined results of this part of the survey are shown in Table 7.
Table 7 shows that only 13% of the day-old bread and 12% of the unused food of the day are donated, while 8% and 7% are recycled, respectively. In addition, only 1% of the day-old bread and 5% of the unused food of the day are resold. For the reuse category, 31% of the day-old bread and 36% of the unused food of the day are reused. However, a substantial portion of the day-old bread (47%) and the unused food of the day (40%) are discarded. The results of this part of the survey in each city are shown in Figure 7.
As indicated in Figure 7, the restaurants in Providence donate 15% of the day-old bread and 15% of the unused food of the day, the restaurants in Springfield donate 7% in each category, and the restaurants in Nancy donate 17% and 14%, respectively. The restaurants in Nancy recycle 15% of the day-old bread and only 8% of the unused food of the day. In Providence, the restaurants recycle 7% of the day-old bread and 5% of the unused food of the day, and in Springfield, only 3% of the day-old bread and 10% of the unused food of the day are recycled. The results in each city show that in two cities, Providence and Nancy, there is barely any resale of the day-old bread or unused food of the day (Providence: 0%, 2%; Nancy: 0%, 0%). Springfield restaurants show higher percentages of reselling such items (day-old bread: 3%, unused food of the day: 13%). All the studied restaurants indicate much higher percentages of reusing these items, Providence (day-old bread: 40%, unused food of the day: 51%), Springfield (day-old bread: 30%, unused food of the day: 35%), and Nancy (day-old bread: 23%, unused food of the day: 21%). The results also show that the studied restaurants in these cities throw out large percentages of the day-old bread (Providence: 38%, Springfield: 57%, Nancy: 45%) and the unused food of the day (Providence: 27%, Springfield: 35%, Nancy: 57%).
The results of the statistical analyses of this part of the data do not support Hypothesis 4. Even though the restaurant owners/managers strongly believe that sustainability practices enhance the financial performance, reputation of the restaurant, and attraction of the customers, they do not practice sustainable waste management.
To further investigate the extent of engagement of the studied restaurant owners/managers in sustainability practices and the relationship with their belief that such practices have a positive impact on financial performance, reputation, and attraction of customers, non-parametric Spearman’s correlation analyses suitable to survey question with Likert scale responses were conducted. Table 8, Table 9 and Table 10 present these results.
As presented by the results in Table 8, Table 9 and Table 10, the Spearman correlation coefficients, (rs), do not indicate high degrees of correlation between the belief of the restaurant owners/manager on the positive impact of sustainability practices on finance, reputation, and attraction of customers and engagement in sustainability practices. While there are a few statistically significant relationships (p*) as indicated in Table 10, Table 11 and Table 12, the effect size in all cases is small, with the maximum Spearman correlation value being 0.324 between finance and plastic containers. Based on these findings, even though the restaurant owners/managers believe that sustainability practices enhance the financial performance, reputation, and attraction of the customers, there is little correlation with engagement in sustainability practices.

5.5. Waste Disposal and Training (H5)

In the next part of the survey, the owners/managers of the restaurants were asked whether they had any training in sustainability practices. Forty-four percent of the owners/managers in Providence, 47% in Springfield, and 10% in Nancy stated that they had some training. When asked whether they would like to have training in sustainability practices, 56% in Providence, 52% in Springfield, and 89% in Nancy expressed that they would like to have such training.
In order to examine the impact of sustainability training in increasing the likelihood on the waste handling decisions of the restaurant owners/managers, odds ratios and associated 95% confidence intervals were calculated. Training was re-coded as a dichotomous variable on 0 and 1, {0 = No Training, 1 = Training}. All other variables (plastic, metal, glass, and cardboard) were recoded as {0 = Thrown Out, 1 = Not Thrown Out}. Table 11 presents the results of the analysis.
Table 11 presents the odds ratio of our binary logistic regression. Based on this analysis, none of the odds ratios is statistically significant as 1 is in the confidence interval (indicating a 1:1 relationship). Based on these results, the reported training by the restaurant owners/managers had no effect on sustainability practices. When asked about the depth of training received by the owners/managers, the training was mostly along separation of diverse wastes and putting them outside on the curb to be picked-up by the city dump trucks. Based on the results, Hypothesis 5 is not supported, since training at this level appears not to be sufficient to increase the knowledge and information of the restaurant owners/managers about sustainability practices. As to the discussions in other studies (e.g., [4,8,11]), to enhance sustainability practices in the restaurant industry, proper training and knowledge for the restaurant owners/managers and also employees are imperative.

5.6. Governmental/Municipal Rules and Regulations and Declaring a City “Green” in Enhancing Sustainability Practices (H6)

The Freeman-Halton extension of Fisher’s Exact Test (F.E.T.) [27] was used to determine if statistically significant differences existed among the cities and the dichotomous classification of “green” versus “not green.” When F.E.T. identified the differences, then odds ratios and confidence intervals were calculated in two ways—for “Green” cities (Providence and Nancy) versus Springfield, and for U.S. cities (Providence and Springfield) versus Nancy. Data analysis was conducted in R Statistical Software [28].
From the survey data, F.E.T. was run separately for cardboard boxes, metal containers, plastics, leftover food by-products, unused food, and day-old bread. No statistically significant results were found in this analysis. Further tests were run to see if any intercity differences existed using F.E.T. and post-hoc odds ratios. Two categories were statistically significant at the α = 0.05 level: Metal container processing (p < 0.001) and plastics processing (p ≤ 0.02). In the case of metal, the U.S. cities are not statistically different, but Nancy restaurants were much more likely to throw out metal (O.R. = 3.33, 95% CI = 1.57, 7.03). For plastic, the U.S. cities were not statistically different, but again Nancy restaurants were much more likely to throw out plastic (O.R. = 3.14, 95% CI = 1.34, 7.37). The analytical results of this part of the survey does not support Hypotheses 6, that declaring a city “Green” and governmental and municipal rules and regulations enhance sustainability practices in the restaurant industry. Similar finding that sustainability practices are not enhanced by the governmental rules and regulations is also reported in the study in the Brazilian food industry by Bossle et al. [6].
The results of the statistical analyses regarding the proposed hypotheses can be summarized as shown in Table 12.

6. Discussion

A major focus of this study was to investigate if restaurant owners/mangers believed that sustainability practices had positive impacts on financial situation, reputation, and attraction of the customers, and if they had such beliefs, did they practice sustainability? In addition, the study examined if training had any impact on sustainable practices, and furthermore, if declaring a city “Green” would enhance sustainability practices in that city.
The results of this research utilizing several different statistical analyses support Hypotheses 1–3, indicating that the restaurant owners/managers strongly believe that sustainability practices have positive impacts on their financial performance, the reputation of the restaurant, and the attraction of customers (Figure 4, Table 2 and Table 3).
However, the results of both descriptive and quantitative analyses do not support Hypothesis 4, the restaurant owners/managers even though they believe sustainability practices enhance the performance of the restaurants, the majority of the restaurant owners/managers do not practice recycling, reselling, and reusing of the various categories of the wastes and by-products of their operations in notable percentages (Table 5, Table 6, Table 7, Table 8, Table 9 and Table 10, Figure 5, Figure 6 and Figure 7). If the owners/managers of the restaurants believe that sustainability practices enhance the performance of their restaurants along these dimensions, why are they not practicing them?
As mentioned previously, the data for this study were collected by interviewing the restaurant owners/managers via a questionnaire. During the process of completing the survey and being made aware of the various ways to utilize the wastes and by-products of their operations, a question from the restaurant owners/managers was how a single restaurant could access the resale and reuse markets for the wastes and by-products of its operations.
As shown in Table 11, training did not seem to enhance the sustainability practices in the studied restaurants except for treatment of plastic wastes. Another question posed by the restaurant owners/managers was in regard to the appropriate ways to separate different wastes and by-products in order to have better recycle, resale, and reuse values beyond the simple separation of cardboard, glass, metal, and other wastes, and putting them on the curbside.
On average, a restaurant produces more than 100,000 pounds of waste every year [2]. Five major categories of restaurant by-products and wastes—glass, plastic bottles and containers, metal (i.e., aluminum cans and containers), leftover food items, and leftover cooking oil—have the most resale and reuse market values. However, based on the results of this research, despite their market values, very few categories of the wastes and by-products are resold (Table 5, Table 6, Table 7, Table 8, Table 9 and Table 10 and Figure 5, Figure 6 and Figure 7).
The current price for used aluminum cans is about $0.55 per pound or about 2 cents a can [29]. According to The Aluminum Can Association [30], aluminum cans have a higher market value than glass and plastic bottles, and it is easier to separate them from the other wastes and by-products of the operations of a business. The amount of aluminum cans used in the U.S. is more than 1.612 million pounds per year [31]. In addition to the resale value, a significant cost efficiency in using recycled aluminum cans is that the energy used to make new cans from the old ones is 92% less than using raw sheets of aluminum [31].
Another category with notable resale and reuse value is glass. According to data from Joarder [32], 95% of glass used in different products can be made from cullet (crushed glass). Using cullet can reduce water and energy usage and reduce carbon emission; however, the cullet must be made from same color glass. As a result, sorting and delivering the glass requires labor and costs. However, the price of cullet in recent years has increased by 40%, and preparing the glass for cullet can create jobs in the community [32]. In addition, glass bottles have the most reuse options compared to other restaurant by-products and wastes. Products, such as candles, flowers, or light holders and other decorative items can be made from the used glass bottles.
In addition to aluminum cans and glass bottles, the day-old bread and the leftover food at the end of the day can be reused to make other food items, such as pies and soups. They also have tremendous donation possibilities. Furthermore, the leftover customer food and trimmings of vegetables and meat can be resold to pet shops and farmers in addition to being recycled into compost.
The usage of recycled plastic, aluminum, glass, and paper to make new products requires less water, energy, and raw materials, such as silica and pulp [33,34]. In addition, the biofuel market for items such as leftover cooking oil has been growing within the past decade, mostly due to an increase in the production of biodiesel fuel [35,36]. A recent report indicates that the yearly revenue for the leftover cooking-oil industry is around $85.52 billion, and is expected to reach $130.3 billion by 2024 [37]. Research by Miller reported that the restaurants in Salt Lake City, Utah, disposed of around 500,000 gallons of leftover cooking oil every year [38]. At $1 per gallon, the resell revenue would be $500,000 per annum. This oil can be reused for diesel engines in addition to producing grease for several types of machinery. In addition, the usage of leftover cooking oil in place of petrol can reduce greenhouse gases by 86% [39]. Furthermore, the leftover cooking oil has a resell market for feedstock [40].
Based on the data collected in this study, leftover cooking oil is the only by-product of restaurant operations that has a higher percentage of recycling, reselling, and reusing in the restaurants under study. On the other hand, a large percentage of the plastic bags that are considered to be one of the most contaminating and polluting wastes of the operations of a business [41] are discarded.
Most of the restaurants in this study across the three studied cities had similar profiles. They were fine dining and sit-in restaurants with 2, 3 services per day and with the capacity of 50–100 customers. As a result, the volume of wastes produced by these restaurants would be sizable. As mentioned previously, both Providence and Nancy are declared “Green” cities. Thus, businesses in these cities have the potential of having a major impact on development and enhancement of sustainability practices and achievement of the goals of being a “Green” city. However, in several categories—cardboard, glass, and metal—the results of the study indicate that in Springfield, not a declared “Green” city, the restaurants recycle these items at higher percentages than the restaurants in Providence and Nancy. In addition, the restaurants in Springfield resell more metal by-products and recycle more of the cooking oil and the unused food of the day than the studied restaurants in the other two cities.
The results of this survey show the lack of sustainability practices across a very important and waste producing industry. In all three cities, the restaurants throw away a significant amount of the wastes and by-products of their operations. Discarding these wastes and by-products in such high percentages contribute to increasing wastes and carbon emission in the communities where the restaurants are located. Hence, based on these results, declaring a city “Green” does not seem to enhance the sustainability practices across the activities of a business. Considering the number of restaurants in each city and the diversity and the extent of the wastes and by-products that this industry produces, the restaurant industry can certainly contribute to the accomplishment of the goals of creating a “Green” city.
As mentioned previously, a very high percentage of the restaurant owners/managers in these three cities, comprising 126 restaurants, believe that sustainability practices have positive impacts on financial performance, reputation of the restaurant, and attraction of customers; so, why are they not practicing them? To find an answer to this question, research needs to concentrate on methods and strategies that allow a single restaurant to access the recycle, resell, and reuse markets for the wastes and by-products of its operations in addition to the donation of some of the by-products.
Even if a manager indicated that, he or she had received training, that training was not formal. The training was mostly general knowledge and information that they had acquired regarding waste management, separation of different wastes and by-products of their operations, for example, cardboard from plastic. Research in this area (e.g., [4,8]) shows that technical and precise training and information are of the utmost importance in the implementation of eco-practices in the restaurant industry. Such training and instruction for the restaurant employees and owners/managers in addition to educating the customers are some of the key success factors in greening the restaurant industry and realizing the goals of creating a “Green” city.
Previous studies point to training and increased knowledge as the means to enhance sustainability practices in the restaurant industry (e.g., [8]) in addition to the involvement of governmental agencies and other organizations, such as food banks [42].
Therefore, how can we enhance the eco-operations of restaurants? According to researchers [42,43], implementation of sustainability practices in individual businesses is a major challenge, and this challenge is more pronounced in the restaurant industry. A major obstacle in realizing the sustainability practices in the restaurant industry is the fragmentation of this industry. The fragmentation of the restaurant industry makes eco-operation implantation a challenge. In addition, the working hours of a restaurant, the diversity of the produced wastes, the number of customers through the rush hours, tourists versus regular customers, the mixture of restaurant workers, and the lack of appropriate training are other factors that contribute to the complexity of commitment to sustainability practices [4,8,44].
Some of the goals of the United Nations for enhancing sustainability is the reduction of food waste [45]. However, based on the results of this research and other studies (e.g., [6,13]), regulations and policies at the country and state level cannot enhance green operations in fragmented industries and a single business, even in the cities where green goals are set, a large amount of useful by-products of operations of a business are still wasted. To overcome such obstacles, strategic alliances among several entities at the community level are of the utmost importance and the key success factors in gaining competitive advantage for the restaurants.

7. Conclusions

The research presented in this study expands upon the current studies of the sustainability practices in the restaurant industry along several constructs. First, most of the data collected in this study were from restaurants in two cities in the U.S. and a city in France with similar profiles based on the type, provided services, and capacity in the U.S. and the EU. Second, the investigated sustainability practices included an inclusive list of the wastes and by-products of the operations of the restaurants. Third, the sustainability practices were examined along a comprehensive range of actions, recycling, reselling, and reusing, in addition to donation when appropriate. Furthermore, the study compared sustainability practices in declared “Green” cities versus a non-declared “Green” city and explored the impact of governmental rules and regulations on such practices in the restaurant industry.
This study’s novel results indicate that declaring a city “Green” and the belief of the restaurant owners/managers that sustainability practices have a positive impact on the operations of the restaurant do not enhance eco-operations. As a result, great percentages of the wastes and by-products with the potential of recycling, reusing, reselling, and donation are discarded.
A major reason for the lack of sustainability practices seems to be the sheer numbers of restaurants scattered across neighborhoods. An important contribution of this study is to indicate that fragmentation of an industry is a key hurdle in implementation of sustainability practices. As indicated by the results of this study, the restaurant owners/managers believe in the positive impact of sustainability practices on the performance of a restaurant along different dimensions. In addition, they are willing to be trained and need training beyond separation of parts of the produced wastes and leaving it outside to be delivered to the dumpsites. A single restaurant needs to have a network of other restaurants and organizations to allow proper and efficient collection and dissemination of the produced wastes and by-products of its operations. Therefore, formation of alliances to create a “Green” city is a necessity. However, as indicated by the results of this study, rules and regulations at the state and governmental levels are not effective. The unit of attention needs to be neighborhood-by-neighborhood and community by community to address the issue of fragmentation of the restaurant industry and providing ways that eco-operations in a single business can be implemented.
In the cities under this study, Providence, Springfield, and Nancy, there are streets in various neighborhoods where large numbers of restaurants are congregated. Through creation of such partnerships with different private and public organizations at the community and neighborhood levels, the wastes and by-products of restaurants in a neighborhood can be separated properly and collected jointly. Such bulk collection from the restaurants in each neighborhood can then be delivered to appropriate destinations for reselling, reusing, recycling, or donation. These partnerships can create jobs across the logistic chain, can enhance the efficient use of resources, generate financial gains for the restaurants, and contribute to creation of an eco-city environment.
As mentioned previously, fragmentation in this industry does not facilitate training and implementation of sustainability practices based on the governmental directives. In conclusion, private-public partnerships at the smallest unit of analysis are needed to enhance the operational efficiency of different businesses, specifically in fragmented industries. Future research needs to explore the creation of such partnerships as well as expansion of the study to other cities. In the case of the restaurant industry, strategic alliances among municipal offices, as well as local community organizations, chambers of commerce, and local academic institutions are critical. Through these alliances, essential knowledge and training can be provided in addition to development and utilization of appropriate technologies to enhance green waste management in one of the largest global industries for conservation of resources and creation of healthy communities.
The mayoral offices in the three studied cities are interested in the study results. These results are going to be shared with them, and we will offer informational sessions for the restaurant owners/managers and relevant municipal offices in the future.

Author Contributions

This data for this research was partially collected during M.T.’s sabbatical semester. L.F. and B.S. are the co-authors of the paper for the analyses and completion of the article. All authors have read and agreed to the published version of the manuscript.

Funding

This research received no external funding.

Acknowledgments

Minoo Tehrani would like to thank her students in Strategic Management class and also two other students, Julia Partridge and Devon Carmody, who assisted in collecting some of the data for this research. The collection of part of this data took place during the sabbatical year of Minoo Tehrani.

Conflicts of Interest

The authors declare no conflict of interest.

References

  1. Verrill, C. American Restaurants Are Wasting an Incredible Amount of Food—Here’s the Proof. Available online: https://www.businessinsider.com/solving-food-waste-in-americas-restaurants-2016-5 (accessed on 15 June 2020).
  2. BSR. Analysis of U.S. Food Waste among Food Manufacturers, Retailers, and Restaurants. Available online: https://www.foodwastealliance.org/wp-content/uploads/2014/11/FWRA_BSR_Tier3_FINAL.pdf (accessed on 15 June 2020).
  3. Chiu, J.-Z.; Hsieh, C.-C. The Impact of Restaurants’ Green Supply Chain Practices on Firm Performance. Sustainability 2016, 8, 42. [Google Scholar] [CrossRef] [Green Version]
  4. Chou, S.-F.; Jeou-Shyan, H.; Chih-Hsing, L.; Yung-Chuan, H.; Chung, Y.-C. Expert Concepts of Sustainable Service Innovation in Restaurants in Taiwan. Sustainability 2016, 8, 739. [Google Scholar] [CrossRef] [Green Version]
  5. Filimonau, V.; Krivcova, M. Restaurant menu design and more responsible consumer food choice: An exploratory study of managerial perceptions. J. Clean. Prod. 2017, 143, 516–527. [Google Scholar] [CrossRef] [Green Version]
  6. Bossle, M.B.; de Barcellos, M.D.; Vieira, L.M. Eco-innovative food in Brazil: Perceptions from producers and consumers. Agric. Food Econ. 2015, 3, 8. [Google Scholar] [CrossRef]
  7. Teng, Y.-M.; Kun-Shan, W.; Huang, D.M. The Influence of Green Restaurant Decision Formation Using the VAB Model: The Effect of Environmental Concerns upon Intent to Visit. Sustainability 2014, 6, 8736–8755. [Google Scholar] [CrossRef] [Green Version]
  8. Chou, C.-J.; Chen, K.-S.; Wang, Y.-Y. Green practices in the restaurant industry from an innovation adoption perspective: Evidence from Taiwan. Int. J. Hosp. Manag. 2012, 31, 703–711. [Google Scholar] [CrossRef]
  9. Llach, J.; Perramon, J.; Alonso-Almeida, M.d.M.; Bagur-Femenías, L. Joint impact of quality and environmental practices on firm performance in small service businesses: An empirical study of restaurants. J. Clean. Prod. 2013, 44, 96–104. [Google Scholar] [CrossRef]
  10. Dewald, B.; Bruin, B.J.; Jang, Y.J. US consumer attitudes towards “green” restaurants. Anatolia 2014, 25, 171–180. [Google Scholar] [CrossRef]
  11. Namkung, Y.; Jang, S. Effects of restaurant green practices on brand equity formation: Do green practices really matter? Int. J. Hosp. Manag. 2013, 33, 85–95. [Google Scholar] [CrossRef]
  12. DiPietro, R.B.; Gregory, S.; Jackson, A. Going Green in Quick-Service Restaurants: Customer Perceptions and Intentions. Int. J. Hosp. Tour. Adm. 2013, 14, 139–156. [Google Scholar] [CrossRef]
  13. Kim, M.J.; Hall, C.M. Can sustainable restaurant practices enhance customer loyalty? The roles of value theory and environmental concerns. J. Hosp. Tour. Manag. 2020, 43, 127–138. [Google Scholar] [CrossRef]
  14. Martin-Rios, C.; Demen-Meier, C.; Gössling, S.; Cornuz, C. Food waste management innovations in the foodservice industry. Waste Manag. 2018, 79, 196–206. [Google Scholar] [CrossRef] [PubMed] [Green Version]
  15. Silva, A.; Rosano, M.; Stocker, L.; Gorissen, L. From waste to sustainable materials management: Three case studies of the transition journey. Waste Manag. 2017, 61, 547–557. [Google Scholar] [CrossRef] [PubMed]
  16. Walker Professor, H.; Seuring Professor, S.; Sarkis Professor, J.; Klassen Professor, R. Sustainable operations management: Recent trends and future directions. Int. J. Oper. Prod. Manag. 2014, 34. [Google Scholar] [CrossRef]
  17. Discover New England. 2018. Available online: https://www.discovernewengland.org/about-new-england/new-england-quick-facts (accessed on 15 June 2020).
  18. Moor, D. 10 U.S. Metro Areas with the Highest Density of Restaurants. 2015. Yahoo Finance. 22 September 2016. Available online: https://finance.yahoo.com/news/10-u-s--cities-with-the-highest-density-of-restaurants-175818576.html (accessed on 15 June 2020).
  19. Office of Sustainability. Sustainable Providence, 2014. September 2014. Available online: http://www.providenceri.gov/wp-content/uploads/2017/02/Sustainability-Providence.pdf (accessed on 15 June 2020).
  20. Executive Office of Energy and Environmental Affairs. Green Communities Division. 2015. Available online: https://www.mass.gov/orgs/green-communities-division-massdoer (accessed on 15 June 2020).
  21. Executive Office of Energy and Environmental Affairs. Baker-Polito. Administration Designates 30 Cities and Towns as Green Communities. 2 February 2017. Available online: http://www.mass.gov/eea/pr-2017/30-cities-and-towns-designated-as-green-communities-.html (accessed on 15 June 2020).
  22. European Union Commission. 2050 Long-Term Strategy. 2018. Available online: https://ec.europa.eu/clima/policies/strategies/2050_en (accessed on 15 June 2020).
  23. European Union Commissions. Food Waste. 2016. Available online: https://ec.europa.eu/food/safety/food_waste_en (accessed on 23 July 2020).
  24. Urbact II Capitalisation. Sustainable Regeneration in Urban Areas. April 2015. Available online: https://urbact.eu/sites/default/files/04_sustreg-web.pdf (accessed on 15 June 2020).
  25. The Green Goals of Nancy. 2019. Available online: https://boardroom.global/the-green-goals-of-nancy/ (accessed on 15 June 2020).
  26. Tastle, W.J.; Wierman, M.J. Using Consensus to Measure Weighted Targeted Agreement. In Proceedings of the NAFIPS 2007—2007 Annual Meeting of the North American Fuzzy Information Processing Society, San Diego, CA, USA, 24–27 June 2007; pp. 31–35. [Google Scholar]
  27. Freeman, G.H.; Halton, J.H. Note on an exact treatment of contingency, goodness of fit and other problems of significance. Biometrika 1951, 38, 141–149. [Google Scholar] [CrossRef]
  28. R Development Core Team. R: A Language and Environment for Statistical Computing; R Core Team: Vienna, Austria, 2018. [Google Scholar]
  29. ScrapMonster.com. Aluminum Cans Scrap Price USD/LB in USA and Canada Scrap Yards Today-Aluminum Scrap. Available online: https://www.scrapmonster.com/scrap-yard/price/aluminum-cans-scrap/193 (accessed on 15 June 2020).
  30. Aluminum.org. The Aluminum Can Advantage | The Aluminum Association. Available online: https://www.aluminum.org/aluminum-can-advantage/ (accessed on 15 June 2020).
  31. Cancentral.com. Can Manufacturers Institute Statistics. Available online: http://www.cancentral.com/can-stats/statistics (accessed on 30 June 2019).
  32. Joarder, R. Recycled Glass Price Increases 40% in 3 Years. Available online: https://spendmatters.com/2015/04/20/recycled-glass-price-increases-40-in-3-years/ (accessed on 16 June 2020).
  33. Hosseinzadeh, G. Energy and Environmental Considerations in Recycling. Available online: http://budker.berkeley.edu/PhysicsH190_2012/Hosseinzadeh%20Recycling_Energy_Conservation.pdf (accessed on 16 June 2020).
  34. Kovačec, M.P.A.; Štefanić, N. Impact of glass cullet on the consumption of energy and environment in the production of glass packaging material. In Recent Researches in Chemistry, Biology, Environment and Culture, Proceedings of the 5th WSEAS International Conference on Computational Chemistry, Montreux, Switzerland, 29–31 December 2011; WSEAS Press: Montreux, Switzerland, 2011; pp. 187–192. [Google Scholar]
  35. Girotto, F.; Alibardi, L.; Cossu, R. Food waste generation and industrial uses: A review. Waste Manag. 2015, 45, 32–41. [Google Scholar] [CrossRef]
  36. Hussain, M.N.; Samad, T.A.; Janajreh, I. Economic feasibility of biodiesel production from waste cooking oil in the UAE. Sustain. Cities Soc. 2016, 26, 217–226. [Google Scholar] [CrossRef]
  37. Research, Z.M. Global Cooking Oil Market Will Reach USD 130.30 Billion by 2024: Zion Market Research. Available online: https://www.globenewswire.com/news-release/2018/07/17/1538399/0/en/Global-Cooking-Oil-Market-Will-Reach-USD-130-30-Billion-by-2024-Zion-Market-Research.html (accessed on 16 June 2020).
  38. Miller, J. Determining the Rate of Used Cooking Oil Output by the Restaurant Industry in Salt Lake Valley, UT. Available online: https://nature.berkeley.edu/classes/es196/projects/2007final/MillerJ.pdf (accessed on 16 June 2020).
  39. Cristóbal, J.; Caldeira, C.; Corrado, S.; Sala, S. Techno-economic and profitability analysis of food waste biorefineries at European level. Bioresour. Technol. 2018, 259, 244–252. [Google Scholar] [CrossRef]
  40. Rincón, L.A.; Cadavid, J.G.; Orjuela, A. Used cooking oils as potential oleochemical feedstock for urban biorefineries—Study case in Bogota, Colombia. Waste Manag. 2019, 88, 200–210. [Google Scholar] [CrossRef]
  41. Le Guern, C. Plastic Pollution. Available online: https://plastic-pollution.org/ (accessed on 16 June 2020).
  42. Sakaguchi, L.; Pak, N.; Potts, M.D. Tackling the issue of food waste in restaurants: Options for measurement methods, reduction and behavioral change. J. Clean. Prod. 2018, 180, 430–436. [Google Scholar] [CrossRef] [Green Version]
  43. Whitehead, J. Prioritizing Sustainability Indicators: Using Materiality Analysis to Guide Sustainability Assessment and Strategy. Bus. Strategy Environ. 2017, 26, 399–412. [Google Scholar] [CrossRef]
  44. Liu, T.; Liu, Y.; Wu, S.; Xue, J.; Wu, Y.; Li, Y.; Kang, S. Restaurants’ behavior, awareness, and willingness to submit waste cooking oil for biofuel production in Beijing. J. Clean. Prod. 2018, 204, 636–642. [Google Scholar] [CrossRef]
  45. UN Sustainable Development Goals. 2017. Available online: https://sustainabledevelopment.un.org/?menu=1300 (accessed on 15 June 2020).
Figure 1. Services per day in the studied restaurant per each city.
Sustainability 12 05964 g001
Figure 2. The capacity of the studied restaurants per each city.
Sustainability 12 05964 g002
Figure 3. The type of the restaurants: Fine dining/sit in, fast food, and coffee shops/delis per each city.
Sustainability 12 05964 g003
Figure 4. Belief of the restaurant owners/managers on the positive impact of sustainability practices on the financial performance of the restaurant, reputation, and attraction of customers.
Sustainability 12 05964 g004
Figure 5. Treatment of cardboard, glass bottles, metal containers, plastic bottles, straws, plastic containers, and plastic bags.
Sustainability 12 05964 g005
Figure 6. Treatment of leftover cooking oil, leftover meat trimmings, and leftover vegetable trimmings for the studied cities.
Sustainability 12 05964 g006
Figure 7. Donate, Recycle Resell, Reuse: Day-old bread and unused food items of the day.
Sustainability 12 05964 g007
Table 1. The number of services provided per day, the type, and the capacity of the restaurants under study.
Number of Service/Day% of SampleType of Restaurants% of SampleCapacity% of Sample
Three services per day16%Fine dining & sit-in64%>10039%
Two services per day64%Fast food10%50–10028%
One service per day20%Coffee shops & Delis16%25–4923%
<2510%
Table 2. Belief of the restaurant owners/managers regarding the impact of sustainability practices.
BeliefPositive Impact on Financial PerformancePositive Impact on ReputationPositive Impact on Attracting Customers
Strongly Agree42%47%38%
Agree31%30%26%
Not Sure21%20%31%
Disagree5%2%4%
Strongly Disagree1%1%1%
Table 3. Consensus measures (Cns) for all restaurants in the sample on belief of restaurant owners/managers of the impact of sustainability practices.
BeliefCns(X)
Positive Impact on Financial Performance0.71
Positive impact on Reputation0.65
Positive Impact on Attracting Customers0.64
Table 4. Consensus measures (Cns) for restaurants in the “Green” cities on belief of restaurant owners/managers of the impact of sustainability practices.
BeliefCns(X)
Positive Impact on Financial Performance0.62
Positive impact on Reputation0.52
Positive Impact on Attracting Customers0.52
Table 5. Recycle, resell, reuse, discard: Cardboard, glass, plastic bottles, straws, and containers, metal containers, and plastic bags.
ActionCardboardGlass BottlesPlastic Bottles, Straws, & Plastic ContainersMetal ContainersPlastic Bags
Recycle71%56%34%31%14%
Resell0%1%0%3%1%
Reuse5%6%1%12%6%
Discard24%37%65%54%79%
Table 6. Recycle, resell, reuse, discard: Leftover cooking oil, meat trimmings, and vegetable trimmings.
ActionLeftover Cooking OilLeftover Meat TrimmingsLeftover Vegetable Trimmings
Recycle56%9%7%
Resell14%0%0%
Reuse6%6%10%
Discard23%85%83%
Table 7. Donate, recycle, resell, reuse, discard: Day-old bread and unused food of the day.
ActionDay-Old BreadUnused Food of the Day
Donate13%12%
Recycle8%7%
Resell1%5%
Reuse31%36%
Discard47%40%
Table 8. Spearman’s Correlations: Belief in positive impact on financial performance and waste management.
Category of WastesCoefficient (rs)T-Statisticsp-Value
Cardboard0.1111.1920.2354
Glass0.0010.0140.9883
Plastic Containers0.3243.6450.0004
Metal Containers0.1902.0640.0412
Table 9. Spearman’s Correlations: Belief in positive impact on reputation and waste management.
Category of WastesCoefficient (rs)T-Statisticsp-Value
Cardboard0.1912.0710.0406
Glass0.0230.2540.7993
Plastic Containers0.2652.9230.0041
Metal Containers0.1451.5660.1200
Table 10. Spearman’s Correlations: Belief in positive impact on attraction of customers and waste management.
Category of WastesCoefficient (rs)T-Statisticsp-Value
Cardboard0.0480.5180.6052
Glass−0.0340.3620.7179
Plastic Containers0.3123.5000.0006
Metal Containers0.2622.8900.0046
Table 11. Relationship between training and of recycling/reselling/reusing of by-products and wastes of the restaurants.
ModelDependent VariableOdds Ratiop-ValueLower BoundUpper Bound
1Plastic Resold, Recycled, Reused1.3880.4130.6323.047
2Metal Resold, Recycled, Reused2.1070.3710.9734.565
3Glass Resold, Recycled, Reused0.6440.0590.3001.383
4Cardboard Resold, Recycled, Reused1.4670.2600.6333.402
Table 12. Summary of the results of the survey in support of the proposed hypotheses.
HypothesesSupported
H1. Restaurant owners’/managers’ belief that sustainability practices enhances the financial performance of the restaurant.Yes
H2. Restaurant owners’/managers’ belief that sustainability practices enhances the reputation of the restaurant.Yes
H3. Restaurant owners’/managers’ belief that sustainability practices enhances attraction of customers.Yes
H4. Relationship between the belief of restaurant owners/managers (H1–H3) and enhancement of sustainability practices.No
H5. Relationship between training of the restaurant owners/managers and enhancement of the sustainability practices.No
H6. Declaring a city “Green” enhances sustainability practices in that city’s restaurants.No

