Framework for Selecting Manufacturing Simulation Software in Industry 4.0 Environment

 , ,
, , 
 and
and
Abstract
1. Introduction
2. State of the Art
2.1. Industry 4.0 Maturity Models
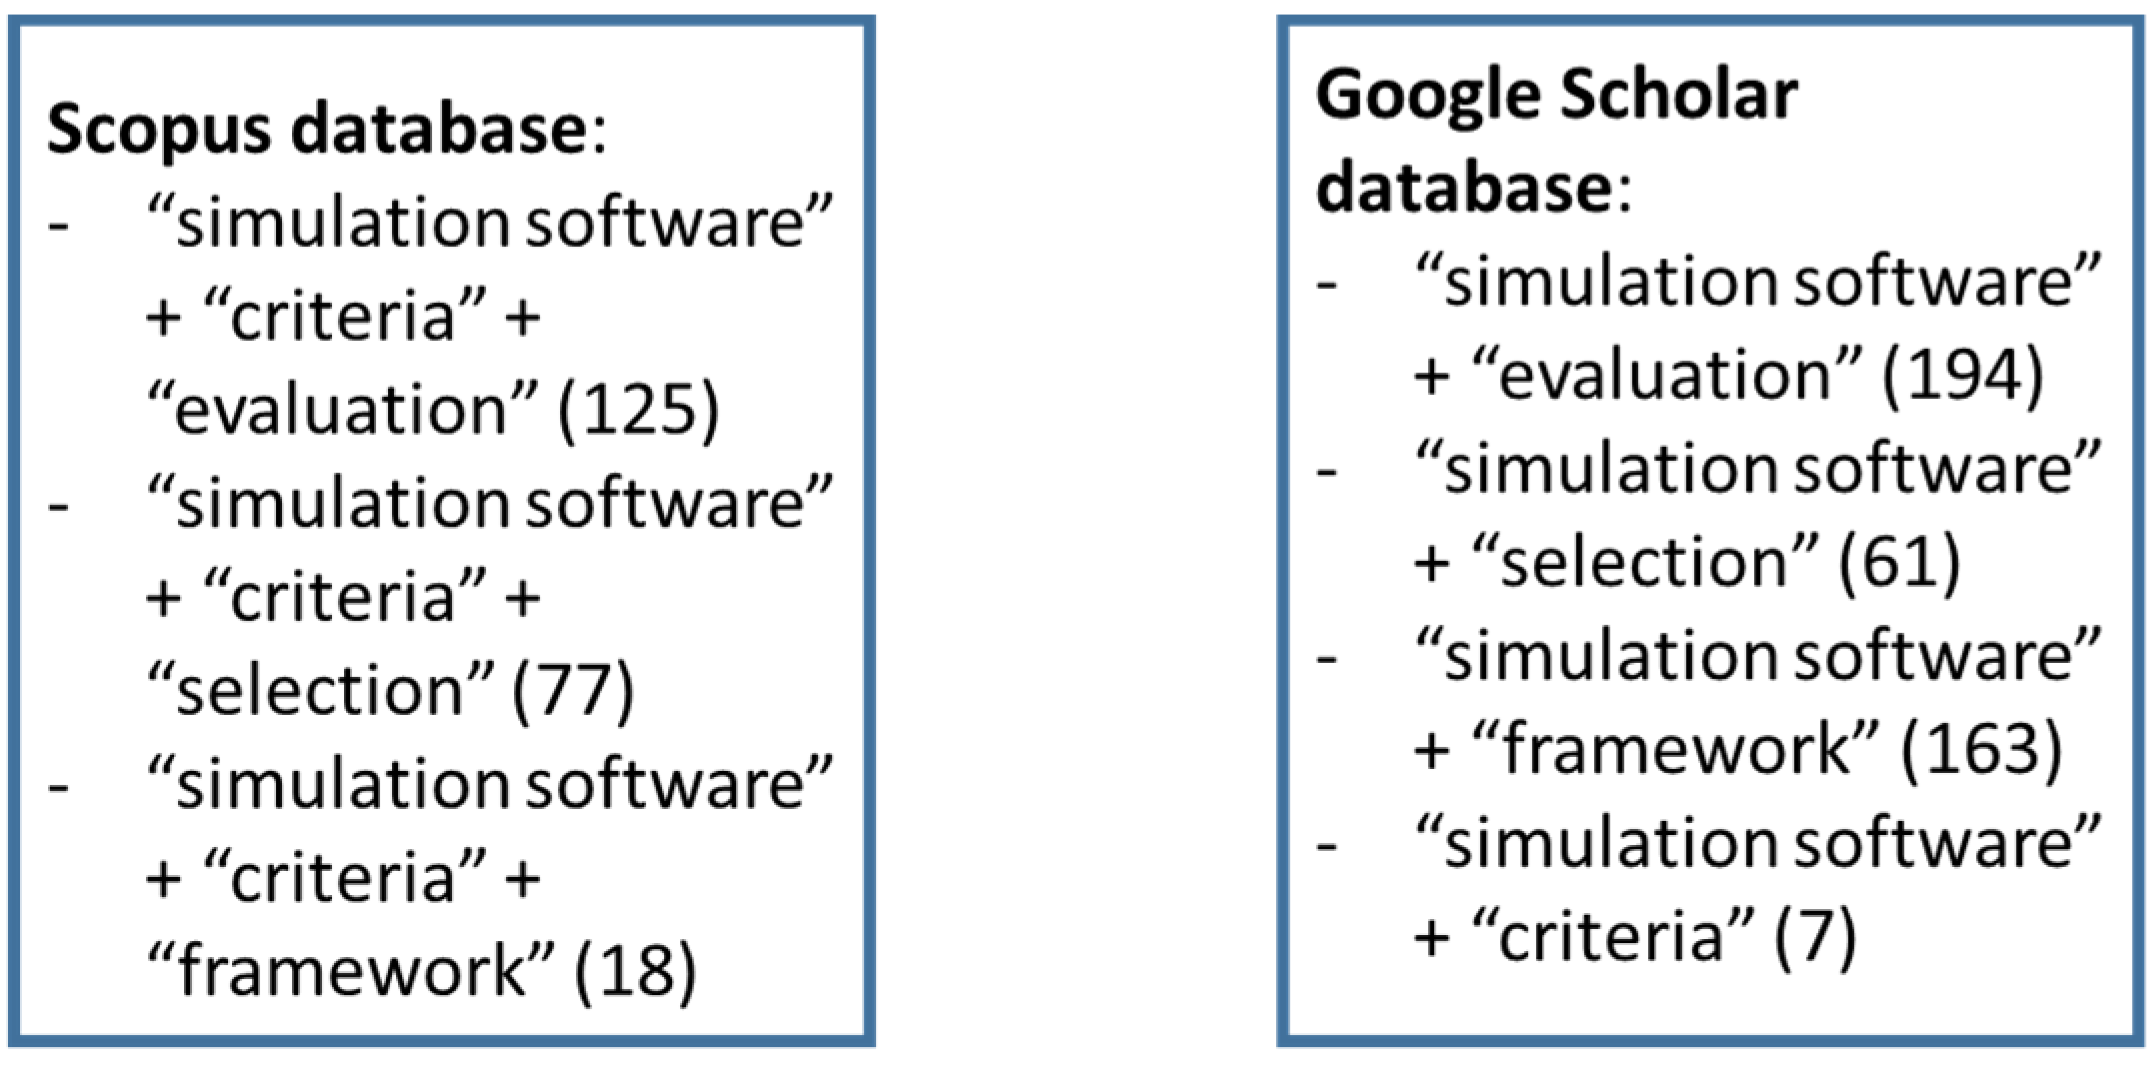
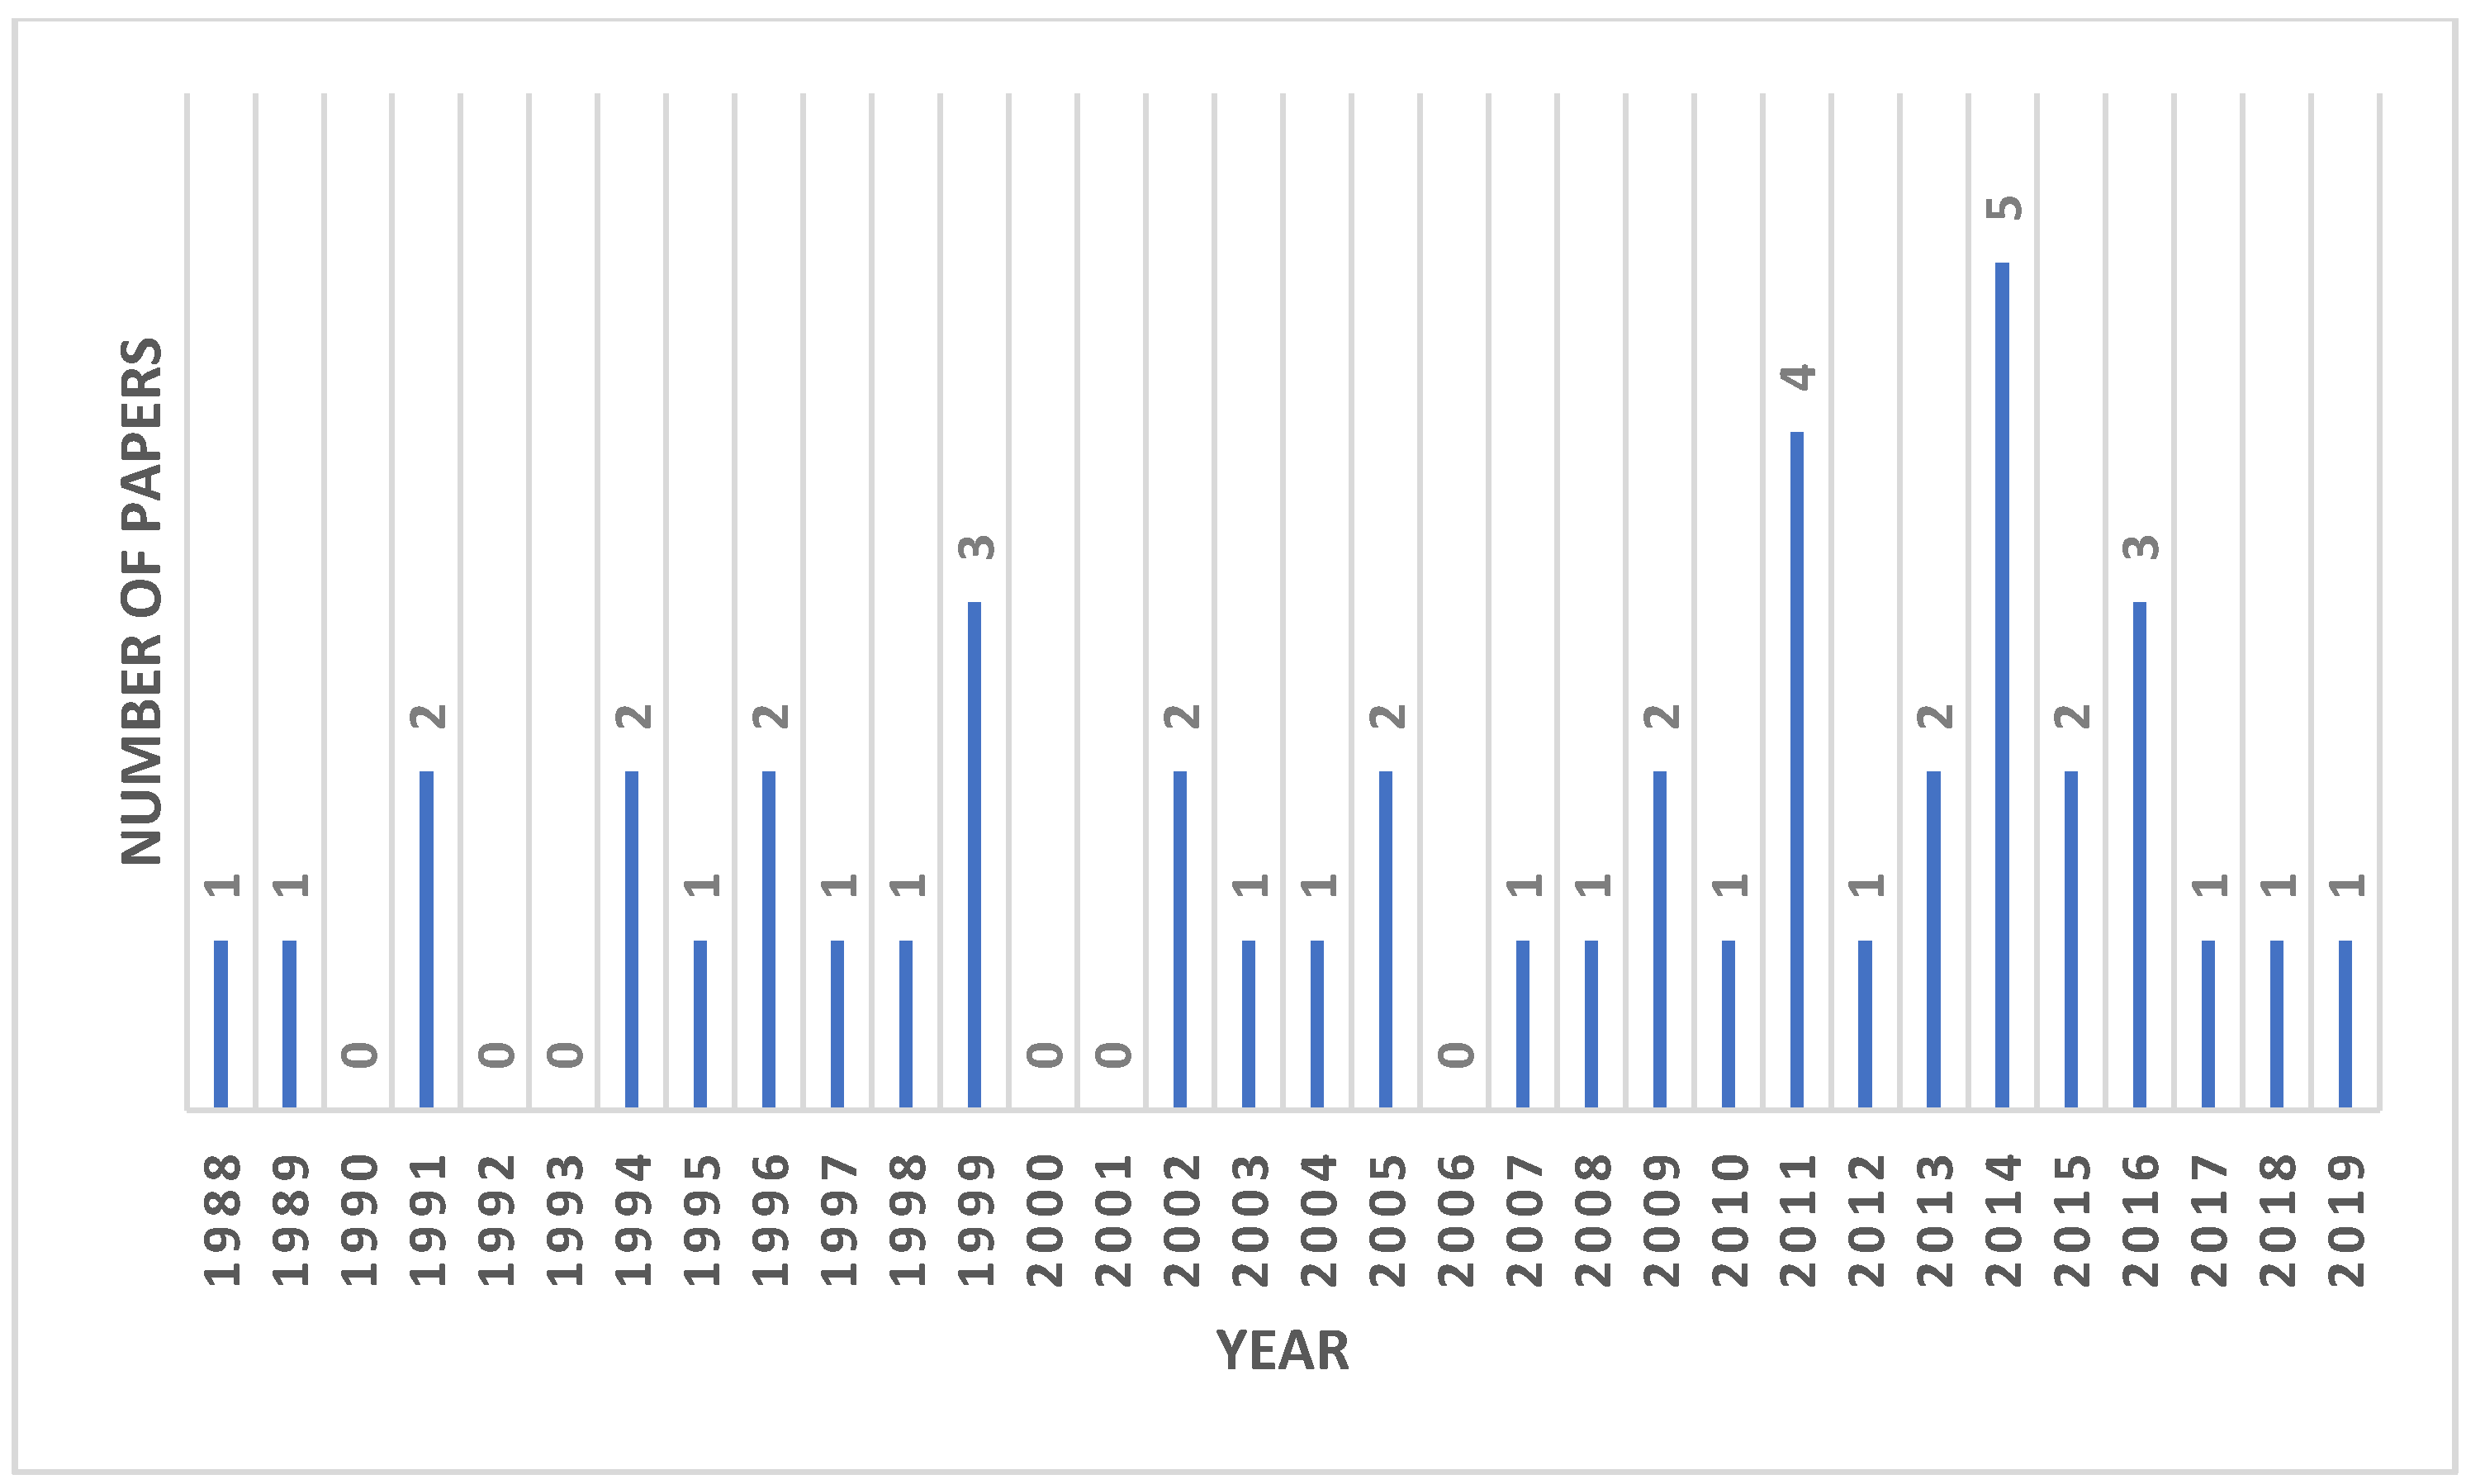
2.2. Simulation Software Selection
- -
- they were written in English;
- -
- they were in the form of peer-reviewed document. “Grey” literature, i.e., any material, usually not peer-reviewed, produced by institutions and organizations outside classical scientific distribution channels (industrial reports, position papers, or government normative) was excluded from the analysis;
- -
- all relevant data were available. Lack of relevant information (e.g., authors’ names, title, journal or conference name) involved the exclusion of the paper;
- -
- they were in line with the goal of the analysis. Studies that only dealt with the application of simulation software to a case study or performance evaluation of production lines through simulation were not considered in the analysis;
- -
- the full text was available;
- -
- at least the software selection criteria were discussed in the document.
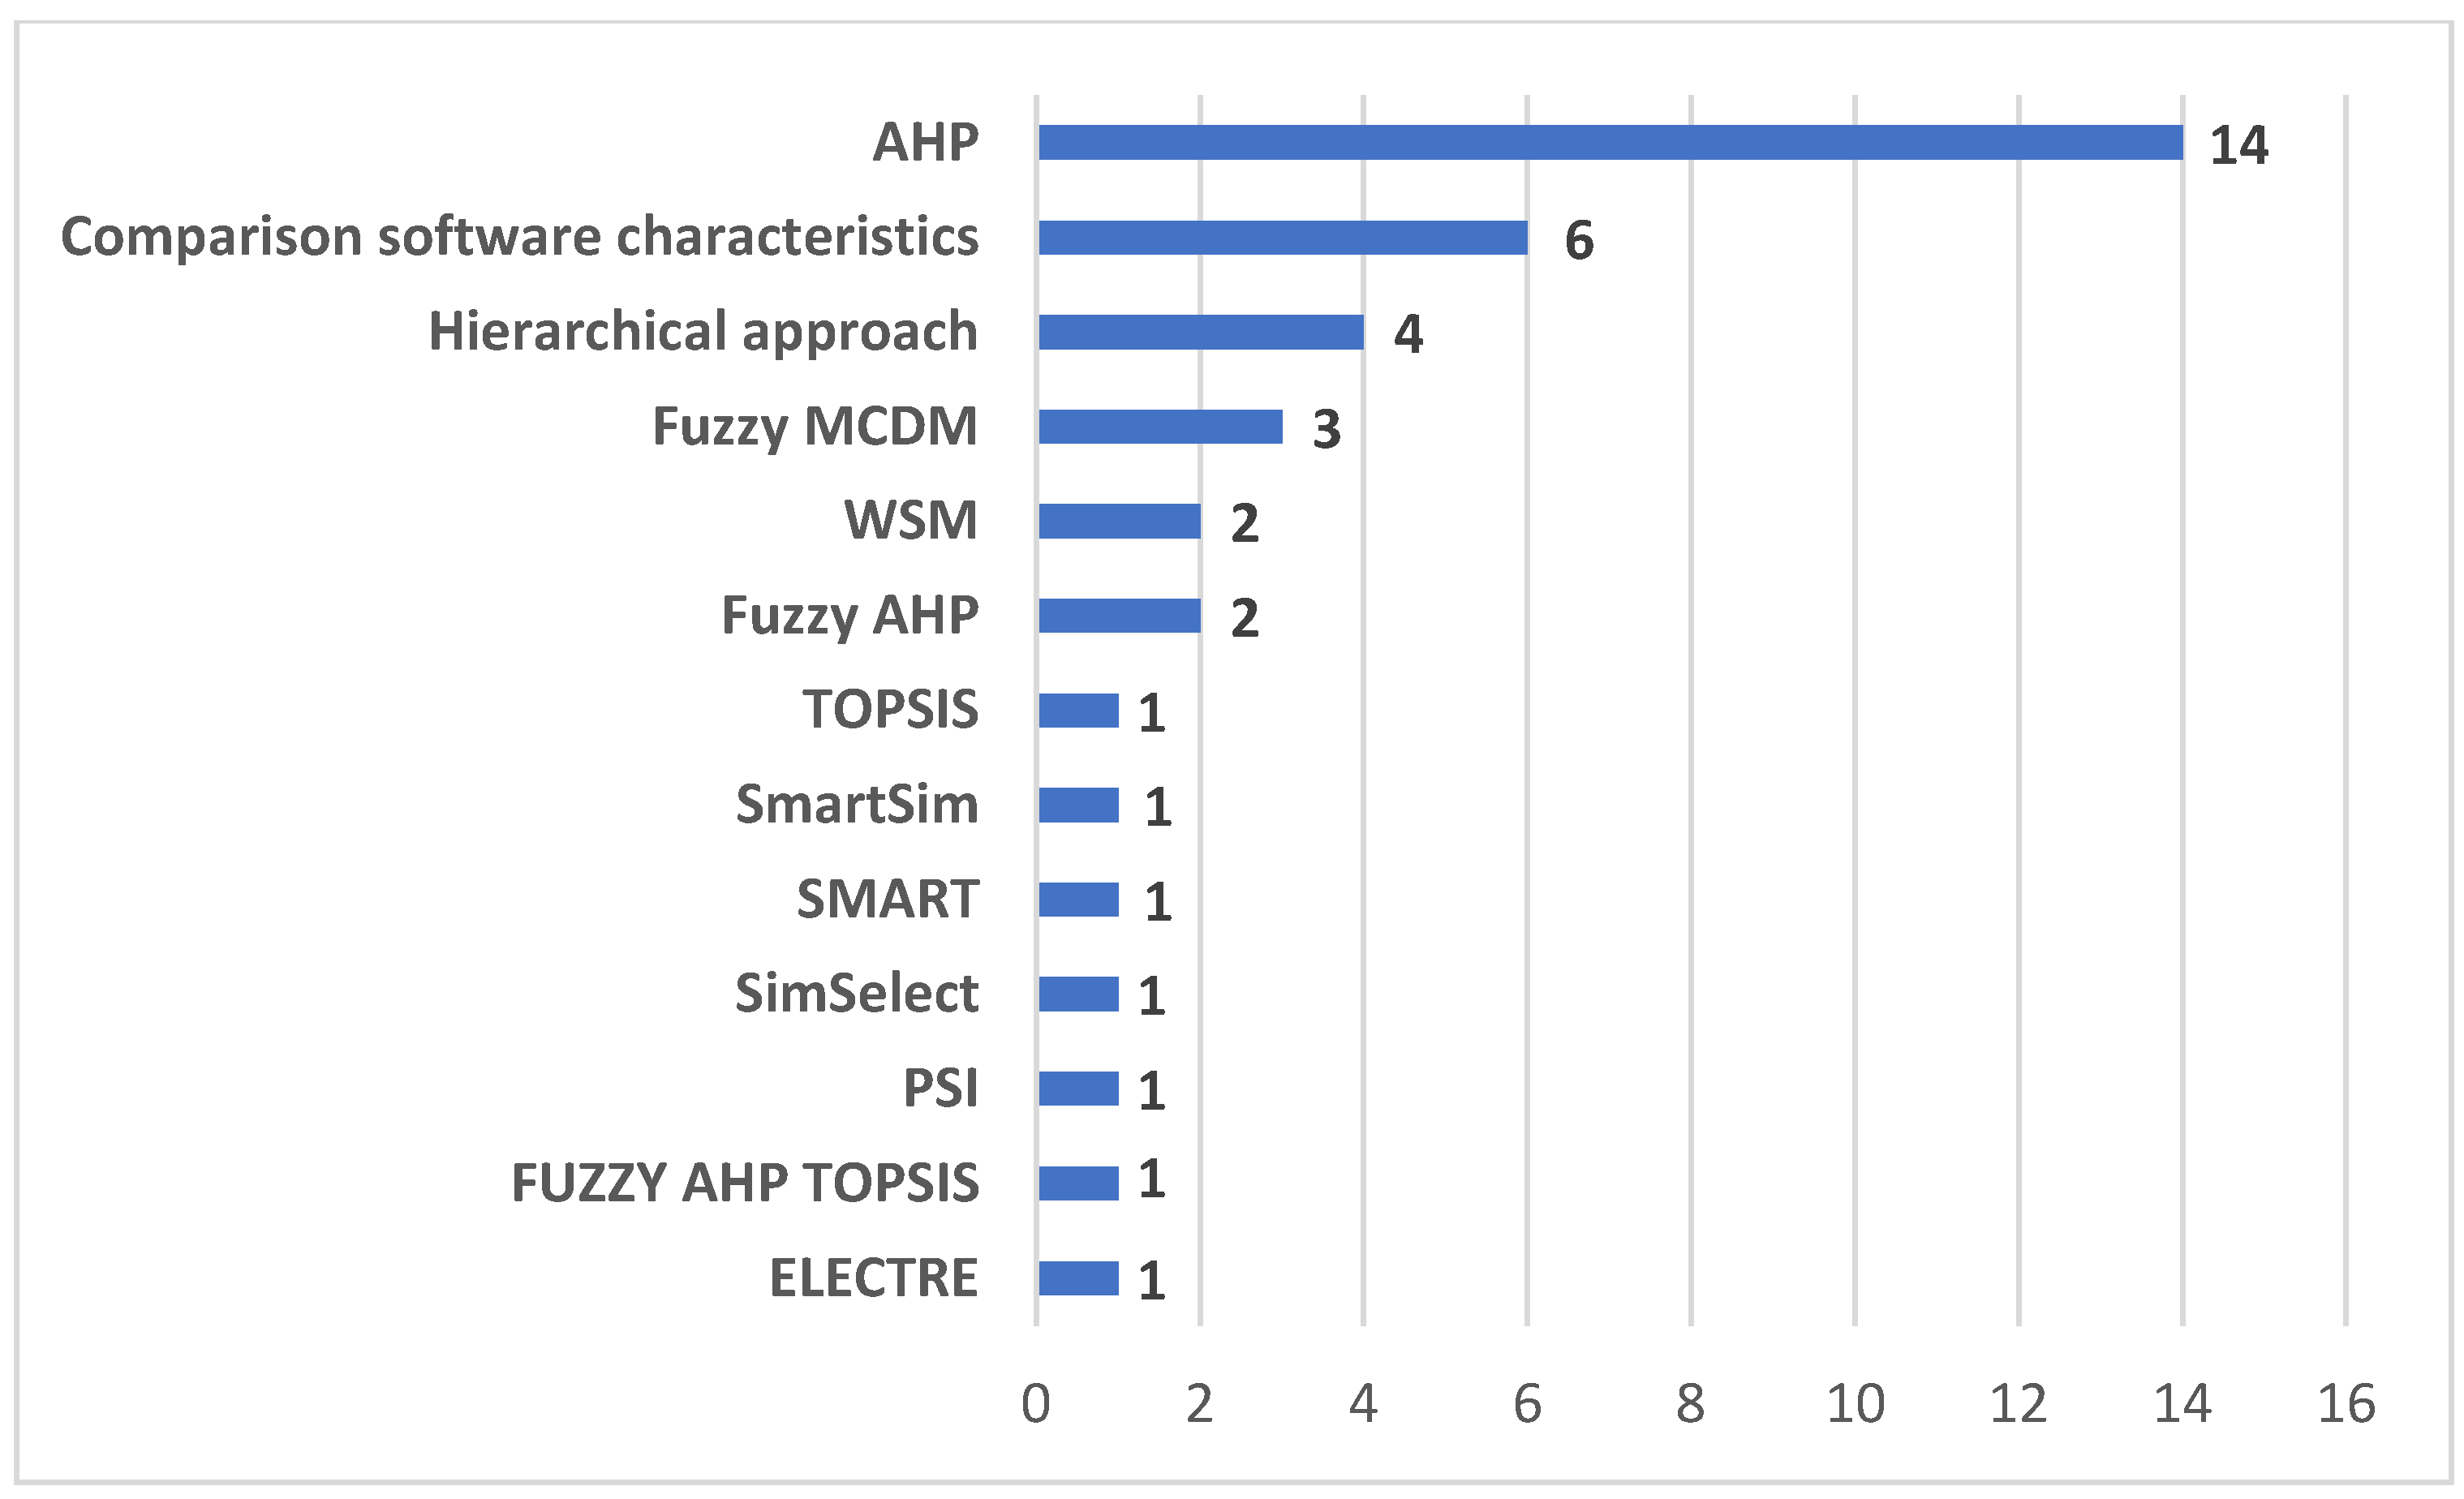
2.3. MCDM Methods: Evaluation Techniques
3. Research Methodology
- two academics from the University of Parma and three academics from the University of Naples, chosen among researchers whose interests are in the field of simulation and process modelling;
- three people from as many software houses manufacturing different kinds of software packages, including simulation software packages;
- six people from two small-size companies. For each company, representatives were the company’s owner, the plant manager and the purchasing manager.
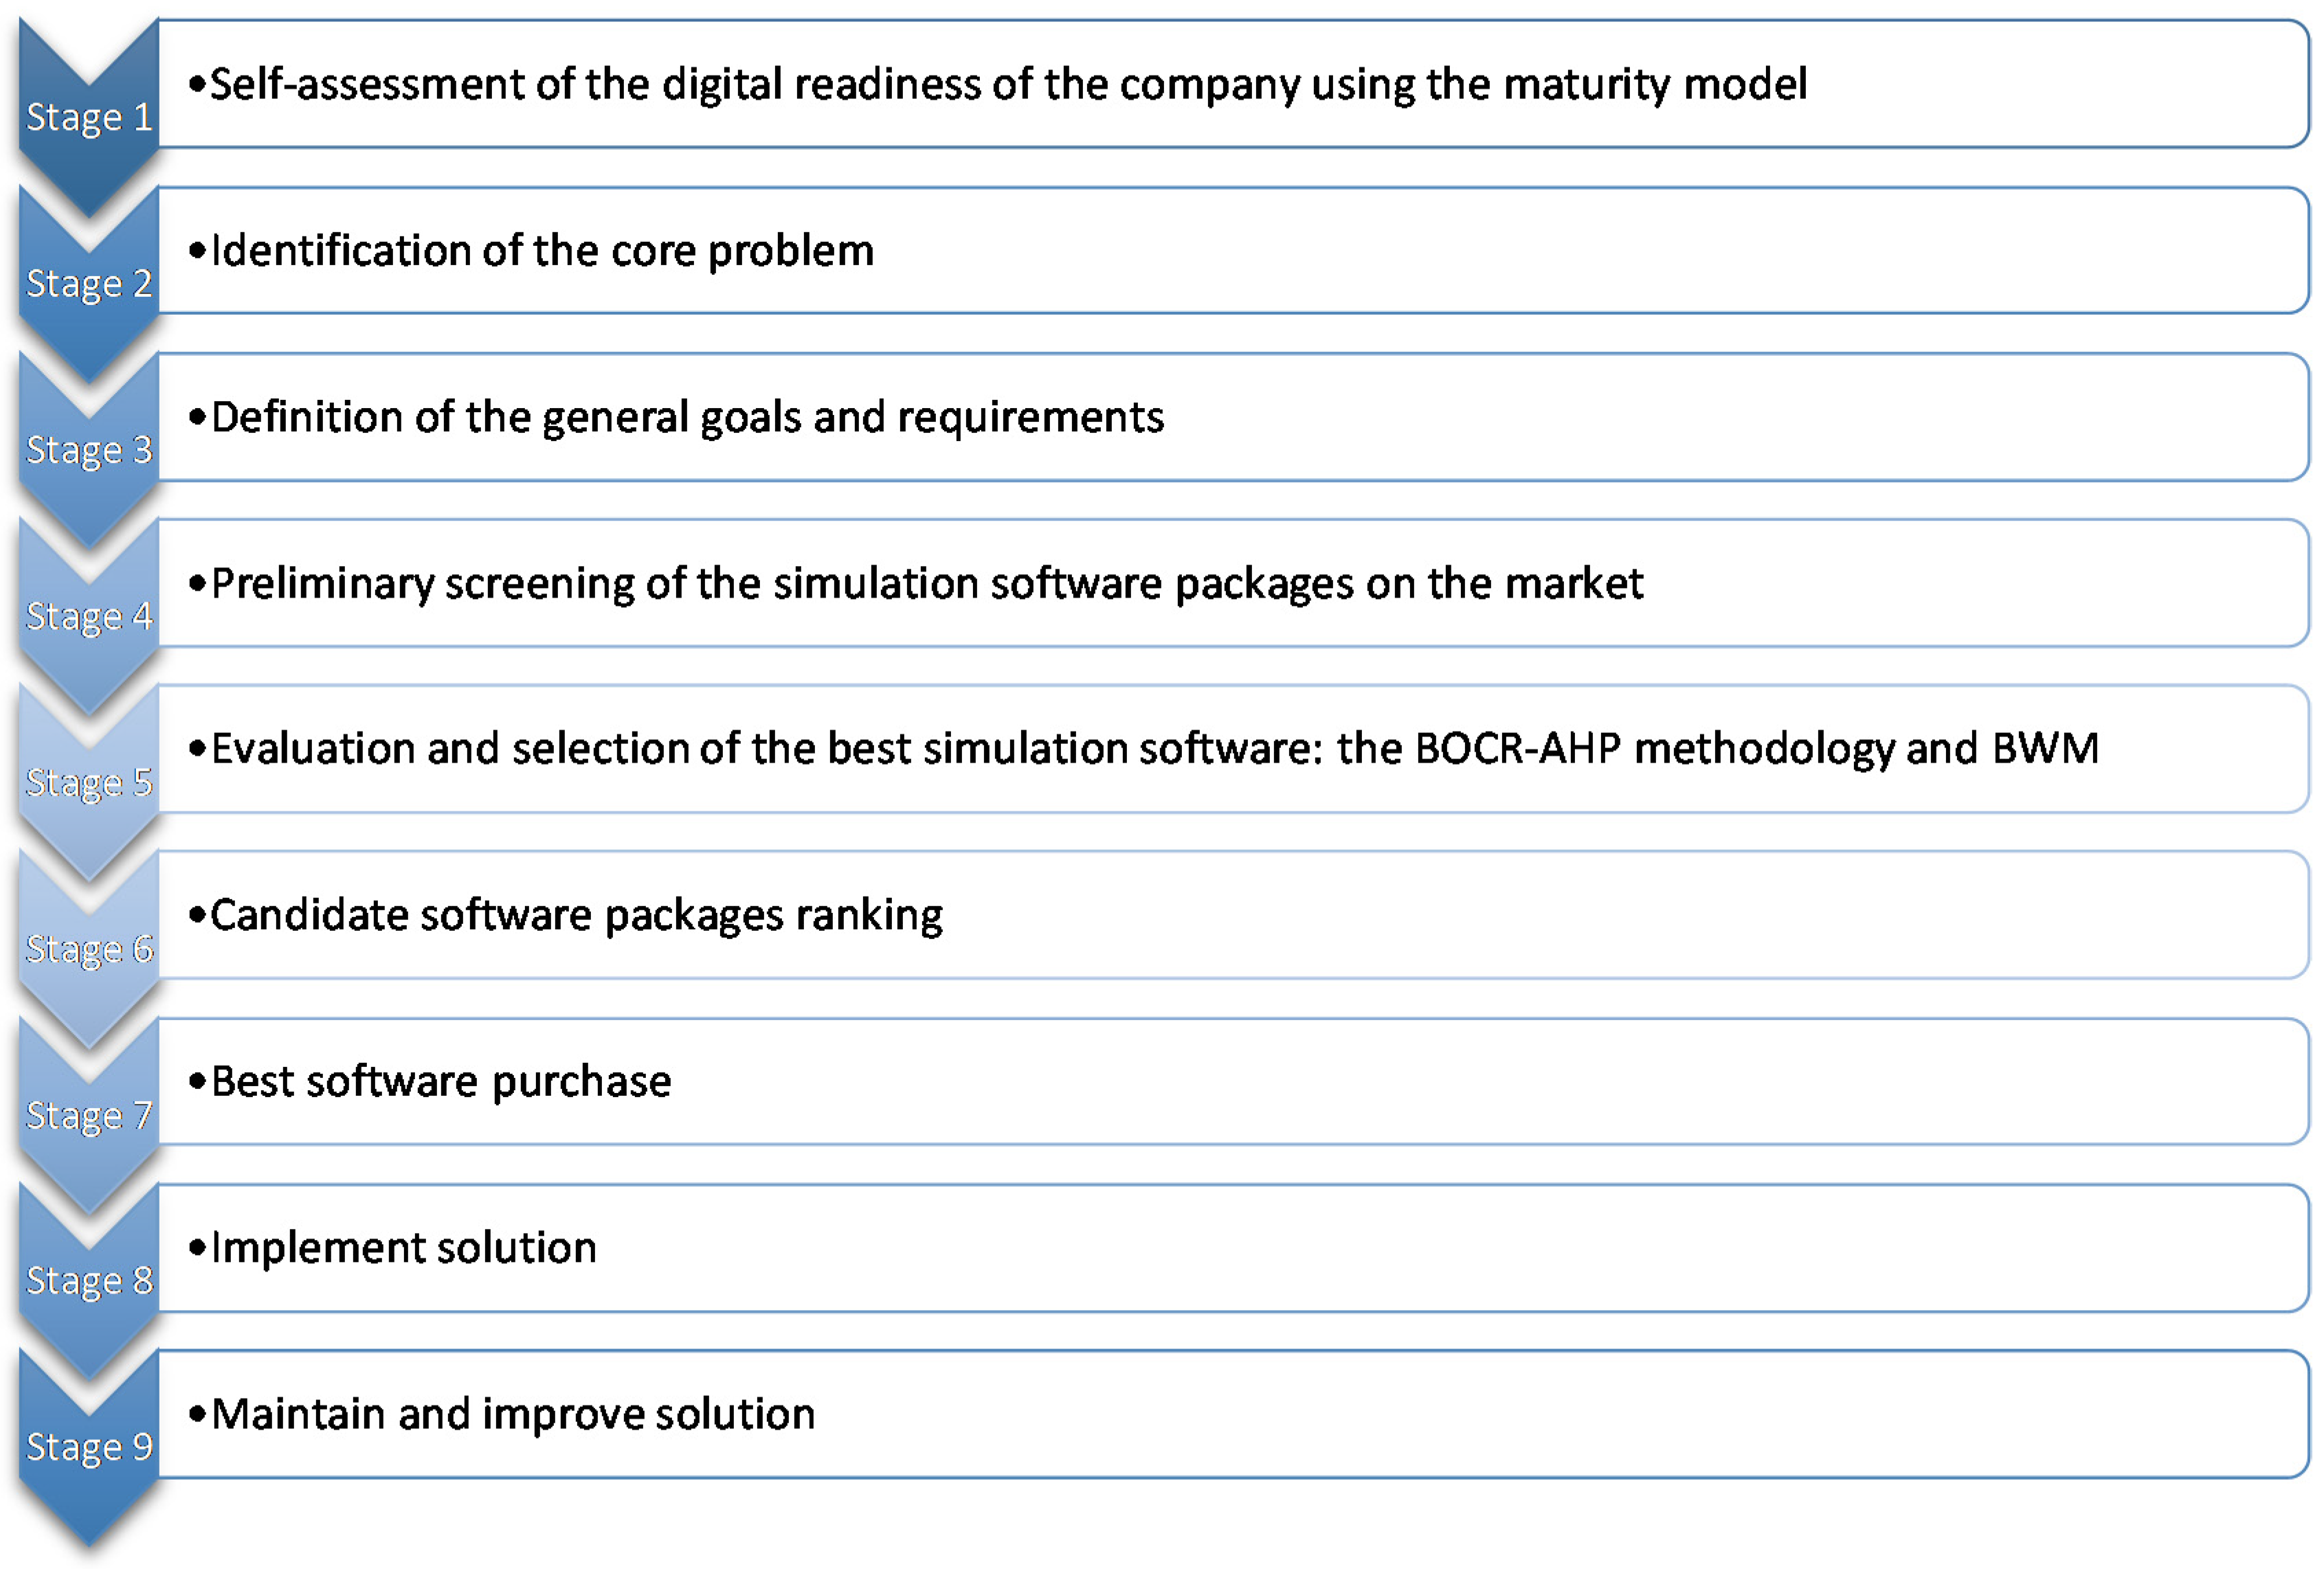
4. Evaluation Framework for Simulation Software Selection
- -
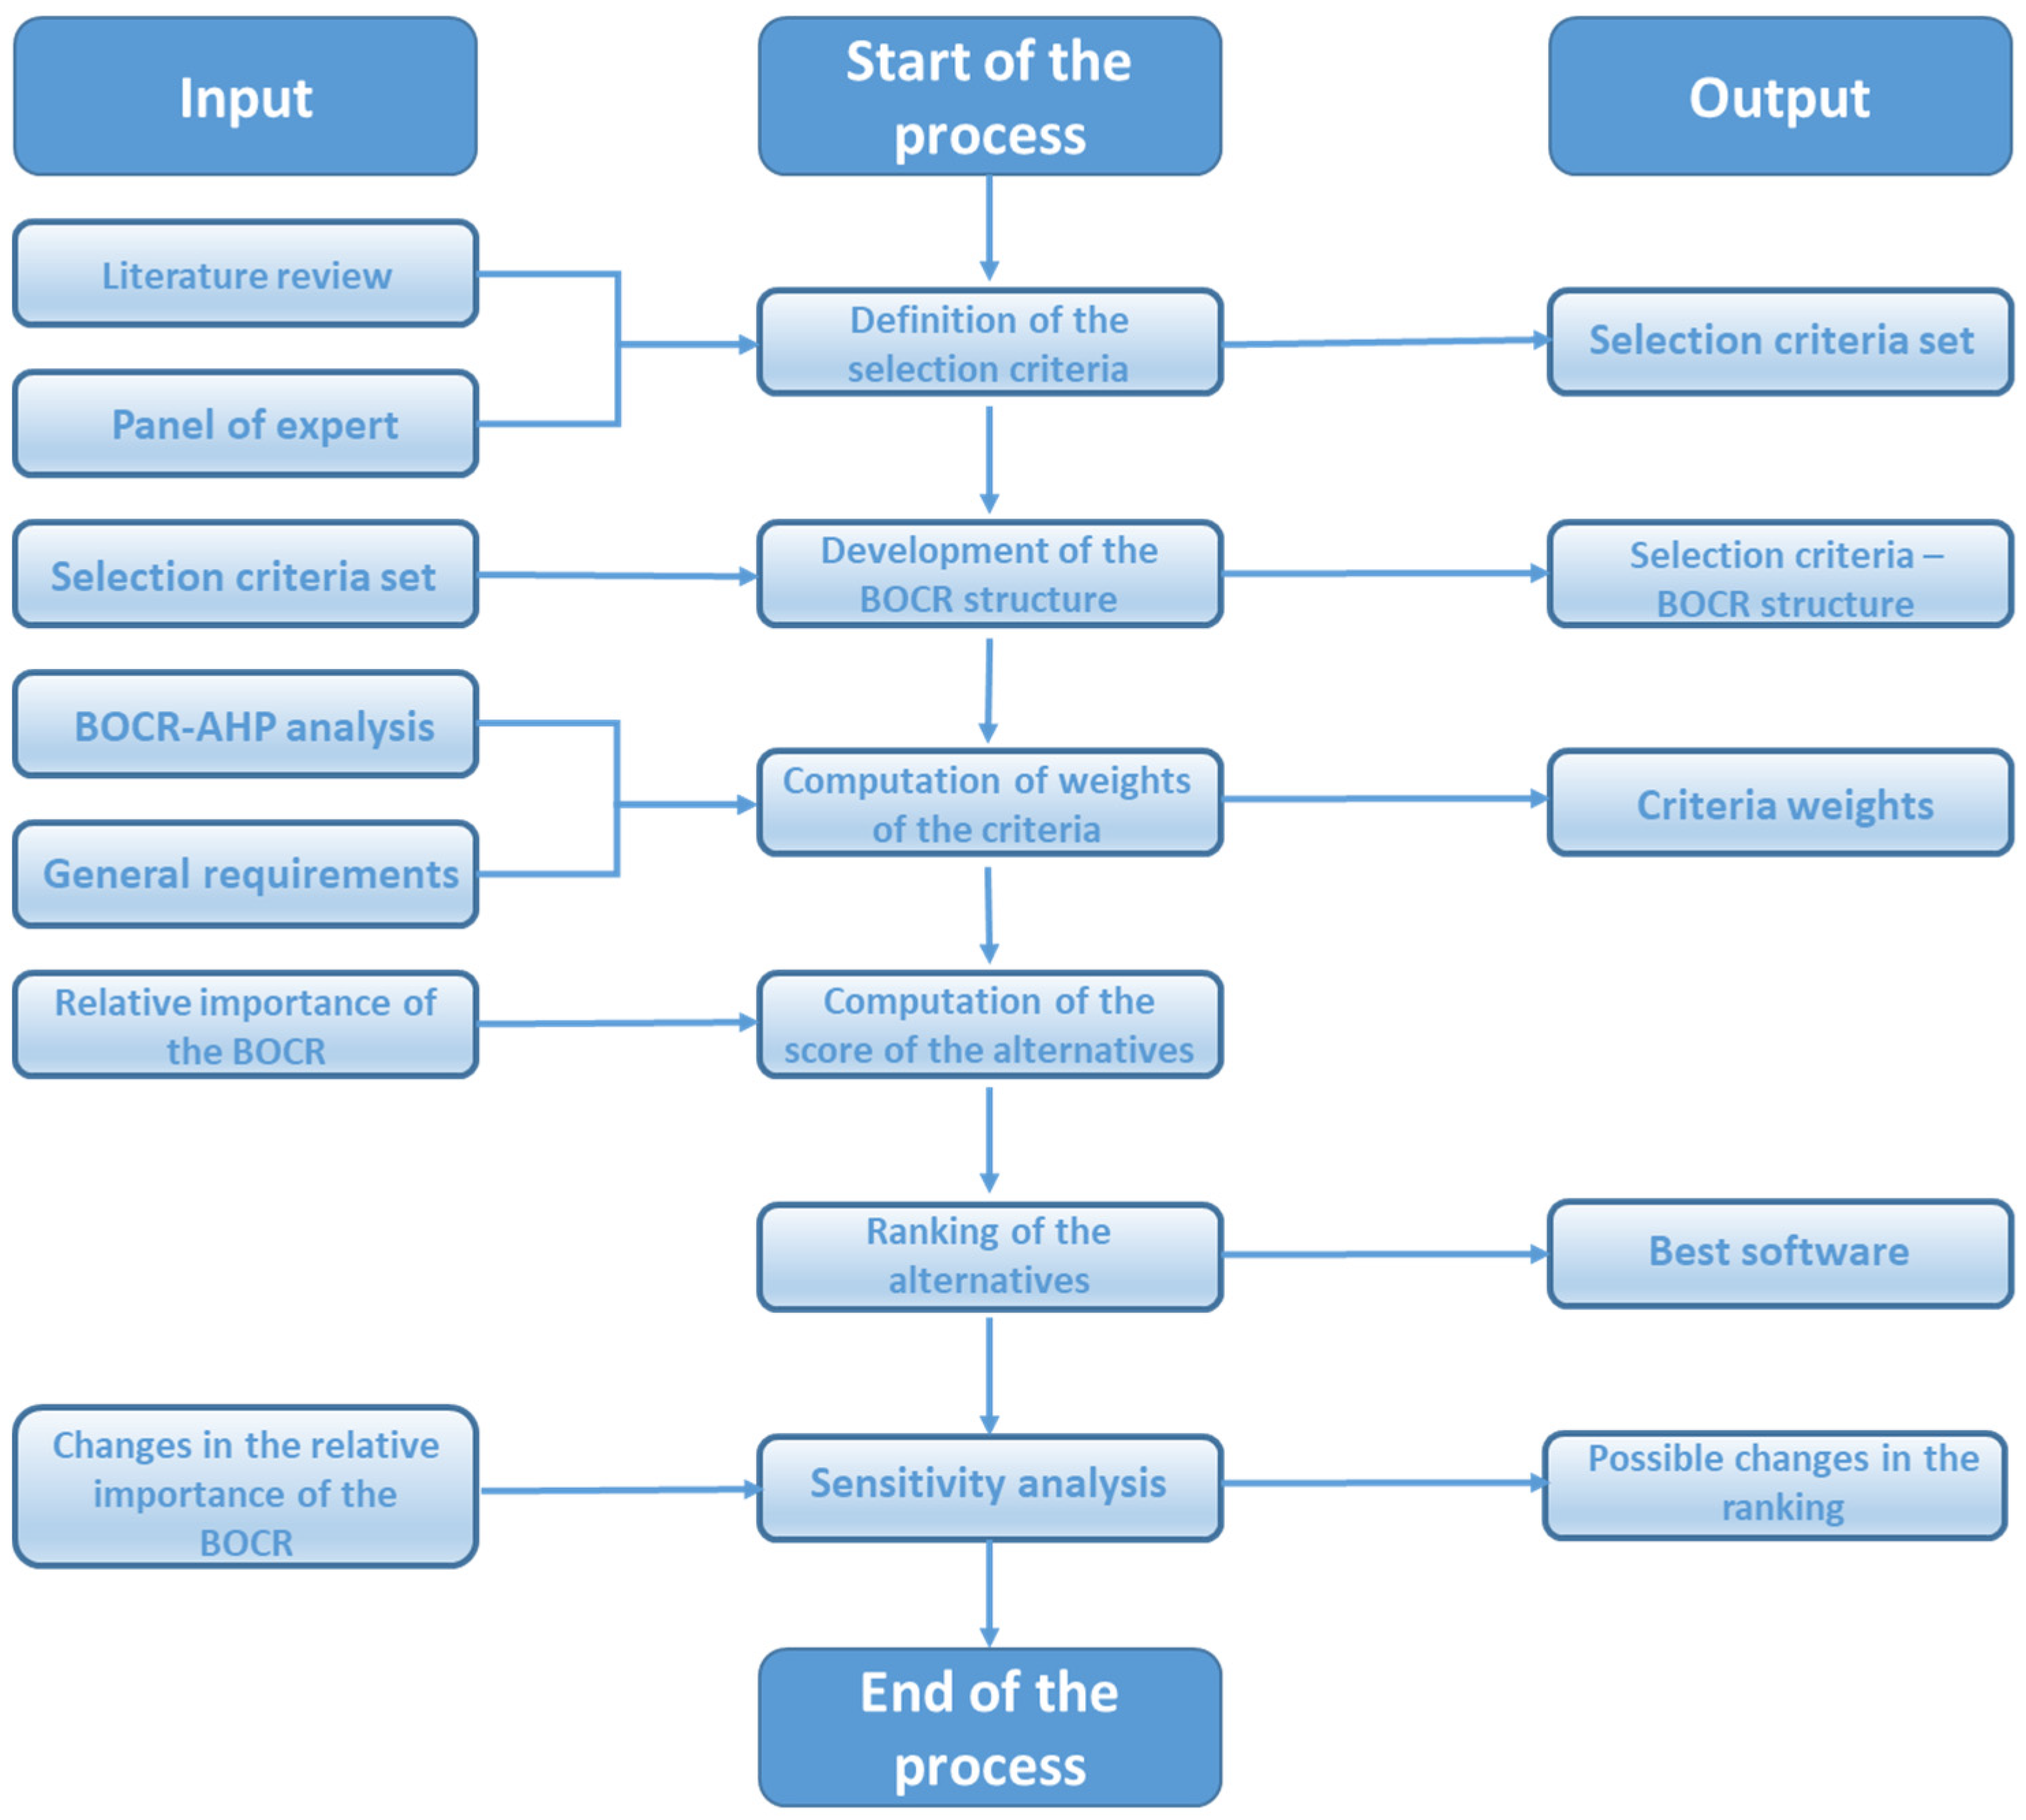
- the new integrated BOCR-AHP methodology. It consists of six ordered sub-steps and should help select the best software and to provide a ranking of alternatives;
- -
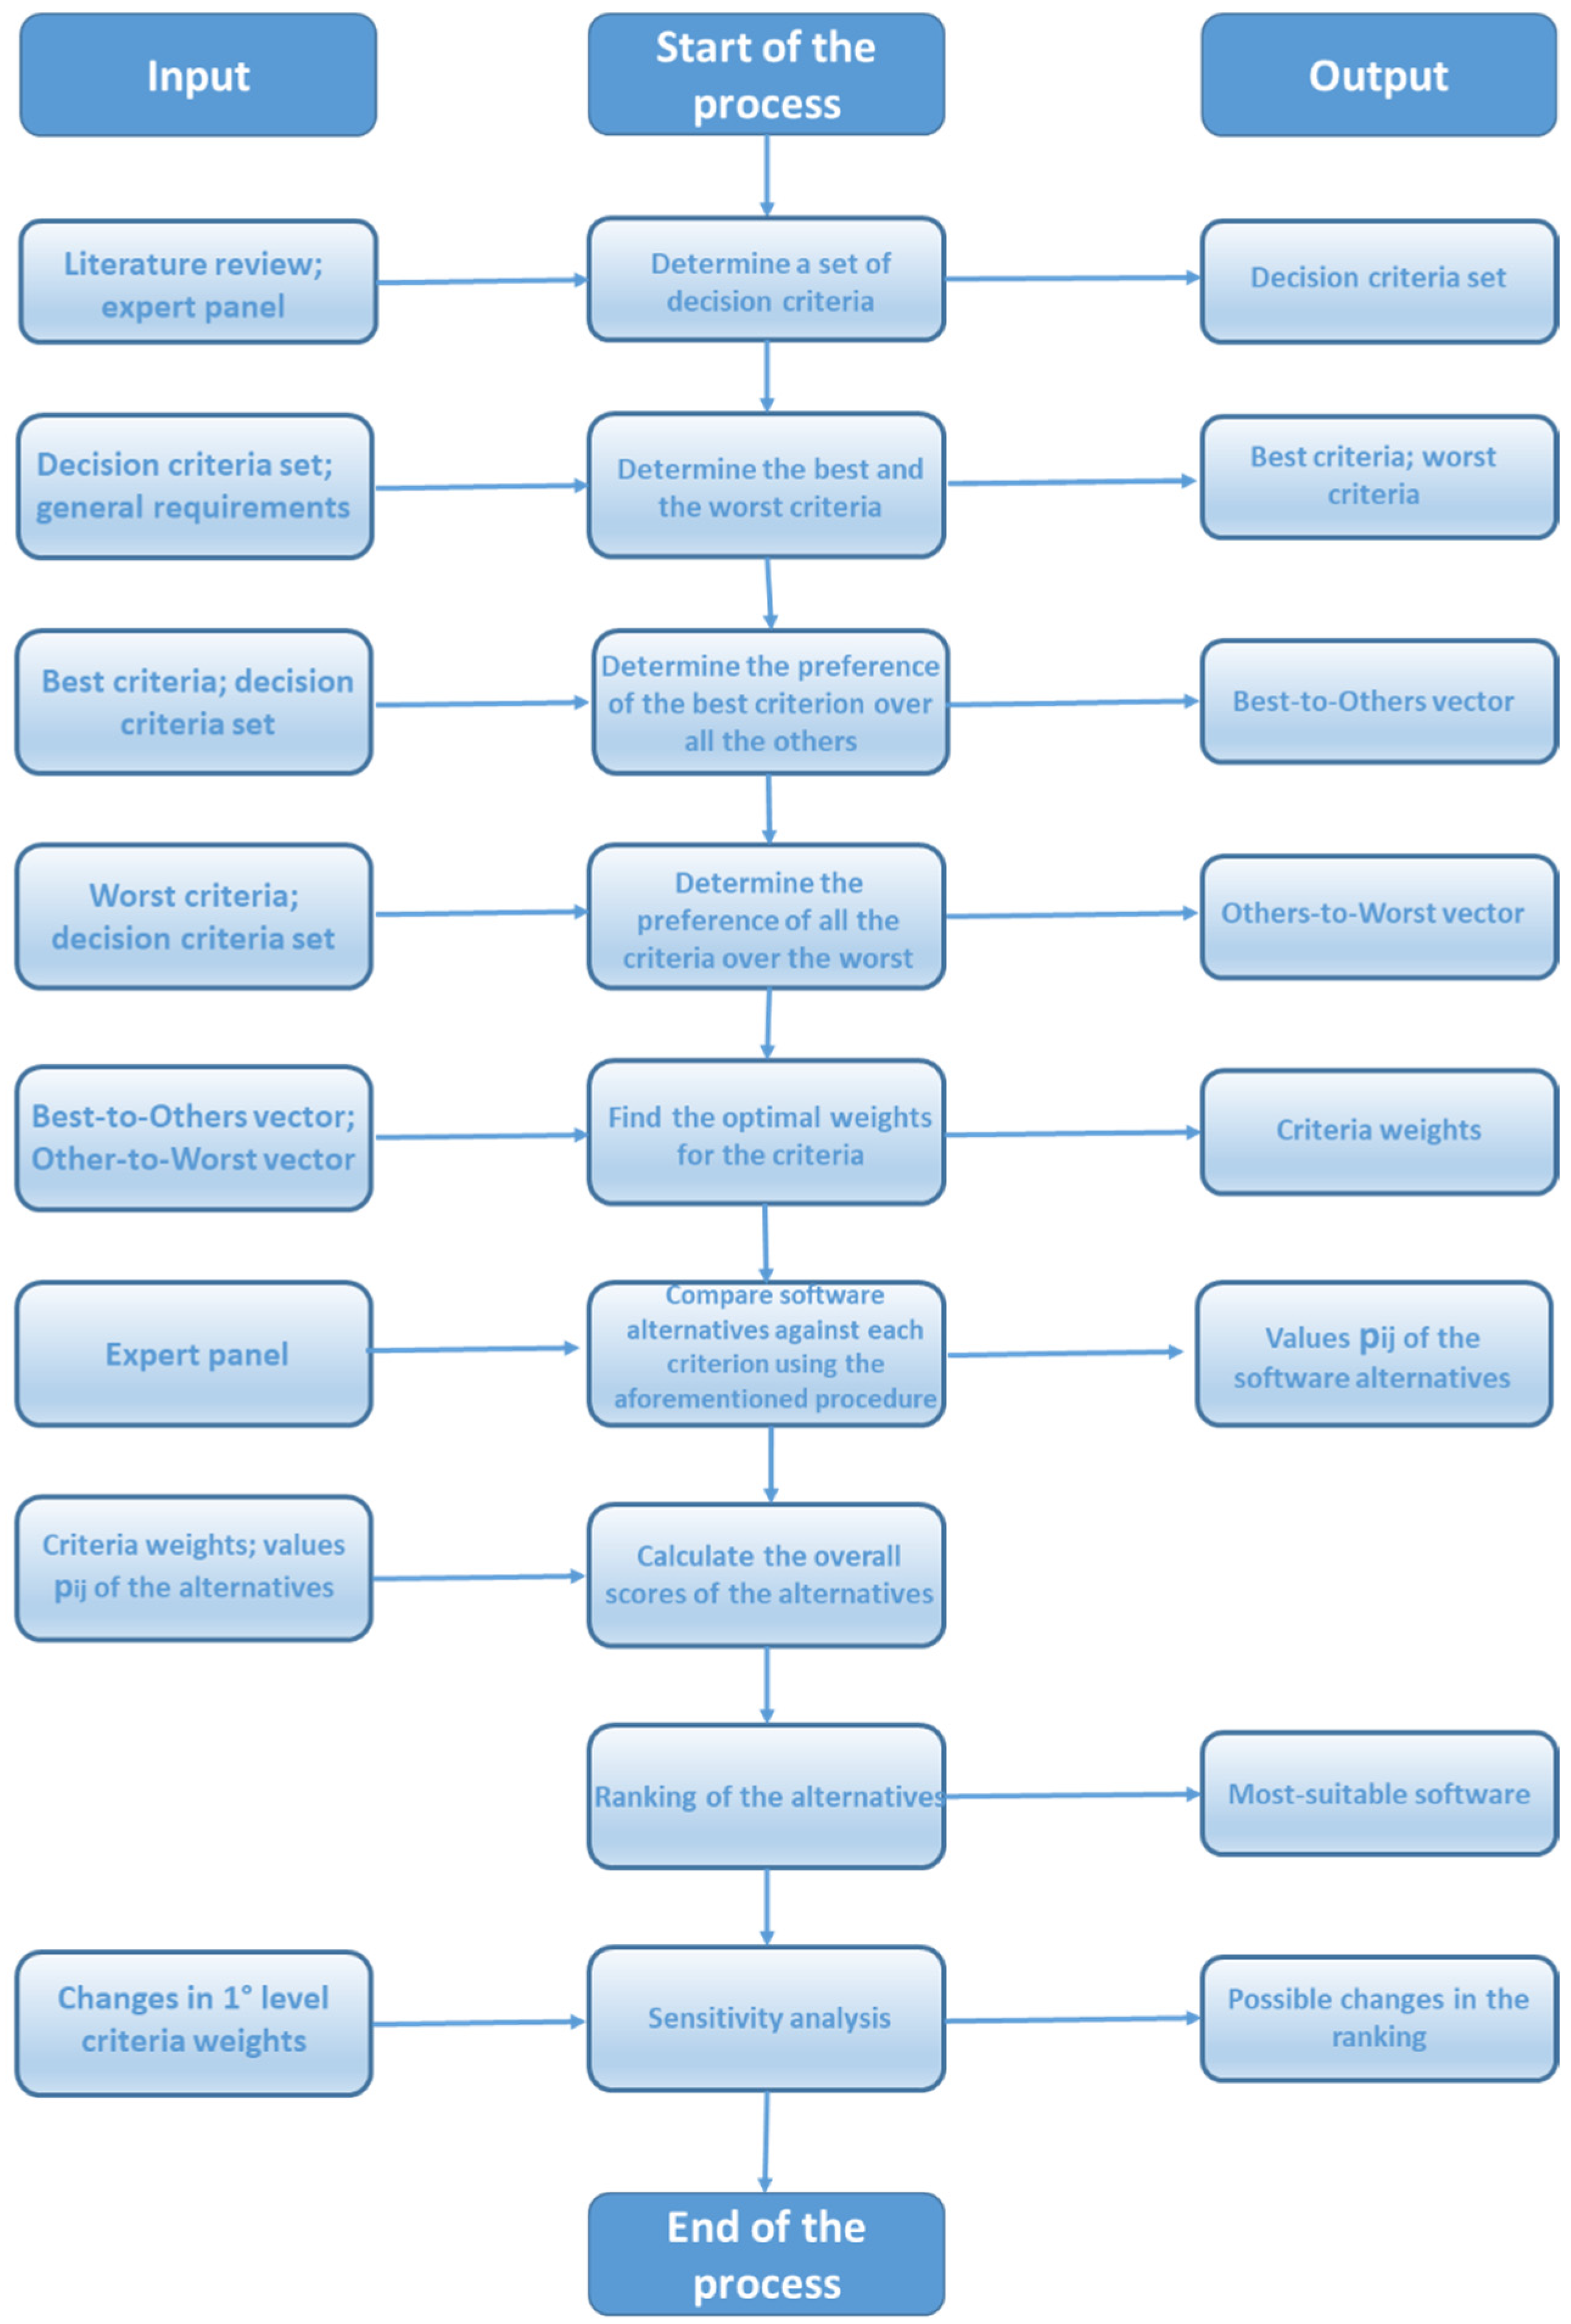
- the BWM approach. It includes eight ordered steps to select the best simulation software from a list of candidates.
4.1. Self-Assessment of the Digital Readiness of the Company Using Maturity Model
4.2. Identification of the Core Problem
4.3. Definition of the General Goals and Requirements
- -
- areas of the application and usage of the software;
- -
- particular aims of the organizational unit that will use it;
- -
- identification of the functional and non-functional requirements of the software [51].
4.4. Preliminary Screening of the Simulation Software Packages Available on the Market
4.5. Evaluation and Selection of the Best Simulation Software
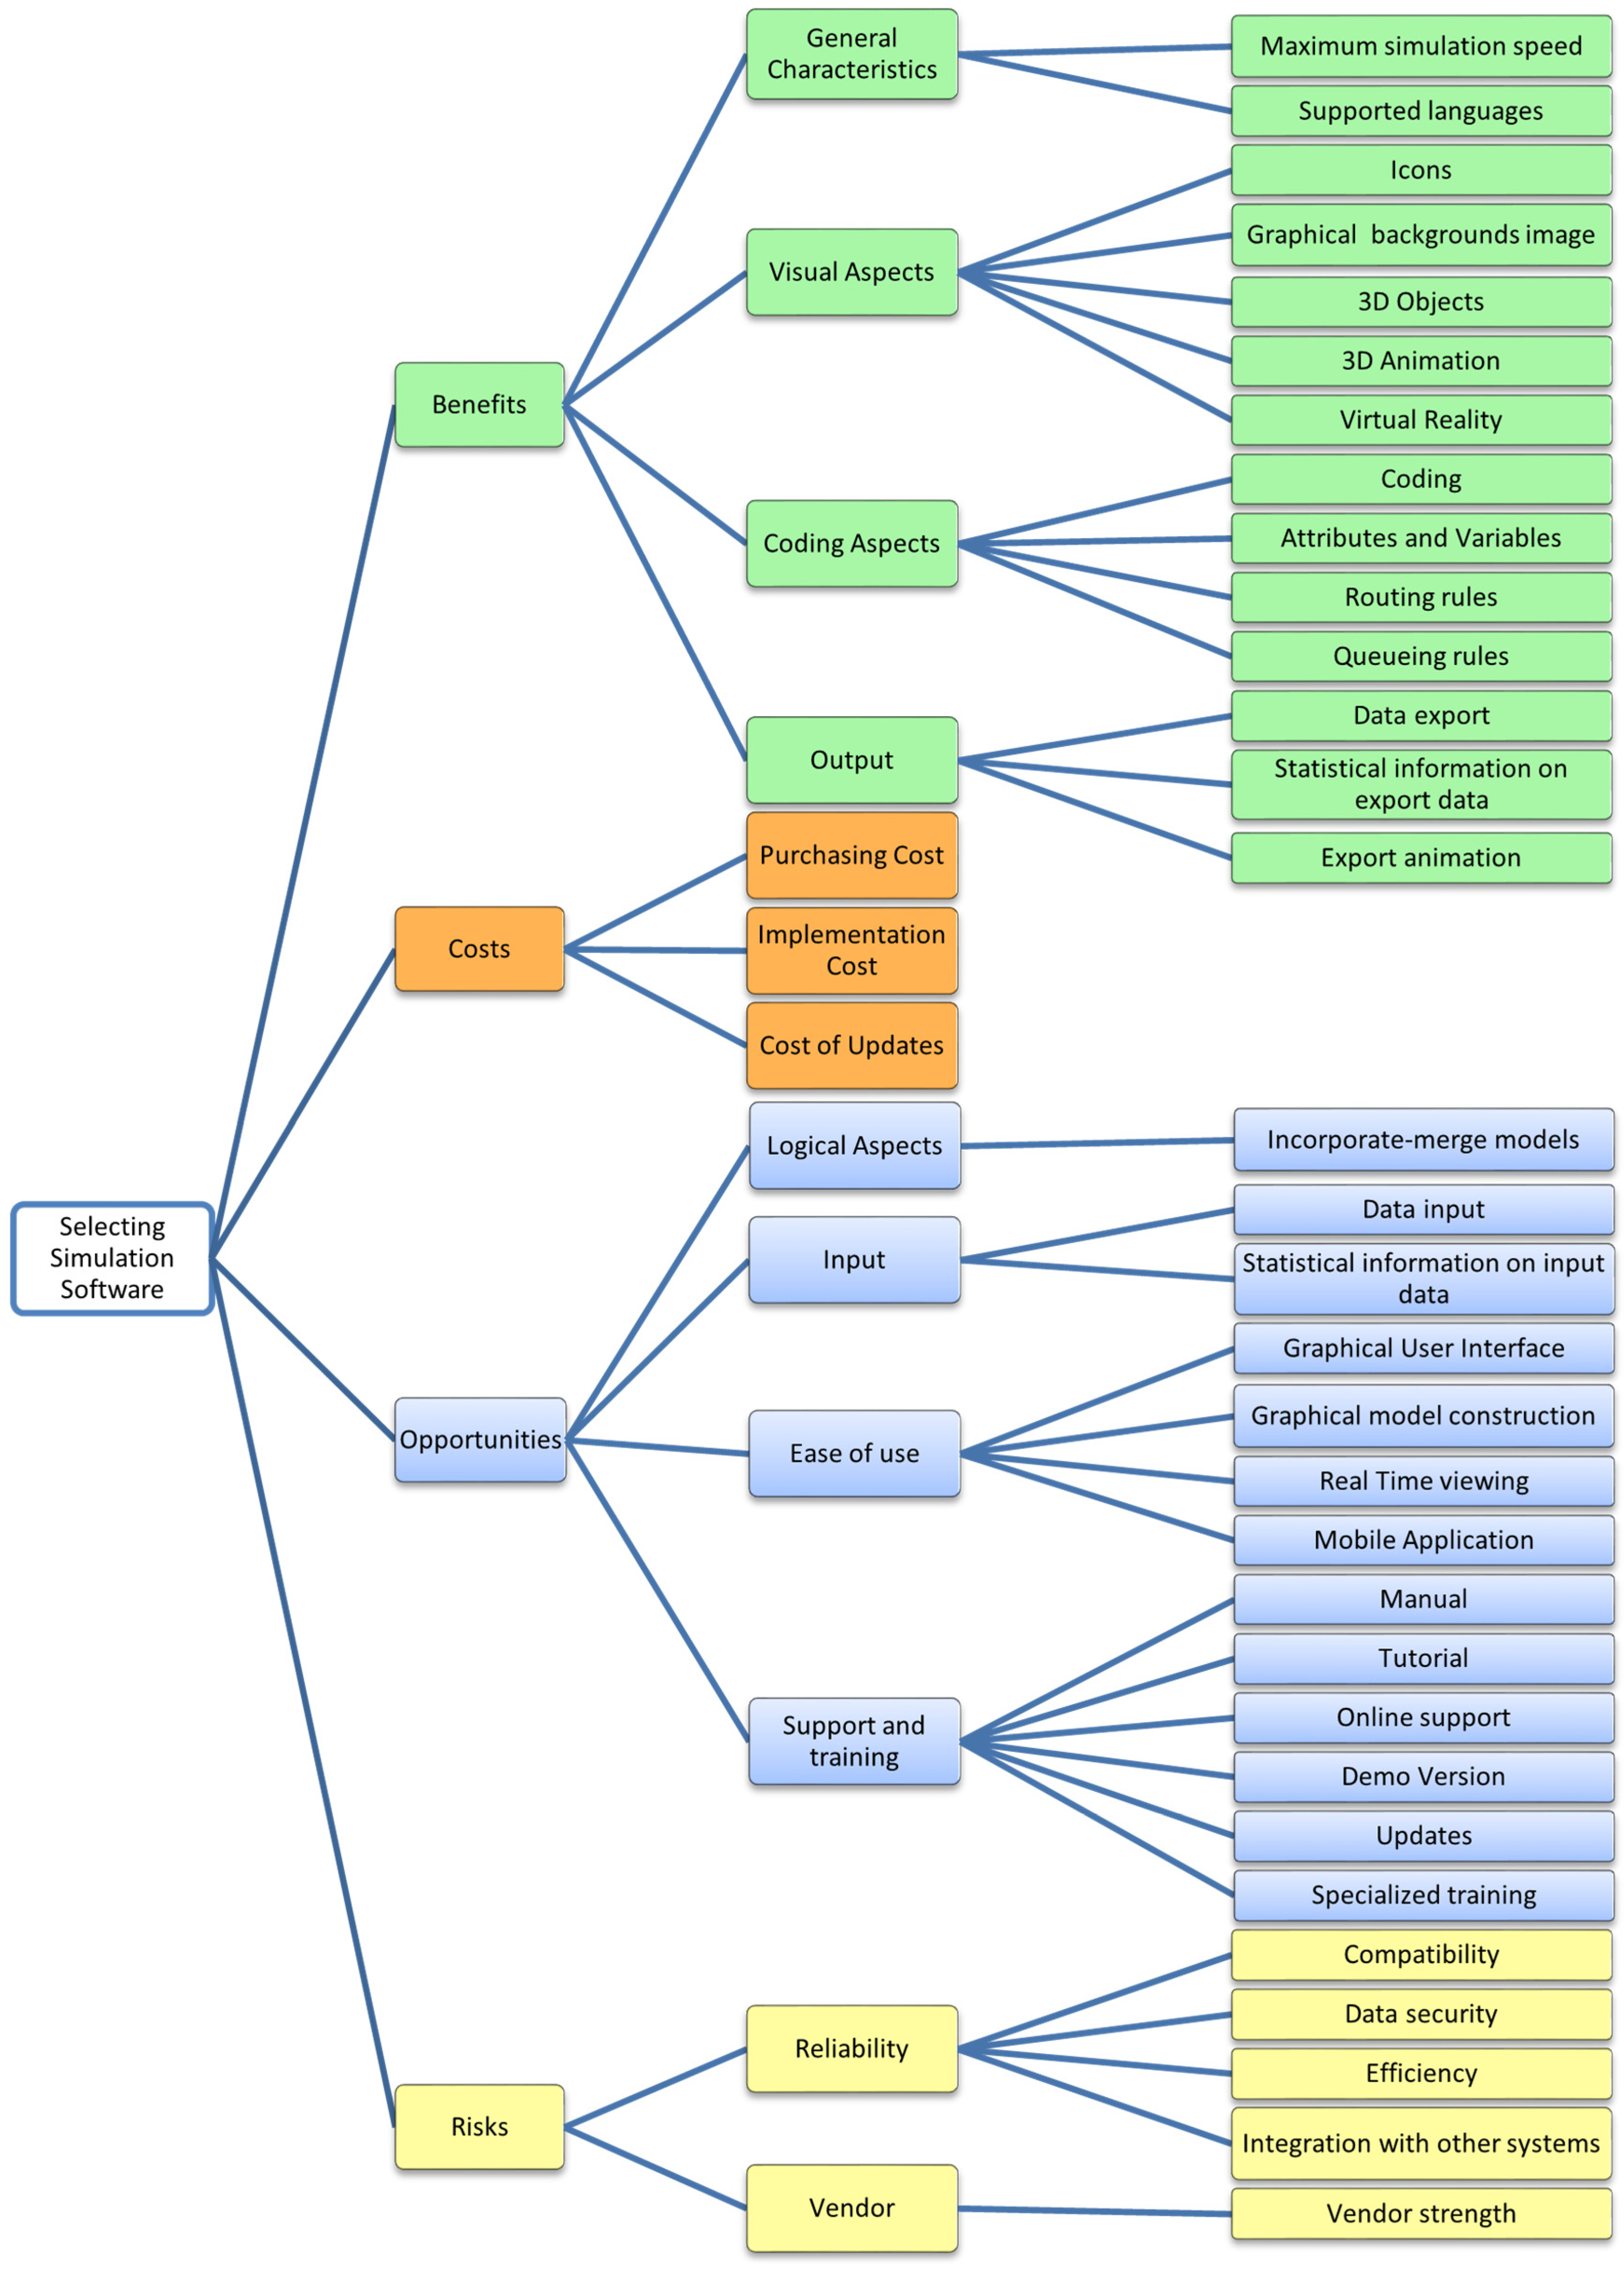
4.5.1. The Integrated BOCR-AHP Methodology
- -
- Benefits: characteristics of the business/project that give it an advantage over others;
- -
- Opportunities: elements in the environment that the business/project could exploit to its advantage;
- -
- Costs: characteristics of the business that place the business/project at a disadvantage compared to others;
- -
- Risks: elements in the environment that could trouble the business/project.
- -
- The reciprocity relationship is valid: for each value of i and j;
- -
- The transitivity relationship is valid: for each value of i, j and k.
4.5.2. The BWM Approach
4.6. Candidate Software Packages Ranking
4.7. Best Software Solution
4.8. Implementing the Solution
4.9. Maintaining and Improving the Solution
5. Case Study
5.1. Stage 1. Self-Assessment of the Digital Readiness of the Company Using Maturity Model
5.2. Stages 2 and 3. Core Problem, General Goals and Requirements
5.3. Stage 4. Preliminary Screening of the Simulation Software Packages on the Market
5.4. Stage 5. Evaluation and Selection of the Best Software
5.4.1. The Integrated BOCR-AHP Methodology
5.4.2. The BWM Implementation
5.5. Stage 6. Candidate Ranking
5.6. Stages 7, 8 and 9. Software Purchase, Implement, Maintain and Improve Solution
6. Conclusions
- -
- the new integrated BOCR-AHP methodology. It consists of six ordered sub-steps and should help select the best software and provide a ranking of alternatives;
- -
- the BWM approach. It includes eight ordered steps to select the best simulation software from a list of candidates.
Author Contributions
Funding
Acknowledgments
Conflicts of Interest
Appendix A

| 1. PROCESS |
| Dimension 1: process—Product data management. Yes/No questions |
|
| Dimension 1: process—lifecycle. Scale: from 1 to 5 (5 = high; 1 = low) |
|
| Dimension 1: process—monitoring and control. Scale: from 1 to 5 (5 = high; 1 = low) |
|
| Dimension 1: process—engineering design. |
|
| 2. TECHNOLOGY |
| Dimension 2: technology—automation. Scale: from 1 to 5 (5 = high; 1 = low) |
|
| Dimension 2: technology—sensors. |
|
| Dimension 2: technology—connectivity. |
|
| 3. ORGANIZATION |
| Dimension 3: organization—decision-making. Yes/No questions |
|
| Dimension 3: organization—strategic planning. Scale: from 1 to 5 (5 = high; 1 = low) |
|
| Dimension 3: organization—company. |
|
| 4. PEOPLE |
| Dimension 4: people—people management. |
|
Appendix B
| Criteria | Sub-Criteria | Description |
|---|---|---|
| GENERAL CHARACTERISTICS (C1) | Compatibility (C1.1) | Aspects related to hardware and installation, operating systems supported, computer architecture supported, networked version, multiprocessing capability. |
| Integration with other systems (C1.2) | Aspects related to portability between different hardware or software platforms. Can the software run external software to perform specialized tasks? Can other software control the software? | |
| Data security (C1.3) | Encryption of simulation models by a password. Encryption standard. User-definable restrictions. | |
| Maximum simulation speed (C1.4) | Maximum speed of a simulation run. | |
| Efficiency (C1.5) | Debugging on-line error checking and troubleshooting. Backup and recovery. | |
| Supported languages (C1.6) | Number of supported languages. | |
| VISUAL ASPECTS (C2) | Icons (C2.1) | Library of icons. Import icons. Icon editor. |
| Graphical background images (C2.2) | Possibility to import and/or edit *.dwg. *.dxf. *.bmp files and similar. | |
| 3D objects (C2.3) | 3D objects standard library. Possibility to import and/or edit 3D objects. | |
| 3D animation (C2.4) | Quality of animation during the simulation run (workers carrying parts, machines performing processes, etc.) | |
| Visual quality (C2.5) | Graphical quality of 3D objects and similarity to real objects. | |
| Virtual reality (C2.6) | Experience 3D simulations in virtual reality using a cardboard. | |
| LOGICAL ASPECTS (C3) | Incorporate merge models (C3.1) | Is there a way to combine models to make a complete file? |
| Coding (C3.2) | Aspects related to coding, such as programming flexibility, access to source code, built-in functions, support for third-party libraries. | |
| Attributes and variables (C3.3) | Possibility to set attributes and variables. Attributes: local values assigned to entities moving through the system. Variables: values available to all entities moving through the system. Used to describe its state. | |
| Routing rules (C3.4) | Possibility to send entities to different locations based on prescribed conditions. | |
| Queuing rules (C3.5) | Number of possible queuing rules: First In First Out, Last In First Out, Service In Random Order, Priority, etc. | |
| INPUT (C4) | Data input (C4.1) | Aspects related to input modes, such as interactive input, batch input, automatically collected data or by reading from a file. Supported input file types. Rejection of illegal inputs. |
| Statistical information on input data (C4.2) | Determining distributions of raw input data. | |
| OUTPUT (C5) | Data export (C5.1) | Supported output file types, graphics, reports, model execution logs, charts. |
| Statistical information on export data (C5.2) | Statistical analysis such as distribution fitting, confidence interval, data mining options, neural networks. | |
| Export animation (C5.3) | Create a movie of the model to view and share. | |
| EASE OF USE (C6) | Graphical user interface (C6.1) | Easiness in using the menu-driven interface. |
| Graphical model construction (C6.2) | Drag and drop objects into the virtual environment. | |
| Real-time viewing (C6.3) | View instantaneous values of variables. | |
| Mobile application (C6.4) | Is there a mobile viewer that makes it easy to share models and to view animation recordings? | |
| SUPPORT AND TRAINING (C7) | Manual (C7.1) | Availability of a manual that explain how to use the tool and quality and clarity of explanations. |
| Training (C7.2) | Availability of tutorials. | |
| Online support (C7.3) | Is there an official forum? If so, how active is it? | |
| Demo version (C7.4) | Is there a free demo version? How easy is it to download? | |
| Updates (C7.5) | Frequency of updates. | |
| Specialized training (C7.6) | Training courses. On-site training. Consultancy. | |
| VENDOR (C8) | Vendor strength (C8.1) | Aspects related to credibility, such as how long the company has been trading, company track record, references, supplier reputation and information sources. |
| COSTS (C9) | Purchasing cost (C9.1) | Cost for a single perpetual license or annual license. |
| Implementation cost (C9.2) | Installation cost and the cost to become a fluent user of the software. | |
| Cost of updates (C9.3) | Costs involved in keeping the software up-to-date as new versions are released. If there is a new version of the software, can you upgrade without having to purchase a full new license? |
References
- Pereira, A.C.; Romero, F.C. A review of the meanings and the implications of the Industry 4.0 concept. Procedia Manuf. 2017, 13, 1206–1214. [Google Scholar] [CrossRef]
- Ghobakhloo, M. Industry 4.0, digitization, and opportunities for sustainability. J. Clean. Prod. 2020, 252, 119869. [Google Scholar] [CrossRef]
- Liao, Y.; Deschamps, F.; Loures, E.D.F.R.; Ramos, L.F.P. Past, present and future of Industry 4.0—A systematic literature review and research agenda proposal. Int. J. Prod. Res. 2017, 8, 1–21. [Google Scholar] [CrossRef]
- Moeuf, A.; Pellerin, R.; Lamouri, S.; Tamayo, S.; Barbaray, R. The industrial management of SMEs in the era of Industry 4.0. Int. J. Prod. Res. 2017, 56, 1118–1136. [Google Scholar] [CrossRef]
- Rüßmann, M.; Lorenz, M.; Gerbert, P.; Waldner, M.; Justus, J.; Harnisch, P.E.e.M. Industry 4.0: The Future of Productivity and Growth in Manufacturing Industries 2015. Available online: http://www.inovasyon.org/pdf/bcg.perspectives_Industry.4.0_2015 (accessed on 5 March 2020).
- Hermann, M.; Pentek, T.; Otto, B. Design principles for industrie 4.0 scenarios. In Proceedings of the 2016 49th Hawaii International Conference on System Sciences (HICSS), Koloa, HI, USA, 5–8 January 2016. [Google Scholar]
- Shannon, R.; Johannes, J.D. Systems Simulation: The Art and Science; Prentice-Hall: San Diego, CA, USA, 1975. [Google Scholar]
- Ingalls, R. Introduction to simulation. In Proceedings of the 2011 Winter Simulation Conference, Miami, FL, USA, 11–14 December 2011. [Google Scholar]
- Chang, V. Presenting cloud business performance for manufacturing organizations. Inf. Syst. Front. 2017, 22, 59–75. [Google Scholar] [CrossRef]
- Stock, T.; Seliger, G. Opportunities of sustainable manufacturing in industry 4.0. Procedia CIRP 2016, 40, 536–541. [Google Scholar] [CrossRef]
- Tarhan, A.K.; Garousi, V.; Turetken, O.; Söylemez, M.; Garossi, S. Maturity assessment and maturity models in health care: A multivocal literature review. Digit. Health 2020, 6, 2055207620914772. [Google Scholar]
- Cusick, J.J. A survey of maturity models from nolon to DevOps and their applications in process improvement. arXiv 2019, arXiv:1907.01878. [Google Scholar]
- Manning, L. Moving from a compliance-based to an integrity-based organizational climate in the food supply chain. Compr. Rev. Food Sci. Food Saf. 2020, 19, 995–1017. [Google Scholar] [CrossRef]
- Leyh, C.; Bley, K.; Bay, L. The application of the maturity model SIMMI 4.0 in selected enterprises. In Proceedings of the AMCIS 2017—America’s Conference on Information Systems: A Tradition of Innovation, Boston, MA, USA, 10–12 August 2017. [Google Scholar]
- Becker, J.; Knackstedt, R.; Pöppelbuß, J. Developing maturity models for it management—A procedure model and its application. Bus. Inf. Syst. Eng. 2009, 1, 213–222. [Google Scholar] [CrossRef]
- Lahrmann, G.; Marx, F.; Mettler, T.; Winter, R.; Wortmann, F. Inductive design of maturity models: applying the rasch algorithm for design science research. In Proceedings of the 6th International Conference on Service-Oriented Perspectives in Design Science Research (DESRIST 2011), Milwaukee, WI, USA, 5–6 May 2011. [Google Scholar]
- Colli, M.; Madsen, O.; Berger, U.; Møller, C.; Wæhrens, B.V.; Bockholt, M.T. Contextualizing the outcome of a maturity assessment for Industry 4.0. IFAC-Pap. 2018, 51, 1347–1352. [Google Scholar] [CrossRef]
- Fumagalli, L.; Polenghi, A.; Negri, E.; Roda, I. Framework for simulation software selection. J. Simul. 2019, 13, 286–303. [Google Scholar] [CrossRef]
- Zakria, G.; Guan, Z.; Shao, X.; Riaz, Y.; Hameed, U. Selection of simulation software for manufacturing system: Application of analytical hierarchy approach in multi criteria decision making. Adv. Sci. Lett. 2011, 4, 2152–2158. [Google Scholar] [CrossRef]
- Lin, J.C.; Hsieh, P.-L. The role of technology readiness in customers’ perception and adoption of self-service technologies. Int. J. Serv. Ind. Manag. 2006, 17, 497–517. [Google Scholar] [CrossRef]
- Dorado-Vicente, R.; Gómez-Moreno, A.; Torres-Jiménez, E.; López-Alba, E. An AHP application to select software for engineering education. Comput. Appl. Eng. Educ. 2011, 22, 200–208. [Google Scholar] [CrossRef]
- Siksnelyte-Butkiene, I.; Zavadskas, E.K.; Štreimikienė, D. Multi-Criteria Decision-Making (MCDM) for the assessment of renewable energy technologies in a household: A review. Energies 2020, 13, 1164. [Google Scholar] [CrossRef]
- Bottani, E.; Centobelli, P.; Murino, T.; Shekarian, E. A QFD-ANP method for supplier selection with benefits, opportunities, costs and risks considerations. Int. J. Inf. Technol. Decis. Mak. 2018, 17, 911–939. [Google Scholar] [CrossRef]
- Rezaei, J. Best-worst multi-criteria decision-making method. Omega 2015, 53, 49–57. [Google Scholar] [CrossRef]
- Schumacher, A.; Erol, S.; Sihn, W. A maturity model for assessing industry 4.0 readiness and maturity of manufacturing enterprises. Procedia CIRP 2016, 52, 161–166. [Google Scholar] [CrossRef]
- Ganzarain, J.; Errasti, N. Three stage maturity model in SME’s toward industry 4.0. J. Ind. Eng. Manag. 2016, 9, 1119. [Google Scholar] [CrossRef]
- Weber, C.; Königsberger, J.; Kassner, L.; Mitschang, B. M2DDM—A maturity model for data-driven manufacturing. Procedia CIRP 2017, 63, 173–178. [Google Scholar] [CrossRef]
- Gökalp, E.; Şener, U.; Eren, P.E. Development of an assessment model for industry 4.0: Industry 4.0-MM. In Proceedings of the International Conference on Software Process Improvement and Capability Determination (SPICE), Palma de Mallorca, Spain, 4–5 October 2017. [Google Scholar]
- Gracel, J.; Łebkowski, P. The concept of industry 4.0-related manufacturing technology maturity model (ManuTech Maturity Model—MTMM). Decis. Mak. Manuf. Serv. 2018, 12, 17–31. [Google Scholar] [CrossRef]
- Guimarães, A.M.C.; Leal, J.E.; Mendes, P. Discrete-event simulation software selection for manufacturing based on the maturity model. Comput. Ind. 2018, 103, 14–27. [Google Scholar] [CrossRef]
- De Carolis, A.; Macchi, M.; Negri, E.; Terzi, S. A maturity model for assessing the digital readiness of manufacturing companies. In Proceedings of the IFIP Advances in Information and Communication Technology (APMS), Hamburg, Germany, 3–7 September 2017. [Google Scholar]
- Grant, F. Simulation in designing and scheduling manufacturing systems. In Design and Analysis of Integrated Manufacturing Systems; National Academy Press: Washington, DC, USA, 1988; pp. 134–147. [Google Scholar]
- Law, A.M.; Haider, S.W. Selecting simulation software for manufacturing applications. In Proceedings of the 21st conference on Winter Simulation Conference (WSC ‘89), Washington, DC, USA, 4–6 December 1989; pp. 29–32. [Google Scholar] [CrossRef]
- Banks, J.; Aviles, E.; McLaughlin, J.R.; Yuan, R.C. The simulator: New member of the simulation family. Interfaces 1991, 21, 76–86. [Google Scholar] [CrossRef]
- Banks, J. Selecting simulation software. In Proceedings of the 1991 Winter Simulation Conference (WSC ’91), Phoenix, AZ, USA, 8–11 December 1991. [Google Scholar]
- Mackulak, G.T.; Cochran, J.K.; Savory, P.A. Ascertaining important features for industrial simulation environments. Simulation 1994, 63, 211–221. [Google Scholar] [CrossRef]
- Davis, L.; Williams, G. Evaluating and selecting simulation software using the analytic hierarchy process. Integr. Manuf. Syst. 1994, 5, 23–32. [Google Scholar] [CrossRef]
- Hlupic, V.; Mann, A. Simselect: a system for simulation software selection. In Proceedings of the 1995 Winter Simulation Conference, Arlington, VA, USA, 3–6 December 1995. [Google Scholar]
- Kuljis, J. HCI and simulation packages. In Proceedings of the 1996 Winter Simulation Conference, Coronado, CA, USA, 8–11 December 1996. [Google Scholar]
- Hlupic, V.; Paul, R.J. Methodological approach to manufacturing simulation software selection. Comput. Integr. Manuf. Syst. 1996, 9, 49–55. [Google Scholar] [CrossRef]
- Bard, J.; Bergevin, A.; DeSilva, A. Evaluating simulation software for postal service use: technique versus perception. IEEE Trans. Eng. Manag. 1997, 44, 31–42. [Google Scholar] [CrossRef]
- Nikoukaran, J.; Hlupic, V.; Paul, R.J. Criteria for simulation software evaluation. In Proceedings of the 1998 Winter Simulation Conference (WSC ’98), Washington, DC, USA, 13–16 December 1998. [Google Scholar]
- Hlupic, V.; Paul, R.J. Guidelines for selection of manufacturing simulation software. IIE Trans. 1999, 31, 21–29. [Google Scholar] [CrossRef]
- Nikoukaran, J.; Hlupic, V.; Paul, R.J. A hierarchical framework for evaluating simulation software. Simul. Pract. Theory 1999, 7, 219–231. [Google Scholar] [CrossRef]
- Hlupic, V.; Irani, Z.; Paul, R.J. Evaluation Framework for Simulation Software. Int. J. Adv. Manuf. Technol. 1999, 15, 366–382. [Google Scholar] [CrossRef]
- Tewoldeberhan, T.; Verbraeck, A.; Valentin, E.; Bardonnet, G. An evaluation and selection methodology for discrete-event simulation software. In Proceedings of the 2002 Winter Simulation Conference, San Diego, CA, USA, 8–11 December 2002. [Google Scholar]
- Arisha, A.; Baradie, M.E. On selection of simulation software for manufacturing application. In Proceedings of the Nineteenth International Manufacturing Conference (IMC-19), Queen’s University of Belfast, Ireland, 28–30 August 2002; pp. 495–507. [Google Scholar]
- Sahay, B.; Gupta, A. Development of software selection criteria for supply chain solutions. Ind. Manag. Data Syst. 2003, 103, 97–110. [Google Scholar] [CrossRef]
- Lee, H.-S.; Shen, P.-D.; Chih, W.-L. A fuzzy multiple criteria decision making model for software selection. In Proceedings of the 2004 IEEE International Conference on Fuzzy Systems, Budapest, Hungary, 25–29 July 2004. [Google Scholar]
- Cochran, J.K.; Chen, H.-N. Fuzzy multi-criteria selection of object-oriented simulation software for production system analysis. Comput. Oper. Res. 2005, 32, 153–168. [Google Scholar] [CrossRef]
- Rincon, G.; Alvarez, M.; Pérez, M.; Hernandez, S. A discrete-event simulation and continuous software evaluation on a systemic quality model: An oil industry case. Inf. Manag. 2005, 42, 1051–1066. [Google Scholar] [CrossRef]
- Vuksic, V.B.; Ceric, V.; Hlupic, V. Criteria for the evaluation of business process simulation tools. Interdiscip. J. Inf. Knowl. Manag. 2007, 2, 73–88. [Google Scholar]
- Alvarez, M.; Rincón, G.; Hernández, S. Evaluation and selection of discrete-event simulation software for the oil industry. Lat. Am. Appl. Res. 2008, 38, 305–312. [Google Scholar]
- Azadeh, M.; Shirkouhi, S.N. Evaluating simulation software using fuzzy analytical hierarchy process. In Proceedings of the 2009 Spring Simulation Multiconference (SpringSim ’09), San Diego, CA, USA, 22–27 March 2009. [Google Scholar]
- Gupta, A.; Verma, R.; Singh, K. A critical evaluation and comparison of four manufacturing simulators using analytic hierarchy process. Int. J. Eng. Model. 2009, 22, 35–51. [Google Scholar]
- Gupta, A.; Verma, R.; Singh, K. A critical study and comparison of manufacturing simulation softwares using analytic hierarchy process. J. Eng. Sci. Technol. 2010, 5, 108–129. [Google Scholar]
- Sawant, V.; Mohite, S.; Patil, R. A decision-making methodology for automated guided vehicle selection problem using a preference selection index method. In Technology Systems and Management. Communications in Computer and Information Science; Shah, K., Lakshmi Gorty, V.R., Phirke, A., Eds.; Springer: Berlin/Heidelberg, Germany, 2011; Volume 145. [Google Scholar]
- Ayağ, Z. A combined fuzzy AHP-simulation approach to CAD software selection. Int. J. Gen. Syst. 2010, 39, 731–756. [Google Scholar] [CrossRef]
- Jadhav, A.S.; Sonar, R. Framework for evaluation and selection of the software packages: A hybrid knowledge based system approach. J. Syst. Softw. 2011, 84, 1394–1407. [Google Scholar] [CrossRef]
- Hincu, D.; Andreica, M. The evaluation and selecting process for simulation software using fuzzy sets. Metal. Int. 2012, 17, 141–144. [Google Scholar]
- Pezzotta, G.; Pirola, F.; Rondini, A.; Pinto, R.; Ouertani, M.-Z. Towards a methodology to engineer industrial product-service system—Evidence from power and automation industry. CIRP J. Manuf. Sci. Technol. 2016, 15, 19–32. [Google Scholar] [CrossRef]
- Ereeş, S.; Kuruoğlu, E.; Moralı, N. An application of analytical hierarchy process for simulation software selection in education area. Front. Sci. 2013, 3, 66–70. [Google Scholar]
- Azadeh, A.; Nazari-Shirkouhi, S.; Samadi, H.; Shirkouhi, A.N. An integrated fuzzy group decision making approach for evaluation and selection of best simulation software packages. Int. J. Ind. Syst. Eng. 2014, 18, 256. [Google Scholar] [CrossRef]
- Franceschini, R.; Bisgambiglia, P.-A.; Touraille, L.; Hill, D. A survey of modelling and simulation software frameworks using Discrete Event System Specification. Open Access Ser. Inform. 2014, 43, 40–49. [Google Scholar]
- Gupta, A. How to select a simulation software. Int. J. Eng. Res. Dev. 2014, 10, 35–41. [Google Scholar]
- Jadric, M.; Cukusic, M.; Bralić, A. Comparison of discrete event simulation tools in an academic environment. Croat. Oper. Res. Rev. 2014, 5, 203–219. [Google Scholar] [CrossRef]
- Rohaninejad, M.; Kheirkhah, A.; Fattahi, P.; Vahedi-Nouri, B. A hybrid multi-objective genetic algorithm based on the ELECTRE method for a capacitated flexible job shop scheduling problem. Int. J. Adv. Manuf. Technol. 2014, 77, 51–66. [Google Scholar] [CrossRef]
- Dias, L.; Vieira, A.A.; Pereira, G.; Oliveira, J. Discrete simulation software ranking—A top list of the worldwide most popular and used tools. In Proceedings of the 2016 Winter Simulation Conference, Washington, DC, USA, 11–14 December 2016. [Google Scholar]
- Rashidi, Z.; Rashidi, Z. Evaluation and ranking of discrete simulation tools. J. Electr. Comput. Eng. Innov. 2016, 4, 69–84. [Google Scholar]
- Alomair, Y.; Ahmad, I.; Alghamdi, A.; Alhaznawi, S. Evaluating defense simulation packages using analytic hierarchy process. J. Int. Technol. 2016, 17, 831–838. [Google Scholar]
- Ejercito, P.M.; Nebrija, K.G.E.; Feria, R.; Lara-Figueroa, L.L. Traffic simulation software review. In Proceedings of the 2017 International Conference on Information, Intelligence, Systems & Applications (IISA), Larnaka, Cyprus, 27–30 August 2017. [Google Scholar]
- Govindan, K.; Shankar, K.M.; Kannan, D. Achieving sustainable development goals through identifying and analyzing barriers to industrial sharing economy: A framework development. Int. J. Prod. Econ. 2020, 227, 107575. [Google Scholar] [CrossRef]
- Attri, R.; Grover, S. Decision making over the production system life cycle: MOORA method. Int. J. Syst. Assur. Eng. Manag. 2013, 5, 320–328. [Google Scholar] [CrossRef]
- Alomair, Y.; Ahmad, I.; Alghamdi, A. A review of evaluation methods and techniques for simulation packages. Procedia Comput. Sci. 2015, 62, 249–256. [Google Scholar] [CrossRef]
- Abdel-Basset, M.; Mohamed, M.; Chang, V.; Smarandache, F. IoT and its impact on the electronics market: A powerful decision support system for helping customers in choosing the best product. Symmetry 2019, 11, 611. [Google Scholar] [CrossRef]
- Willaert, P.; Bergh, J.V.D.; Willems, J.; Deschoolmeester, D. The process-oriented organisation: A holistic view developing a framework for business process orientation maturity. In Business Process Management (BPM 2007); Alonso, G., Dadam, P., Rosemann, M., Eds.; Springer: Berlin, Germany, 2007; Volume 4717, pp. 1–15. [Google Scholar] [CrossRef]
- Weckenmann, A.; Akkasoglu, G. Methodic design of a customized maturity model for geometrical tolerancing. Procedia CIRP 2013, 10, 119–124. [Google Scholar] [CrossRef]
- Crosby, P. Quality is Free: The Art of Making Quality Certain; McGraw-Hill: London, UK, 1979. [Google Scholar]
- Wind, Y.; Saaty, T.L. Marketing applications of the analytic hierarchy process. Manag. Sci. 1980, 26, 641–658. [Google Scholar] [CrossRef]
- Saaty, T.L. Decision making with the analytic hierarchy process. Int. J. Serv. Sci. 2008, 1, 83. [Google Scholar] [CrossRef]
- Wijnmalen, D.J. Analysis of benefits, opportunities, costs, and risks (BOCR) with the AHP–ANP: A critical validation. Math. Comput. Model. 2007, 46, 892–905. [Google Scholar] [CrossRef]
- Gupta, H.; Barua, M.K. Supplier selection among SMEs on the basis of their green innovation ability using BWM and fuzzy TOPSIS. J. Clean. Prod. 2017, 152, 242–258. [Google Scholar] [CrossRef]
- Gupta, H.; Barua, M.K. A framework to overcome barriers to green innovation in SMEs using BWM and Fuzzy TOPSIS. Sci. Total Environ. 2018, 633, 122–139. [Google Scholar] [CrossRef]
- Jensen, P. Can participatory ergonomics become ’the way we do things in this firm’—The Scandinavian approach to participatory ergonomics. Ergonomics 1997, 40, 1078–1087. [Google Scholar] [CrossRef]
- Chang, V.; Abdel-Basset, M.; Ramachandran, M. Towards a reuse strategic decision pattern framework—From theories to practices. Inf. Syst. Front. 2019, 21, 27–44. [Google Scholar] [CrossRef]


| Year | Reference | Model | Structure | Evaluation |
|---|---|---|---|---|
| 2016 | [25] | Industry 4.0 maturity model | Hierarchical with five levels | Nine dimensions: strategy, leadership, customers, products, operations, culture, people, governance, technology |
| 2016 | [26] | Three stages maturity model | Hierarchical with five levels | Three dimensions: envision, enable, enact |
| 2017 | [27] | M2DDM | Hierarchical with five levels | Focused on IT systems, which is the only dimension |
| 2017 | [14] | SIMMI 4.0 | Hierarchical with five levels | Four dimensions: vertical integration, horizontal integration, digital product development, cross-sectional technology |
| 2017 | [28] | Industry 4.0 maturity model | Hierarchical with six levels | Five dimensions: asset management, data governance, application management, process transformation, organizational alignment |
| 2018 | [29] | MTMM | Hierarchical with five levels | Eight dimensions: core technologies, people and culture, knowledge management, real-time integration, infrastructure, strategic awareness and alignment, process excellence, cybersecurity |
| 2018 | [30] | DESS maturity model | Hierarchical with five levels | Six dimensions: knowledge of simulation, process standardization, specialist knowledge, process organization, measurement and evaluation, management programs |
| 2018 | [31] | Digital Readiness Assessment Maturity—DREAMY | Hierarchical with five levels | Four dimensions: process, monitoring and controlling, technology, organization |
| Paper | Evaluation Framework | Maturity Model | Selection Criteria | Evaluation Technique | Practical Application | Comparison Software Characteristics |
|---|---|---|---|---|---|---|
| [32] | x | |||||
| [33] | x | |||||
| [34] | x | x | ||||
| [35] | x | |||||
| [36] | x | |||||
| [37] | x | x | x | |||
| [38] | x | x | x | |||
| [39] | x | x | ||||
| [40] | x | x | ||||
| [41] | x | x | x | x | ||
| [42] | x | |||||
| [43] | x | x | ||||
| [44] | x | x | ||||
| [45] | x | x | ||||
| [46] | x | x | x | |||
| [47] | x | |||||
| [48] | x | x | x | |||
| [49] | x | |||||
| [50] | x | x | x | |||
| [51] | x | x | x | x | ||
| [52] | x | |||||
| [53] | x | x | x | |||
| [54] | x | x | x | |||
| [55] | x | x | x | |||
| [56] | x | x | x | |||
| [57] | x | x | ||||
| [58] | x | |||||
| [59] | x | x | x | |||
| [19] | x | x | ||||
| [60] | x | x | ||||
| [61] | x | |||||
| [62] | x | x | x | |||
| [21] | x | x | x | |||
| [63] | x | x | x | x | ||
| [64] | x | x | ||||
| [65] | x | x | ||||
| [66] | x | x | ||||
| [24] | x | |||||
| [67] | x | x | ||||
| [68] | x | x | ||||
| [69] | x | x | x | |||
| [70] | x | x | ||||
| [71] | x | x | ||||
| [30] | x | x | x | x | ||
| [18] | x | x | x | x |
| LEVEL | ||||||
|---|---|---|---|---|---|---|
| Basic | Repetitive | Defined | Integrated | Optimal | ||
| DIMENSION | Process | No standardization Documents only maintained locally Minimal information sharing Limited product feedback | Static reports of operational activity Isolated attempts of standardization Information is starting to be shared | Processes are formally described Implementation of standards | Processes controlled and managed statistically and quantitatively Real-time analytical data processing Predictive analytics | Integration into corporate processes Digital oriented processes Processes improved by incremental innovations Cognitive analytics Quantitative goals |
| Technology | No historical data Sensors are not connected | Connected devices Data localized | Software tunable assets Data in real-time | Self-optimization Interaction with ecosystem | Converged technology Real-time infrastructure Machine learning | |
| Organization | Ad hoc Decision-making No prediction capabilities Use trial and error or experience for troubleshooting Minimal strategic planning | Near-term focused Measurements are made in the form of manual notes Some evaluation procedures have started to be defined | Process-driven Longer-term focused Quality inspections Quality maintenance procedures | Policy-driven Long-term focused Smart decision-making Limited enterprise-wide integration | Value-oriented Strategy iterates rapidly in response to competitive opportunities and threats Implementation of programs such as QPM, OPP, OPM | |
| People | Ad hoc people management | Policies developed for capability improvement | Standardized people management across organization | Quantitative goals for people management in place | Continuous focus on improving individual competence and workforce motivation | |
| Maturity Level | Score Band |
|---|---|
| Basic | 0 ≤ IDML < 20 |
| Repetitive | 20 ≤ IDML < 40 |
| Defined | 40 ≤ IDML < 60 |
| Integrated | 60 ≤ IDML < 80 |
| Optimal | 80 ≤ IDML ≤ 100 |
| S1 | 0.491 | 0.273 | 0.282 | 0.651 |
| S2 | 0.233 | 0.296 | 0.507 | 0.134 |
| S3 | 0.276 | 0.437 | 0.209 | 0.215 |
| Alternative | Global Score |
|---|---|
| S1 | 0.730 |
| S2 | 1.015 |
| S3 | 2.684 |
| Criteria | VC to Others | PS to Others | AL to Others | ||||||
|---|---|---|---|---|---|---|---|---|---|
| VC | PS | AL | VC | PS | AL | VC | PS | AL | |
| General Characteristics (GC) | |||||||||
| Compatibility | 1 | 1 | 1/5 | 1 | 1 | 1/5 | 5 | 5 | 1 |
| Integration with other systems | 1 | 1/3 | 1/3 | 3 | 1 | 1 | 3 | 1 | 1 |
| Data security | 1 | 1/3 | 3 | 3 | 1 | 5 | 1/3 | 1/5 | 1 |
| Maximum simulation speed | 1 | 1/9 | 1/5 | 9 | 1 | 5 | 5 | 1/5 | 1 |
| Efficiency | 1 | 1/5 | 1/3 | 5 | 1 | 3 | 3 | 1/3 | 1 |
| Supported languages | 1 | 1/3 | 1/5 | 3 | 1 | 1/3 | 5 | 3 | 1 |
| Visual Aspects (VA) | |||||||||
| Icons | 1 | 3 | 1/5 | 1/3 | 1 | 1/7 | 3 | 7 | 1 |
| Graphical background images | 1 | 1 | 1 | 1 | 1 | 1 | 1 | 1 | 1 |
| 3D objects | 1 | 7 | 3 | 1/7 | 1 | 1/5 | 1/3 | 5 | 1 |
| 3D animation | 1 | 9 | 7 | 1/9 | 1 | 1/7 | 1/5 | 7 | 1 |
| Visual quality | 1 | 7 | 5 | 1/7 | 1 | 1/3 | 1/5 | 3 | 1 |
| Virtual reality | 1 | 5 | 7 | 1/5 | 1 | 3 | 1/7 | 1/3 | 1 |
| Logical Aspects (LA) | |||||||||
| Incorporate-merge models | 1 | 1/3 | 1/3 | 3 | 1 | 1 | 3 | 1 | 1 |
| Coding | 1 | 1 | 1 | 1 | 1 | 1 | 1 | 1 | 1 |
| Attributes and variables | 1 | 1/3 | 1/3 | 3 | 1 | 1 | 3 | 1 | 1 |
| Routing rules | 1 | 3 | 1 | 1/3 | 1 | 1 | 1 | 3 | 1 |
| Queueing rules | 1 | 1 | 1 | 1 | 1 | 1 | 1 | 1 | 1 |
| Input (IN) | |||||||||
| Data Input | 1 | 1 | 1/5 | 1 | 1 | 1/5 | 5 | 5 | 1 |
| Statistical information on input data | 1 | 1 | 1/3 | 1 | 1 | 1/3 | 3 | 3 | 1 |
| Output (OU) | |||||||||
| Data export | 1 | 1/3 | 1/3 | 3 | 1 | 1 | 3 | 1 | 1 |
| Statistical information on export data | 1 | 3 | 3 | 1/3 | 1 | 1 | 1/3 | 1 | 1 |
| Export animation | 1 | 1 | 1 | 1 | 1 | 1 | 1 | 1 | 1 |
| Ease of use (EU) | |||||||||
| Graphical user interface | 1 | 3 | 1/3 | 1/3 | 1 | 1/5 | 3 | 5 | 1 |
| Graphical model construction | 1 | 1 | 1 | 1 | 1 | 1 | 1 | 1 | 1 |
| Real-time viewing | 1 | 1/5 | 1/5 | 5 | 1 | 1 | 5 | 1 | 1 |
| Mobile application | 1 | 9 | 9 | 1/9 | 1 | 1 | 1/9 | 1 | 1 |
| Support and training (ST) | |||||||||
| Manual | 1 | 1 | 1 | 1 | 1 | 1 | 1 | 1 | 1 |
| Tutorial | 1 | 1 | 5 | 1 | 1 | 5 | 1/5 | 1/5 | 1 |
| Online support | 1 | 1/7 | 1 | 7 | 1 | 7 | 1 | 1/7 | 1 |
| Demo version | 1 | 1/3 | 1/3 | 3 | 1 | 1 | 3 | 1 | 1 |
| Updates | 1 | 1 | 1 | 1 | 1 | 1 | 1 | 1 | 1 |
| Specialized training | 1 | 1 | 1 | 1 | 1 | 1 | 1 | 1 | 1 |
| Vendor (VE) | |||||||||
| Vendor strength | 1 | 1/9 | 1/4 | 9 | 1 | 5 | 5 | 1/5 | 1 |
| Costs (CO) | |||||||||
| Acquisition cost | 1 | 3 | 1/3 | 1/3 | 1 | 1/5 | 3 | 5 | 1 |
| Implementation cost | 1 | 1 | 1 | 1 | 1 | 1 | 1 | 1 | 1 |
| Cost of updates | 1 | 1 | 1 | 1 | 1 | 1 | 1 | 1 | 1 |
| Run | GC | VA | LA | IN | OU | EU | ST | VE | CO |
|---|---|---|---|---|---|---|---|---|---|
| Original | 0.126 | 0.126 | 0.076 | 0.126 | 0.076 | 0.313 | 0.054 | 0.027 | 0.076 |
| Run1 (0.1) | 0.165 | 0.165 | 0.099 | 0.165 | 0.099 | 0.100 | 0.071 | 0.036 | 0.099 |
| Run2 (0.2) | 0.147 | 0.147 | 0.088 | 0.147 | 0.088 | 0.200 | 0.063 | 0.032 | 0.088 |
| Run3 (0.3) | 0.129 | 0.129 | 0.077 | 0.129 | 0.077 | 0.300 | 0.055 | 0.028 | 0.077 |
| Run4 (0.4) | 0.110 | 0.110 | 0.066 | 0.110 | 0.066 | 0.400 | 0.047 | 0.024 | 0.066 |
| Run5 (0.5) | 0.092 | 0.092 | 0.055 | 0.092 | 0.055 | 0.500 | 0.039 | 0.020 | 0.055 |
| Run6 (0.6) | 0.073 | 0.073 | 0.044 | 0.073 | 0.044 | 0.600 | 0.031 | 0.016 | 0.044 |
| Run7 (0.7) | 0.055 | 0.055 | 0.033 | 0.055 | 0.033 | 0.700 | 0.024 | 0.012 | 0.033 |
| Run8 (0.8) | 0.037 | 0.037 | 0.022 | 0.037 | 0.022 | 0.800 | 0.016 | 0.008 | 0.022 |
| Run9 (0.9) | 0.018 | 0.018 | 0.011 | 0.018 | 0.011 | 0.900 | 0.008 | 0.004 | 0.011 |
| Solutions | Original | Run1 | Run2 | Run3 | Run4 | Run5 | Run6 | Run7 | Run8 | Run9 |
|---|---|---|---|---|---|---|---|---|---|---|
| S1 | 0.315 | 0.322 | 0.319 | 0.316 | 0.312 | 0.309 | 0.306 | 0.303 | 0.300 | 0.297 |
| S2 | 0.284 | 0.287 | 0.285 | 0.284 | 0.282 | 0.281 | 0.280 | 0.278 | 0.277 | 0.275 |
| S3 | 0.401 | 0.391 | 0.396 | 0.400 | 0.405 | 0.410 | 0.414 | 0.419 | 0.423 | 0.428 |
© 2020 by the authors. Licensee MDPI, Basel, Switzerland. This article is an open access article distributed under the terms and conditions of the Creative Commons Attribution (CC BY) license (http://creativecommons.org/licenses/by/4.0/).
Share and Cite
Cafasso, D.; Calabrese, C.; Casella, G.; Bottani, E.; Murino, T. Framework for Selecting Manufacturing Simulation Software in Industry 4.0 Environment. Sustainability 2020, 12, 5909. https://doi.org/10.3390/su12155909
Cafasso D, Calabrese C, Casella G, Bottani E, Murino T. Framework for Selecting Manufacturing Simulation Software in Industry 4.0 Environment. Sustainability. 2020; 12(15):5909. https://doi.org/10.3390/su12155909
Chicago/Turabian StyleCafasso, Davide, Cosimo Calabrese, Giorgia Casella, Eleonora Bottani, and Teresa Murino. 2020. "Framework for Selecting Manufacturing Simulation Software in Industry 4.0 Environment" Sustainability 12, no. 15: 5909. https://doi.org/10.3390/su12155909
APA StyleCafasso, D., Calabrese, C., Casella, G., Bottani, E., & Murino, T. (2020). Framework for Selecting Manufacturing Simulation Software in Industry 4.0 Environment. Sustainability, 12(15), 5909. https://doi.org/10.3390/su12155909