Effects of Landscape Changes on Soil Erosion in the Built Environment: Application of Geospatial-Based RUSLE Technique

 ,
,  , , ,
, , ,
Abstract
1. Introduction
2. Methodology
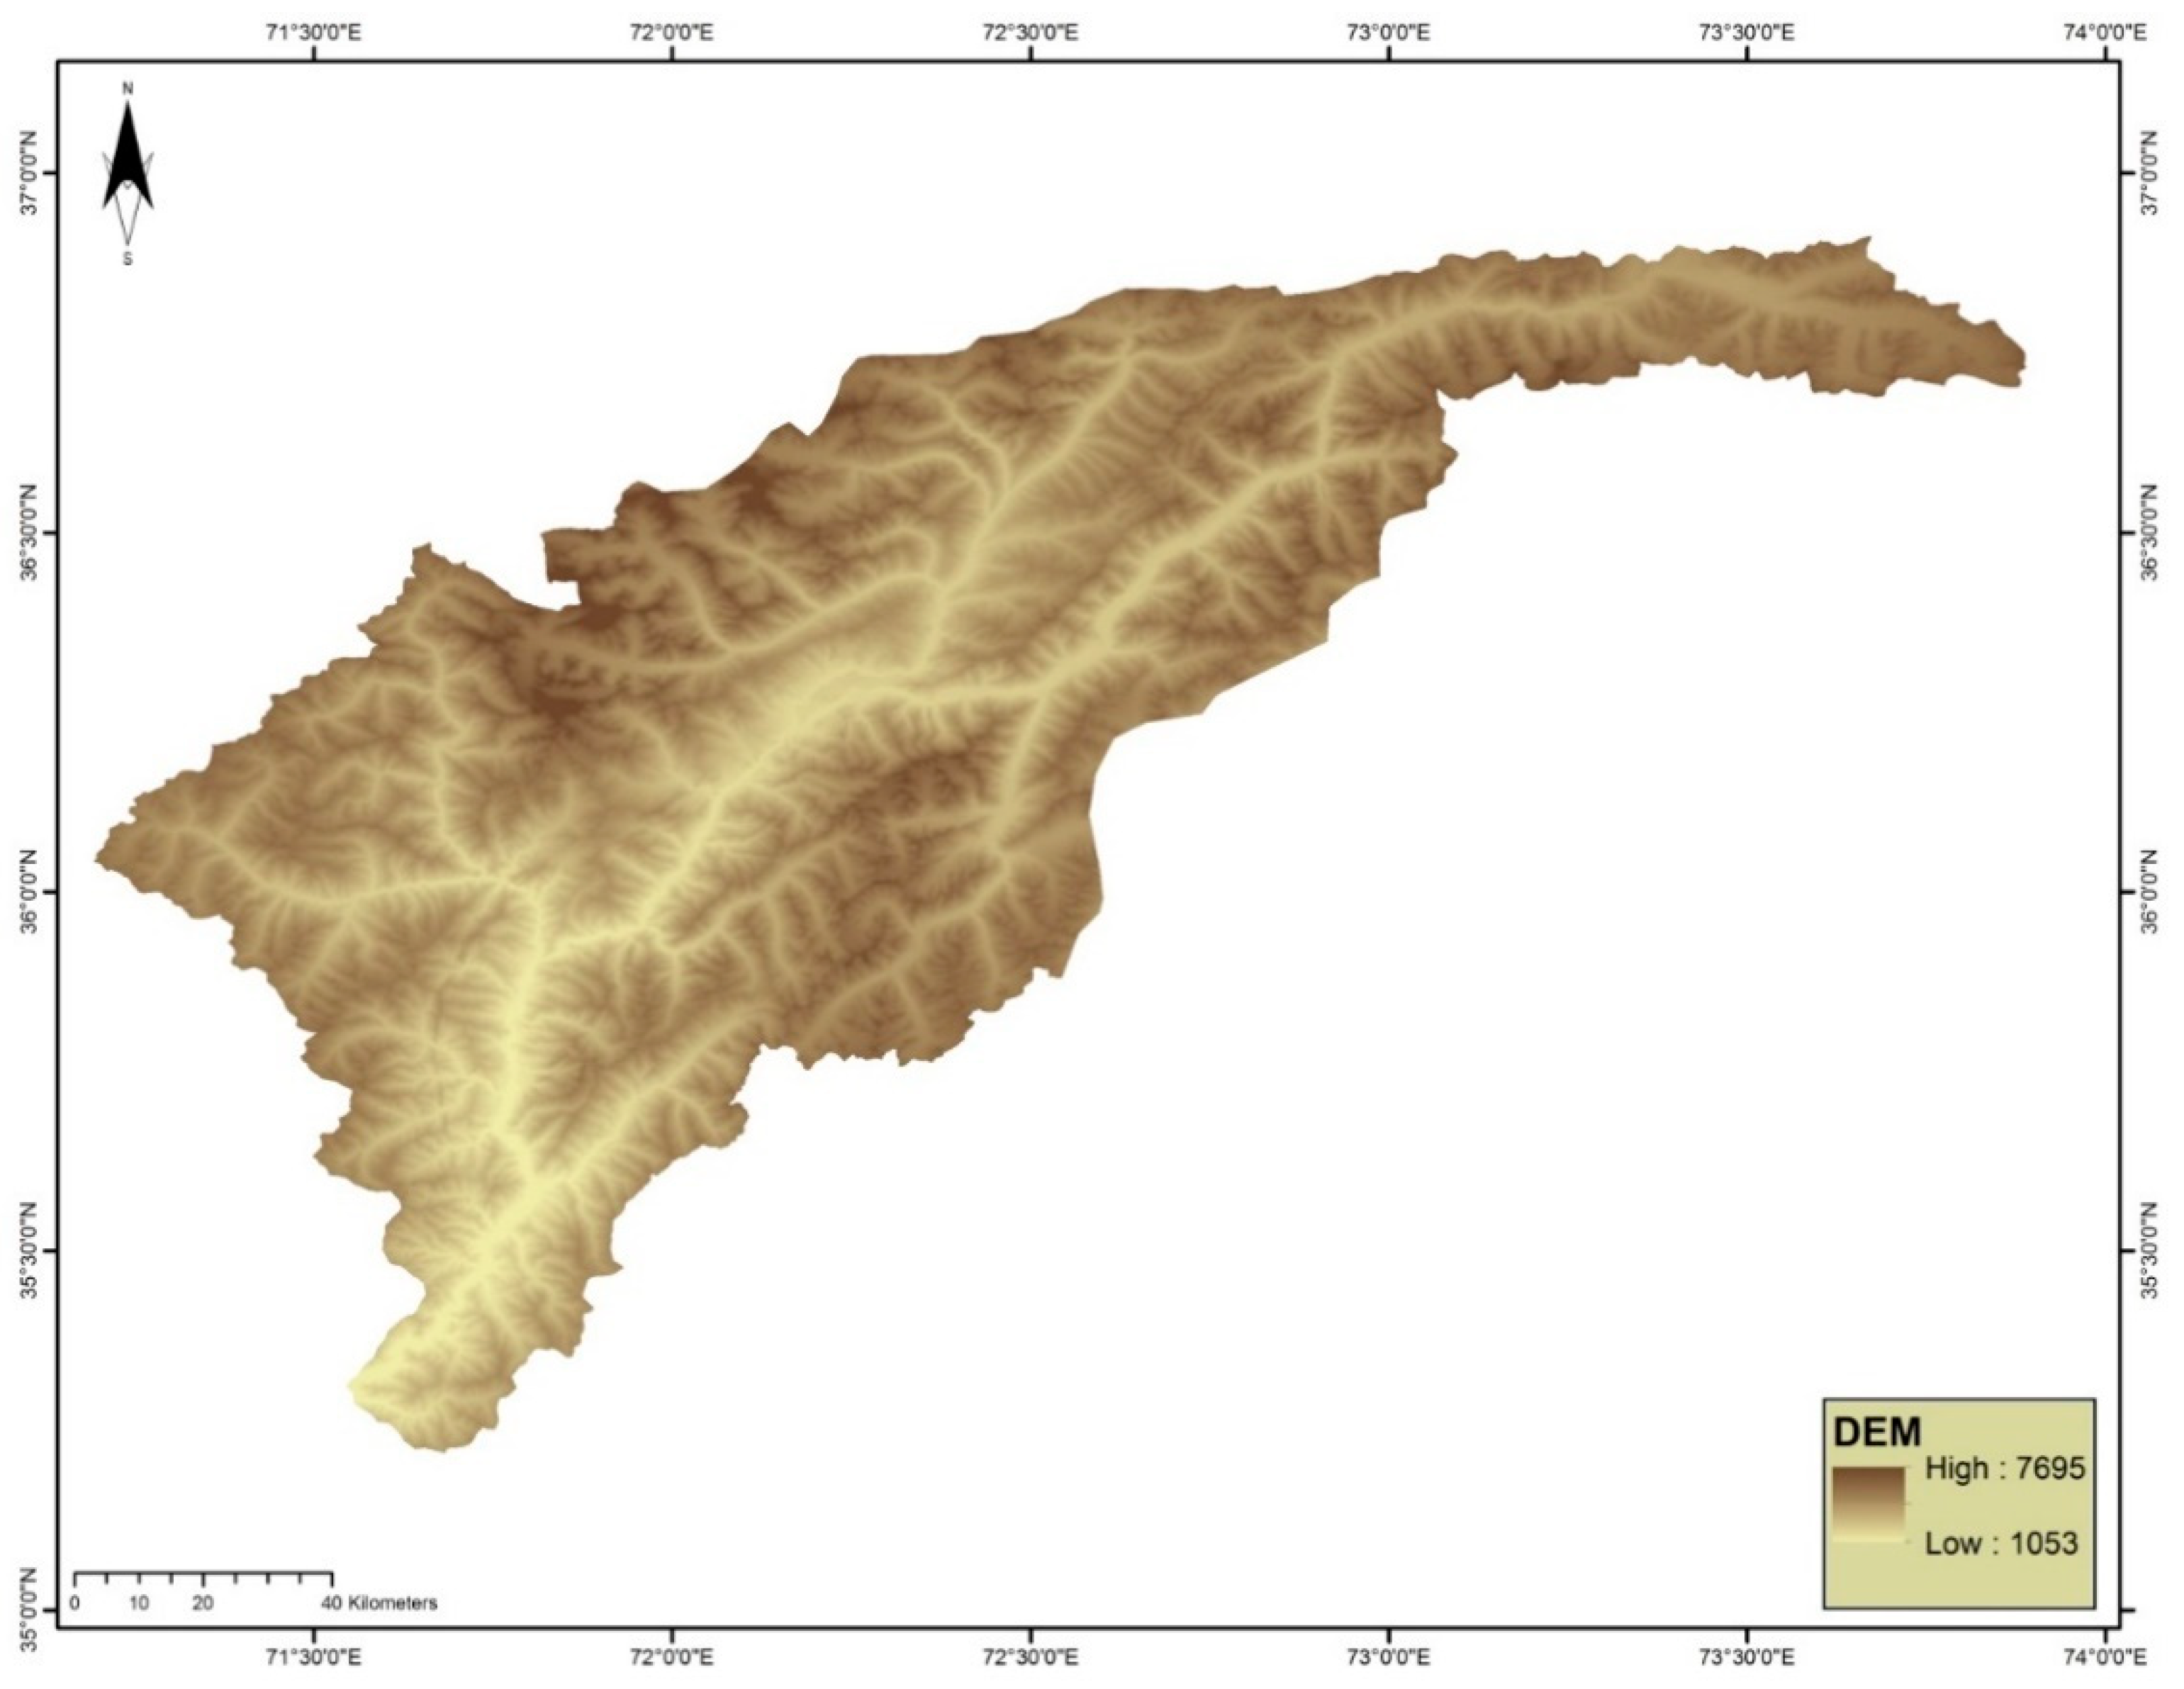
2.1. Study Area
2.2. LULC
2.3. Precipitation
2.4. RUSLE Model
3. Results
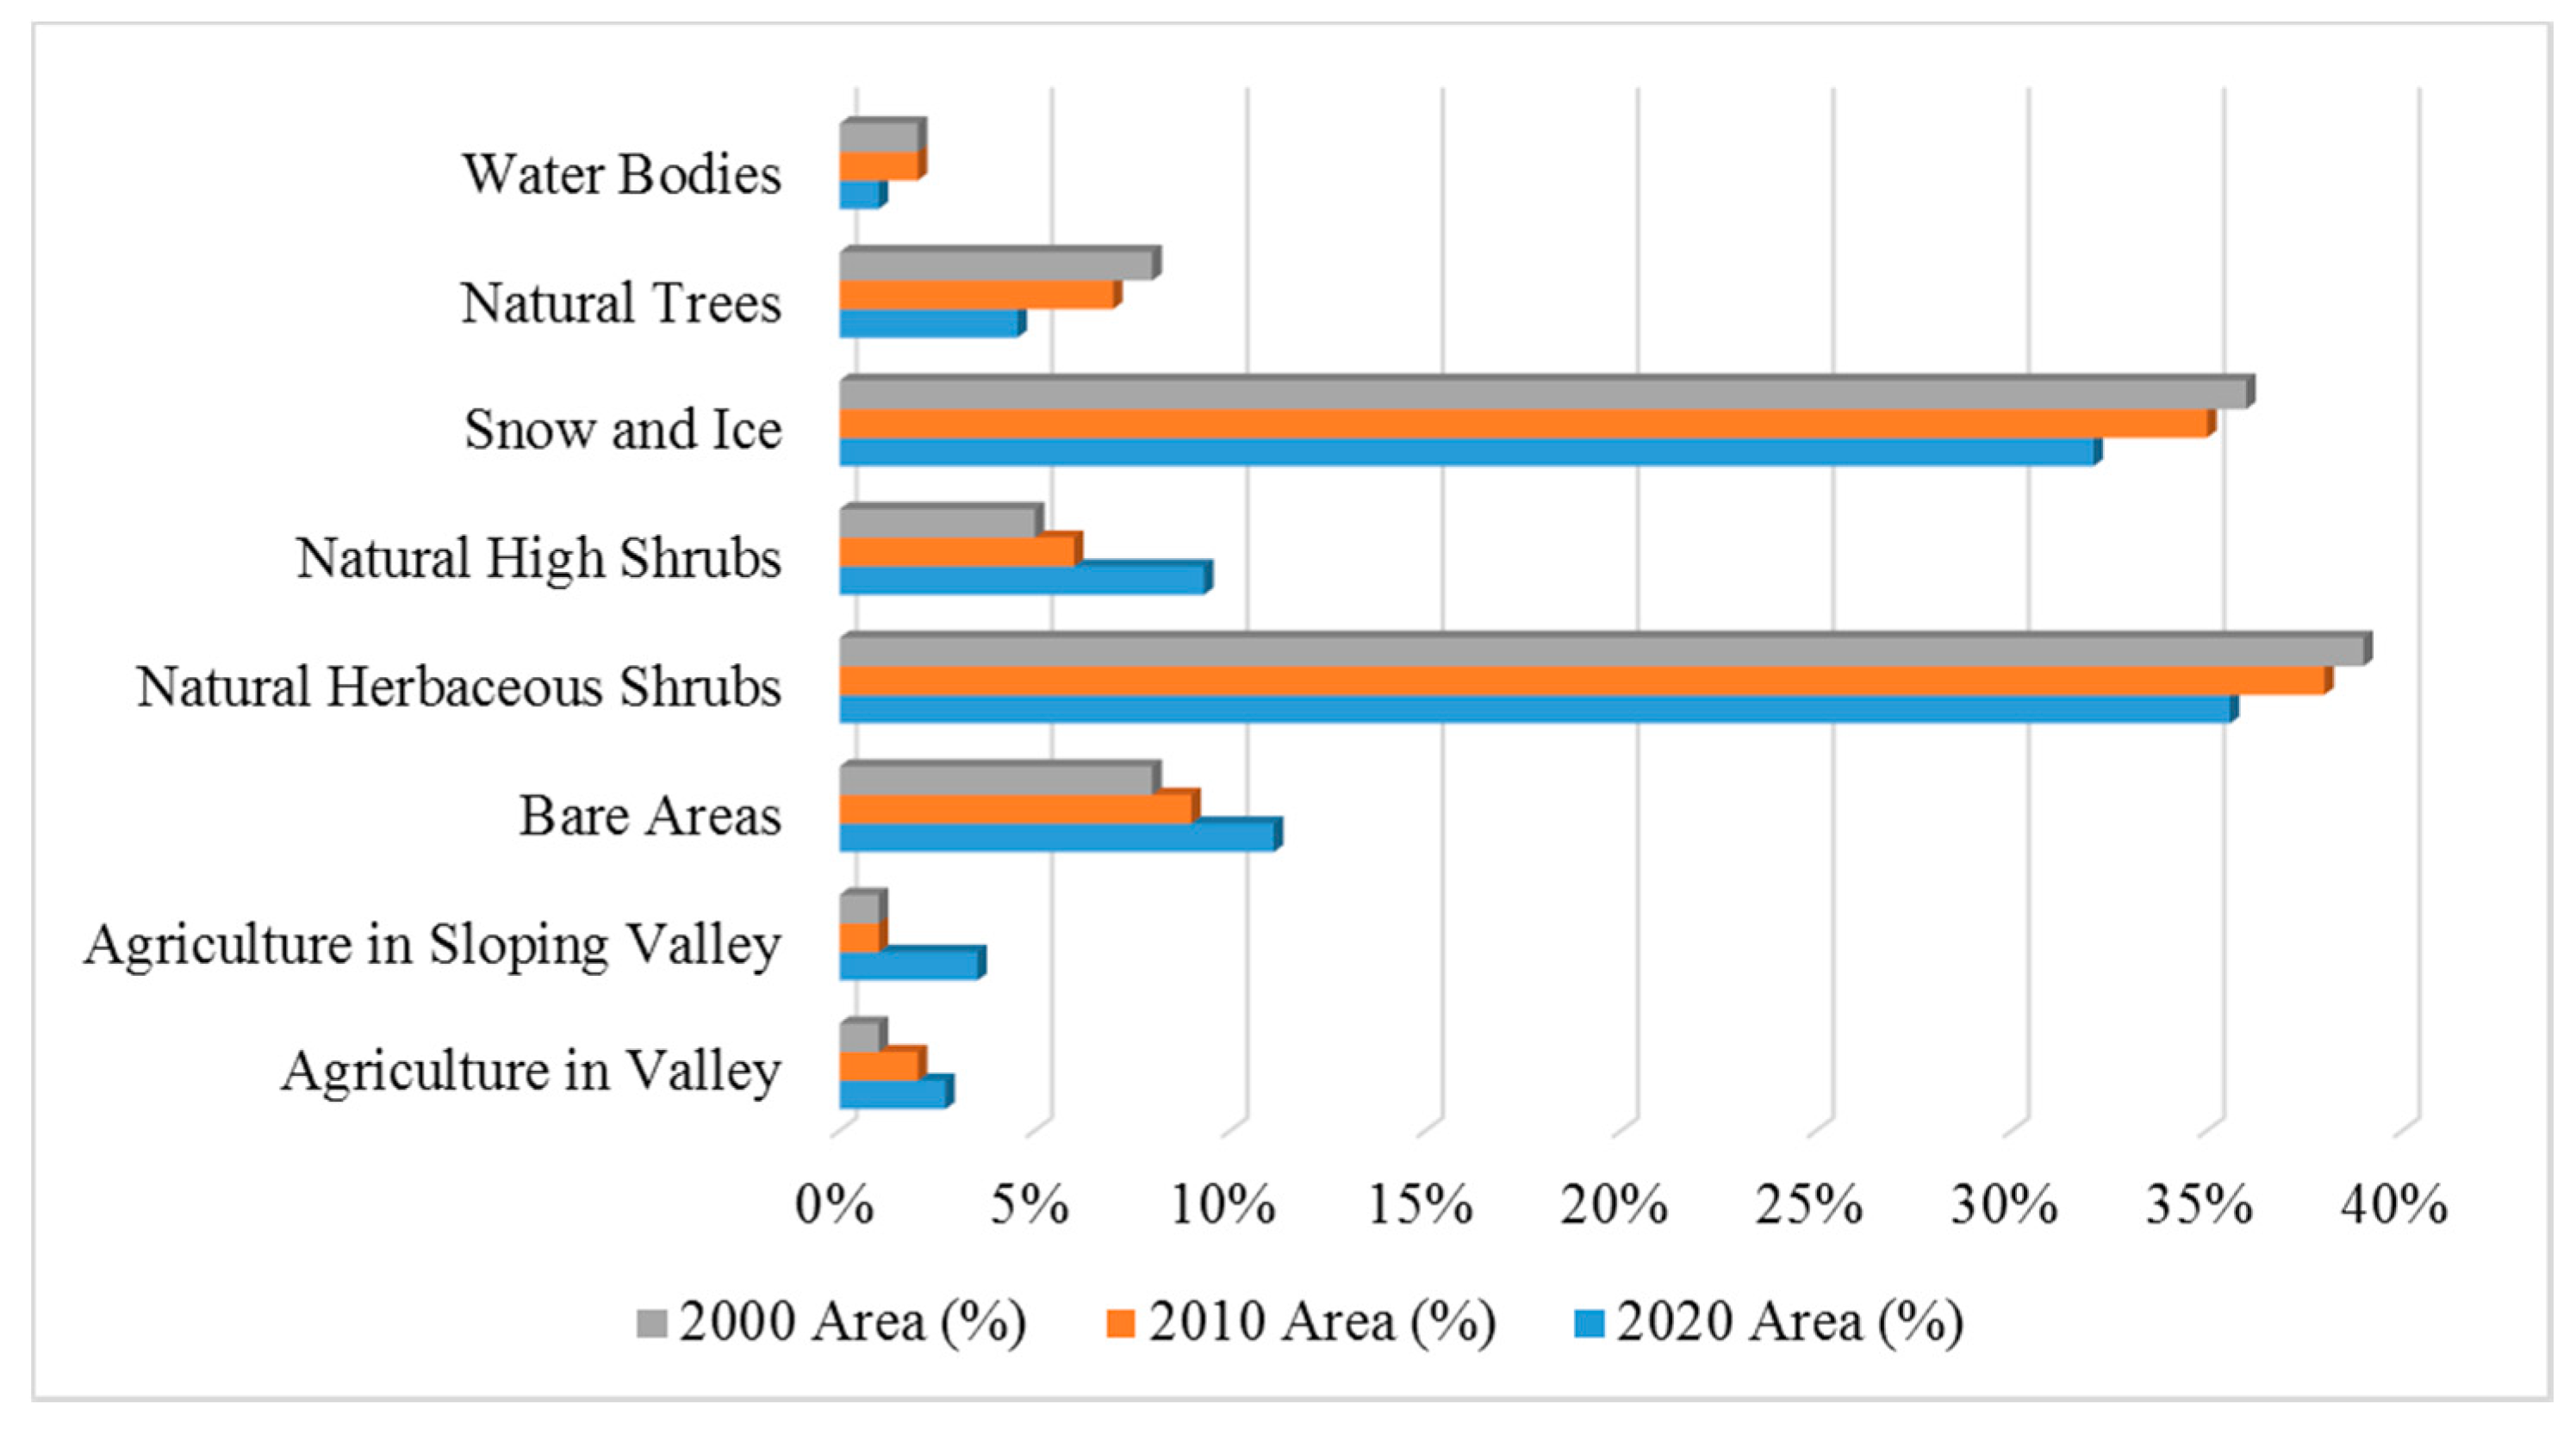
3.1. Dynamics of Land Use Land Cover
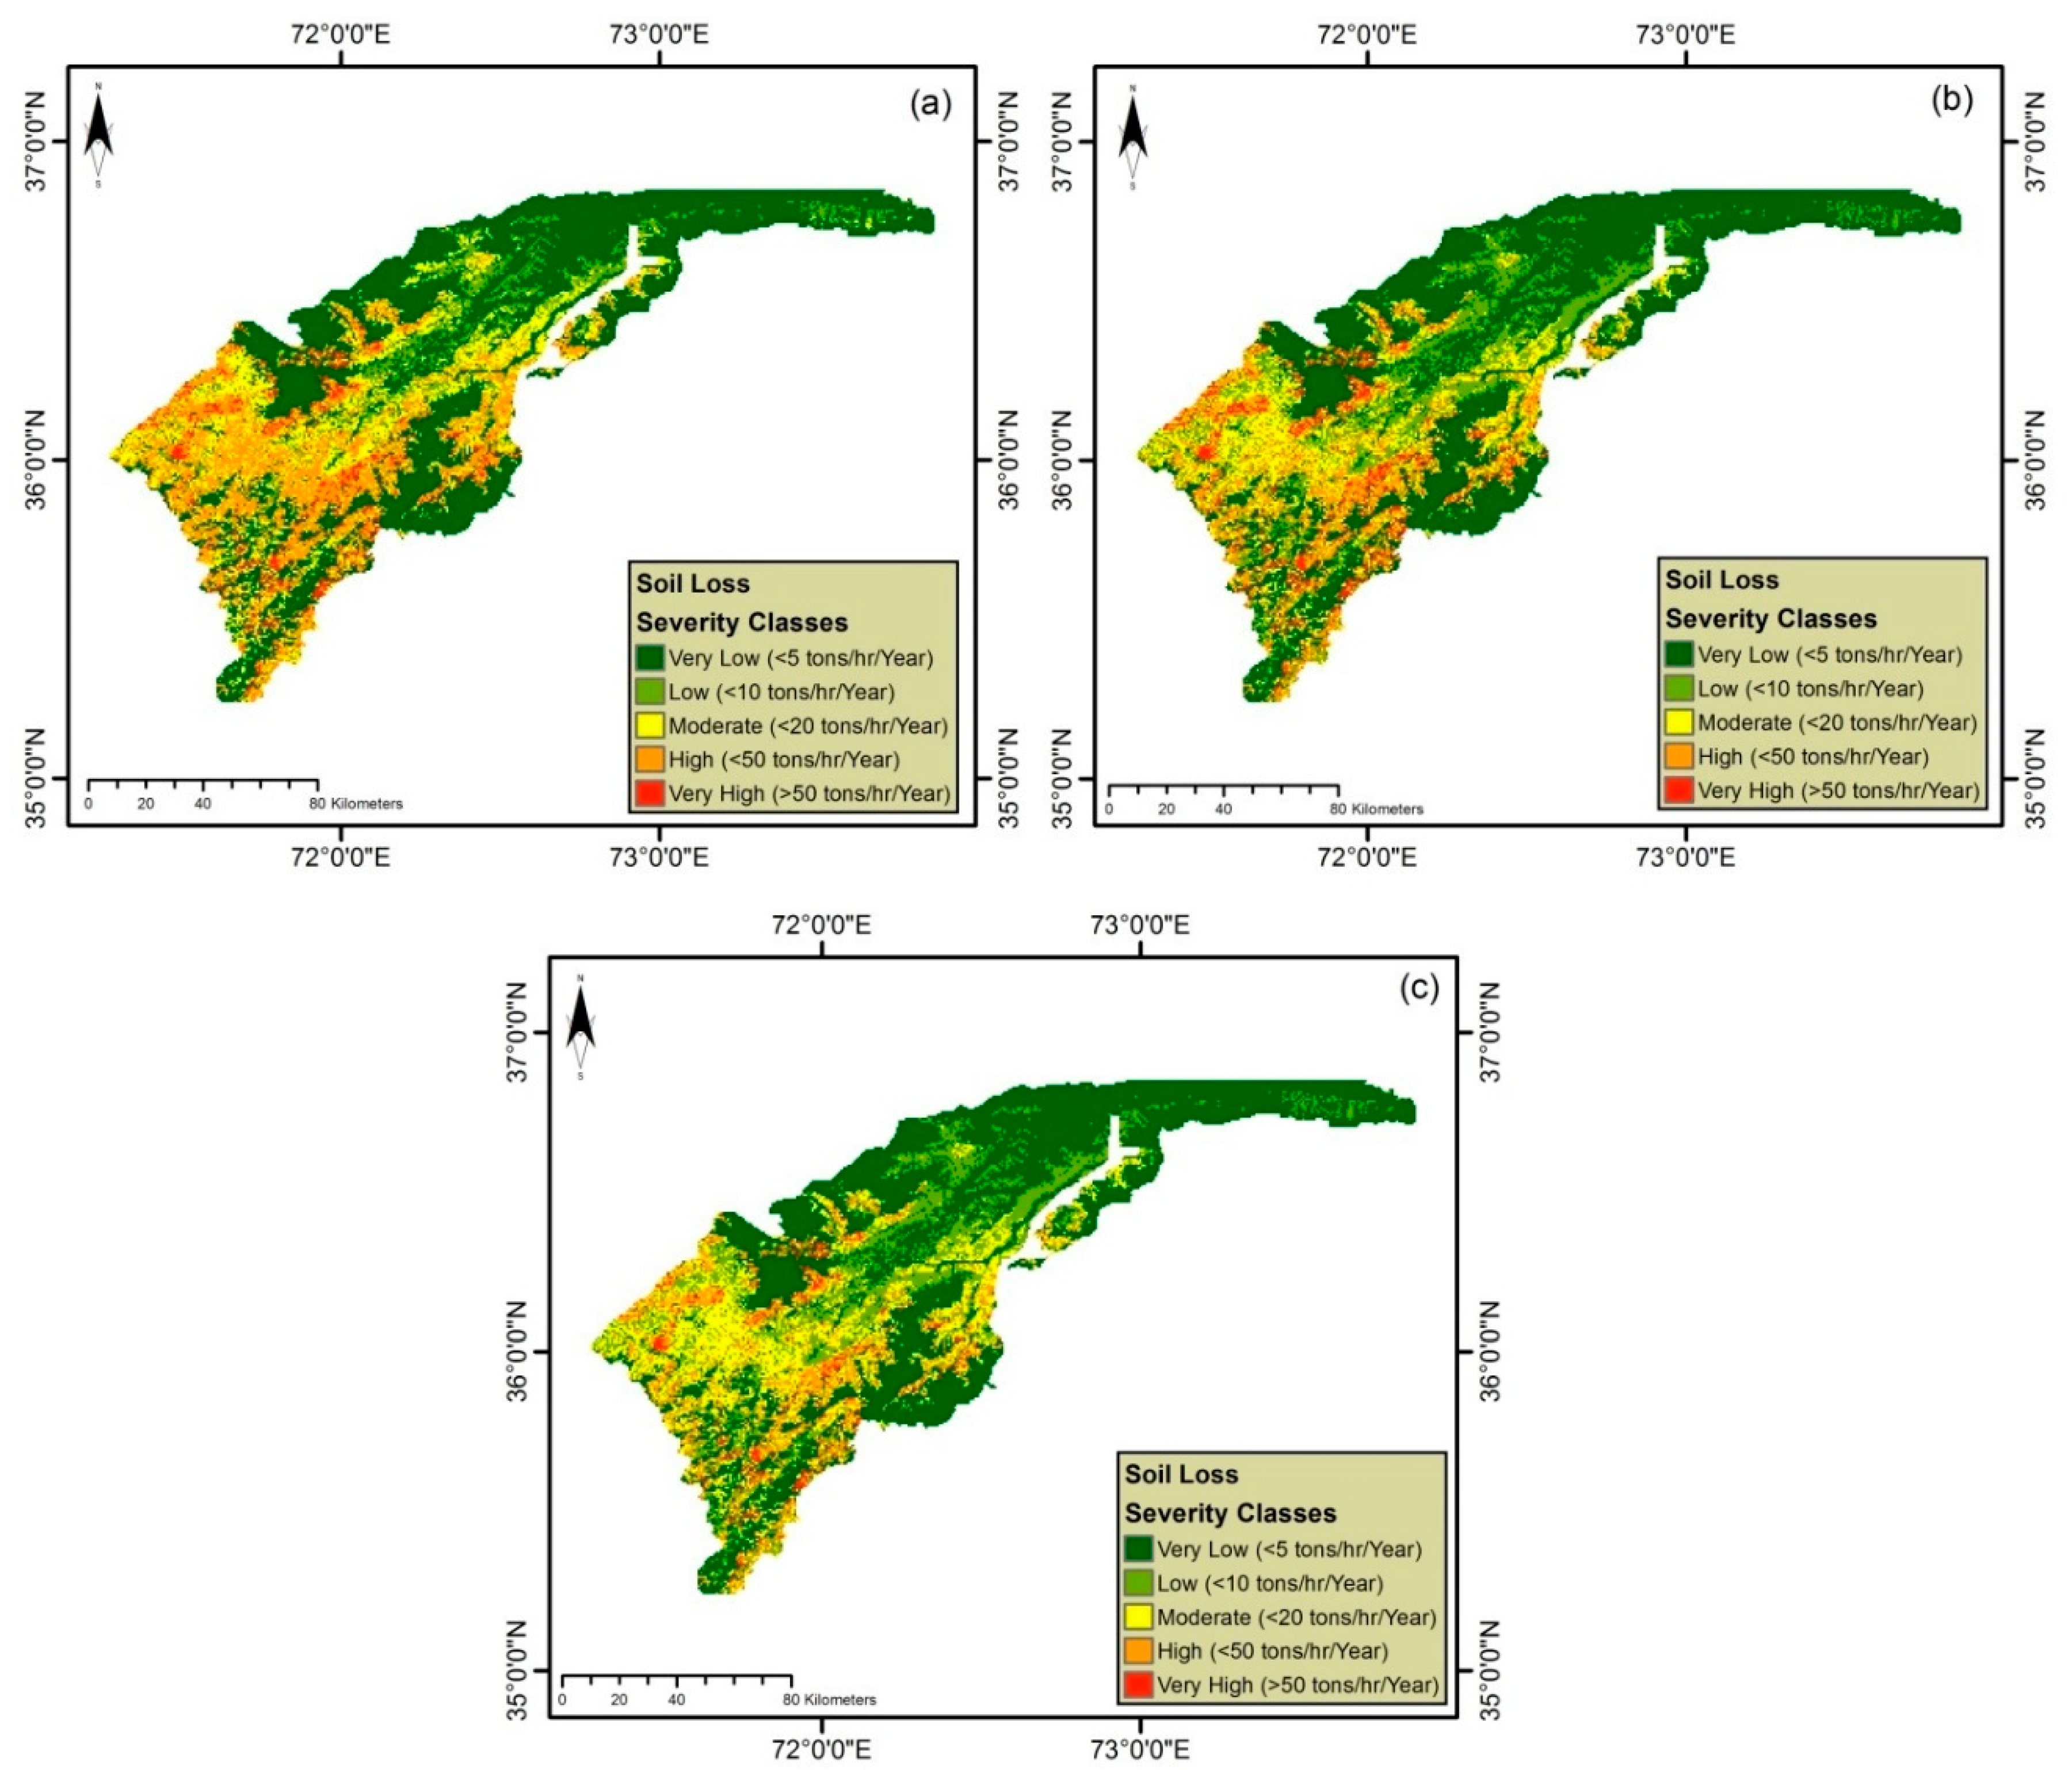
3.2. Estimation of Sediment Yield and Soil Erosion
4. Discussion
5. Conclusions
6. Limitations and Future Studies
Author Contributions
Funding
Conflicts of Interest
References
- Chen, P.; Feng, Z.; Mannan, A.; Chen, S.; Ullah, T. Assessment of Soil Loss from Land Use/Land Cover Change and Disasters in the Longmen Shan Mountains, China. Appl. Ecol. Environ. Res. 2019, 17, 11233–11247. [Google Scholar] [CrossRef]
- Hussnain, M.Q.; Waheed, A.; Wakil, K.; Pettit, C.J.; Hussain, E.; Naeem, M.A.; Anjum, G.A. Shaping up the Future Spatial Plans for Urban Areas in Pakistan. Sustainability 2020, 12, 4216. [Google Scholar] [CrossRef]
- Stock, J.L.; Chusid, J.M. Urbanizing India’s Frontier: Sriganganagar and Canal-Town Planning on the Indus Plains. Plan. Perspect. 2020, 35, 253–276. [Google Scholar] [CrossRef]
- Maqsoom, A.; Aslam, B.; Khalil, U.; Ghorbanzadeh, O.; Ashraf, H.; Tufail, R.F.; Farooq, D.; Blaschke, T. A Gis-Based Drastic Model and an Adjusted Drastic Model (Drastica) for Groundwater Susceptibility Assessment Along the China–Pakistan Economic Corridor (Cpec) Route. ISPRS Int. J. Geo-Inf. 2020, 9, 332. [Google Scholar] [CrossRef]
- Aslam, B.; Ismail, S.; Ali, I. A Gis-Based Drastic Model for Assessing Aquifer Susceptibility of Safdarabad Tehsil, Sheikhupura District, Punjab Province, Pakistan. Model. Earth Syst. Environ. 2020, 1–11. [Google Scholar] [CrossRef]
- Martínez-Mena, M.; Carrillo-López, E.; Boix-Fayos, C.; Almagro, M.; García Franco, N.; Díaz-Pereira, E.; Montoya, I.; de Vente, J. Long-Term Effectiveness of Sustainable Land Management Practices to Control Runoff, Soil Erosion, and Nutrient Loss and the Role of Rainfall Intensity in Mediterranean Rainfed Agroecosystems. Catena 2020, 187, 104352. [Google Scholar] [CrossRef]
- Chuenchum, P.; Xu, M.; Tang, W. Estimation of Soil Erosion and Sediment Yield in the Lancang–Mekong River Using the Modified Revised Universal Soil Loss Equation and GIS Techniques. Water 2020, 12, 135. [Google Scholar] [CrossRef]
- Sharma, A.; Tiwari, K.N.; Bhadoria, P.B.S. Effect of Land Use Land Cover Change on Soil Erosion Potential in an Agricultural Watershed. Environ. Monit. Assess. 2011, 173, 789–801. [Google Scholar] [CrossRef]
- Ouyang, W.; Wu, Y.; Hao, Z.; Zhang, Q.; Bu, Q.; Gao, X. Combined Impacts of Land Use and Soil Property Changes on Soil Erosion in a Mollisol Area under Long-Term Agricultural Development. Sci. Total Environ. 2018, 613, 798–809. [Google Scholar] [CrossRef]
- Wiejaczka, Ł.; Olędzki, J.R.; Bucała-Hrabia, A.; Kijowska-Strugała, M. A Spatial and Temporal Analysis of Land Use Changes in Two Mountain Valleys: With and without Dam Reservoir (Polish Carpathians). Quaest. Geogr. 2017, 36, 129–137. [Google Scholar] [CrossRef]
- Wilbanks, T.J. Socio-Economic Scenario Development for Climate Change Analysis. In CIRED Working Paper DT/WP; CIRED Working Paper DT/WP No. 2010-23; Centre International de Recherche sur l’Environnement et le Développement: Nogent-sur-Marne, France, 2010. [Google Scholar]
- Bucała, A.; Budek, A.; Kozak, M. The Impact of Land Use and Land Cover Changes on Soil Properties and Plant Communities in the Gorce Mountains (Western Polish Carpathians), During the Past 50 Years. Z. Geomorphol. Suppl. Issues 2015, 59, 41–74. [Google Scholar] [CrossRef]
- Nearing, M.; Polyakov, V.O.; Nichols, M.H.; Hernandez, M.; Li, L.; Zhao, Y.; Armendariz, G. Slope–Velocity Equilibrium and Evolution of Surface Roughness on a Stony Hillslope. Hydrol. Earth Syst. Sci. Discuss. 2017, 21, 3221–3229. [Google Scholar] [CrossRef]
- Kijowska-Strugała, M.; Bucała-Hrabia, A.; Demczuk, P. Long-Term Impact of Land Use Changes on Soil Erosion in an Agricultural Catchment (in the Western Polish Carpathians). Land Degrad. Dev. 2018, 29, 1871–1884. [Google Scholar] [CrossRef]
- Buttafuoco, G.; Conforti, M.; Aucelli, P.P.C.; Robustelli, G.; Scarciglia, F. Assessing Spatial Uncertainty in Mapping Soil Erodibility Factor Using Geostatistical Stochastic Simulation. Environ. Earth Sci. 2012, 66, 1111–1125. [Google Scholar] [CrossRef]
- De Moor, J.J.W.; Verstraeten, G. Alluvial and Colluvial Sediment Storage in the Geul River Catchment (the Netherlands)—Combining Field and Modelling Data to Construct a Late Holocene Sediment Budget. Geomorphology 2008, 95, 487–503. [Google Scholar] [CrossRef]
- Adhikary, P.P.; Tiwari, S.P.; Mandal, D.; Lakaria, B.L.; Madhu, M. Geospatial Comparison of Four Models to Predict Soil Erodibility in a Semi-Arid Region of Central India. Environ. Earth Sci. 2014, 72, 5049–5062. [Google Scholar] [CrossRef]
- Botterweg, P.; Leek, R.; Romstad, E.; Vatn, A. The Eurosem-Gridsem Modeling System for Erosion Analyses under Different Natural and Economic Conditions. Ecol. Model. 1998, 108, 115–129. [Google Scholar] [CrossRef]
- Bayat, F.; Monfared, A.B.; Jahansooz, M.R.; Esparza, E.T.; Keshavarzi, A.; Morera, A.G.; Fernández, M.P.; Cerdà, A. Analyzing Long-Term Soil Erosion in a Ridge-Shaped Persimmon Plantation in Eastern Spain by Means of Isum Measurements. Catena 2020, 183, 104176. [Google Scholar] [CrossRef]
- Ganasri, B.P.; Ramesh, H. Assessment of Soil Erosion by Rusle Model Using Remote Sensing and Gis—A Case Study of Nethravathi Basin. Geosci. Front. 2016, 7, 953–961. [Google Scholar] [CrossRef]
- Conforti, M.; Buttafuoco, G. Assessing Space–Time Variations of Denudation Processes and Related Soil Loss from 1955 to 2016 in Southern Italy (Calabria Region). Environ. Earth Sci. 2017, 76, 457. [Google Scholar] [CrossRef]
- Özşahin, E.; Eroğlu, İ. Soil Erosion Risk Assessment Due to Land Use/Land Cover Changes (Lulcc) in Bulgaria from 1990 to 2015. Alinteri J. Agric. Sci. 2019, 34, 1–8. [Google Scholar]
- Guadie, M.; Molla, E.; Mekonnen, M.; Cerdà, A. Effects of Soil Bund and Stone-Faced Soil Bund on Soil Physicochemical Properties and Crop Yield under Rain-Fed Conditions of Northwest Ethiopia. Land 2020, 9, 13. [Google Scholar] [CrossRef]
- Abdulkareem, J.H.; Pradhan, B.; Sulaiman, W.N.A.; Jamil, N.R. Prediction of Spatial Soil Loss Impacted by Long-Term Land-Use/Land-Cover Change in a Tropical Watershed. Geosci. Front. 2019, 10, 389–403. [Google Scholar] [CrossRef]
- Chen, Z.; Wang, L.; Wei, A.; Gao, J.; Lu, Y.; Zhou, J. Land-Use Change from Arable Lands to Orchards Reduced Soil Erosion and Increased Nutrient Loss in a Small Catchment. Sci. Total Environ. 2019, 648, 1097–1104. [Google Scholar] [CrossRef] [PubMed]
- Dissanayake, D.; Morimoto, T.; Ranagalage, M. Accessing the Soil Erosion Rate Based on Rusle Model for Sustainable Land Use Management: A Case Study of the Kotmale Watershed, Sri Lanka. Model. Earth Syst. Environ. 2019, 5, 291–306. [Google Scholar] [CrossRef]
- Yang, Y.; Li, Z.; Li, P.; Ren, Z.; Gao, H.; Wang, T.; Xu, G.; Yu, K.; Shi, P.; Tang, S. Variations in Runoff and Sediment in Watersheds in Loess Regions with Different Geomorphologies and Their Response to Landscape Patterns. Environ. Earth Sci. 2017, 76, 517. [Google Scholar] [CrossRef]
- Latocha, A.; Szymanowski, M.; Jeziorska, J.; Stec, M.; Roszczewska, M. Effects of Land Abandonment and Climate Change on Soil Erosion—An Example from Depopulated Agricultural Lands in the Sudetes Mts., Sw Poland. Catena 2016, 145, 128–141. [Google Scholar] [CrossRef]
- Leh, M.; Bajwa, S.; Chaubey, I. Impact of Land Use Change on Erosion Risk: An Integrated Remote Sensing, Geographic Information System and Modeling Methodology. Land Degrad. Dev. 2013, 24, 409–421. [Google Scholar] [CrossRef]
- Prasannakumar, V.; Vijith, H.; Abinod, S.; Geetha, N. Estimation of Soil Erosion Risk within a Small Mountainous Sub-Watershed in Kerala, India, Using Revised Universal Soil Loss Equation (Rusle) and Geo-Information Technology. Geosci. Front. 2012, 3, 209–215. [Google Scholar] [CrossRef]
- Efthimiou, N.; Lykoudi, E.; Karavitis, C. Soil Erosion Assessment Using the Rusle Model and Gis. Eur. Water 2014, 47, 15–30. [Google Scholar]
- Licznar, P. Prognozowanie Erozyjności Deszczy W Polsce Na Podstawie Miesięcznych Sum Opadów. Arch. Ochr. Środowiska 2004, 30, 29–39. [Google Scholar]
- Ullah, S.; Ali AIqbal, M.; Javid, M.; Imran, M. Geospatial Assessment of Soil Erosion Intensity and Sediment Yield: A Case Study of Potohar Region, Pakistan. Environ. Earth Sci. 2018, 77, 705. [Google Scholar] [CrossRef]
- Samie, A.; Abbas, A.; Azeem, M.M.; Hamid, S.; Iqbal, M.A.; Hasan, S.S.; Deng, X. Examining the Impacts of Future Land Use/Land Cover Changes on Climate in Punjab Province, Pakistan: Implications for Environmental Sustainability and Economic Growth. Environ. Sci. Pollut. Res. 2020, 27, 25415–25433. [Google Scholar] [CrossRef] [PubMed]
- Drzewiecki, W.; Wężyk, P.; Pierzchalski, M.; Szafrańska, B. Quantitative and Qualitative Assessment of Soil Erosion Risk in Małopolska (Poland), Supported by an Object-Based Analysis of High-Resolution Satellite Images. Pure Appl. Geophys. 2014, 171, 867–895. [Google Scholar] [CrossRef]
- Maqsoom, A.; Aslam, B.; Hassan, U.; Kazmi, Z.A.; Sodangi, M.; Tufail, R.F.; Farooq, D. Geospatial Assessment of Soil Erosion Intensity and Sediment Yield Using the Revised Universal Soil Loss Equation (Rusle) Model. ISPRS Int. J. Geo-Inf. 2020, 9, 356. [Google Scholar] [CrossRef]
- Mitasova, H.; Mitas, L.; Brown, W.M.; Johnston, D.M. Terrain Modeling and Soil Erosion Simulations for Fort Hood and Fort Polk Test Areas; Report for US Army Construction Engineering Research Laboratory, Geographic Modeling and Systems Laboratory; University of Illinois at Urbana-Champaign: Urbana, IL, USA, 1999. [Google Scholar]
- Mancino, G.; Nolè, A.; Salvati, L.; Ferrara, A. In-between Forest Expansion and Cropland Decline: A Revised Usle Model for Soil Erosion Risk under Land-Use Change in a Mediterranean Region. Ecol. Indic. 2016, 71, 544–550. [Google Scholar] [CrossRef]
- Vickers, N.J. Animal Communication: When I’m Calling You, Will You Answer Too? Curr. Biol. 2017, 27, 713–715. [Google Scholar] [CrossRef]
- Panagos, P.; Borrelli, P.; Meusburger, K.; van der Zanden, E.H.; Poesen, J.; Alewell, C. Modelling the Effect of Support Practices (P-Factor) on the Reduction of Soil Erosion by Water at European Scale. Environ. Sci. Policy 2015, 51, 23–34. [Google Scholar] [CrossRef]
- Singh, G.; Babu, R.; Narain, P.; Bhushan, L.S.; Abrol, I.P. Soil Erosion Rates in India. J. Soil Water Conserv. 1992, 47, 97–99. [Google Scholar]
- Mahmood, A.; Oweis, T.; Ashraf, M.; Aftab, M.; Khan Aadal, N.; Ahmad, I.; Sajjad, M.R.; Majid, A. Improving Land and Water Produc Vi Es in the Dhrabi Watershed. In Assessments and Options for Improved Productivity and Sustainability of Natural Resources in Dhrabi Watershed, Pakistan; ICARDA: Aleppo, Syria, 2012; p. 27. [Google Scholar]
- Directorate for Food, Agriculture, Fisheries Development; Policies and Environment Division. Environmental Indicators for Agriculture: Methods and Results: Executive Summary: [Agriculture and Food]; OECD: Paris, France, 2000; Volume 3.
- Farhan, Y.; Nawaiseh, S. Spatial Assessment of Soil Erosion Risk Using Rusle and Gis Techniques. Environ. Earth Sci. 2015, 74, 4649–4669. [Google Scholar] [CrossRef]
- Nasir, A.; Uchida, K.; Ashraf, M. Estimation of Soil Erosion by Using Rusle and Gis for Small Mountainous Watersheds in Pakistan. Pak. J. Water Resour. 2006, 10, 11–21. [Google Scholar]
- Bashir, S.; Baig, M.A.; Ashraf, M.; Anwar, M.M.; Bhalli, M.N.; Munawar, S. Risk Assessment of Soil Erosion in Rawal Watershed Using Geoinformatics Techniques. Sci. Int. 2013, 25, 583–588. [Google Scholar]
- Alkharabsheh, M.M.; Alexandridis, T.K.; Bilas, G.; Misopolinos, N.; Silleos, N. Impact of Land Cover Change on Soil Erosion Hazard in Northern Jordan Using Remote Sensing and Gis. Procedia Environ. Sci. 2013, 19, 912–921. [Google Scholar] [CrossRef]
- Keesstra, S.; Mol, G.; Leeuw, J.D.; Okx, J.; Cleen, M.D.; Visser, S. Soil-Related Sustainable Development Goals: Four Concepts to Make Land Degradation Neutrality and Restoration Work. Land 2018, 7, 133. [Google Scholar] [CrossRef]
- Keesstra, S.D.; Bouma, J.; Wallinga, J.; Tittonell, P.; Smith, P.; Cerdà, A.; Montanarella, L.; Quinton, J.N.; Pachepsky, Y.; Putten, W.H.V.D. The Significance of Soils and Soil Science towards Realization of the United Nations Sustainable Development Goals. Soil 2016, 2, 111–128. [Google Scholar] [CrossRef]
- Visser, S.; Keesstra, S.; Maas, G.; Cleen, M.D. Soil as a Basis to Create Enabling Conditions for Transitions Towards Sustainable Land Management as a Key to Achieve the Sdgs by 2030. Sustainability 2019, 11, 6792. [Google Scholar] [CrossRef]
- Rodrigo-Comino, J.; Senciales, J.M.; Bolinches, A.C.; Brevik, E.C. The Multidisciplinary Origin of Soil Geography: A Review. Earth-Sci. Rev. 2018, 177, 114–123. [Google Scholar] [CrossRef]
- Li, L.; Wang, V.; Liu, C. Effects of Land Use Changes on Soil Erosion in a Fast Developing Area. Int. J. Environ. Sci. Technol. 2014, 11, 1549–1562. [Google Scholar] [CrossRef]
- Schneider, S.H. The Greenhouse Effect: Science and Policy. Science 1989, 243, 771–781. [Google Scholar] [CrossRef]
- Schneider, A. Monitoring Land Cover Change in Urban and Peri-Urban Areas Using Dense Time Stacks of Landsat Satellite Data and a Data Mining Approach. Remote Sens. Environ. 2012, 124, 689–704. [Google Scholar] [CrossRef]
- Święchowicz, J. Spłukiwanie Gleby Na Użytkowanych Rolniczo Stokach Pogórskich W Latach Hydrologicznych 2007–2008 W Łazach (Pogórze Wiśnickie). Prace i Studia Geogr. 2010, 45, 243–263. [Google Scholar]
- Swięchowicz, J. Water Erosion on Agricultural Foothill Slopes (Carpathian Foothills, Poland). Z. Geomorphol. Suppl. Issues 2012, 56, 21–35. [Google Scholar] [CrossRef]
- Nowak, A.; Tokarczyk, N. Evaluation of Soil Resilience to Anthropopressure in Łosie Village (Lower Beskids Mts)–Preliminary Results. Ekológia (Bratislava) 2013, 32, 138–147. [Google Scholar] [CrossRef]
- Froehlich, W. Natezenie Erozji Gleb Na Stokach Beskidzkich W Swietle Badan Metodami Klasycznymi I Radioizotypowymi. Zeszyty Naukowe Akademii Rolniczej w Krakowie. Sesja Naukowa 1997, 48, 35–46. [Google Scholar]
- Froehlich, W. Importance of Splash in Erosion Process within a Small Flysch Catchment Basin. Stud. Geomorphol. Carpatho-Balcanica 1980, 14, 77–112. [Google Scholar]
- Higgitt, D.L.; Froehlich, W.; Walling, D.E. Applications and Limitations of Chernobyl Radiocaesium Measurements in a Carpathian Erosion Investigation, Poland. Land Degrad. Dev. 1992, 3, 15–26. [Google Scholar] [CrossRef]
- Bochenek, W.; Gil, E. Zróżnicowanie Spływu Powierzchniowego I Spłukiwania Gleby Na Poletkach Doświadczalnych O Różnej Długości (Szymbark, Beskid Niski). Prace i Studia Geograficzne 2010, 45, 265–278. [Google Scholar]
- Demczuk, P.; Gil, E. The Application of the Usle Model in the Automatic Mapping of Soil Erosion in the Bystrzanka Catchment (Flysh Carpathian). Quaest. Geogr. 2009, 28, 2. [Google Scholar]
- Kijowska-Strugała, M. Transport Zawiesiny W Warunkach Zmieniającej Się Antropopresji W Zlewni Bystrzanki (Karpaty Fliszowe); IGiPZ PAN: Warszawa, Poland, 2015; Volume 247. [Google Scholar]
- Kijowska-Strugala, M.; Demczuk, V. Impact of Land Use Changes on Soil Erosion and Deposition in a Small Polish Carpathians Catchment in Last 40 Years. Carpathian J. Earth Environ. Sci. 2015, 10, 261–270. [Google Scholar]


| Land Use Classes | 2020 | 2010 | 2000 | |||
|---|---|---|---|---|---|---|
| Class Accuracy (%) | Overall Accuracy (%) and Kappa Coefficient | Class Accuracy (%) | Overall Accuracy (%) and Kappa Coefficient | Class Accuracy (%) | Overall Accuracy (%) and Kappa Coefficient | |
| Agriculture in Valley | 88 | 84% and 0.82 | 86 | 81% and 0.8 | 85 | 79% and 0.77 |
| Agriculture in Sloping Valley | 78 | 76 | 76 | |||
| Bare Areas | 89 | 87 | 84 | |||
| Natural Herbaceous Shrubs | 82 | 80 | 79 | |||
| Natural High Shrubs | 80 | 78 | 79 | |||
| Snow and Ice | 82 | 77 | 73 | |||
| Natural Trees | 79 | 78 | 77 | |||
| Water Bodies | 91 | 87 | 84 | |||
| Land Use Classes | 2020 | 2010 | 2000 | |||
|---|---|---|---|---|---|---|
| Area (Ha) | Area (%) | Area (Ha) | Area (%) | Area (Ha) | Area (%) | |
| Agriculture in Valley | 39,234.5 | 3% | 28,982.4 | 2% | 14,491.2 | 1% |
| Agriculture in Sloping Valley | 51,107.9 | 4% | 14,491.2 | 1% | 14,491.2 | 1% |
| Bare Areas | 161,053.9 | 11% | 130,420.9 | 9% | 115,929.7 | 8% |
| Natural Herbaceous Shrubs | 515,637.5 | 36% | 550,665.9 | 38% | 565,157.2 | 39% |
| Natural High Shrubs | 135,184.6 | 9% | 86,947.2 | 6% | 72,456.1 | 5% |
| Snow and Ice | 465,076.1 | 32% | 507,192.2 | 35% | 521,683.6 | 36% |
| Natural Trees | 80,471.7 | 5% | 101,438.4 | 7% | 115,929.7 | 8% |
| Water Bodies | 1354.4 | 1% | 28,982.4 | 2% | 28,982.4 | 2% |
| Total | 1,449,120.7 | 100% | 1,449,120.7 | 100% | 1,449,121 | 100% |
| Land Use Classes | Soil Erosion Year | Statistics (All Units in tons/ha/year) | |||
|---|---|---|---|---|---|
| Mean | Min | Max | STD | ||
| Agriculture in Valley | 2020 | 144.09 | 5.97 | 1578.242 | 203.87 |
| 2010 | 122.66 | 4.21 | 1464.702 | 173.43 | |
| 2000 | 111.14 | 3.57 | 1370.052 | 143.54 | |
| Agriculture in Sloping Valley | 2020 | 198.9 | 6.45 | 5681.93 | 562.02 |
| 2010 | 155.25 | 4.91 | 5242.39 | 513.59 | |
| 2000 | 123.57 | 4.48 | 4865.9 | 468.21 | |
| Bare Areas | 2020 | 177.04 | 5.03 | 5467.25 | 461.49 |
| 2010 | 164.5 | 4.57 | 4963.82 | 414.54 | |
| 2000 | 152.15 | 4.12 | 4531.28 | 398.43 | |
| Natural Herbaceous Shrubs | 2020 | 593.53 | 5.44 | 158,647.45 | 7067.94 |
| 2010 | 605.96 | 5.87 | 159,302.21 | 6746.44 | |
| 2000 | 611.4 | 6.12 | 159,623.75 | 6783.98 | |
| Natural High Shrubs | 2020 | 116.32 | 5.64 | 8421.65 | 403.38 |
| 2010 | 104.89 | 4.32 | 7988.97 | 367.45 | |
| 2000 | 103.57 | 4.22 | 7701.54 | 313.54 | |
| Snow and Ice | 2020 | 1276.08 | 5.4 | 335,719.74 | 15,947.62 |
| 2010 | 1152.43 | 4.99 | 334,365.09 | 15,562.19 | |
| 2000 | 1033.03 | 4.53 | 333,126.55 | 14,907.43 | |
| Natural Trees | 2020 | 124.84 | 6.173 | 4767.86 | 286.48 |
| 2010 | 115.44 | 5.54 | 4511.21 | 234.65 | |
| 2000 | 112.01 | 5.12 | 4186.56 | 212.47 | |
| Water Bodies | 2020 | 70.23 | 5.64 | 377.412 | 85.31 |
| 2010 | 63.8 | 4.65 | 361.982 | 73.54 | |
| 2000 | 59.17 | 4.13 | 340.552 | 63.56 | |
| Land Use Classes | Soil Erosion Year | Soil Loss Class (%) | ||||
|---|---|---|---|---|---|---|
| Very Low | Low | Moderate | High | Very High | ||
| Agriculture in Valley | 2020 | 41 | 16 | 17 | 19 | 7 |
| 2010 | 38 | 23 | 29 | 6 | 4 | |
| 2000 | 32 | 26 | 31 | 7 | 4 | |
| Agriculture in Sloping Valley | 2020 | 51 | 21 | 17 | 9 | 2 |
| 2010 | 47 | 20 | 20 | 11 | 2 | |
| 2000 | 41 | 19 | 24 | 13 | 3 | |
| Bare Areas | 2020 | 7 | 18 | 26 | 35 | 14 |
| 2010 | 18 | 22 | 24 | 27 | 9 | |
| 2000 | 21 | 23 | 26 | 23 | 7 | |
| Natural Herbaceous Shrubs | 2020 | 39 | 18 | 21 | 11 | 11 |
| 2010 | 41 | 23 | 30 | 4 | 2 | |
| 2000 | 40 | 31 | 20 | 5 | 4 | |
| Natural High Shrubs | 2020 | 50 | 22 | 17 | 9 | 2 |
| 2010 | 53 | 20 | 15 | 10 | 2 | |
| 2000 | 51 | 19 | 17 | 10 | 3 | |
| Snow and Ice | 2020 | 61 | 26 | 7 | 5 | 1 |
| 2010 | 57 | 21 | 12 | 6 | 4 | |
| 2000 | 60 | 25 | 8 | 5 | 2 | |
| Natural Trees | 2020 | 39 | 18 | 21 | 11 | 11 |
| 2010 | 41 | 23 | 30 | 4 | 2 | |
| 2000 | 40 | 31 | 20 | 5 | 4 | |
| Water Bodies | 2020 | 61 | 26 | 7 | 5 | 1 |
| 2010 | 57 | 31 | 7 | 4 | 1 | |
| 2000 | 60 | 25 | 8 | 5 | 2 | |
| Soil Erosion Severity Class | Soil Loss (tons/ha/year) | 2020 | 2010 | 2000 | |||
|---|---|---|---|---|---|---|---|
| Total Area (ha) | Area (%) | Total Area (ha) | Area (%) | Total Area (ha) | Area (%) | ||
| Very Low | <5 | 623,122 | 43% | 536,175 | 37% | 521,684 | 36% |
| Low | 5–10 | 173,895 | 12% | 275,333 | 19% | 333,298 | 23% |
| Moderate | 10–20 | 304,315 | 21% | 362,280 | 25% | 362,280 | 25% |
| High | 20–50 | 231,859 | 16% | 202,877 | 14% | 173,895 | 12% |
| Very High | >50 | 115,930 | 8% | 724,56 | 5% | 579,65 | 4% |
| Total | 1,449,121 | 100% | 1,449,121 | 100% | 1,449,121 | 100% | |
© 2020 by the authors. Licensee MDPI, Basel, Switzerland. This article is an open access article distributed under the terms and conditions of the Creative Commons Attribution (CC BY) license (http://creativecommons.org/licenses/by/4.0/).
Share and Cite
Aslam, B.; Maqsoom, A.; Shahzaib; Kazmi, Z.A.; Sodangi, M.; Anwar, F.; Bakri, M.H.; Faisal Tufail, R.; Farooq, D. Effects of Landscape Changes on Soil Erosion in the Built Environment: Application of Geospatial-Based RUSLE Technique. Sustainability 2020, 12, 5898. https://doi.org/10.3390/su12155898
Aslam B, Maqsoom A, Shahzaib, Kazmi ZA, Sodangi M, Anwar F, Bakri MH, Faisal Tufail R, Farooq D. Effects of Landscape Changes on Soil Erosion in the Built Environment: Application of Geospatial-Based RUSLE Technique. Sustainability. 2020; 12(15):5898. https://doi.org/10.3390/su12155898
Chicago/Turabian StyleAslam, Bilal, Ahsen Maqsoom, Shahzaib, Zaheer Abbas Kazmi, Mahmoud Sodangi, Fahad Anwar, Muhammad Hassan Bakri, Rana Faisal Tufail, and Danish Farooq. 2020. "Effects of Landscape Changes on Soil Erosion in the Built Environment: Application of Geospatial-Based RUSLE Technique" Sustainability 12, no. 15: 5898. https://doi.org/10.3390/su12155898
APA StyleAslam, B., Maqsoom, A., Shahzaib, Kazmi, Z. A., Sodangi, M., Anwar, F., Bakri, M. H., Faisal Tufail, R., & Farooq, D. (2020). Effects of Landscape Changes on Soil Erosion in the Built Environment: Application of Geospatial-Based RUSLE Technique. Sustainability, 12(15), 5898. https://doi.org/10.3390/su12155898