Article

Control of Metro Train-Induced Vibrations in a Laboratory Using Periodic Piles

1
Key Laboratory of Urban Underground Engineering of Ministry of Education, Beijing Jiaotong University, Beijing 100044, China
2
School of Civil Engineering, Beijing Jiaotong University, Beijing 100044, China
3
Rail Transit Digital Construction and Measurement Technology National Engineering Laboratory, China Railway Design Corporation, Tianjin 300308, China
*
Author to whom correspondence should be addressed.
Sustainability 2020, 12(14), 5871; https://doi.org/10.3390/su12145871
Submission received: 30 June 2020 / Revised: 16 July 2020 / Accepted: 20 July 2020 / Published: 21 July 2020

Abstract

:
Laboratories with sensitive instruments need a low-vibration environment. It is a challenge to control the train-induced vibration impact on these instruments when a newly planned metro line is adjacent to a laboratory building. An alternative method of mitigating train-induced ground vibrations involves installing measures along the transmission path. Recent research has highlighted the potential of periodic pile barriers with specifically designed band gaps for controlling environmental vibrations. This study performed in-situ measurements of ambient vibrations inside and outside a laboratory containing various types of sensitive instruments and located adjacent to a newly designed metro line. The vibration transfer function of the laboratory was then obtained. To help design and optimize the band gaps of periodic piles, a novel band gap performance evaluation function was proposed. Finally, numerical analysis was conducted to validate the mitigation effect of the designed periodic piles. The results showed that the band gap performance evaluation function can be used to optimize the mitigation effect of periodic piles. The proposed periodic piles clearly attenuated vibrations between 52.4 and 74.3 Hz, especially those at 63 Hz. A comparison of general vibration criteria (VC) curves revealed that vibration attenuation of one level can be obtained by the designed periodic piles.

1. Introduction

In recent years, the problem of train-induced vibrations have been paid increasing attention due to its potential impacts on the comfort of nearby residents [1,2], the long-term protection of historic buildings [3,4], and the operation of precision instruments [5,6]. For laboratories containing sensitive equipment such as high sensitivity weighing equipment, electronic microscopes, and magnetic resonance imaging instruments, controlling vibrations induced by rail and road traffic is a challenging issue. Previous studies have reported this problem; for example, Wolf [7] introduced a case study of the United States, where the planned Sound Transit Link Light Rail system was due to pass through the University of Washington. In Taiwan, the bullet train was designed to pass through Tainan Industrial Science Park [8]; as such, a honeycomb wave impeding barrier (WIB) was proposed to mitigate the resulting train-induced vibrations [9]. In Beijing, due to the impact of the planned metro line 4 on sensitive microscopes in a physics laboratory of Peking University, Gupta et al. [5] and Liu et al. [10] conducted numerical predictions and experimental analyses. Furthermore, Ding et al. [6] predicted train-induced vibrations in a laboratory in Beijing near metro line 8.
Generally, it is difficult to control vibrations in a laboratory with sensitive instruments, especially when the laboratory is located near a rail transportation system. Mitigation measures can be taken at the source [11,12], along the propagation path [13,14], at the receiver [15,16], or using a combination of measures. Measures on the track are considered useful and economic and include the design of resilient and vibration-isolating rail fasteners, under sleeper pads, ballast mats, and floating slab tracks (FST). Table 1 summarizes existing research on different types of vibration-isolating tracks. The elastic element can be inserted under the rail [17,18,19,20,21], the sleeper [22,23,24,25,26,27], and the whole slab track [3,17,18,28,29,30]. The track’s natural frequency decreases with the decrease of the elastic element stiffness or increase in floating masses above the elastic elements. Accordingly, the best vibration reduction effect can be obtained using FST. To mitigate the resonance vibration amplitude around the natural frequency of FST, the tuned slab damper or mass block was recently proposed together with FST [20,31,32]. However, the measures on the track are only suitable for newly planned railway lines, making them unsuitable in the case of yet-to-be-constructed buildings near an existing railway line. Moreover, the inappropriate track parameter design will cause additional problems, such as abnormal wheel wear and rail corrugation [19,21]. Alternative measures at the receiver include the floating floor [33], box-within-box [33], and building base isolation [2,16,34]. However, most of the measures are only suitable for newly built buildings. It is difficult to implement measures for existing buildings considering the high upgrading cost, collaboration of owners, and even the local laws.
Other alternative measures include those taken along the transmission path, including continuous [35,36] and discontinuous [37,38,39] soil barriers. Traditional measures in the transmission path are continuous soil barriers along the railway line. Table 2 lists relative research on continuous vibration mitigation measures along the propagation path, including open trench [14,40], soft-filled barriers [14,40], stiff wave barrier [41], hollow isolation wall [42], subgrade stiffening or WIB [9,43,44,45,46], sheet pile wall [47], and heavy masses along the track [48]. In Table 2, almost all research considered the at-grand or elevated line, but not the underground line. Generally, measures in the transmission path are believed to only be suitable for surface railway lines, where Rayleigh waves are the main contributor to the excitation of sensitive buildings. For underground railway lines, some effect may be achieved when sensitive buildings are far from the tunnel [49]. A pile is a typical discontinuous soil barrier. One row or multi rows of piles can be designed [37,50]. Multi rows of piles exhibit a better ability to mitigate vibrations due to their periodic arrangement. In recent years, it is believed that periodic structures in the transmission path have a potential to control vibrations in some specific frequencies. This idea was originally from the field of solid-state physics. The band gap characteristic of elastic waves was observed from the periodic medium, that is, the frequency of the incident wave cannot propagate through the band gaps of the periodic medium. Accordingly, it has been suggested that a phononic crystal can generate specific frequency band gaps, within which elastic waves cannot propagate into the medium [51,52]. In essence, the phononic crystal is a type of periodic structure with the band gaps. Due to the effect of internal periodic structure, a special dispersion relation, also known as band structure, is formed and some frequency ranges have no corresponding wave vector in the dispersion relation curve. The modes of vibration or wave in the frequency ranges are prohibited from propagating in the periodic medium and these frequency ranges are called band gaps. This idea can also be introduced to vibration control in engineering structures (Figure 1). Similar to a phononic crystal, multiple rows of piles also exhibit a periodic arrangement and obvious frequency band gap characteristics [37,53]. As a result, researchers have devoted more attention to periodic piles as a method of controlling environmental vibrations. For example, Huang and Shi [54] investigated the planar configuration parameters of periodic piles based on their band gap characteristics, Liu et al. [55] discussed the effect of pile length, Pu and Shi [56] developed a new approach to identifying the modes of surface waves, and Meng and Shi [57] investigated the vibration mitigation effect of periodically arranging piles in saturated soil. Moreover, Ma et al. [58] performed an experimental study to validate the calculated band gaps of soil-periodic piles. Albino et al. [39] calculated the vibration reduction effect using buried periodic barriers against railway vibrations. However, whether periodic piles could mitigate building vibrations against train-induced vibrations, especially from an underground railway line, still needs to be investigated.
In this study, a case study was analyzed: a newly planned underground metro line was adjacent to a laboratory containing various types of sensitive instruments. To mitigate the train-induced vibrations, this study focuses on the feasibility of the propagation path solution using periodic piles. Firstly, in-situ measurements of the ambient vibrations were performed inside and outside the building to obtain the vibration transfer function from outside to inside the laboratory. Then, to help design and optimize the band gaps of the periodic piles, a novel band gap performance evaluation function is proposed. Finally, numerical analysis was performed to validate the mitigation effect of the designed periodic piles.

2. Problem Outline and Methodology

In this case study, the newly planned metro line of Hefei city is located very close to the laboratory of the China Academy of Sciences (CAS). The CAS laboratory is located in an urban area west of S-S Road. The planned metro tunnel is a circular shield tunnel with an outer radius of 3 m and is located 14.8 m beneath the surface of S-S Road. The net distance between the outer walls of the laboratory building and the west shield tunnel is only 27 m (Figure 2). In the laboratory building, various types of sensitive instruments are installed and plan to be installed in the future, including a scanning electron microscope, e-beam lithography, and an electron paramagnetic resonance spectrometer. To comprehensively evaluate the vibration level and mitigation effects for all types of instruments, the widely used general vibration criteria (VC) curves [59] were employed in this research.
To predict and evaluate the vibrations in the laboratory, a hybrid method of both measurement and numerical was employed. In-situ measurements were performed to determine the ambient vibration level and transfer function. Vibration sensors were installed both outside and inside the laboratory building to obtain the responses outside the building RoutEXP(fi) and inside the building RinEXP(fi). Then, the vibration transfer function H(fi) was calculated as follows:
H ( f i ) = R in EXP ( f i ) R out EXP ( f i ) ,
where fi is the i-th center frequency of the one-third octave bands. Due to the complex building structure and dynamic soil–structure interaction, the laboratory building was not considered in the numerical model. It was assumed that vibration transfer characteristics only depend on the building structure but are independent of the vibration source. Thus, the measured transfer function H(fi) can be employed to predict vibrations inside the building if the metro train-induced ground vibrations are predicted by the numerical model:
R in PRE , m ( f i ) = H ( f i ) R out PRE , m ( f i ) ,
where RinPRE,m(fi) is the predicted floor vibration response in the building, and RoutPRE,m(fi) is the predicted ground vibration response outside the building. The superscript “m” indicates that responses are only induced by metro trains.

3. In-Situ Vibration Measurement

3.1. Sensor Arrangement

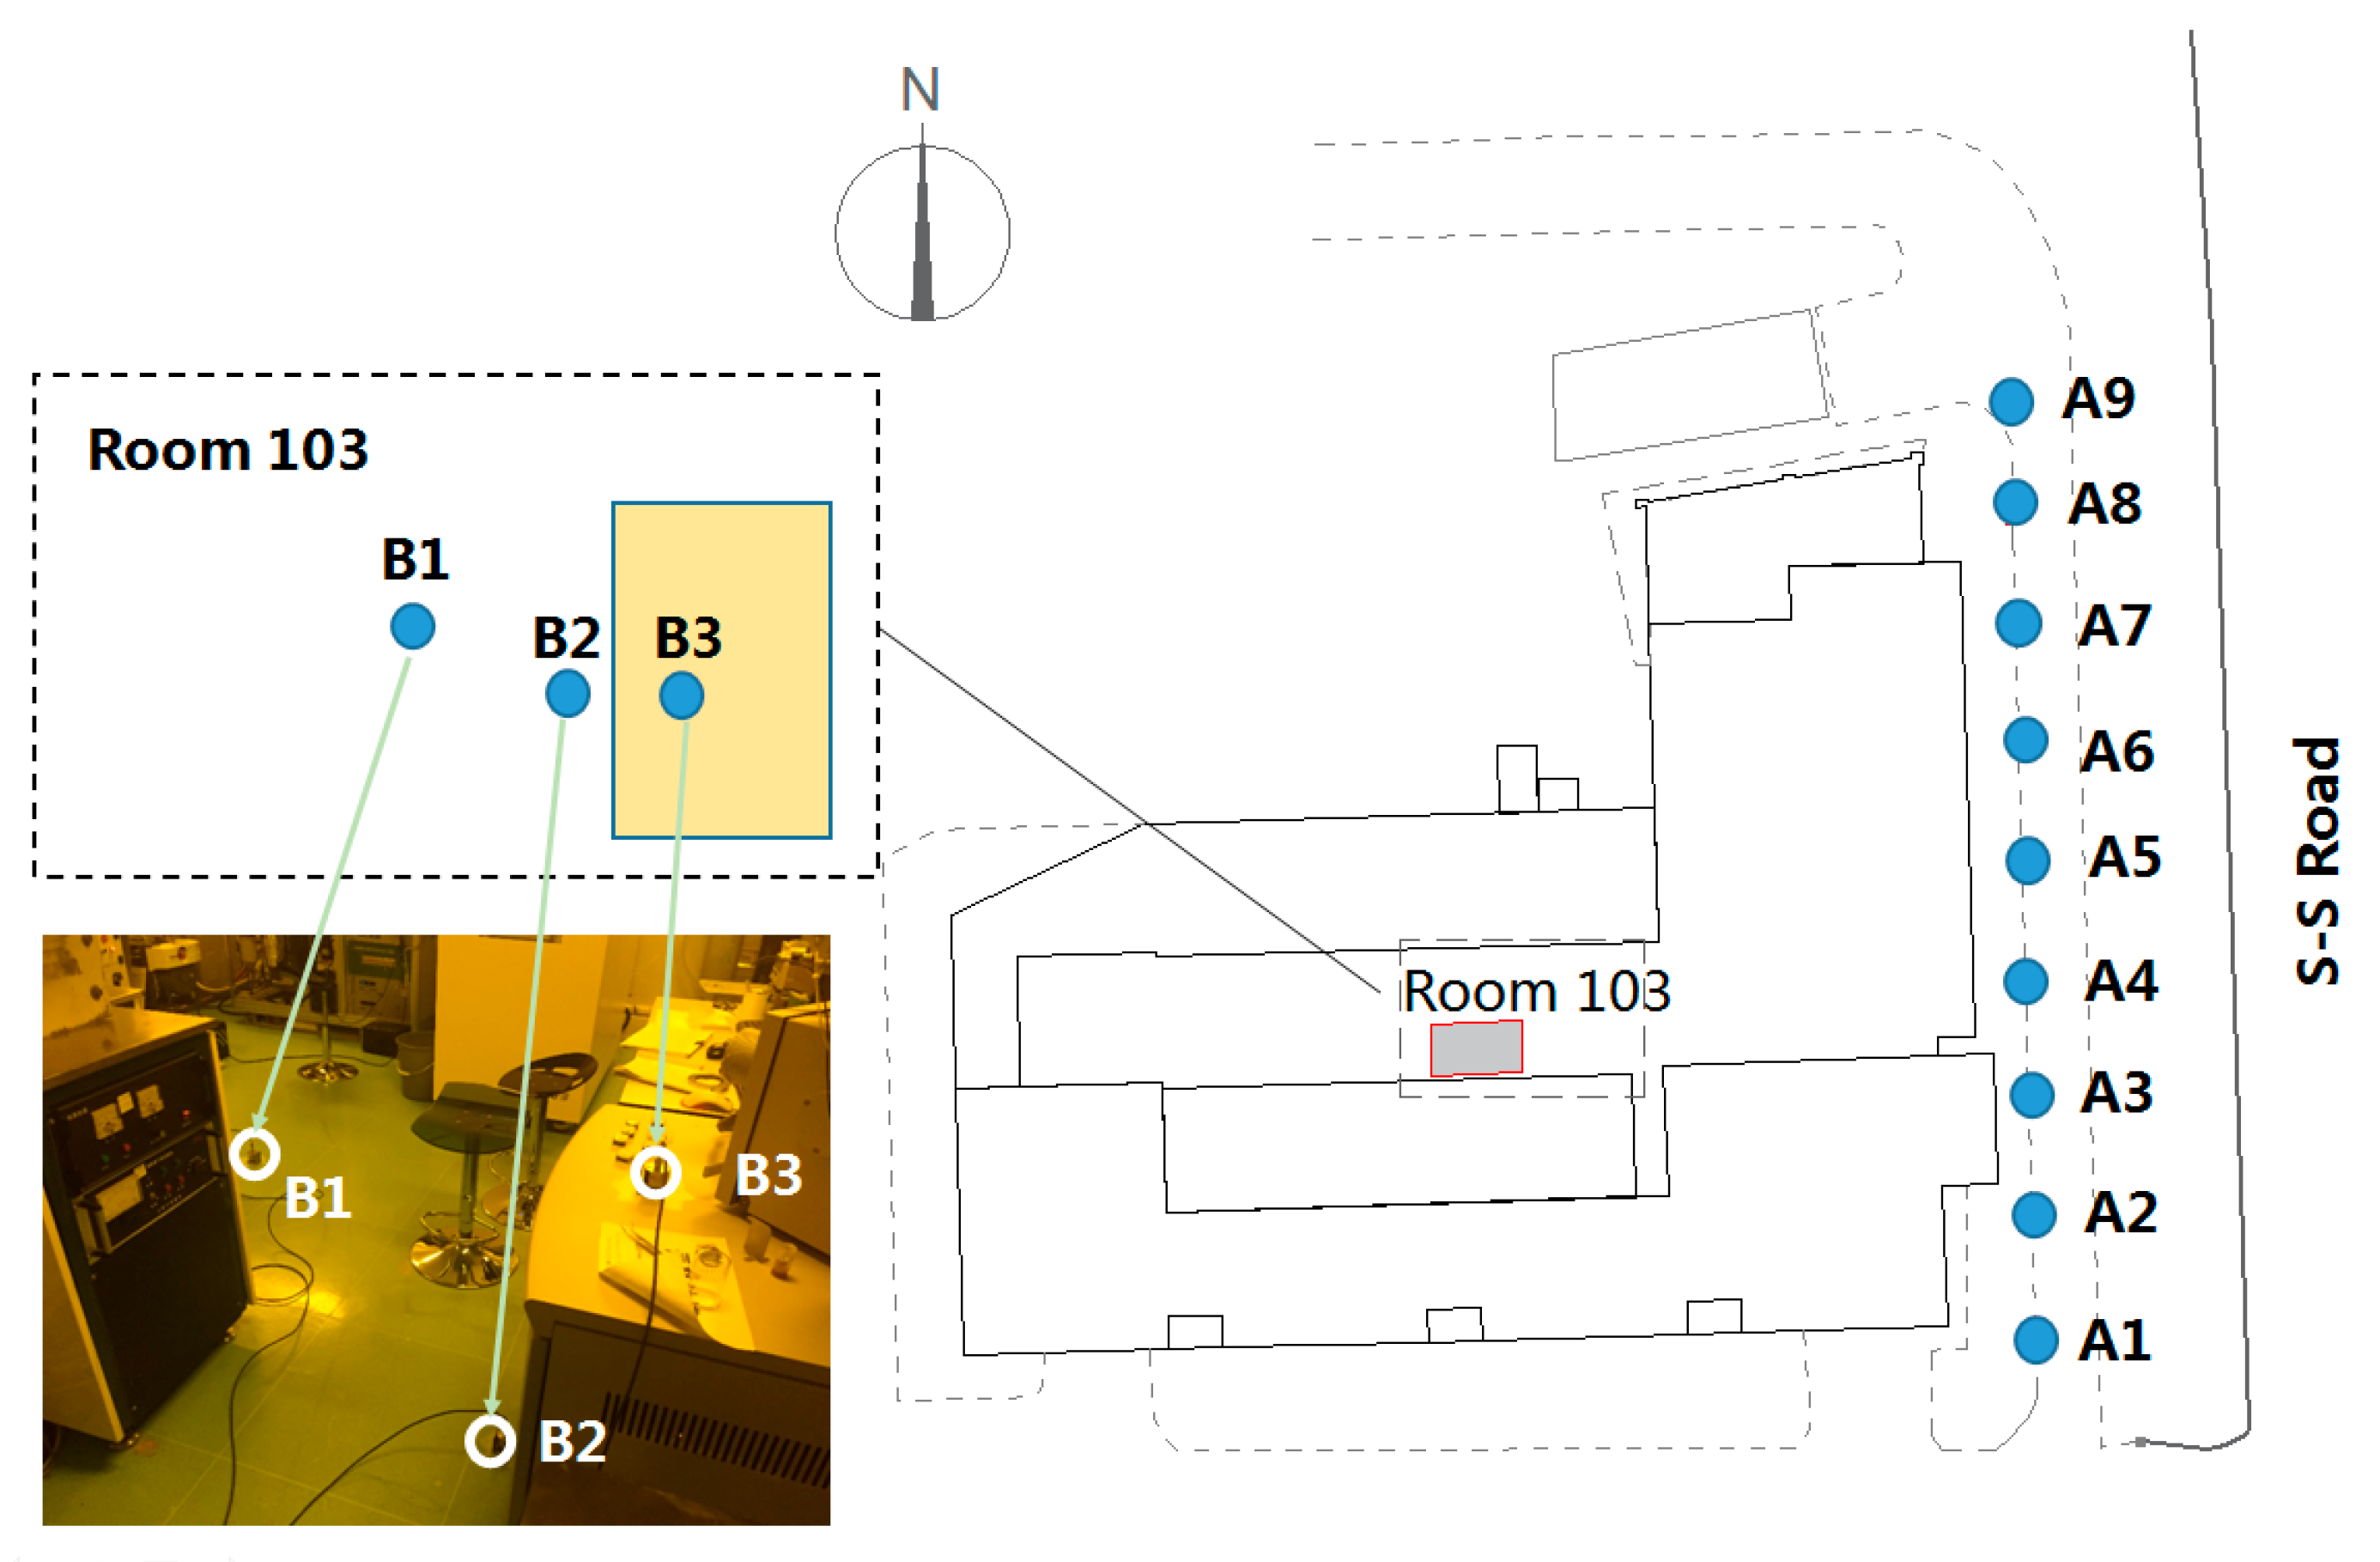
Room 103 was selected as a typical laboratory containing sensitive instruments. Three measurement points were arranged in the room: B1 was at the center of the floor, B2 was also on the floor but close to the instrument workbench, and B3 was located on the workbench. Another nine measurement points, A1–A9, were arranged outside the building along S-S Road (Figure 3). At each measurement point, both the vertical acceleration and vertical velocity responses were recorded by type LC0130 acceleration sensors and type 941B velocity sensors, which were connected to a synchronous data acquisition instrument of INV3060S type with 16 channels. To compare the vibration responses using VC curves, only the velocity responses are discussed in the following analysis. Two test conditions were considered: background vibrations and road traffic-induced vibrations. Background vibrations were measured in the early morning when no cars or buses were running on S-S Road, whereas road traffic-induced vibrations were measured during the evening rush hour. Each test lasted 30 s and was repeated five times.

3.2. Experimental Results

Figure 4 illustrates the average vibration responses measured in Room 103. The VC curves were plotted to evaluate the current vibration level in the laboratory. Seven guideline curves, from VC-A to VC-G, were suggested by Amick et al. (Table 3) [59]. VC-A is a relatively loose limit curve appropriate for most optical microscopes, and VC-E is a challenging limit curve appropriate for the very sensitive instruments. VC-F and VC-G are only used for evaluation of an extremely low-vibration environment. A more detailed description of use for the VC curves can be found in Ref. [59].
Comparing the measurement responses with the VC curves, it can be observed that the laboratory room was a low-vibration environment. Even during the evening rush hour, the traffic-induced vibration responses were below the VC-D curve. As the building foundation was specifically designed according to the vibration isolation purpose, it provides quiet working conditions for most instruments under the VC-D vibration level; for example, the scanning electron microscope, transmission electron microscope, and E-beam system. Compared with the background vibrations, traffic-induced vibrations were larger at approximately 10 Hz. This was probably a contribution caused by the natural frequency of the floor and the dominant frequency of the traffic-induced vibrations. Above 30 Hz, the vibration on the workbench (B3) was larger than that on the floor (B1 and B2).
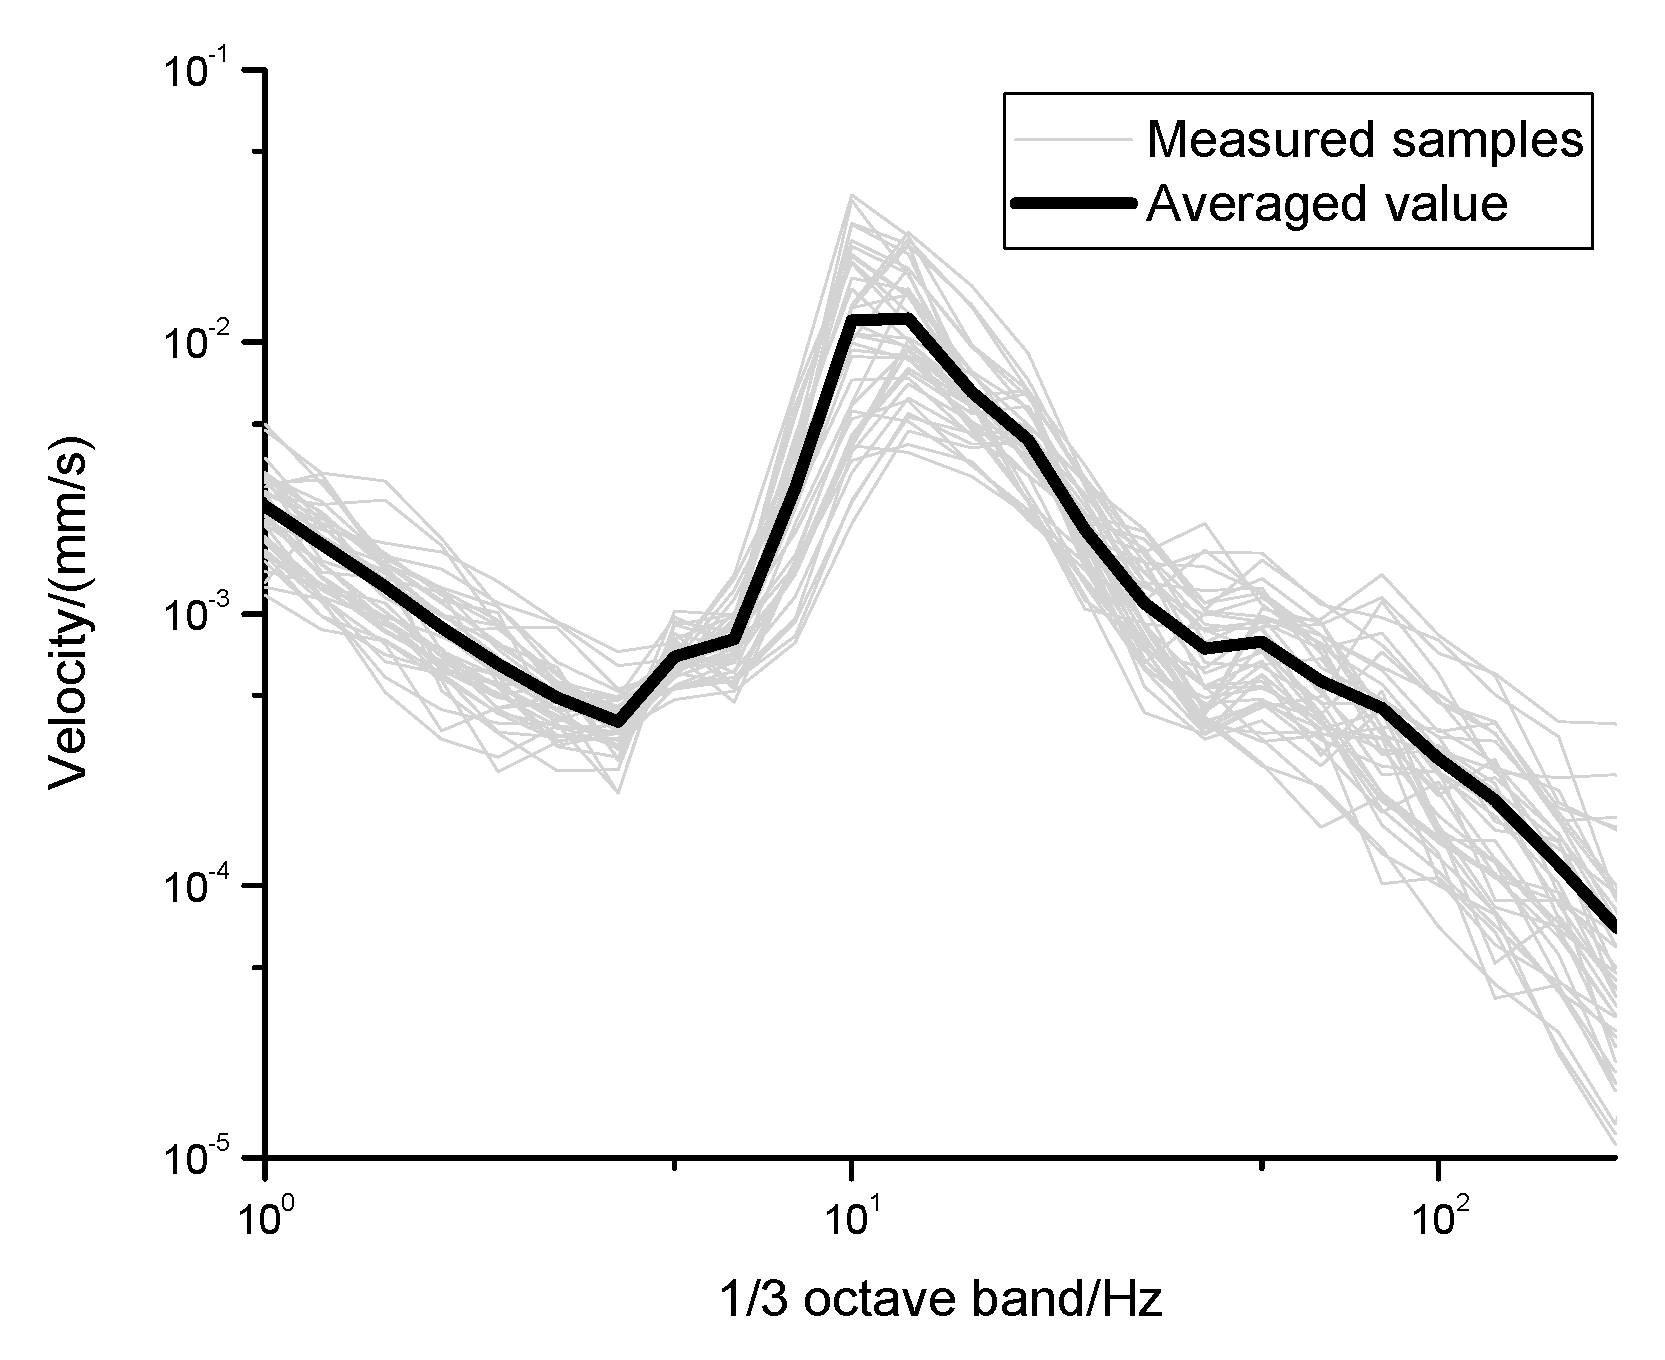
Figure 5 illustrates vibration responses outside the building (A1–A9) due to road traffic during the evening rush hour. Five vibration response samples were recorded for each measurement point, and the average response was plotted as a thick solid line. Then, the average vibration transfer function H(fi) between the ground outside the building (A1–A9) and the floor of Room 103 (B1 and B2) was calculated using Equation (1) and plotted in Figure 6. When H(fi) < 1, vibrations were attenuated through the building; otherwise, vibrations increased. The H(fi) of B2 was clearly larger than that of B1, especially below 8 Hz and at 50 Hz and 100 Hz. A comparison of Figure 4 and Figure 5 suggests that the two dominant frequencies at 50 Hz and 100 Hz were likely caused by electrical interference from the equipment on the workbench.

4. Band Gap Analysis and Comparison for Periodic Piles

As the newly designed metro tunnel is located only 27 m from the laboratory building, operation of the metro line will increase the building vibrations, which may affect researchers’ use of the instruments. To mitigate train-induced vibrations, measures can be taken on the track by inserting elastic elements, along the propagation path in the soil layers and at the receiver, using an isolated platform. In this study, only mitigation measures along the propagation path were discussed; specifically, periodic piles. Existing research on the vibration mitigation effect of periodic piles has indicated that band gap design and optimization are key to mitigating train-induced ground vibrations [60]. To design optimal periodic piles for controlling train-induced environmental vibrations, a novel band gap performance evaluation function is proposed in the following subsections.

4.1. Band Gap Performance Evaluation Function

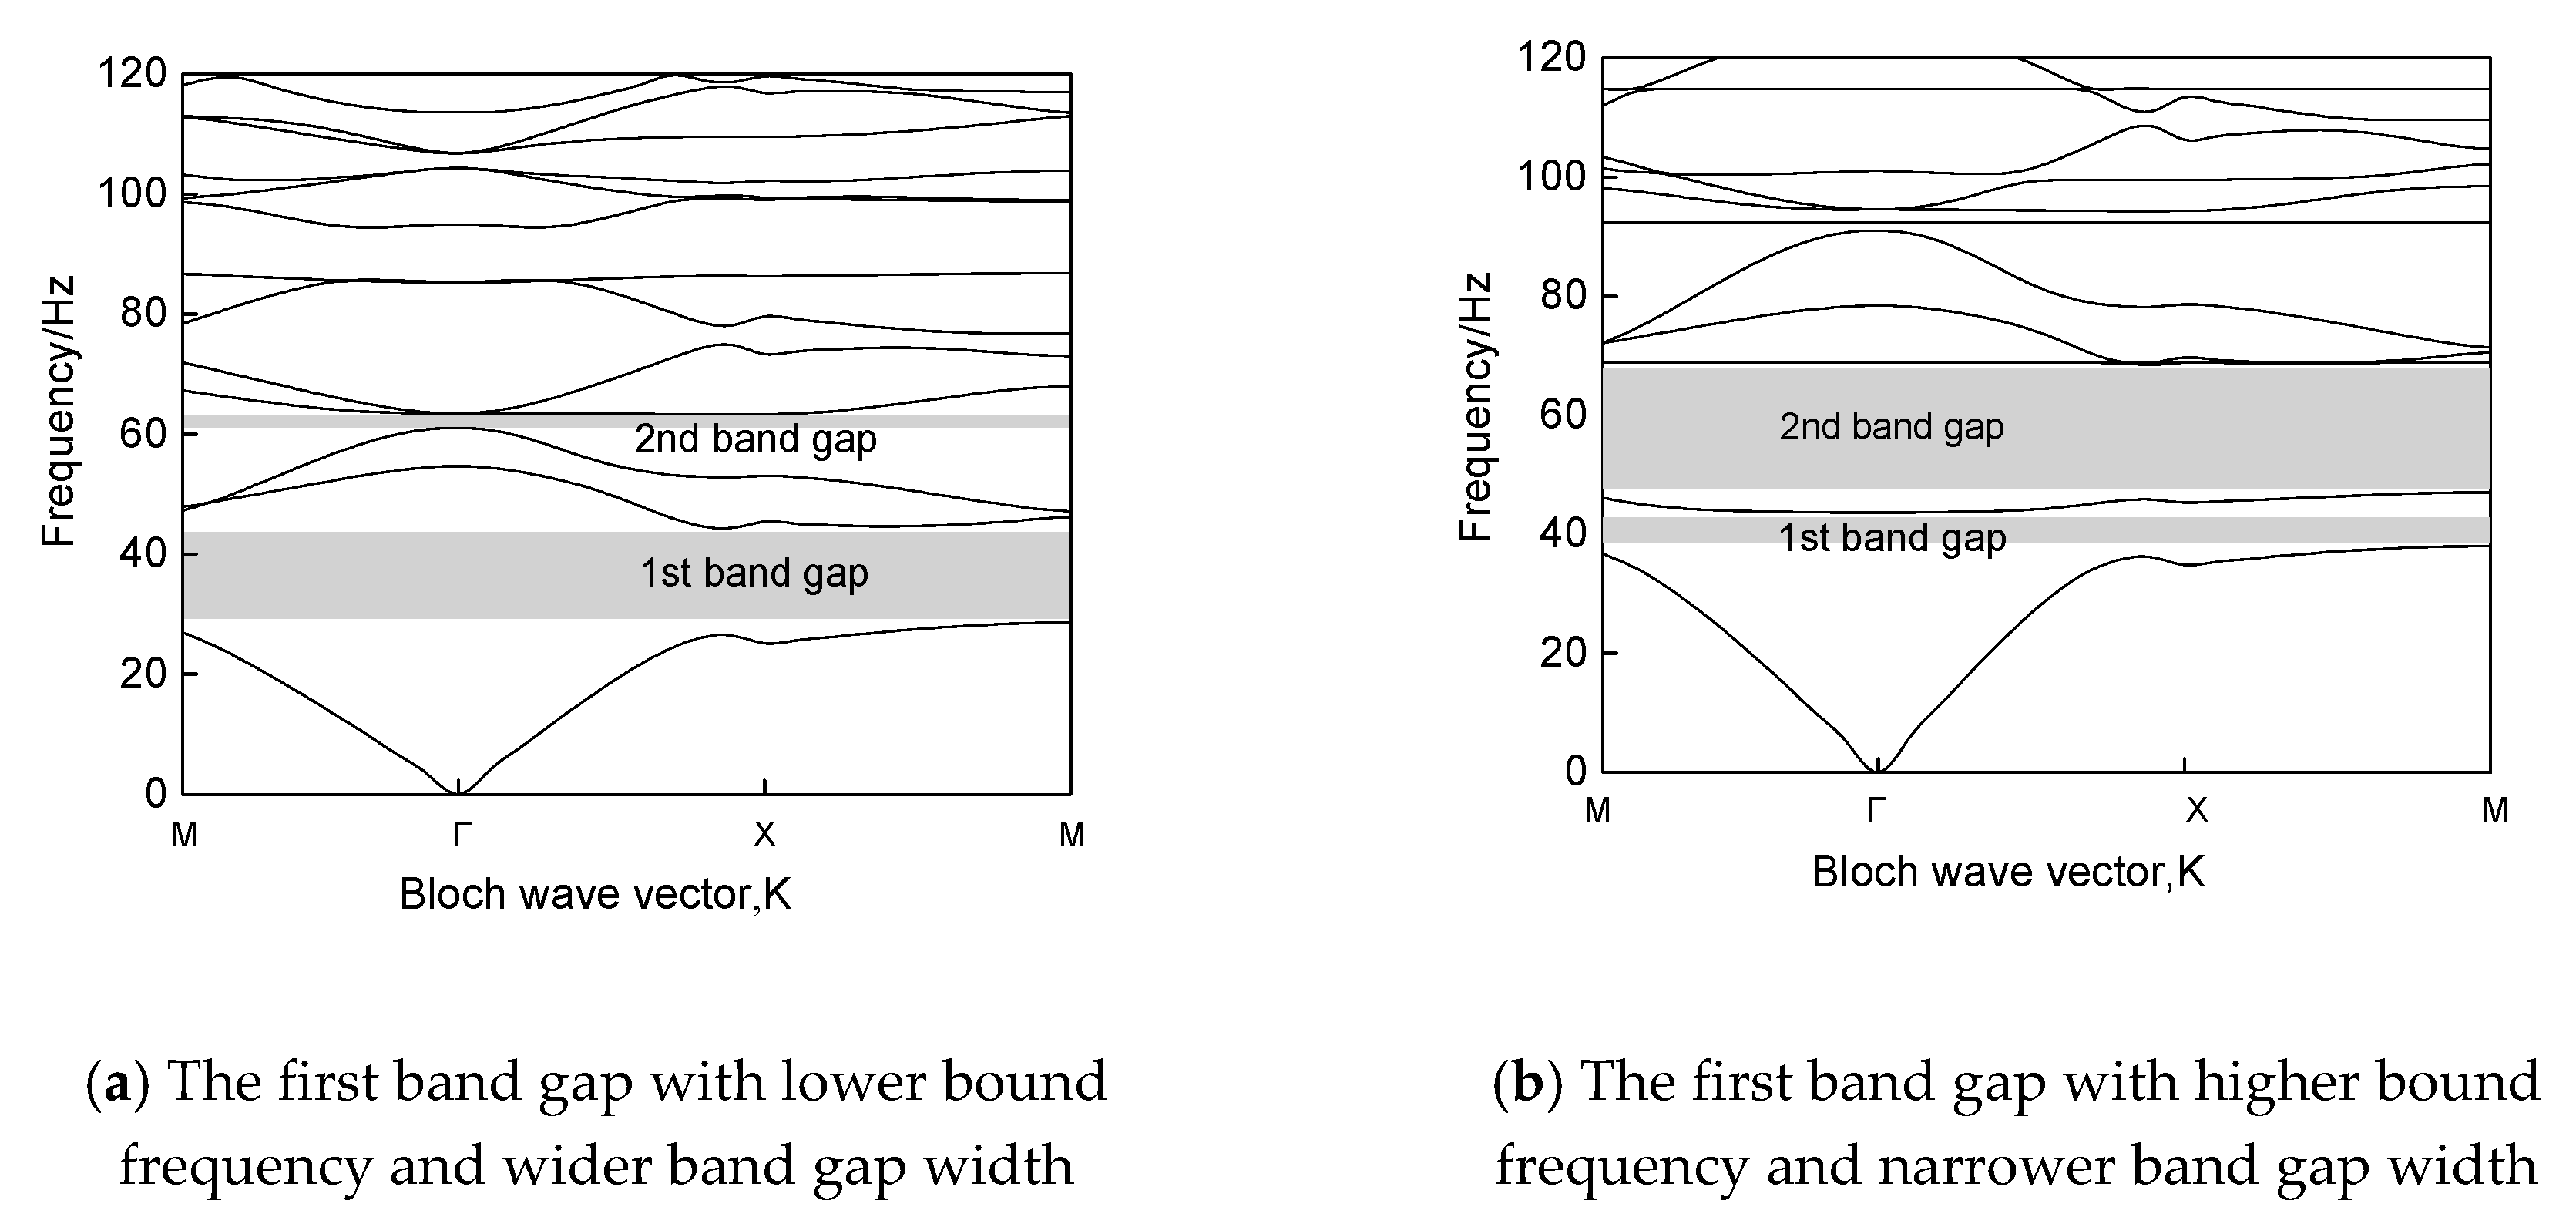
The main indices of band gaps include the lower bound frequency, upper bound frequency, and width of the band gap. However, these three indices exhibit different trends with various parameters, which complicates the design and optimization of the band gap. Moreover, practical engineering is particularly concerned with the relationship between band gap and target isolation frequency range, which depends not only on the initial band gap but also on the distribution of all band gaps. As an example, Figure 7 shows two frequency band gap solutions calculated based on different arrangements of periodic piles. In the x-coordinate, X, M and Γ represent the vertexes of the reduced Brillouin zone. The grey zone represents the frequency band gaps. Compared with the first band gap illustrated in Figure 7b, it exhibits lower bound frequency and wider band gap width in Figure 7a. However, Figure 7b probably provides a better vibration mitigation effect for one possible arrangement of the periodic piles, especially below 80 Hz.
The design and selection of periodic piles for vibration isolation depend on whether the center frequency of the band gap is approaching the dominant frequency of the environmental vibration and whether the band gap distribution is wide enough. Considering the two aspects, a comprehensive evaluation method for designing a periodic structure is proposed. Firstly, the difference between the center frequency of the band gap and the dominant frequency of the vibration indicates the closeness between them, which should be expressed in the evaluation method. Secondly, the impact of band width should be reflected in the evaluation method. Accordingly, a novel band gap performance evaluation function Φ was proposed for designing the periodic structures, which is designed as:
Max : Φ = n min ω j + 1 max ω j | ω D min ω j + 1 + max ω j 2 | ,
where n is the total number of band gaps; (max ωj) and (min ωj+1) represent the lower and upper bound frequencies of one band gap; (min ωj+1 − max ωj) represents the band gap width; (min ωj+1 + max ωj)/2 represents the central frequency of the band gap; and ωD is the frequency of concern of the blocked objective. When the central frequency of the band gap is approaching the frequency of concern, ωD, the value of (ωD − (min ωj+1 + max ωj)/2) approaches the minimum value. In contrast, with increasing band gap width, Φ approaches the maximum value. The larger the Φ value, the better the vibration mitigation effect for the frequency of concern.
Different from other band gap evaluation methods as a single evaluation index, both the band gap width and the center frequency were comprehensively considered by Φ. This method avoids the uncertainty of multi index analysis. In addition, the concerned frequencies of train-induced vibration are considered. Moreover, both the distribution of all band gaps and the initial band gap can be considered comprehensively. Therefore, the band gap performance evaluation function, Φ, can be used to design and optimize the vibration mitigation effects of periodic piles.

4.2. Band Gap Solution for Periodic Piles

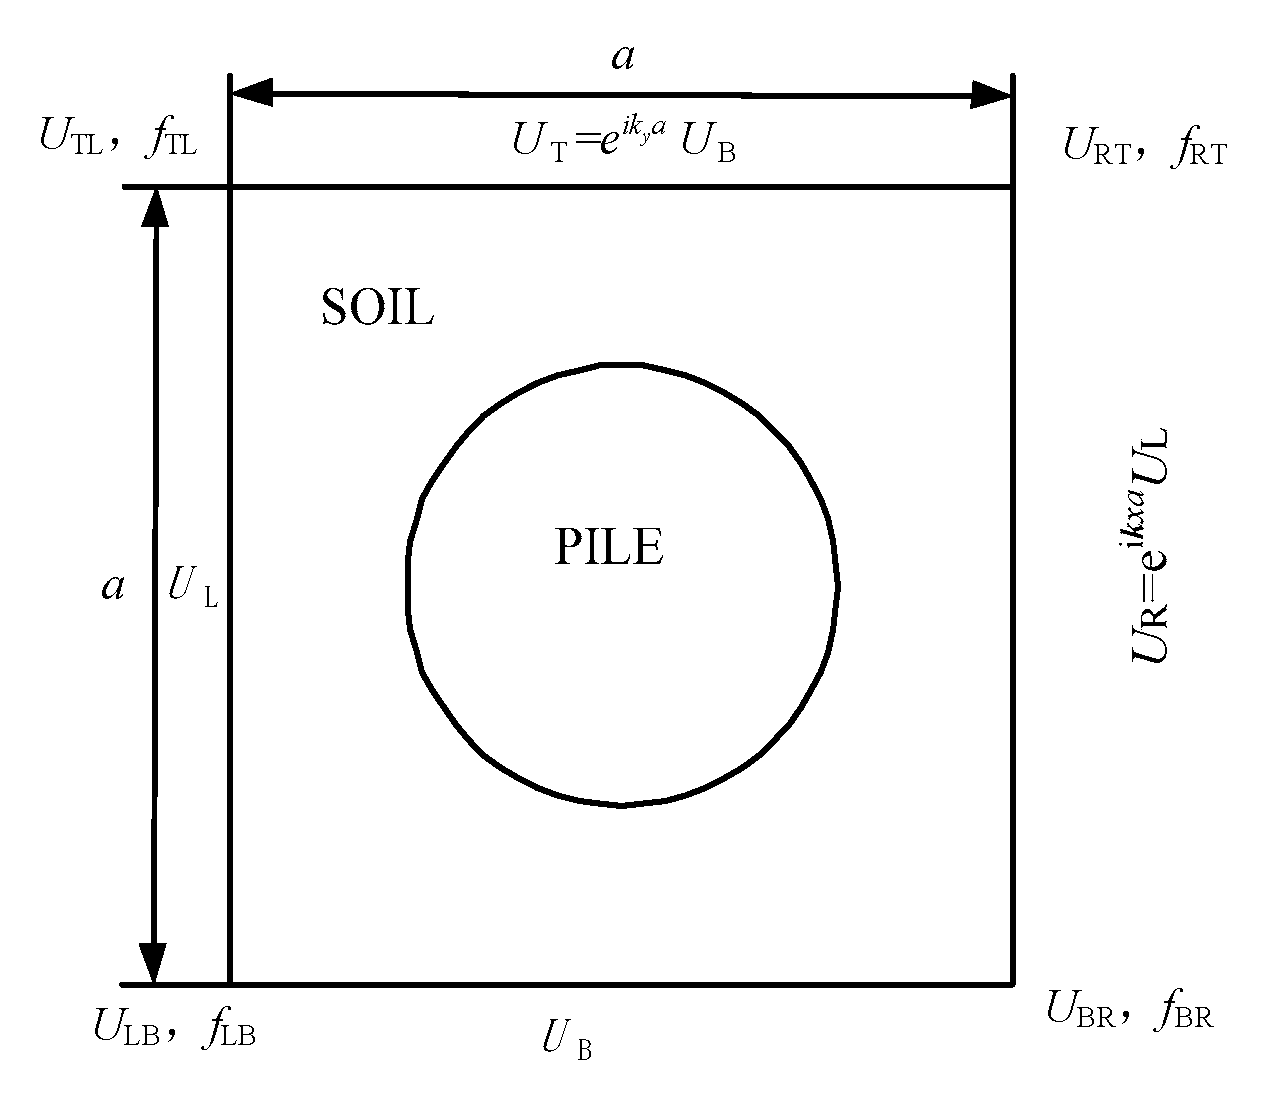
To calculate the distribution band gap of periodic piles, the finite element method (FEM) was employed to solve the dispersion relationship of periodic structures with various complex shapes based on the variational principle and weighted residual method [61]. The infinite degree-of-freedom of the periodic piles can be condensed to the master nodes of a single basic cell by applying the Bloch-Floquet periodic conditions (Figure 8):
U ( r + a ) = e i k a U ( r ) ,
where a is a periodic constant, k is a Bloch wave vector, r is a position vector, and U represents displacement. Then, the band gap of periodic piles was calculated in the basic cell domain and the Bloch-Floquet periodic conditions were added to the boundary of the basic cell.
As the continuous field is characterized by each node displacement and the interpolation function in each basic cell, the continuous problem can be discretized. The relationship between node displacement and node force in a basic cell is generated using an element stiffness matrix, and the adjacent basic cells are connected by the equilibrium equation, forming a global stiffness matrix. The governing equations for the cell and the whole domain can be expressed as follows:
Meüe + Keue = 0,
+ Ku = 0,
where Me and Ke represent the mass and stiffness matrices of the basic cell, respectively; ue is the node displacement vector; M and K represent the mass and stiffness matrices of the whole domain, respectively; and u is the global node displacement vector. Then, the dispersion curve ω(k) is obtained by sweeping the Bloch wave vector k over the irreducible Brillouin zone [61].
The calculation was performed using COMSOL software, which has the obvious advantage of adding complex boundaries. In the dispersion calculation, the periodic piles were assumed to be infinite, i.e., the plane strain assumption was employed. The solid physical module and pressure acoustic module were used to solve the in-plane and anti-plane band gaps, respectively. The solver mode corresponds to the undamped eigenvalue mode. Based on the plane strain assumption, the elastic wave equation can be decoupled into a mixed mode in the plane and a shear mode out of the plane, as follows [62]:
T [ μ ( r ) T u i ] + T [ μ ( r ) x i u i ] + x i [ λ ( r ) T u T ] = ρ ( r ) ω 2 u i , i = x , y ,
T [ μ ( r ) T u z ] = ρ ( r ) ω 2 u z ,
where λ and μ are Lamé constants; ρ denotes the mass density; u(r, t) is a displacement vector; uj(j = x, y, z) denotes the displacement component; is the Laplace operator; r = (x, y, z) is the coordinate vector; and t is time parameter.
Based on the theory of Bloch-Floquet, Equations (7) and (8) can be deduced as:
u ( r , t ) = e i ( K r ω t ) u K ( r ) ,
where uK(r) is the vector of the wave amplitudes, and K is the wave vector in the reciprocal space.
Considering the periodicity,
u k ( r ) = u k ( r + a ) ,
where a is the periodic constant vector.
Substituting Equation (10) into Equation (9), the periodic boundary condition is obtained:
u ( r + a , t ) = e i K a u ( r , t ) ,
Then, the wave equations are expressed as:
( Ω ( K ) ω 2 M ) u = 0 ,
where Ω is the stiffness matrix and M is the mass matrix.
By solving for the eigenfrequencies of the Equation (12) for different values of K, the dispersion relation ω = ωn (K) and band gaps can be obtained.
In general, when only the longitudinal waves were considered, the viscosity was ignored. The wave equation is expressed as follows [63]:
( 1 ρ ( r ) p ) = 1 ρ ( r ) c l 2 ( r ) ω 2 p ,
in which,
c l = ( λ + 2 μ ) / ρ ,
where p is the pressure; cl is the longitudinal wave velocity; ρ is the medium density; λ and μ are Lamé constants; u is the displacement vector; r is a position vector; and ω is the angular frequency. If ρ, 1/ρ and 1/(ρcl2) in Equation (13) are replaced with uz, u, and ρ, Equation (13) becomes equivalent to Equation (8). Therefore, the dispersion relationship of the anti-plane shear mode can be obtained by solving the acoustic wave using Equation (13) instead of Equation (8).

4.3. Parameter Comparison and Selection for Periodic Piles

To determine better design parameters for periodic piles in order to control train-induced ground vibrations, parameter comparison and selection were performed. As the material parameters for piles and the soil layers are known, the main design parameters include the lattice form of the basic cell, the pile radius, and the periodic constant.
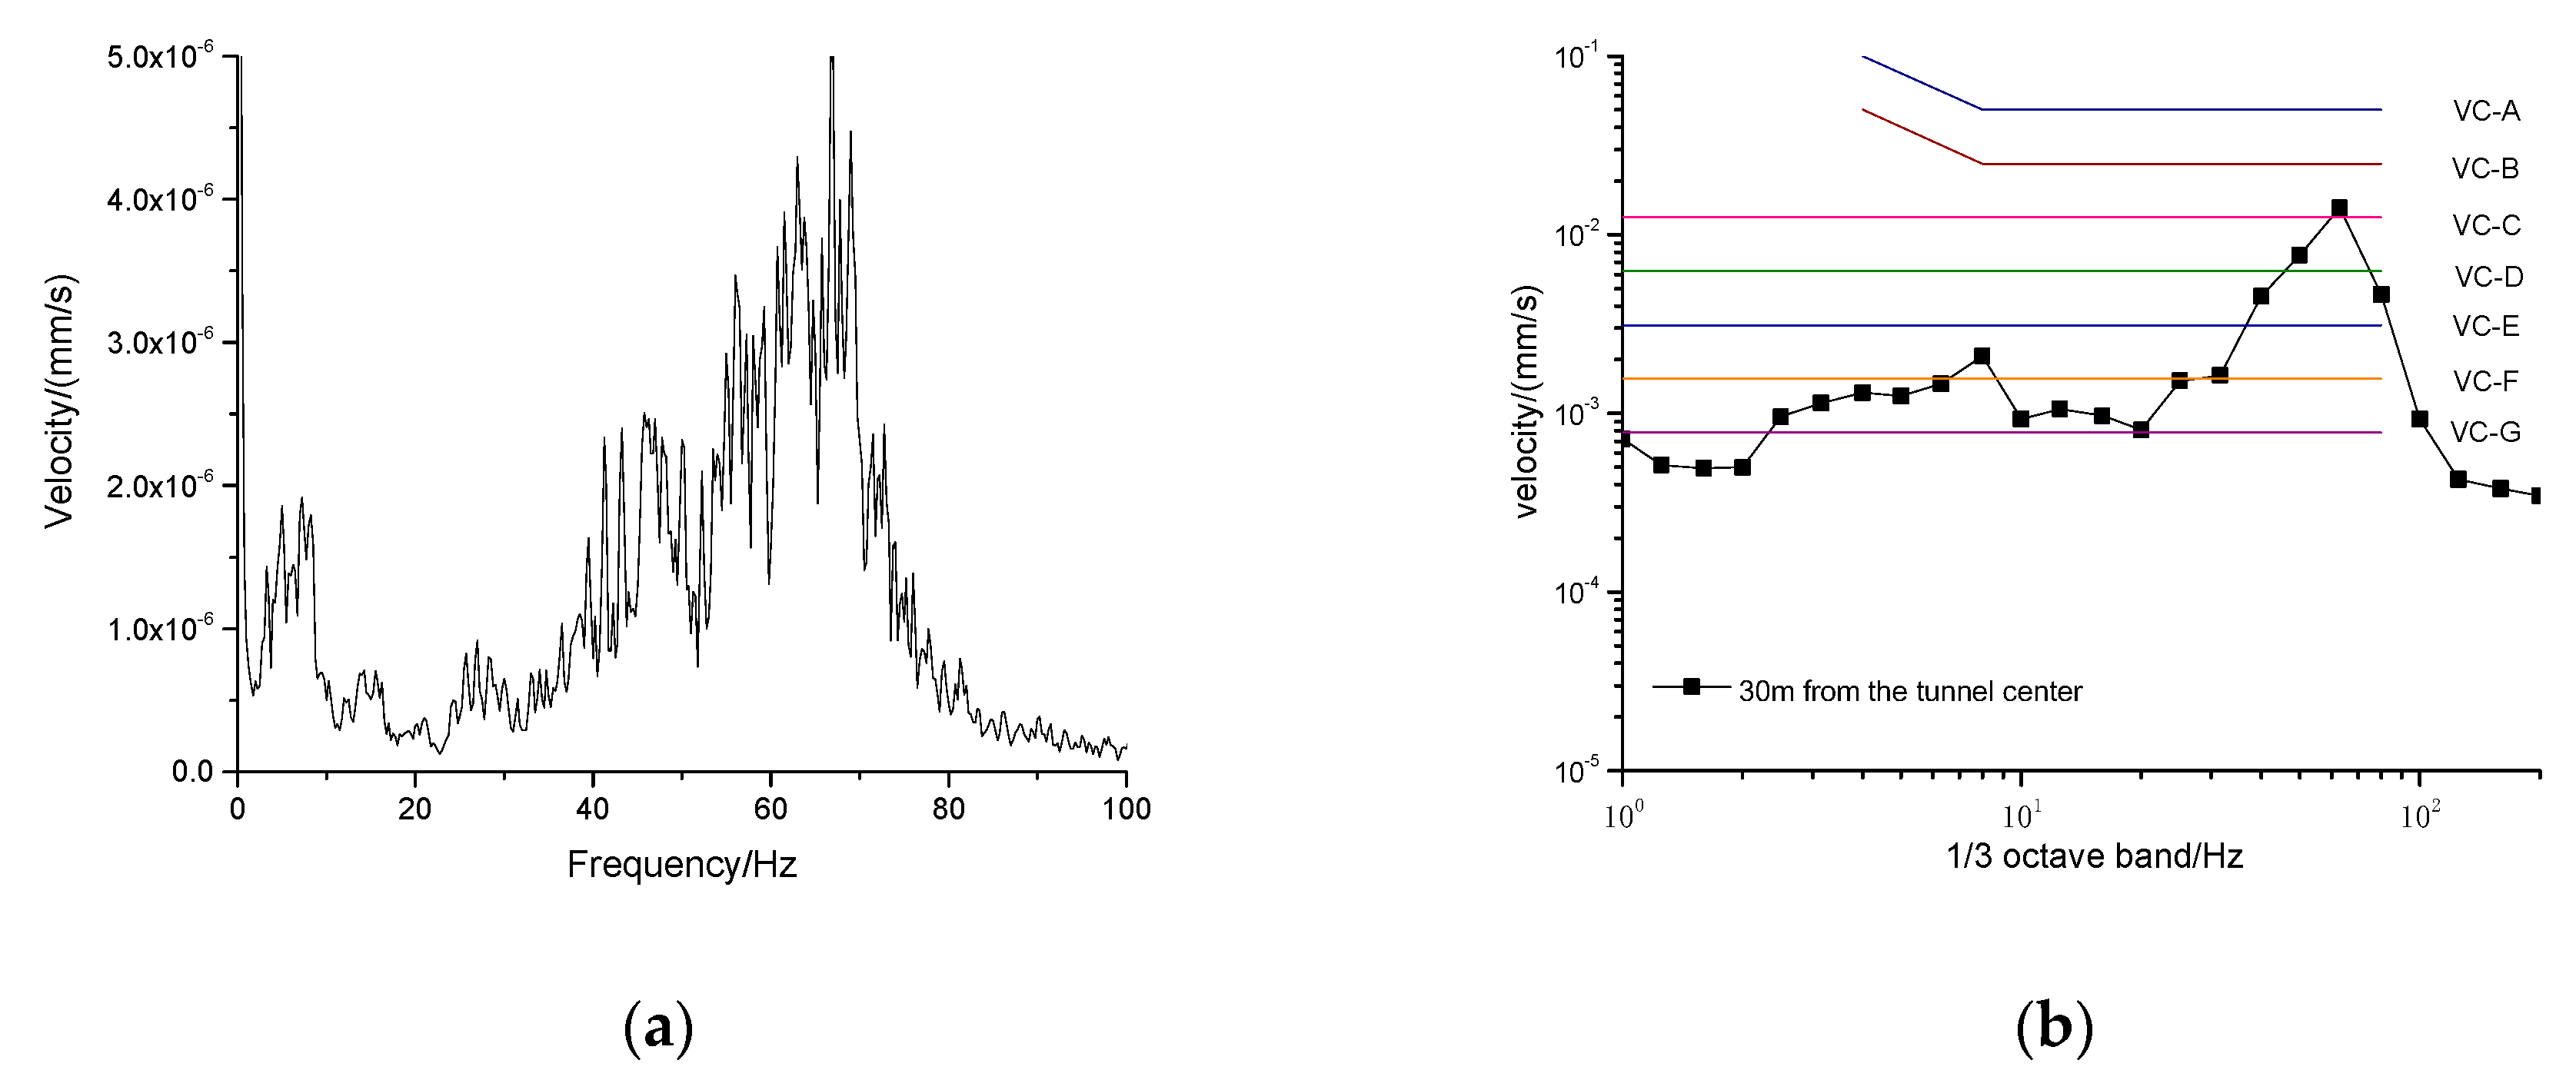
To calculate the band gap performance evaluation function, Φ, in Equation (3), the dominant frequency ranges of train-induced ground vibrations should be determined. Thus, in-situ measurements of ground vibrations were performed near Hefei metro line 1, where the embedded depth of the shield tunnel was similar to that of the planned tunnel near the laboratory. Figure 9 illustrates the Fourier spectrum and the one-third octave bands of the measured ground vibrations 30 m from the central line of the metro running tunnel. According to the results, at a distance of 30 m from the tunnel center, train-induced ground vibrations could affect the normal operation of sensitive instruments. At approximately 63 Hz, the vibration responses exceeded the VC-C curve. Between approximately 44 Hz and 76 Hz, the vibration energy was obvious, and the responses exceeded the VC-D curve. Thus, for subsequent analysis, 44 Hz, 76 Hz, and 63 Hz were set as the lower, upper, and target frequencies.
Based on a geologic survey report, drilling hole exploration showed that the soil between the laboratory and the planned tunnel can be simplified into three layers from top to bottom. The detailed soil parameters are listed in Table 4. As the planned tunnel was embedded 14.8 m below the surface, the periodic piles can be regarded as being embedded in the clay layer. Therefore, in the following analysis for each basic cell, parameters specific to the clay layer were employed.
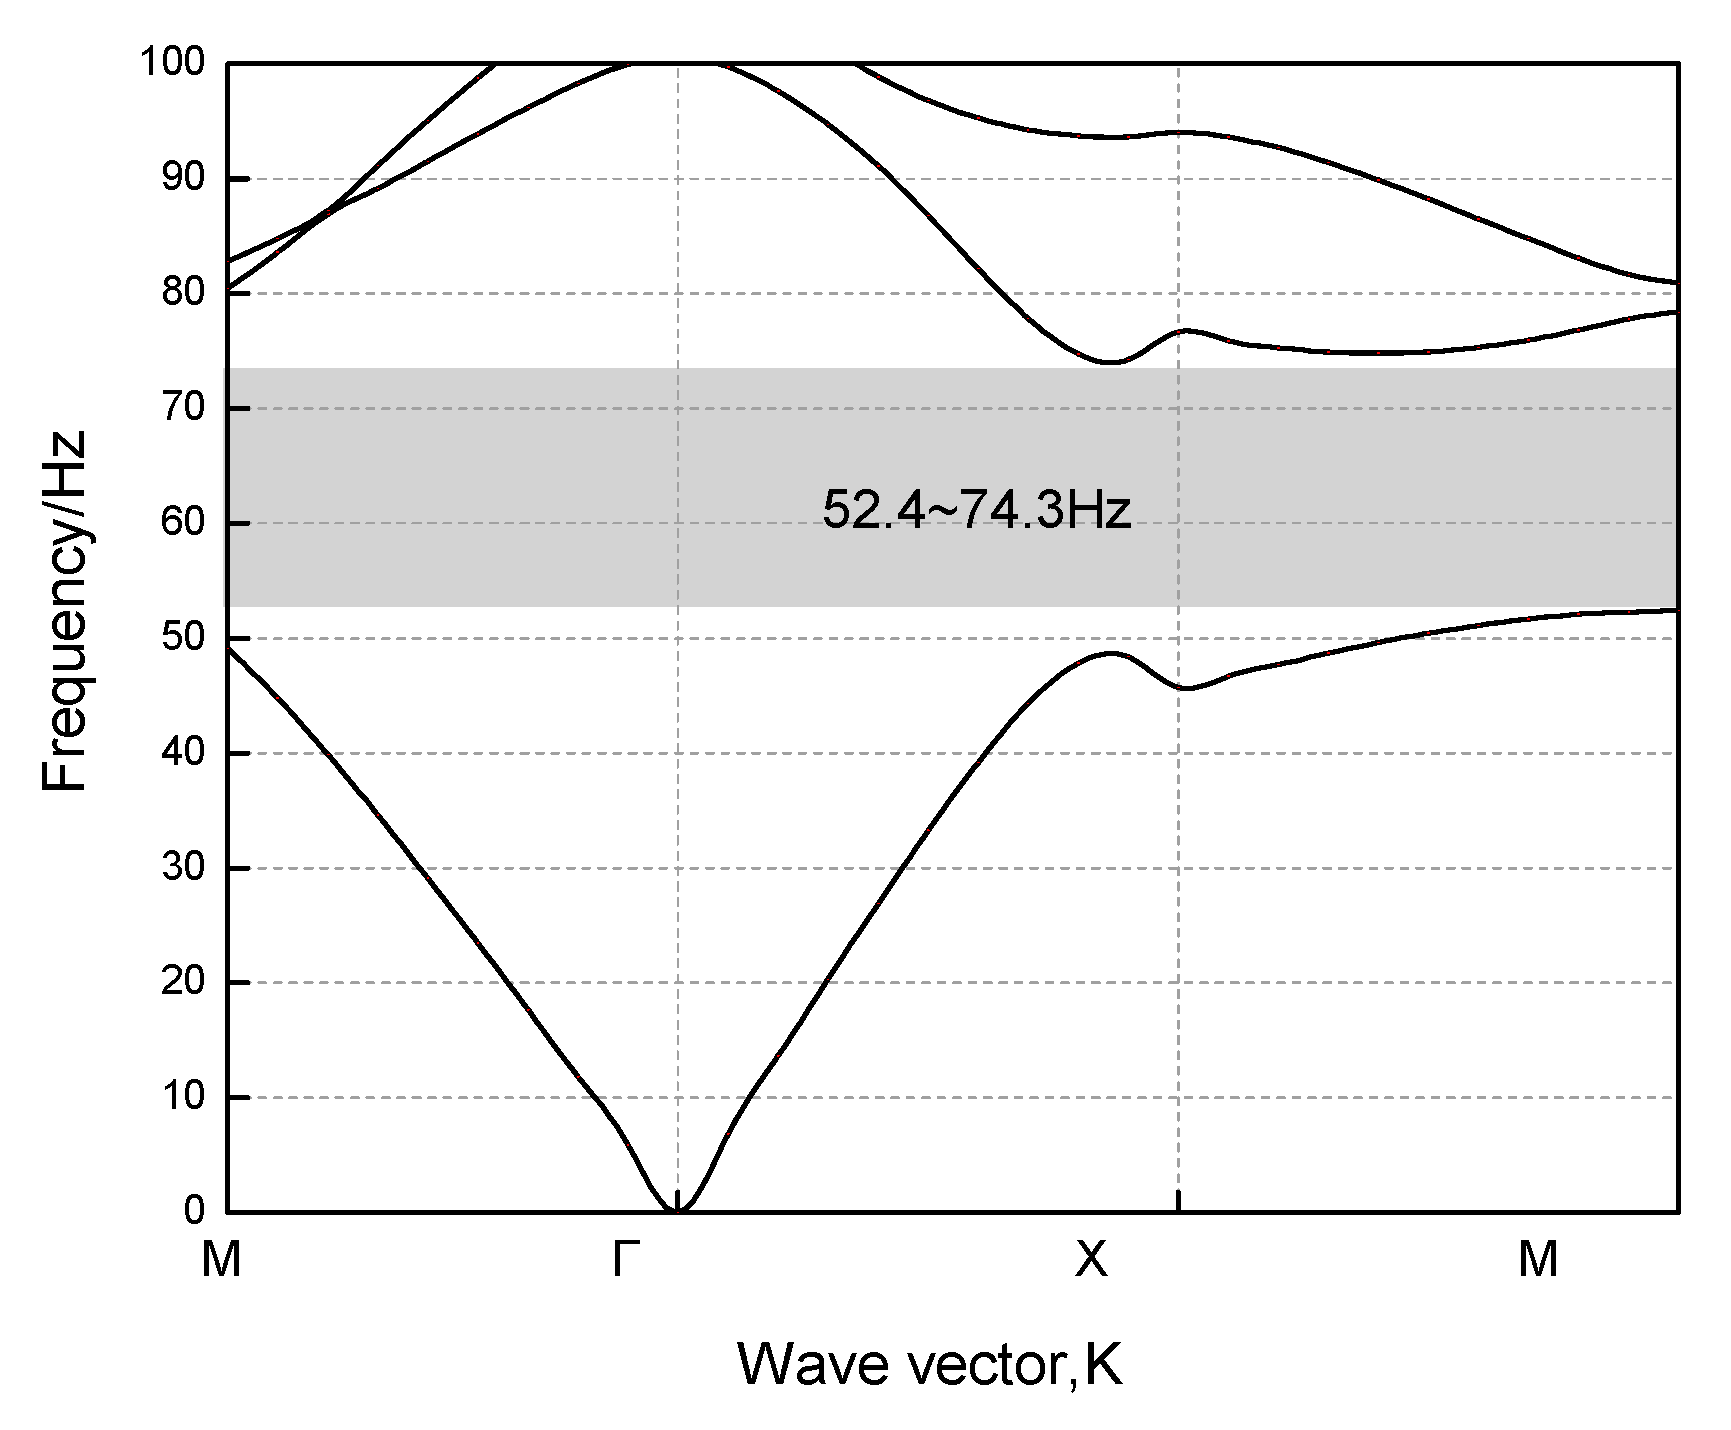
Two types of basic cell shape were considered: square and hexagonal. Additionally, two types of piles were considered: a concrete pile and a steel pipe with a concrete pile inside. By combining the basic cell shape and pile type, a total of four types of lattice form were analyzed. For each lattice form, two groups of parameters were calculated for the periodic constant and pile radius, as shown in Table 5. In the calculation, the concrete material had a Young’s modulus of 3 × 10¹⁰ N/m2, a mass density of 2500 kg/m3, and a Poisson’s ratio of 0.2, whereas the steel material had a dynamic elastic modulus of 2.1 × 10¹¹ N/m2, a density of 7890 kg/m3, and a Poisson’s ratio of 0.275. For each case, the band gaps were calculated using COMSOL. The band gap performance evaluation function, Φ, for the eight cases were calculated using Equation (3). The final calculation results of Φ are listed in Table 5. The maximum Φ was 68.31 for case 6, which involved a hexagonal lattice, a periodic constant, a, of 3.8 m, and a concrete pile radius, R, of 1 m. The band gap distribution for case 6 is illustrated in Figure 10.

5. Controlling Metro Train-Induced Environmental Vibrations by Periodic Piles

5.1. Tunnel-Soil-Periodic Pile FE Model

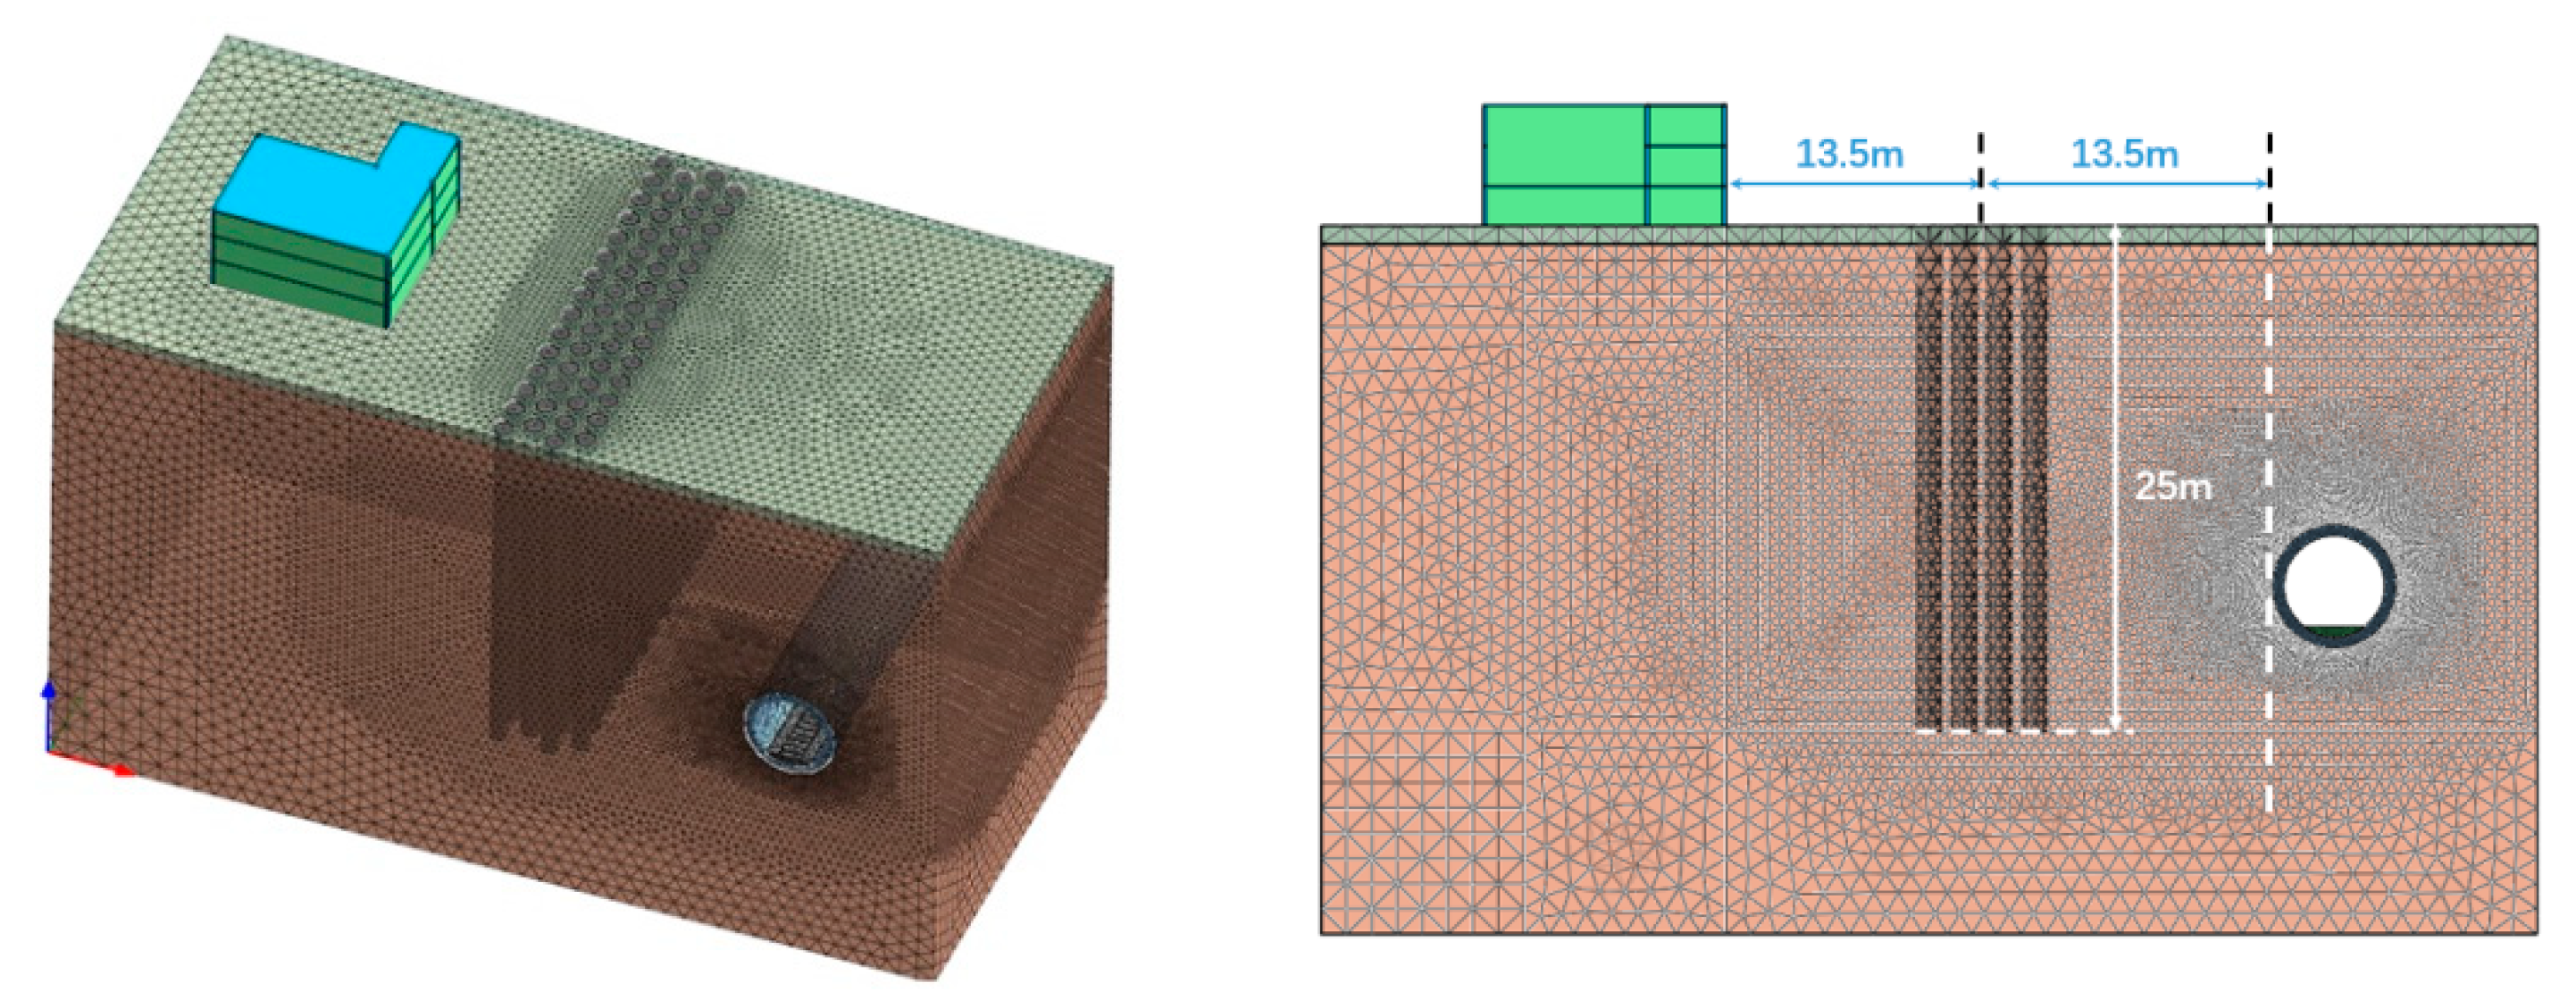
To validate the effect of periodic piles on controlling-metro train-induced environmental vibrations, a coupled tunnel-soil-periodic pile dynamic FE model was built using MIDAS/GTS software (Figure 11). Considering the space between the laboratory building and the tunnel, four rows of piles were considered. The center of the four rows of piles was located at a distance of 13.5 m from both the outer tunnel wall and the building wall. The pile length was set to 25 m, which was larger than the embedded depth of the tunnel bottom (20.8 m). A tunnel-soil model without piles was also calculated for comparison. Rayleigh damping was employed for the soil model. The two key frequencies in the Rayleigh damping calculation were set as 1 and 100 Hz. The damping ratio and other dynamic parameters for each soil layer are shown in Table 4. To solve the problem of wave reflection at the boundaries, the spring-damper elements were applied on the boundaries, which were widely used in the similar researches [3,64,65]. The dynamic elastic modulus, mass density and Poisson’s ratio of the tunnel lining structure were 42 GPa, 2400 kg/m3, and 0.3, respectively.
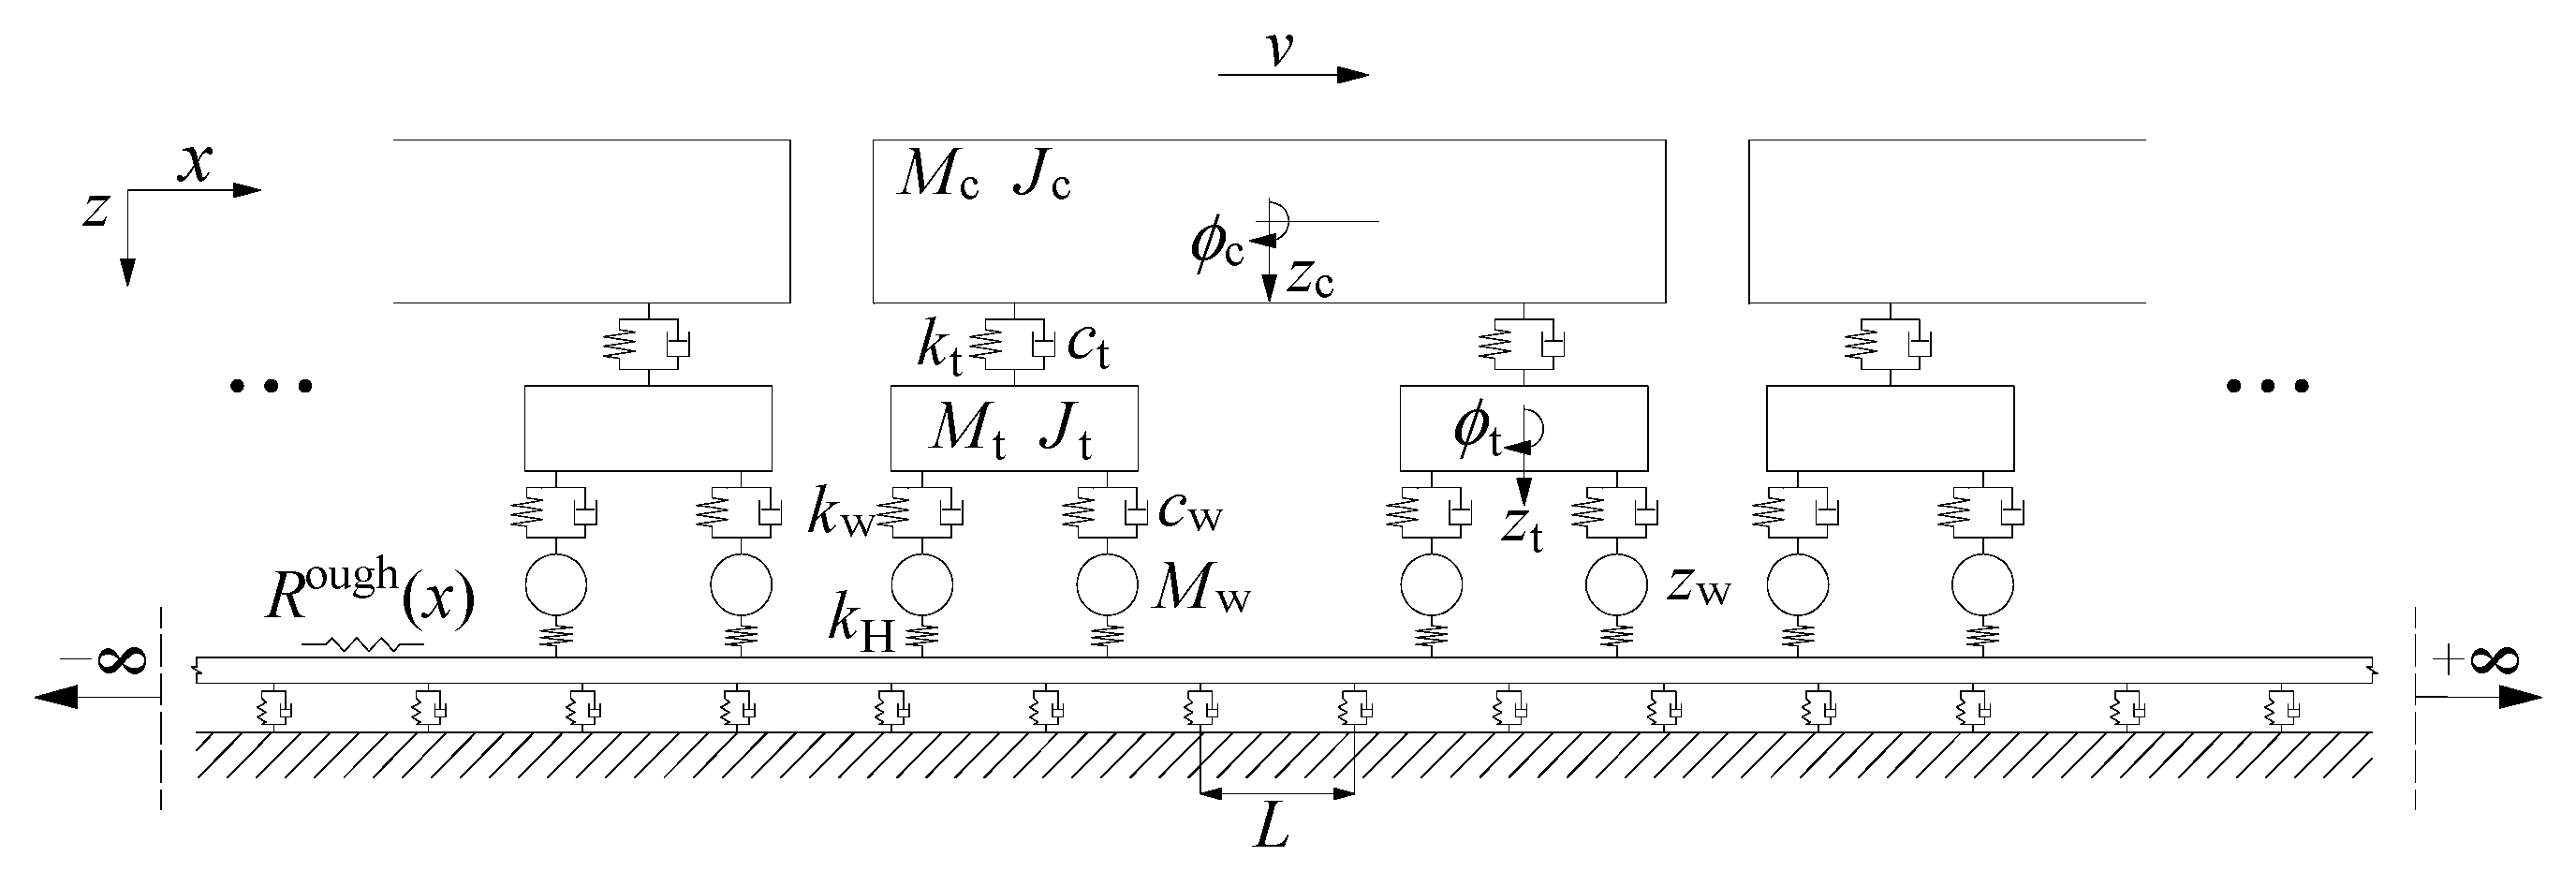
To calculate the moving train loads, the MATLAB-based vehicle-track coupled model was employed [66]. In this 2D model, vehicles include four wheelsets, two bogies and one car body, which were connected by Kelvin elements to model the primary and secondary suspensions. The rail was modelled by an Euler beam with infinite length, which was periodically supported by fasteners modeled by Kelvin elements (Figure 12). The Herzian springs were used to model the contact forces between wheels and rails. A more detailed description of this model can be found in Ref. [66,67].
Table 6 and Table 7 list the parameters for the ballastless track and the vehicle. The running train speed was 60 km/h. Track irregularity was simulated according to the Class 5 track irregularity power spectral density function determined for U.S. railways, which is expressed as follows:
S ( Ω ) = k A v Ω c 2 Ω 2 ( Ω 2 + Ω c 2 ) ,
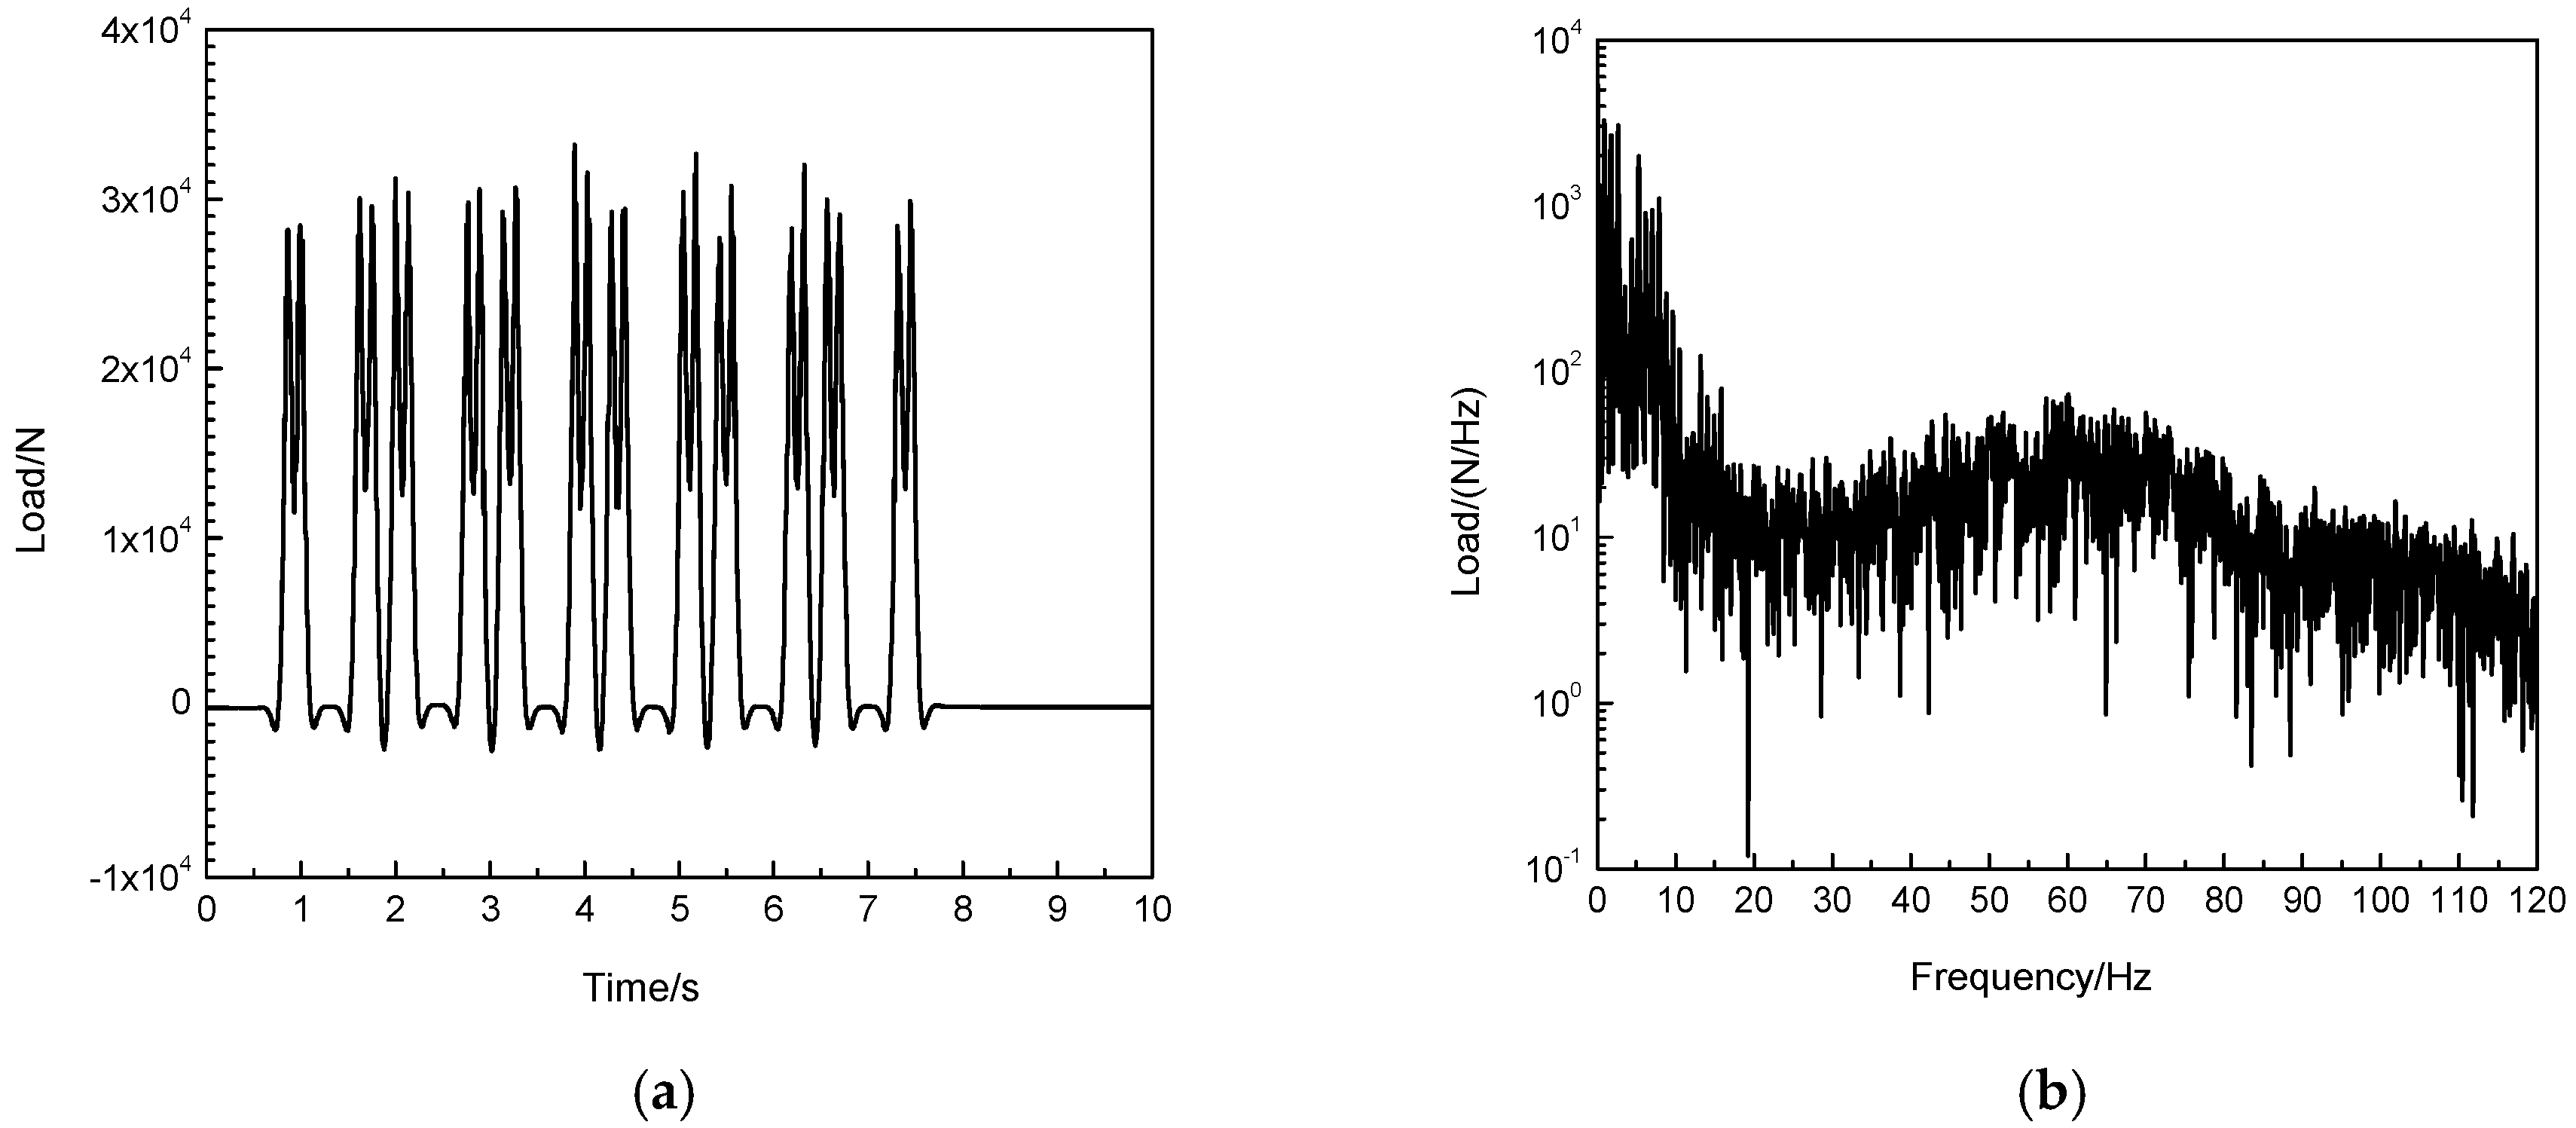
in which k = 0.25, Av = 0.2095, and Ωc = 0.8245. By inputting the train parameters, track parameters, and track irregularity, the dynamic forces under each fastener were calculated and applied to the FE model. A typical time history and Fourier spectrum of the dynamic forces under one fastener are illustrated in Figure 13.

5.2. Ground Vibration Analysis

By applying the train loads to the FE model, the ground vibrations at a distance of 30 m from the tunnel center were calculated. Nine location points were analyzed (corresponding to the measured points A1–A9 illustrated in Figure 3). Figure 14 shows the statistical root-mean-square (r.m.s.) values of the ground vibration responses with and without periodic piles. With periodic piles, the vibration velocity energy was clearly attenuated, with a maximum attenuation of 15%.
Figure 15 illustrates the typical Fourier spectra for ground vibrations with and without periodic piles and the corresponding amplitude attenuation factor, Ar, which is defined as:
A r ( f ) = A w ( f ) A w / o ( f ) ,
where Aw(f) and Aw/o(f) are the Fourier spectra of ground vibrations with and without piles, respectively. Vibrations between 52.4 Hz and 74.3 Hz were effectively attenuated, which correlates with the calculated design band gaps illustrated in Figure 10. The maximum vibration attenuation within the band gaps was 80%. Figure 16a illustrates the ground vibration velocities, averaged for points A1–A9, in one-third octave bands (RoutPRE(fi)), with and without periodic piles. Without piles, the ground vibration responses 30 m from the tunnel center exceeded the VC-C curve, which is similar to the measured results illustrated in Figure 9b. Below 10 Hz, the measured ground vibrations were substantially larger than the calculated vibrations because road traffic and other environmental vibrations contributed to the final measured results.
Based on the vibration power superposition, the vibration responses due to road traffic and metro trains can be determined as follows:
R in PRE ( f i ) = [ R in PRE , m ( f i ) ] 2 + [ R in EXP , r ( f i ) ] 2 ,
where RinPRE,m(fi) is the floor vibration in Room 103 induced by metro trains, which can be determined using the predicted ground vibration and measured transfer function in Equation (2); and RinEXP,r(fi) is the floor vibration in Room 103 induced by road traffic measured during rush hours. The floor vibration in Room 103 induced by different types of traffic were then plotted in Figure 16b,c together with the VC curves. The final floor vibrations were attenuated within the designed band gaps, providing a better environment for more sensitive instrument installation. A comparison of VC curves revealed that vibration attenuation of one level was obtained by employing the periodic piles design. However, due to finite pile length and pile rows, the vibration mitigation effect was still limited compared with other vibration source solutions, such as floating slab tracks.

6. Conclusions

To control the impacts of metro train-induced vibrations on a laboratory containing sensitive instruments, band gaps for periodic piles were designed based on a novel band gap performance evaluation function, Φ. The vibration mitigation effect of the periodic piles was validated by numerical calculation. The main conclusions of this study are as follows:
  • The band gap performance evaluation function can be used to optimize the mitigation effect for periodic piles.
  • With the designed periodic piles, vibrations between 52.4 Hz and 74.3 Hz were effectively attenuated, especially at 63 Hz, which agrees with the calculated design band gaps.
  • A comparison of VC curves revealed that vibration attenuation of one level can be achieved using the periodic piles design. However, due to finite pile length and pile rows, the vibration mitigation effect was still limited. As this study only considered a propagation path solution using periodic piles, the mitigation effects and feasibility of both periodic piles and isolated tracks should be further investigated.

Author Contributions

Conceptualization, M.M. and W.L.; methodology, M.M.; software, B.J. and K.L.; validation, M.M., B.J.; formal analysis, M.M.; investigation, M.M. and B.J.; resources, W.L.; data curation, M.M. and W.L.; writing—original draft preparation, M.M.; writing—review and editing, B.J.; visualization, K.L.; supervision, M.M. and W.L.; project administration, W.L.; funding acquisition, M.M. and W.L. All authors have read and agreed to the published version of the manuscript.

Funding

The research was supported by Beijing Natural Science Foundation (Grant No. 8202040) and National Natural Science Foundation of China (Grant No. 51978043).

Acknowledgments

The authors would like to appreciate Linlin Du from SINOMACH Academy of Science and Technology Co., Ltd. and Jialiang Chen, Linfeng Li and Chao Niu from Beijing Jiaotong University to participate the in-situ measurement.

Conflicts of Interest

The authors declare no conflict of interest.

References

  1. Tao, Z.; Wang, Y.; Zou, C. Assessment of ventilation noise impact from metro depot with over-track platform structure on workers and nearby inhabitants. Environ. Sci. Pollut. Res. 2019, 26, 9203–9218. [Google Scholar] [CrossRef] [PubMed]
  2. Yang, J.; Zhu, S.; Zhai, W.; Kouroussis, G.; Wang, Y.; Wang, K.; Lan, K.; Xu, F. Prediction and mitigation of train-induced vibrations of large-scale building constructed on subway tunnel. Sci. Total Environ. 2019, 668, 485–499. [Google Scholar] [CrossRef] [PubMed]
  3. Ma, M.; Liu, W.N.; Qian, C.Y.; Deng, G.H.; Li, Y.D. Study of the train-induced vibration impact on a historic Bell Tower above two spatial overlapping metro lines. Soil Dyn. Earthq. Eng. 2016, 81, 58–74. [Google Scholar] [CrossRef]
  4. Sadeghi, J.; Esmaeili, M.H. Safe distance of cultural and historical buildings from subway lines. Soil Dyn. Earthq. Eng. 2017, 96, 89–103. [Google Scholar]
  5. Gupta, S.; Liu, W.F.; Degrande, G.; Lombaert, G.; Liu, W.N. Prediction of vibrations induced by underground railway traffic in Beijing. J. Sound Vib. 2008, 310, 608–630. [Google Scholar] [CrossRef]
  6. Ding, D.Y.; Gupta, S.; Liu, W.N.; Lombaert, G.; Degrande, G. Prediction of vibrations induced by trains on line 8 of Beijing metro. J. Zhejiang Univ. SCI. A 2010, 11, 280–293. [Google Scholar] [CrossRef]
  7. Wolf, S. Potential low frequency ground vibration (<6.3 Hz) impacts from underground LRT operations. J. Sound Vib. 2003, 267, 651–663. [Google Scholar]
  8. Chen, C.H.; Huang, T.C.; Ko, Y.Y. In situ ground vibration tests in Southern Taiwan Science Park. J. Vib. Control 2011, 17, 1211–1234. [Google Scholar] [CrossRef]
  9. Takemiya, H. Field vibration mitigation by honeycomb WIB for pile foundations of a high-speed train viaduct. Soil Dyn. Earthq. Eng. 2004, 24, 69–87. [Google Scholar] [CrossRef]
  10. Liu, W.F.; Liu, W.N.; Zhang, H.R.; Ding, D.Y. Study on vibration effect on sensitive equipment due to road traffic and human activities outside and inside physics laboratory. In Proceedings of the 4th International Symposium on Environmental Vibrations (ISEV2009), Beijing, China, 28–30 October 2009; Science Press: Beijing, China, 2009; pp. 214–219. [Google Scholar]
  11. Vogiatzis, K.; Vanhonacker, P. Noise reduction in urban LRT networks by combining track based solutions. Sci. Total Environ. 2016, 568, 1344–1354. [Google Scholar] [CrossRef]
  12. Liang, L.; Li, X.; Yin, J.; Wang, D.; Gao, W.; Guo, Z. Vibration characteristics of damping pad floating slab on the long-span steel truss cable-stayed bridge in urban rail transit. Eng. Struct. 2019, 191, 92–103. [Google Scholar] [CrossRef]
  13. Connolly, D.; Giannopoulos, A.; Fan, W.; Woodward, P.K.; Forde, M.C. Optimising low acoustic impedance back-fill material wave barrier dimensions to shield structures from ground borne high speed rail vibrations. Constr. Build. Mater. 2013, 44, 557–564. [Google Scholar] [CrossRef] [Green Version]
  14. Thompson, D.J.; Jiang, J.; Toward, M.G.R.; Hussein, M.F.M.; Ntotsios, E.; Dijckmans, A.; Coulier, P.; Lombaert, G.; Degrande, G. Reducing railway-induced ground-borne vibration by using open trenches and soft-filled barriers. Soil Dyn. Earthq. Eng. 2016, 88, 45–59. [Google Scholar] [CrossRef]
  15. Talbot, J.P. Base-isolated buildings: Towards performance-based design. Proc. Inst. Civil Eng. Struct. Build. 2016, 169, 574–582. [Google Scholar] [CrossRef]
  16. Ulgen, D.; Ertugrul, O.L.; Ozkan, M.Y. Measurement of ground borne vibrations for foundation design and vibration isolation of a high-precision instrument. Measurement 2016, 93, 385–396. [Google Scholar] [CrossRef]
  17. Liu, X.Z.; Lian, S.L.; Chen, X. Field test for vibration reduction effect of floating slab and Vanguard fastener. In Proceedings of the 3rd International Symposium on Innovation and Sustainability of Modern Railway (ISMR 2012), Nanchang, China, 20–21 September 2012; pp. 91–92. [Google Scholar]
  18. Jia, Y.X.; Liu, W.N.; Wang, W.B.; Zhang, H.G.; Li, K.F. In-situ measurements and study of train induced ground vibration. In Proceedings of the 3rd International Conference on Railway Engineering: Construction and Maintenance of Railway Infrastructure in Complex Environment (ICRE2014), Beijing, China, 1 July 2014; pp. 32–37. [Google Scholar]
  19. Fang, G.; Wang, Y.; Peng, Z.; Wu, T. Theoretical investigation into the formation mechanism and mitigation measures of short pitch rail corrugation in resilient tracks of metros. Proc. Inst. Mech. Eng. Part F J. Rail Rapid Transit 2018, 232, 2260–2271. [Google Scholar] [CrossRef]
  20. Xu, G.H. Dynamic parameter optimization and experimental study of tuned slab damper on metro systems. Shock Vib. 2019, 2019, 1–14. [Google Scholar] [CrossRef]
  21. Wu, B.W.; Chen, G.X.; Lv, J.Z.; Zhu, Q.; Kang, X. Generation mechanism and remedy method of rail corrugation at a sharp curved metro track with Vanguard fasteners. J. Low Freq. Noise Vib. Act. Control 2020, 39, 368–381. [Google Scholar] [CrossRef]
  22. Gao, L.; Liu, C.; Zhao, L.; Cai, X.P. Vibration damping effect analysis of new long sleeper with rubber boots used in Beijing subway. In Proceedings of the 3rd International Conference on Railway Engineering: Construction and Maintenance of Railway Infrastructure in Complex Environment (ICRE2014), Beijing, China, 1 July 2014; pp. 179–184. [Google Scholar]
  23. He, Z.; Yang, X. Dynamic response analysis of an asymmetric coupled vehicle-track system generated by voided elastic two-block sleeper. Shock Vib. 2016, 2016, 1–11. [Google Scholar] [CrossRef] [Green Version]
  24. Xia, H.; Chen, J.G.; Xia, C.Y.; Inoue, H.; Zenda, Y.; Qi, L. An experimental study of train-induced structural and environmental vibrations of a rail transit elevated bridge with ladder tracks. Proc. Inst. Mech. Eng. Part F J. Rail Rapid Transit 2010, 224, 115–124. [Google Scholar] [CrossRef]
  25. Yan, Z.Q.; Markine, V.; Gu, A.J.; Liang, Q.H. Optimisation of the dynamic properties of ladder track to control rail vibration using the multipoint approximation method. J. Vib. Control 2014, 20, 1967–1984. [Google Scholar] [CrossRef]
  26. Jin, H.; Liu, W.N.; Zhou, S.H. Optimization of vibration reduction ability of ladder tracks by FEM coupled with ACO. Shock Vib. 2015, 2015, 1–6. [Google Scholar] [CrossRef]
  27. Ma, M.; Jiang, B.; Li, M.; Sun, X. A laboratory test on the vibration mitigation efficiency of floating ladder tracks. Procedia Eng. 2017, 199, 2705–2710. [Google Scholar] [CrossRef]
  28. Zhai, W.M.; Xu, P.; Wei, K. Analysis of vibration reduction characteristics and applicability of steel-spring floating-slab track. In Proceedings of the 5th International Symposium on Environmental Vibration (ISEV2011), Chengdu, China, 20–22 October 2011; pp. 767–776. [Google Scholar]
  29. Ding, D.Y.; Liu, W.N.; Li, K.F.; Sun, X.J.; Liu, W.F. Low frequency vibration tests on a floating slab track in an underground laboratory. J. Zhejiang Univ. SCI. A 2011, 12, 345–359. [Google Scholar] [CrossRef]
  30. Yuan, X.; Zhu, S.; Xu, L.; Zhai, W.; Li, H. Investigation of the vibration isolation performance of floating slab track with rubber bearings using a stochastic fractional derivative model. Proc. Inst. Mech. Eng. Part F J. Rail Rapid Transit 2019. [Google Scholar] [CrossRef]
  31. Zhu, S.; Yang, J.; Yan, H.; Zhang, L.; Cai, C. Low-frequency vibration control of floating slab tracks using dynamic vibration absorbers. Veh. Syst. Dyn. 2015, 53, 1296–1314. [Google Scholar] [CrossRef]
  32. Zhu, S.; Wang, J.; Cai, C.; Wang, K.; Zhai, W.; Yang, J.; Yan, H. Development of a vibration attenuation track at low frequencies for urban rail transit. Comput.-Aided Civ. Inf. 2017, 32, 713–726. [Google Scholar] [CrossRef]
  33. Fiala, P.; Degrande, G.; Augusztinovicz, F. Numerical modelling of ground-borne noise and vibration in buildings due to surface rail traffic. J. Sound Vib. 2007, 301, 718–738. [Google Scholar] [CrossRef]
  34. Pan, P.; Shen, S.; Shen, Z.; Gong, R. Experimental investigation on the effectiveness of laminated rubber bearings to isolate metro generated vibration. Measurement 2018, 122, 554–562. [Google Scholar] [CrossRef]
  35. Shrivastava, R.K.; Kameswara Rao, N.S.V. Response of soil media due to impulse loads and isolation using trenches. Soil Dyn. Earthq. Eng. 2002, 22, 695–700. [Google Scholar] [CrossRef]
  36. Andersen, L.; Nielsen, S.R.K. Reduction of ground vibration by means of barriers or soil improvement along a railway track. Soil Dyn. Earthq. Eng. 2005, 25, 701–716. [Google Scholar] [CrossRef]
  37. Gao, G.Y.; Li, Z.Y.; Qiu, C.; Yue, Z.Q. Three-dimensional analysis of rows of piles as passive barriers for ground vibration isolation. Soil Dyn. Earthq. Eng. 2006, 26, 1015–1027. [Google Scholar] [CrossRef]
  38. Huang, J.; Shi, Z.F. Vibration reduction of plane waves using periodic in-filled pile barriers. J. Geotech. Geoenviron. Eng. 2015, 141, 04015018. [Google Scholar] [CrossRef]
  39. Albino, C.; Godinho, L.; Amado-Mendes, P.; Alves-Costa, P.; Dias-da-Costa, D.; Soares, D., Jr. 3D FEM analysis of the effect of buried phononic crystal barriers on vibration mitigation. Eng. Struct. 2019, 196, 109340. [Google Scholar] [CrossRef]
  40. Yang, Y.B.; Ge, P.; Li, Q.; Liang, X.; Wu, Y. 2.5D vibration of railway-side buildings mitigated by open or infilled trenches considering rail irregularity. Soil Dyn. Earthq. Eng. 2018, 106, 204–214. [Google Scholar] [CrossRef]
  41. Coulier, P.; Cuéllar, V.; Degrande, G.; Lombaet, G. Experimental and numerical evaluation of the effectiveness of a stiff wave barrier in the soil. Soil Dyn. Earthq. Eng. 2015, 77, 238–253. [Google Scholar] [CrossRef]
  42. Guo, W.; Bai, Z.; Wang, X.; Liu, H.; Bu, D.; Guo, Z.; Hou, W.; Yu, Z. A combination strategy of hollow-closed-wall in-flled trench and elastic bearing for reducing environmental vibration induced by high-speed train. Soil Dyn. Earthq. Eng. 2020, 133, 106136. [Google Scholar] [CrossRef]
  43. Coulier, P.; François, S.; Degrande, G.; Lombaet, G. Subgrade stiffening next to the track as a wave impeding barrier for railway induced vibrations. Soil Dyn. Earthq. Eng. 2013, 48, 119–131. [Google Scholar] [CrossRef] [Green Version]
  44. Thompson, D.J.; Jiang, J.; Toward, M.G.R.; Hussein, M.F.M.; Dijckmans, A.; Coulier, P.; Degrande, G.; Lombaert, G. Mitigation of railway-induced vibration by using subgrade stiffening. Soil Dyn. Earthq. Eng. 2015, 79, 89–103. [Google Scholar] [CrossRef] [Green Version]
  45. Tang, L.; Kong, X.; Li, S.; Ling, X.; Ye, Y.; Tian, S. A preliminary investigation of vibration mitigation technique for the highspeed railway in seasonally frozen regions. Soil Dyn. Earthq. Eng. 2019, 127, 105841. [Google Scholar] [CrossRef]
  46. Gao, M.; Tian, S.P.; Wang, Y.; Chen, Q.S.; Gao, G.Y. Isolation of ground vibration induced by high speed railway by DXWIB: Field investigation. Soil Dyn. Earthq. Eng. 2020, 131, 106039. [Google Scholar] [CrossRef]
  47. Dijkmans, A.; Ekblad, A.; Smekal, A.; Degrande, G.; Lombaet, G. Efficacy of a sheet pile wall as a wave barrier for railway induced ground vibration. Soil Dyn. Earthq. Eng. 2016, 84, 55–69. [Google Scholar] [CrossRef] [Green Version]
  48. Dijkmans, A.; Coulier, P.; Jiang, J.; Toward, M.G.R.; Thompson, D.J.; Degrande, G.; Lombaet, G. Mitigation of railway induced ground vibration by heavy masses next to the track. Soil Dyn. Earthq. Eng. 2015, 75, 158–170. [Google Scholar] [CrossRef] [Green Version]
  49. Paul de Vos, S. Railway Induced Vibration-State of the Art Report; International Union of Railways: Paris, France, 2017. [Google Scholar]
  50. Sun, C.; Gao, L. Medium-to-low-speed freight rail transport induced environmental vibration and analysis of the vibration isolation effect of building slope protection piles. J. Vibroeng. 2017, 19, 4531–4549. [Google Scholar]
  51. Sigalas, M.M.; Economou, E.N. Elastic and acoustic wave band structure. J. Sound Vib. 1992, 158, 377–382. [Google Scholar] [CrossRef]
  52. Kushwaha, M.S.; Halevi, P.; Martínez, G.; Dobrzynski, L.; Djafari-Rouhani, B. Theory of acoustic band structure of periodic elastic composites. Phys. Rev. B 1994, 49, 2313–2322. [Google Scholar] [CrossRef]
  53. Cai, Y.Q.; Ding, G.Y.; Xu, C.J. Amplitude reduction of elastic waves by a row of piles in poroelastic soil. Comput. Geotech. 2009, 36, 463–473. [Google Scholar] [CrossRef]
  54. Huang, J.; Shi, Z. Application of periodic theory to rows of piles for horizontal vibration attenuation. Int. J. Geomech. 2013, 13, 132–142. [Google Scholar] [CrossRef]
  55. Liu, X.; Shi, Z.; Xiang, H.; Mo, Y.L. Attenuation zones of periodic pile barriers with initial stress. Soil Dyn. Earthq. Eng. 2015, 77, 381–390. [Google Scholar] [CrossRef]
  56. Pu, X.; Shi, Z. A novel method for identifying surface waves in periodic structures. Soil Dyn. Earthq. Eng. 2017, 98, 67–71. [Google Scholar] [CrossRef]
  57. Meng, Q.; Shi, Z. Vibration isolation of plane waves by periodic pipe pile barriers in saturated soil. J. Aerosp. Eng. 2019, 32, 04018114. [Google Scholar] [CrossRef]
  58. Ma, M.; Jiang, B.L.; Gao, J.; Liu, W.N. Experimental study on attenuation zone of soil-periodic piles system. Soil Dyn. Earthq. Eng. 2019, 126, 105738. [Google Scholar] [CrossRef]
  59. Amick, H.; Gendreau, M.; Busch, T.; Gordon, C. Evolving criteria for research facilities: I-vibration. In Proceedings of the SPIE Conference 5933: Buildings for Nanoscale Research and Beyond, San Diego, CA, USA, 31 July 2005. [Google Scholar]
  60. Jiang, B.L. Study on Periodic Piles for the Isolation of Train-Induced Environmental Vibration Based on Band Gap Theory. Ph.D. Thesis, Beijing Jiaotong University, Beijing, China, 2019. (In Chinese). [Google Scholar]
  61. Jeong, S.M.; Ruzzene, M. Directional and band-gap behavior of periodic grid-like structures. Smart Structures and Materials. SPIE 2004, 5386, 101–111. [Google Scholar]
  62. Yan, Z.Z.; Wang, Y.S. Wavelet-based method for calculating elastic band gaps of two-dimensional phononic crystals. Phys. Rev. B 2006, 74, 224303. [Google Scholar] [CrossRef]
  63. Lai, Y.; Zhang, Z.Q. Large band gaps in elastic phononic crystals with air inclusions. Appl. Phys. Lett. 2003, 83, 3900. [Google Scholar] [CrossRef]
  64. Gao, G.Y.; Chen, Q.S.; He, J.F.; Liu, F. Investigation of ground vibration due to trains moving on saturated multi-layered ground by 2.5 D finite element method. Soil Dyn. Earthq. Eng. 2012, 40, 87–98. [Google Scholar] [CrossRef]
  65. Xu, Q.; Xiao, Z.; Liu, T.; Lou, P.; Song, X. Comparison of 2D and 3D prediction models for environmental vibration induced by underground railway with two types of tracks. Comput. Geotech. 2015, 68, 169–183. [Google Scholar] [CrossRef]
  66. Ma, L.X. Study on the Model of Coupled Vehicle Track and the Analysis Model for Tunnel-Ground Vibration Response Based on the Periodic-Infinite Structure theory. Ph.D. Thesis, Beijing Jiaotong University, Beijing, China, 2014. (In Chinese). [Google Scholar]
  67. Liu, W.N.; Ma, L.X.; Du, L.L. Analytical Model of Coupled Vehicle-Track Dynamics: On Straight & Curved Track/by Uniform & Variable Speed; Science Press: Beijing, China, 2020. (In Chinese) [Google Scholar]
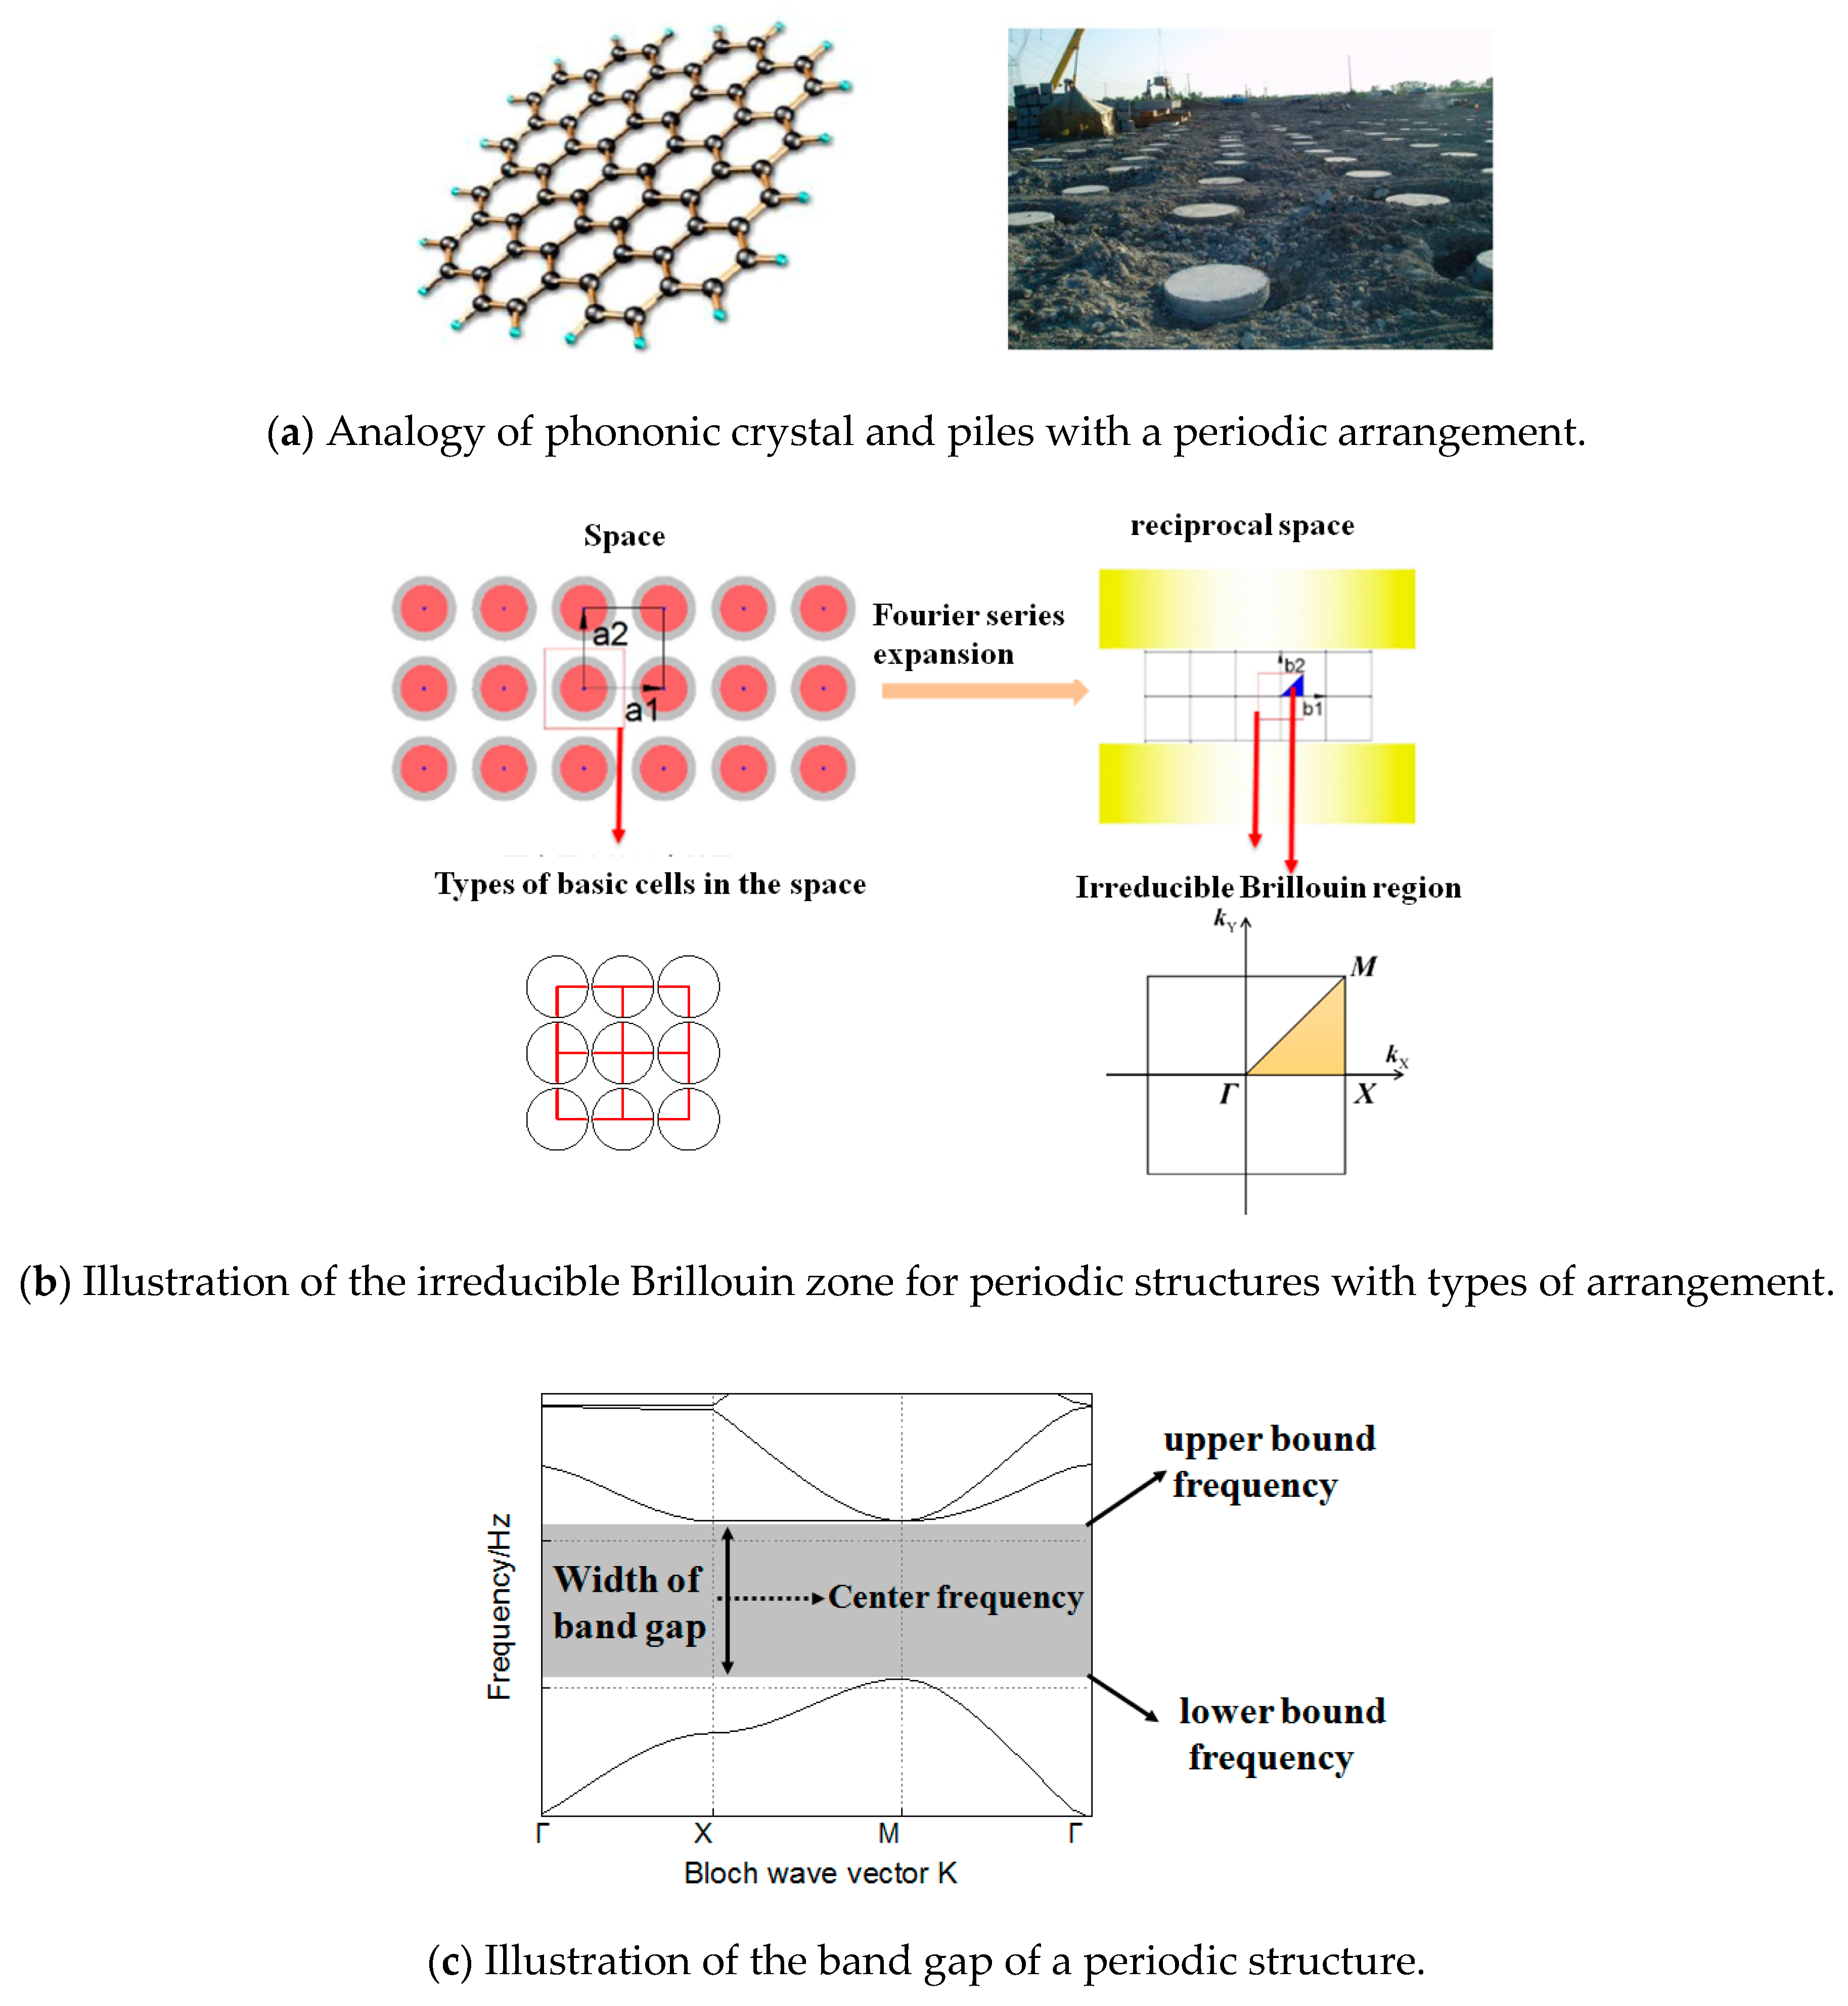
Figure 1. Sketch of periodic structures with a band gap.
Sustainability 12 05871 g001
Figure 2. Sketch of the location relationship between the laboratory building and metro tunnel.
Sustainability 12 05871 g002
Figure 3. Sketch of sensor arrangement.
Sustainability 12 05871 g003
Figure 4. Measured vibration responses in Room 103.
Sustainability 12 05871 g004
Figure 5. Measured vibration responses outside the building.
Sustainability 12 05871 g005
Figure 6. The averaged vibration transfer function HEXP(fi) between the ground outside the building and the floor of Room 103.
Sustainability 12 05871 g006
Figure 7. Comparison of two band gap distributions of periodic piles.
Sustainability 12 05871 g007
Figure 8. The periodic boundary of the basic cell, and the generalized displacement and force of nodes.
Sustainability 12 05871 g008
Figure 9. Measured metro train-induced ground vibrations, 30 m away from the tunnel center: (a) the Fourier spectrum, and (b) velocity in one-third octave bands together with VC curves.
Sustainability 12 05871 g009
Figure 10. Band gap distribution.
Sustainability 12 05871 g010
Figure 11. Tunnel-soil-piles coupled FE model.
Sustainability 12 05871 g011
Figure 12. Vehicle-track coupled model.
Sustainability 12 05871 g012
Figure 13. (a) Time history and (b) Fourier spectrum of the dynamic supporting force under a fastener.
Sustainability 12 05871 g013
Figure 14. Statistical root-mean-square (r.m.s.) values of ground vibration responses with and without periodic piles.
Sustainability 12 05871 g014
Figure 15. (a) Typical Fourier spectrum of ground vibrations with and without periodic piles, and its (b) amplitude attenuation factor.
Sustainability 12 05871 g015
Figure 16. One-third octave vibration velocities (a) on the ground with and without periodic piles, (b) in the laboratory room for point B1, and (c) in the laboratory room for point B2.
Sustainability 12 05871 g016
Table 1. Relative research on vibration-isolating tracks.
SketchMeasures on the TrackTheoretical and Numerical StudyLaboratory TestIn-Situ Measurement
Sustainability 12 05871 i001Floating rail fastener and Vanguard fastenerXu [20], Wu et al. [21]Xu [20]Liu et al. [17], Jia et al. [18]
High resilient rail fastenerFang et al. [19]
Sustainability 12 05871 i002Twin-block booted sleepersGao et al. [22],
He and Yang [23]
Ladder sleeper trackYan et al. [25], Jin et al. [26]Ma et al. [27]Xia et al. [24]
Sustainability 12 05871 i003FST with steel springMa et al. [3], Zhai et al. [28], Ding et al. [29]Ma et al. [3],
Liu et al. [17], Jia et al. [18]
FST with rubber bearingYuan et al. [30]
FST + tuned slab damper/mass blockXu [20], Zhu et al. [31,32], Xu [20], Zhu et al. [32],
Table 2. Research on continuous vibration mitigation measures along the propagation path.
SketchMeasures along the Propagation PathTheoretical and Numerical StudyIn-Situ Measurement
Sustainability 12 05871 i004Open trenchThompson et al. [14], Yang et al. [40]
Sustainability 12 05871 i005Soft-filled barriers/stiff wave barrier/jet grouting wall/hollow isolation wallThompson et al. [14], Yang et al. [40], Coulier et al. [41], Guo et al. [42]Coulier et al. [41]
Sustainability 12 05871 i006Subgrade stiffening beneath or next to the track, WIBTakemiya [9], Coulier et al. [43], Thompson et al. [44], Tang et al. [45]Gao et al. [46]
Sustainability 12 05871 i007Sheet pile wallDijkmans et al. [47]Dijkmans et al. [47]
Sustainability 12 05871 i008Heavy masses along the trackDijkmans et al. [48]
Table 3. Application and interpretation of vibration criteria (VC) curves.
Criterion CurveVibration Limit
between 1 and 4 Hzbetween 4 and 8 Hzbetween 8 and 80 Hz
VC-A-260 μg50 μm/s
VC-B-130 μg25 μm/s
VC-C12.5 μm/s12.5 μm/s12.5 μm/s
VC-D6.25 μm/s6.25 μm/s6.25 μm/s
VC-E3.1 μm/s3.1 μm/s3.1 μm/s
VC-F1.6 μm/s1.6 μm/s1.6 μm/s
VC-G0.78 μm/s0.78 μm/s0.78 μm/s
Table 4. Soil parameters.
Soil LayersDepth (m)Density (kg/m3)Poisson’s RatioElastic Modulus (MPa)S-Wave Velocity (m/s)P-Wave Velocity (m/s)Damping Ratio
Layer 10.917500.492112.2141.110980.05
Layer 234.119900.474576311.814620.04
Layer 3-21000.4721239.9458.720380.03
Table 5. Calculated band gap performance evaluation function Φ for eight cases.
Case No.Lattice FormPeriodic Constant a (m)Pile Radius R, r (m)Lower Frequency (Hz)Upper Frequency (Hz)Bandwidth (Hz)Φ
1 Sustainability 12 05871 i0094.0R = 1.436.572.836.34.36
24.0R = 1.538.078.940.98.98
3 Sustainability 12 05871 i0104.0R = 1.5
r = 1.2
49.878.528.825.03
44.0R = 1.4
r = 1.2
50.772.421.715.27
5 Sustainability 12 05871 i0114.1R = 1.250.876.625.836.37
63.8R = 152.474.321.968.31
7 Sustainability 12 05871 i0124.0R = 1.2
r = 1.1
46.881.334.633.23
84.2R = 1.2
r = 1.0
41.873.734.66.07
Table 6. Track parameters.
Parameter Category *ValueParameter Category *Value
Rail mass per unit length, m121.28 kg/mFastener stiffness, kr1.2 × 108 N/m
Elastic modulus of rail, E2.059 × 1011 N/m2Fastener damping, cr6 × 104 Ns/m
Inertia moment of rail reaction, I6.434 × 10−5 m4Fastener spacing, L0.6 m
Rail loss factor, η0.01
* all track parameters correspond to two rails.
Table 7. Train parameters.
Parameter CategoryValueParameter CategoryValue
Vehicle body mass, Mc4.3 × 104 kgSecondary suspension stiffness, kt5.8 × 105 N/m
Bogie mass, Mt3.6 × 103 kgSecondary suspension damping, ct1.6 × 105 Ns/m
Wheelset mass, Mw1.7 × 103 kgPrimary suspension stiffness, kw1.4 × 106 N/m
Vehicle body mass inertia moment, Jc1.7 × 106 kg·m2Primary suspension damping, cw5 × 104 Ns/m
Bogie mass inertia moment Jt9.62 × 103 kg·m2Semi fixed distance b6.3 m
Wheel-rail contact constant G5.147 × 10−8 m/N2/3Semi wheelbase a1.1 m
Train length l19 mStatic wheel-rail force P07 × 104 N