Article

The Transition from Unregulated to Regulated Fishing in Thailand

by
Nipa Kulanujaree
1,2,*,
Krishna R Salin
1,*,
Pavarot Noranarttragoon
3 and
Amararatne Yakupitiyage
1
1
Aquaculture and Aquatic Resources Management, School of Environment, Resources and Development, Asian Institute of Technology, Pathumthani 12120, Thailand
2
Upper Gulf Fisheries Research and Development Center (Samut Prakan), Samut Prakan 10130, Thailand
3
Fisheries Resource Assessment Group, Marine Fisheries Research and Development Division, Department of Fisheries, Bangkok 10900, Thailand
*
Authors to whom correspondence should be addressed.
Sustainability 2020, 12(14), 5841; https://doi.org/10.3390/su12145841
Submission received: 20 April 2020 / Revised: 14 July 2020 / Accepted: 16 July 2020 / Published: 20 July 2020
(This article belongs to the Section Sustainable Agriculture)

Abstract

:
Marine fishery is an economically important sector and the primary source of livelihood for coastal fishers in Thailand, but the open access harvesting system and overfishing have depleted fish stocks. The country should address both the issues to sustain a healthy marine fishery and protect the lucrative export market as well as to maintaining seafood self-sufficiency. This paper explains the on-going processes of implementing the measures of restricting the number and size of fishing vessels and fishing efforts to control fishing capacity. The marine resources in the Gulf of Thailand and the Andaman Sea are categorized into three separate species groups: (1) demersal, (2) pelagic, and (3) anchovies. The precautionary approach is used as the guiding principle, and maximum sustainable yield (MSY) of the three combined resource categories is used as a reference point in setting the total allowable catch (TAC) limits in this exercise. The number of fishing days per vessel per year is stipulated by issuing licenses based on the TAC size and total allowable effort (TAE). Both the advantages and disadvantages of the current fishing allocation system are discussed.

1. Introduction

Marine fisheries are an economically important sector for the livelihood of Thai people, especially the fishers in the Gulf of Thailand and the Andaman Sea. Fisheries in Thailand comprise of both commercial and small-scale ventures and contributed approximately 2.4 million tons to the world’s total fisheries production in 2017, of which 1.3 million tons came from marine fisheries production [1]. The fisheries sector directly provides jobs for about 172,430 fishers, the majority (82%) of whom are migrant workers, and for just over 0.5 million people in the supporting industries, mostly women. The workforce includes unskilled laborers working on-board fishing vessels or in fish processing plants, as well as skilled labors such as the master fishers or technicians [2]. While fish is the preferred and an affordable protein source that significantly contributes to the nutritional health of the people in Thailand, especially the rural folks, it supports the livelihoods, incomes, and employment of artisanal fishers in over 2500 coastal villages. Thailand is globally well-known as both a seafood exporter and an importer. In 2017, the country exported 1.5 million tons in total valued at USD 6722 million and imported 1.9 million tons of fish products valued at USD 3843 million [1]. The country’s per capita fish consumption ranges from 25 to 35 kg, and the fisheries sector contributes around 0.8% to the country’s GDP, or 9.28% to the agricultural sector GDP in 2016. As with the other Asian nations, Thailand has a multi-gear, multi-species fishery that employs fishing vessels of various designs and sizes, as well as a multitude of fishers and stakeholders, and exploits overlapping fishing grounds, contributing to the complexities in the country’s socio-economic conditions. This makes it a challenge to both local and national fishery management authorities, as the complexity is beyond the capability of the conventional fisheries management regimes to concur [3].
The long-term sustainability of the marine fishery and product exports is threatened due to unrestricted access, overcapacity of the Thai fishing fleet, and unauthorized fishing inside and outside of Thai waters [2]. The overcapacity of the fishing fleet adversely affects the fisheries resources worldwide, is considered one of the main obstacles for achieving sustainability [4], and increases the number of overexploited fish stocks [3]. The regulations related to restricting the number of fishing vessels in operation and fishing efforts have not been implemented or enforced by Thai authorities in the past, primarily because the Thai fishery has always been considered to be an open-access common property system. Globally, the open-access fishery has been recognized as a major cause of stock depletion and collapse [5]. Recently, the Thai Department of Fisheries (DOF) has committed to follow through the sustainable development goal 14 (SDG 14) of the United Nations, which encourages countries to regulate harvest levels to maintain fish stocks at a biologically sustainable level and, to end, overfishing [6,7]. The DOF desired to implement science-based fisheries management plans to restore damaged fish stocks at least to levels that could produce a maximum sustainable yield (MSY). Moreover, in 2015, Thailand developed a national plan of action to prevent, deter, and eliminate illegal, unreported, and unregulated fishing (NPOA-IUU) and set a goal to make an “IUU-free Thailand” as a priority policy in order to achieve a sustainable, environmental and socially-friendly fishery and seafood industry [2,8]. The Royal Ordinance on Fisheries, 2015 and its amendment of 2017, specified that the fishing rights must be based on science-based management that is aligned with the fishing capacity and the MSY of aquatic animals to maintain the sustainable fisheries [9,10].
However, as it is challenging to control catch in a multi-gear, multi-species fishery, Thailand decided to use the input (fishing effort) control approach to manage its marine fishery. This paper explains the on-going processes in Thailand aimed at implementing fishing capacity controls (restrictions on number and size of fishing vessels), and controlling fishing effort (vessel usage; the amount of time a particular fishing vessel is allowed to fish) based of the total allowable catch (TAC). In Thailand, MSY was used as a reference point for management, while TAC was converted to the total allowable effort (TAE) to stipulate the fishing effort and allocate the resources for individual fishing vessels. The DOF expects to eliminate unauthorized fishing by implementing the new license procedure to manage the Thai fishing vessels. A comparison was made in this paper of the changes in fisheries management scenarios before and after the regulatory interventions by the DOF using fisheries statistics covering the period from just before 2015 to 2018. The advantages and disadvantages of implementing the system were analyzed. It is expected that these findings will provide a valuable case study for other developing nations in their efforts to establish an effective fisheries management plan that deals with overfishing and overcapacity, particularly in Asia, and offer lessons from Thailand’s experience that can be adapted to suit their similarly complex fisheries systems.

2. Materials and Methods

The study used primarily the quantitative and qualitative data compiled by the Department of Fisheries, i.e., DOF Fisheries Statistics 1980–2017. Fisheries statistics from both artisanal fishing and commercial fishing vessels and research vessels were used to calculate the MSY. In-depth interviews were conducted using unstructured questionnaires and involving the fishery officials and subject experts working in relevant DOF units, to gather information on the detailed process of analyzing the MSY, setting MSY reference points, allocating efforts, and the development of the licensing procedures during the setting of novel regulations in 2015. The questions were open-ended to allow the free flow of information. Secondary sources such as published articles, newspaper clippings, government reports/manuals, annual reports of Marine Fisheries Research and Development Division, and DOF notifications were also referred to in compiling the historical information before 2015.

2.1. Data Description

2.1.1. Fisheries Statistics

The statistical data on marine capture fisheries were divided into two parts: artisanal fisheries and commercial fisheries. The fishing areas were separated into two regions; the Gulf of Thailand and the Andaman Sea, and both regions were divided into two localities; inside and outside of Thai waters based on the Exclusive Economic Zone (EEZ). Figure 1 shows the data collection areas. The Gulf of Thailand (GOT) was divided into five sub-areas: inside the Thai waters (area 1 to 5) and two sub-areas outside the Thai waters (areas A and B). The Andaman Sea was divided into two sub-areas: inside the Thai waters (areas 6 and 7) and three areas outside the Thai waters (areas C, D, and E) [11].
Before 2015, fisheries statistics were collected from fishing vessels that were classified by type of fishing gears, viz., otter board trawl, pair trawl, beam trawl, purse seine, anchovy purse seine, push net, king mackerel drift gill net, and Indo-Pacific mackerel encircling gill net, all of which were classified as commercial fishing gears while the others were classified as artisanal fishing gears. These commercial fishing gears were divided into four classes of length overall (LOA): vessels less than 14.00 m LOA, 14.00–18.00 m LOA, 18.01–25.00 m LOA, and vessels bigger than 25.00 m LOA. The survey, which covered 22 coastal provinces, was conducted by fisheries provincial officers following the advice of the statisticians from the DOF Fisheries Statistics Analysis and Research Group [12]. Artisanal fisheries data were collected using a stratified two-stage sampling technique by choosing the fisherfolk villages in each province and counting the number of fishing households, and fishing gear types used. Five fishers of each fishing gear type per village per month were chosen to collect the fisheries data, but if less than five fishers were using each fishing gear, the data were collected from all fishers. In case one fisher uses more than one fishing gear, the data were collected from all fishing gears [13].
The commercial fisheries data were collected using the Stratified Random Sampling technique, where 10% of the vessels with licenses in each type of fishing gear were sampled. Besides, the otter board trawl and pair trawl were sampled using the four LOA classes of fishing vessels [12].
After 2015, the artisanal and commercial fisheries were divided into five groups based on the size of vessels in gross tons (GT): (1) artisanal fishing vessels (less than 10 GT), (2) commercial fishing vessels size S (10 to < 30 GT), (3) commercial fishing vessels size M (30 to < 60 GT), (4) commercial fishing vessels size L (60 to < 150 GT), and (5) commercial fishing vessels size X (>150 GT). In addition, fishing vessels less than 10 GT that use the seven types of fishing gears, viz., pair trawl, otter board trawl, beam trawl, purse seine, anchovy purse seine, all dredges, and light luring vessels were classified as commercial fishing vessels size SS [14]. The following new activities and tools provided information for the analyses of the fisheries data [15].
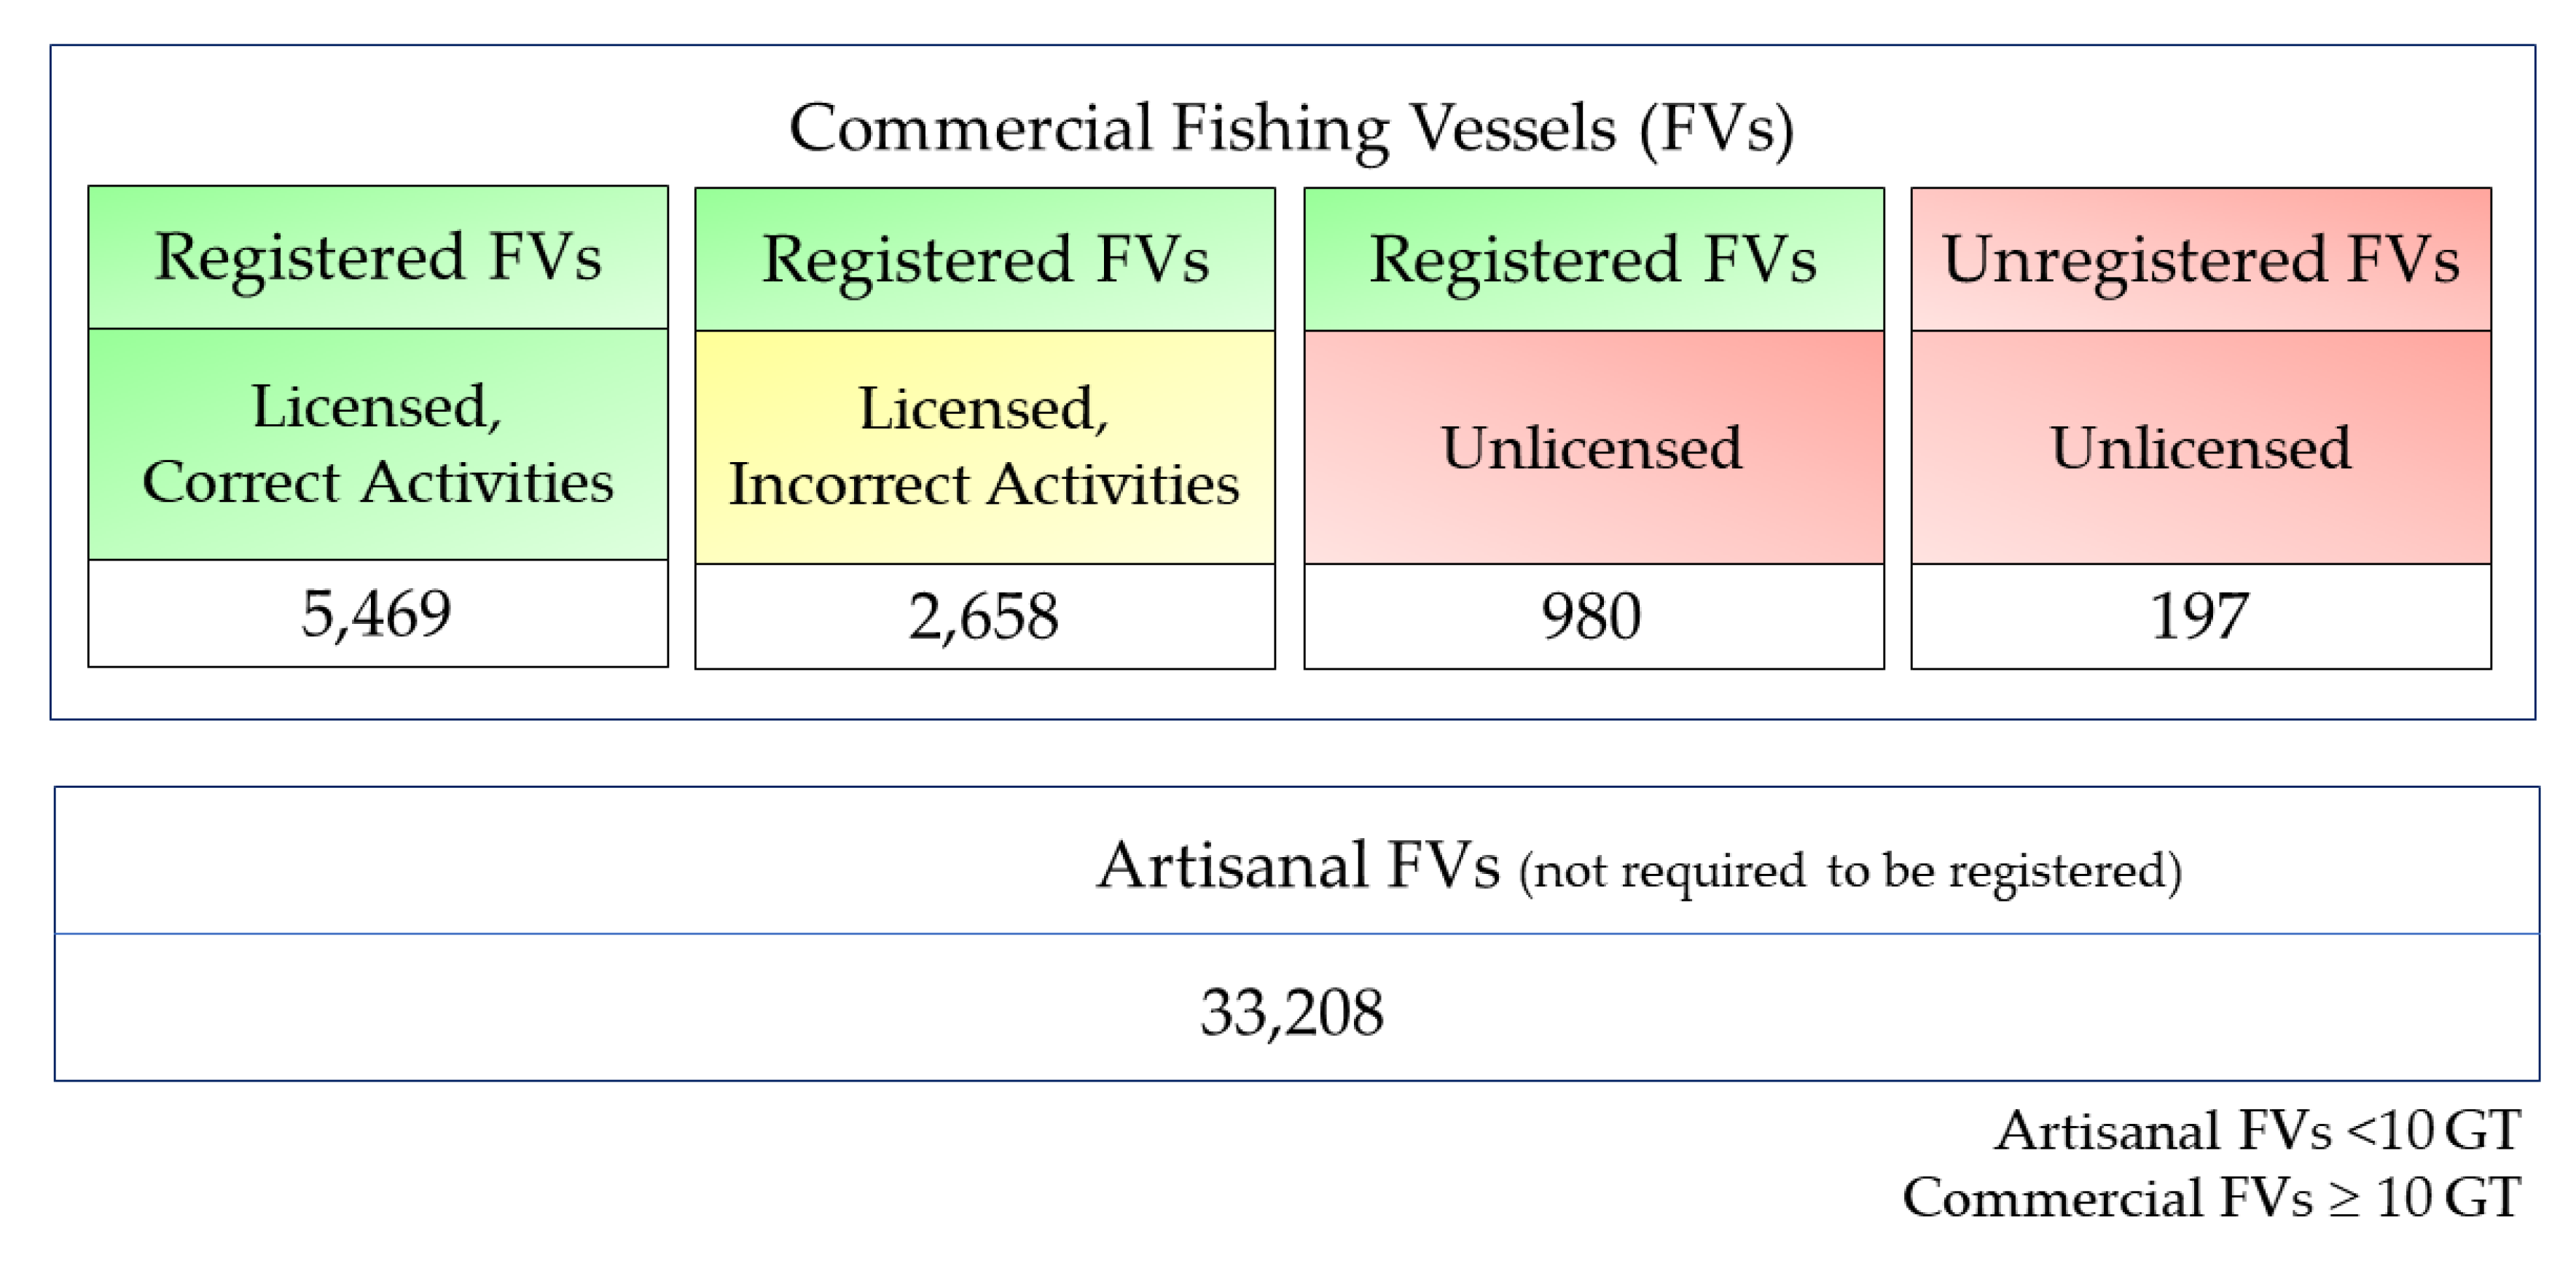
  • E-license system: number of licensed fishing vessels by gear and size of vessels;
  • Fishing Info system (the electronic information system of port-in port-out of fishing vessel): vessel name and registration, fishing gear, issuance date, and time of departure-arrival at port;
  • Thai Flagged Catch Certification System (Fishing Logbook and Landing Declaration Information): departure-arrival date, fishing gears, fishing areas, the total weight of catch, catch by species;
  • Vessel Monitoring System (VMS): fishing grounds (latitude, longitude);
  • Field survey data at fishing ports, fishing effort, and catch composition: collected and compiled by the Marine Fisheries Research and Development Division.
The regulations are set according to the size of fishing vessels. For example, all commercial fishing vessels need to register with the Marine Department, ≥10 GT vessels need to submit fishing logbook, ≥30 GT fishing vessels and all sizes of fishing vessels using trawl, purse seine, and an anchovy falling net need to port-in port-out, and ≥30 GT fishing vessels need to install VMS equipment [15]. Therefore, the sources of data and the statistical data collected were different and could be divided into four groups:
  • Artisanal fisheries: The source of data was from field surveys that covered 22 coastal provinces of Thailand and conducted by provincial fisheries officers following the advice of statisticians from the DOF Fisheries Statistics Analysis and Research Group, which was the same as before 2015, but the total number of vessels (N) was based on the fleet survey in 2015. The provincial officers surveyed the number of vessels using certain types of fishing gear and the fishers who used fishing gears without vessels sampled 10% of vessels that used each type of fishing gear and collected monthly data at the district level. Catch composition and fishing effort data from the field survey at landing sites by Marine Fisheries Research and Development Division were used to calculate the catch composition and effort of fishing vessels. Production and fishing effort of each fishing gear were classified by the fishing area.
  • Commercial fishing vessels less than 10 GT: Data were collected from field surveys that covered 22 coastal provinces of Thailand by provincial fisheries officers following the advice of statisticians from the DOF Fisheries Statistics Analysis and Research Group. Fishing vessels were sampled from 10% of the vessels with a license in each type of fishing gear. Catch composition and fishing effort from field survey data at fishing ports by Marine Fisheries Research and Development Division were used to calculate catch composition and effort of fishing vessels.
  • Commercial fishing vessels 10 to <30 GT: Data were collected from the fishing logbook and Landing Declaration from the Thai Flagged Catch Certification System and Marine Fisheries Research and Development Division.
  • Commercial fishing vessels ≥30 GT: Data were collected from all sources mentioned above.

2.1.2. Research Vessel Survey Data

The survey for research vessel data was conducted by five research vessels (four in the Gulf of Thailand and one in the Andaman Sea) under five centers of the Marine Fisheries Research and Development Division namely, (1) Eastern Fisheries Research and Development Center (Rayong), (2) Upper Gulf Fisheries Research and Development Center (Samut Prakan), (3) Central Gulf Fisheries Research and Development Center (Chumphon), (4) Southern Gulf Fisheries Research and Development Center (Songkhla), and (5) Andaman Sea Fisheries Research and Development Center (Phuket). Each research vessel is equipped with otter board trawl and operated four times a year, and the survey stations are shown in Table 1 and Figure 2 [16]. The efficiencies of four research vessels in the Gulf of Thailand were tested by comparing their catch per unit of effort (CPUE), and the result showed that they were not significantly different [17]. Therefore, the survey results from all vessels could be used to represent the resource status in the entire Gulf of Thailand. Catch per unit of effort (CPUE) of research vessel in kg per hour is calculated by the equation as follows.
C P U E = i = 1 n C a t c h i = 1 n E f f o r t
where Catch is the catch of research vessel in kg, Effort is the trawling time in hours, and “n” is the number of trawl operations 1, 2, 3, …, n.

2.2. Assessment of MSY by Fox Model

The MSY assessment was conducted for three species groups, viz., demersal fishes, pelagic fishes, and anchovies. The demersal fish group refers to all bottom faunas including demersal fishes, squids, shrimps, and crabs. The Thai fisheries are characterized by multi-gear and multi-species fisheries, in which one type of fishing gear can be used to catch several species, and one species of fish can be caught by different types of fishing gear. Therefore, the standard fishing gear method was used to standardize the effort before combining the catch and effort of all the different fishing gears using the following equation:
F S T D = T o t a l   c a t c h C P U E S T D
where FSTD is the standard effort of a species group and CPUE is catch per unit effort of standard fishing gear.
The unit of effort for the demersal fish group was “kg per hour” while that for pelagic fish and anchovy group was “kg per day”. The standard fishing gear of each group was chosen from the main fishing gear that contributes to a majority of the catch. However, because of its high diversity of fishing gears and species involved for the demersal fish group, the research vessel was used as the standard gear. Time series data of total catch from fisheries statistics and CPUE of the standard fishing gears were used as the inputs to calculate the standard effort (Equation (2)).
Total catch and standardized effort were used as inputs to the surplus production model to calculate the MSY. Fox surplus production model [18] was chosen to estimate the biological reference point or optimum fishing effort (fMSY) for sustainable fisheries. The equilibrium yield in Fox model is given by:
y i f i = e c + d f i
where y is yield (kg), f is the fishing effort (hour or day), and c and d are constants obtained by fitting a linear regression.
MSY = ( 1 / d ) e c 1
F MSY = 1 / d

2.3. Allocation of Fishing Effort for the Total Allowable Catch (TAC)

For allocation of fishing effort with the precautionary approach, total allowable catch (TAC) was set at 95% of MSY in each marine resource group. TAC was then allocated to each vessel based on the assumptions that each fishing vessel could operate at their full potential of fishing, fishers still got sufficient profit to sustain their livelihoods, and every fishing vessel with a fishing license had been permitted to carry out fishing while not allowing new entrants, thus aiming to reduce social and economic impacts. Therefore, the number of fishing days per year was recalculated to allocate the total annual effort to each fishing vessel based on TAC using the following steps:
  • Allocate TAC to artisanal vessels based on the current catch, and the number of artisanal fishing vessels from the survey done in 2015.
    T A C A r t i s a n a l = c u r r e n t   c a t c h   o f   a r t i s a n a l   v e s s e l s
  • Calculate the average of CPUE (kg/day) based on the current catch by dividing the size of the fishing vessel to the class interval of 10 GT; size less than 10, 10–19.99, 20–29.99, 30–39.99,…, 190–199.99 GT.
    C P U E A Z   = C a t c h A Z F i s h i n g   e f f o r t A Z
    where CPUEAZ is the CPUE of gear A in class interval Z in kg/day, CatchAZ is the annual total catch of gear A in kg/year, Fishing effortAZ is the annual total fishing effort of gear A in class interval Z in the number of fishing days in a year.
  • Allocate fishing effort to commercial fishing vessels using low-efficiency gears by fixing the number of fishing days (365 days minus the days before and after a fishing trip, annual holidays such as New Year, and the days for vessel maintenance). All fishing vessels get the same number of fishing days.
    N A Z     C P U E A Z d = E s t i m a t e d   t o t a l   c a t c h A Z
    where NAZ is the number of the fishing vessels using gear A in class interval Z, d is the number of fishing days in a year, and Estimated total catchAZ is the estimated annual total catch of gear A in class interval Z in kg/year.
  • Calculate the estimated total catch of gear A by adding all class intervals of gear A.
  • Calculate the TAC for commercial fishing vessels using low-efficiency gear by summation of the estimated total catch of all fishing vessels using low-efficiency gear.
  • Calculate the TAC for commercial fishing vessels using high-efficiency gears.
    T A C C o m m e r c i a l   h i g h   e f f i c i e n c y   = T A C T A C A r t i s a n a l T A C C o m m e r c i a l   l o w   e f f i c i e n c y
    where TACCommercial high efficiency is the TAC for commercial fishing vessels using gear with high efficiency in kg/year, TACArtisonal is the TAC for artisanal fishing vessels in kg/year, TACCommercial low efficiency is the TAC for commercial fishing vessels using gear with low efficiency in kg/year.
  • Allocate fishing effort to commercial fishing vessels using high-efficiency gears, calculate the estimated fishing days of all gears assuming that all commercial fishing vessels using high-efficiency gears in the same species groups (demersal fishes, pelagic fishes, and anchovies) get the same number of fishing days by using the Equation (8).
  • Calculate the total catch of all gears in each species group by adding the estimated total catch in all class intervals of all gears in the same species group and adjust the number of fishing days if the result is over or under TAC of commercial fishing vessels using high-efficiency gears in each species group.

3. Results

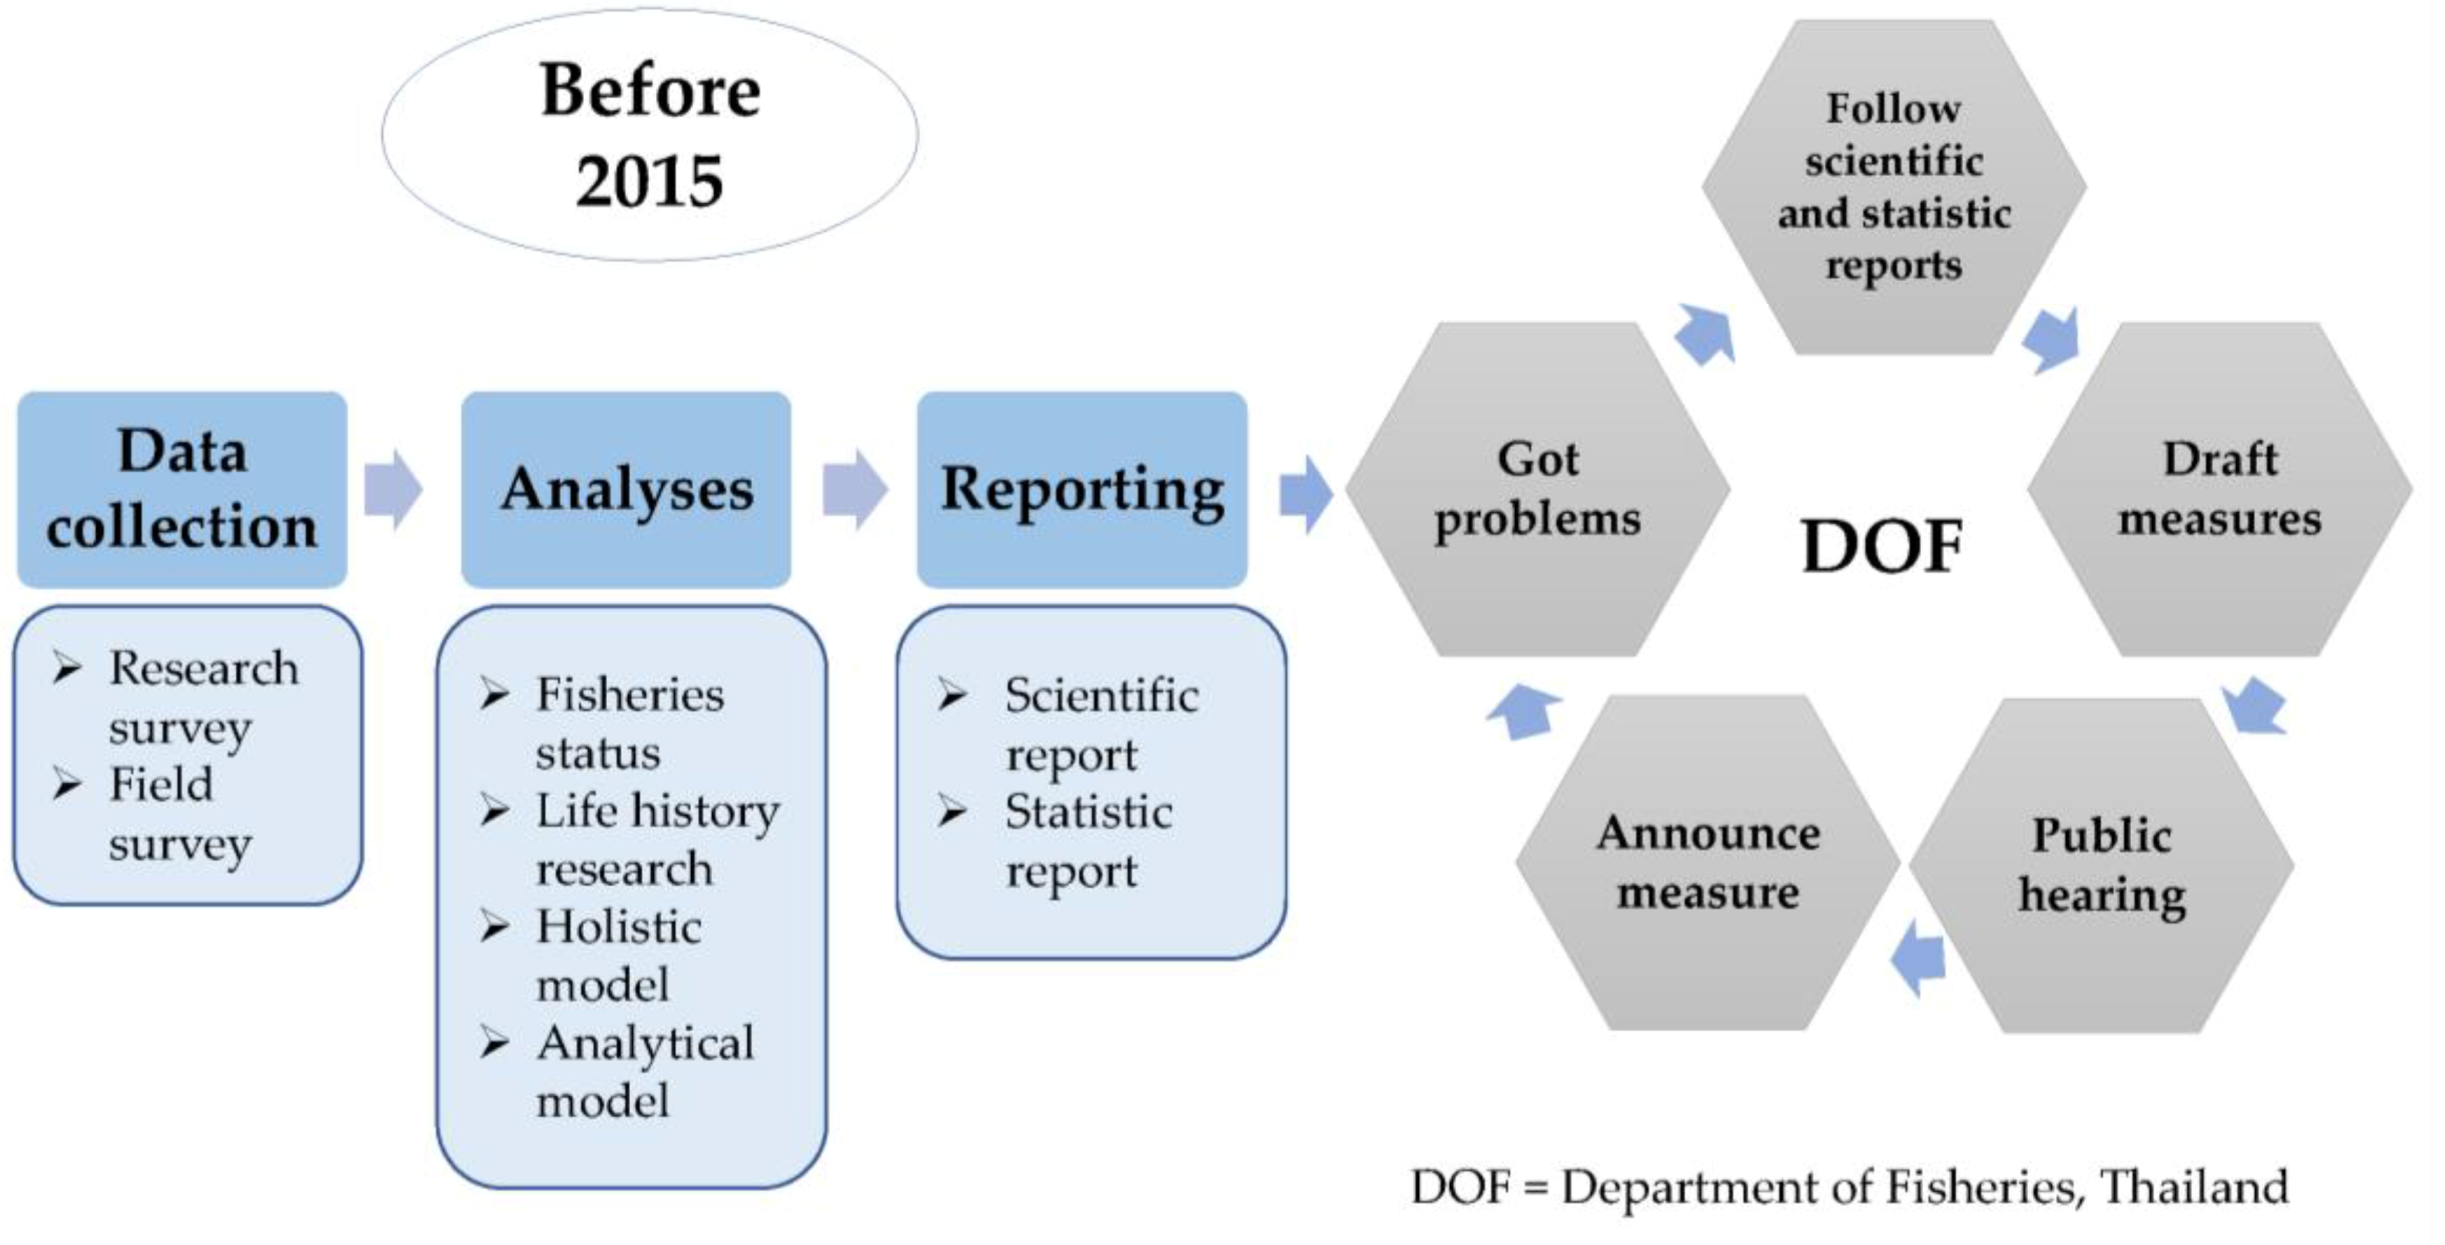
3.1. An Overview of the Open-Access Management Regime before 2015

Thai marine fisheries management process before 2015 is illustrated in Figure 3. The development and implementation of rules and regulations on management of the fishery were based on the analysis of fisheries statistics including catch, effort, species composition, life history, the size distribution of the catch and data compiled by the research vessels, and data gathered by field surveys of artisanal and commercial vessels that were analyzed using holistic and analytical models. The single species stock assessment using length-based analytical models (for example, Thomson and Bell model) was used for more than 20 species in Thailand; for example: Rastrelliger kanagurta, Decapterus maruadsi, Megalaspis cordyla, Sardinella gibbosa, Selar crumenophthalmus, Selaroides leptolepis, Encrasicholina heteroloba, E. devisi, E. punctifer, Priacanthus tayenus, Nemipterus hexodon, N. bipunctatus, Saurida elongata, S. undosquamis, Upeneus sulphureus, Photololigo duvaucelii, Portunus pelagicus, and Penaeus merguiensis to name a few [19,20,21,22,23,24,25,26,27,28,29,30,31,32,33,34,35,36,37]. The problems of declining stock and the capture of juvenile fish were recognized from these analyses, and measures such as mesh size limitations, declaration of closed areas and seasons were developed for stock recovery and followed for several years without notable successes [8]. The problems, however, continued to grow as the fishing vessel registration and a licensing system were inadequate and not effectively enforced; therefore, there was no reliable accounting for the number of vessels. While fishing vessels were registered by the Marine Department under the Ministry of Transport, fishing licenses were issued locally by the district offices of the Department of Fisheries (DOF) under the Ministry of Agriculture and Cooperatives with no centralized database showing information on fishing licenses issued nationwide. Besides, there were no inspections carried out after the issuance of the licenses. Therefore, one fishing license could be applied for more than one fishing vessel, which led to fake, duplicated, or double licensing. For example, DOF had the regulation to control the number of trawl vessels in the fishery, but unknowingly, the numbers were on a gradual increase. The trawl fishers found a loophole of regulations and registered the vessels with other types of fishing gears such as purse seines, squid falling nets, and gill nets. Hence, the exact number of fishing vessels was unknown, which is an essential piece of information to allocate fishing licenses.
In November 2015, Thailand launched the national fishing fleet survey, in which 9304 and 33,208 vessels were classified as commercial and artisanal, respectively. The commercial vessels were further divided into four groups based on the status of their registration and the fishing gear licenses; (1) 5469 vessels correctly registered and licensed for their fishing activities; (2) 2658 vessels were engaging in a different fishing activity than they were registered and licensed for; (3) 980 vessels that were registered but with no fishing license; and (4) 197 vessels that were neither registered nor with a fishing license (Figure 4). As part of the regulatory action, the groups 3 and 4 were permanently prohibited from engaging in any fishery activity, and group 2 vessels were instructed to engage in the fishing activities for which they were licensed [8].

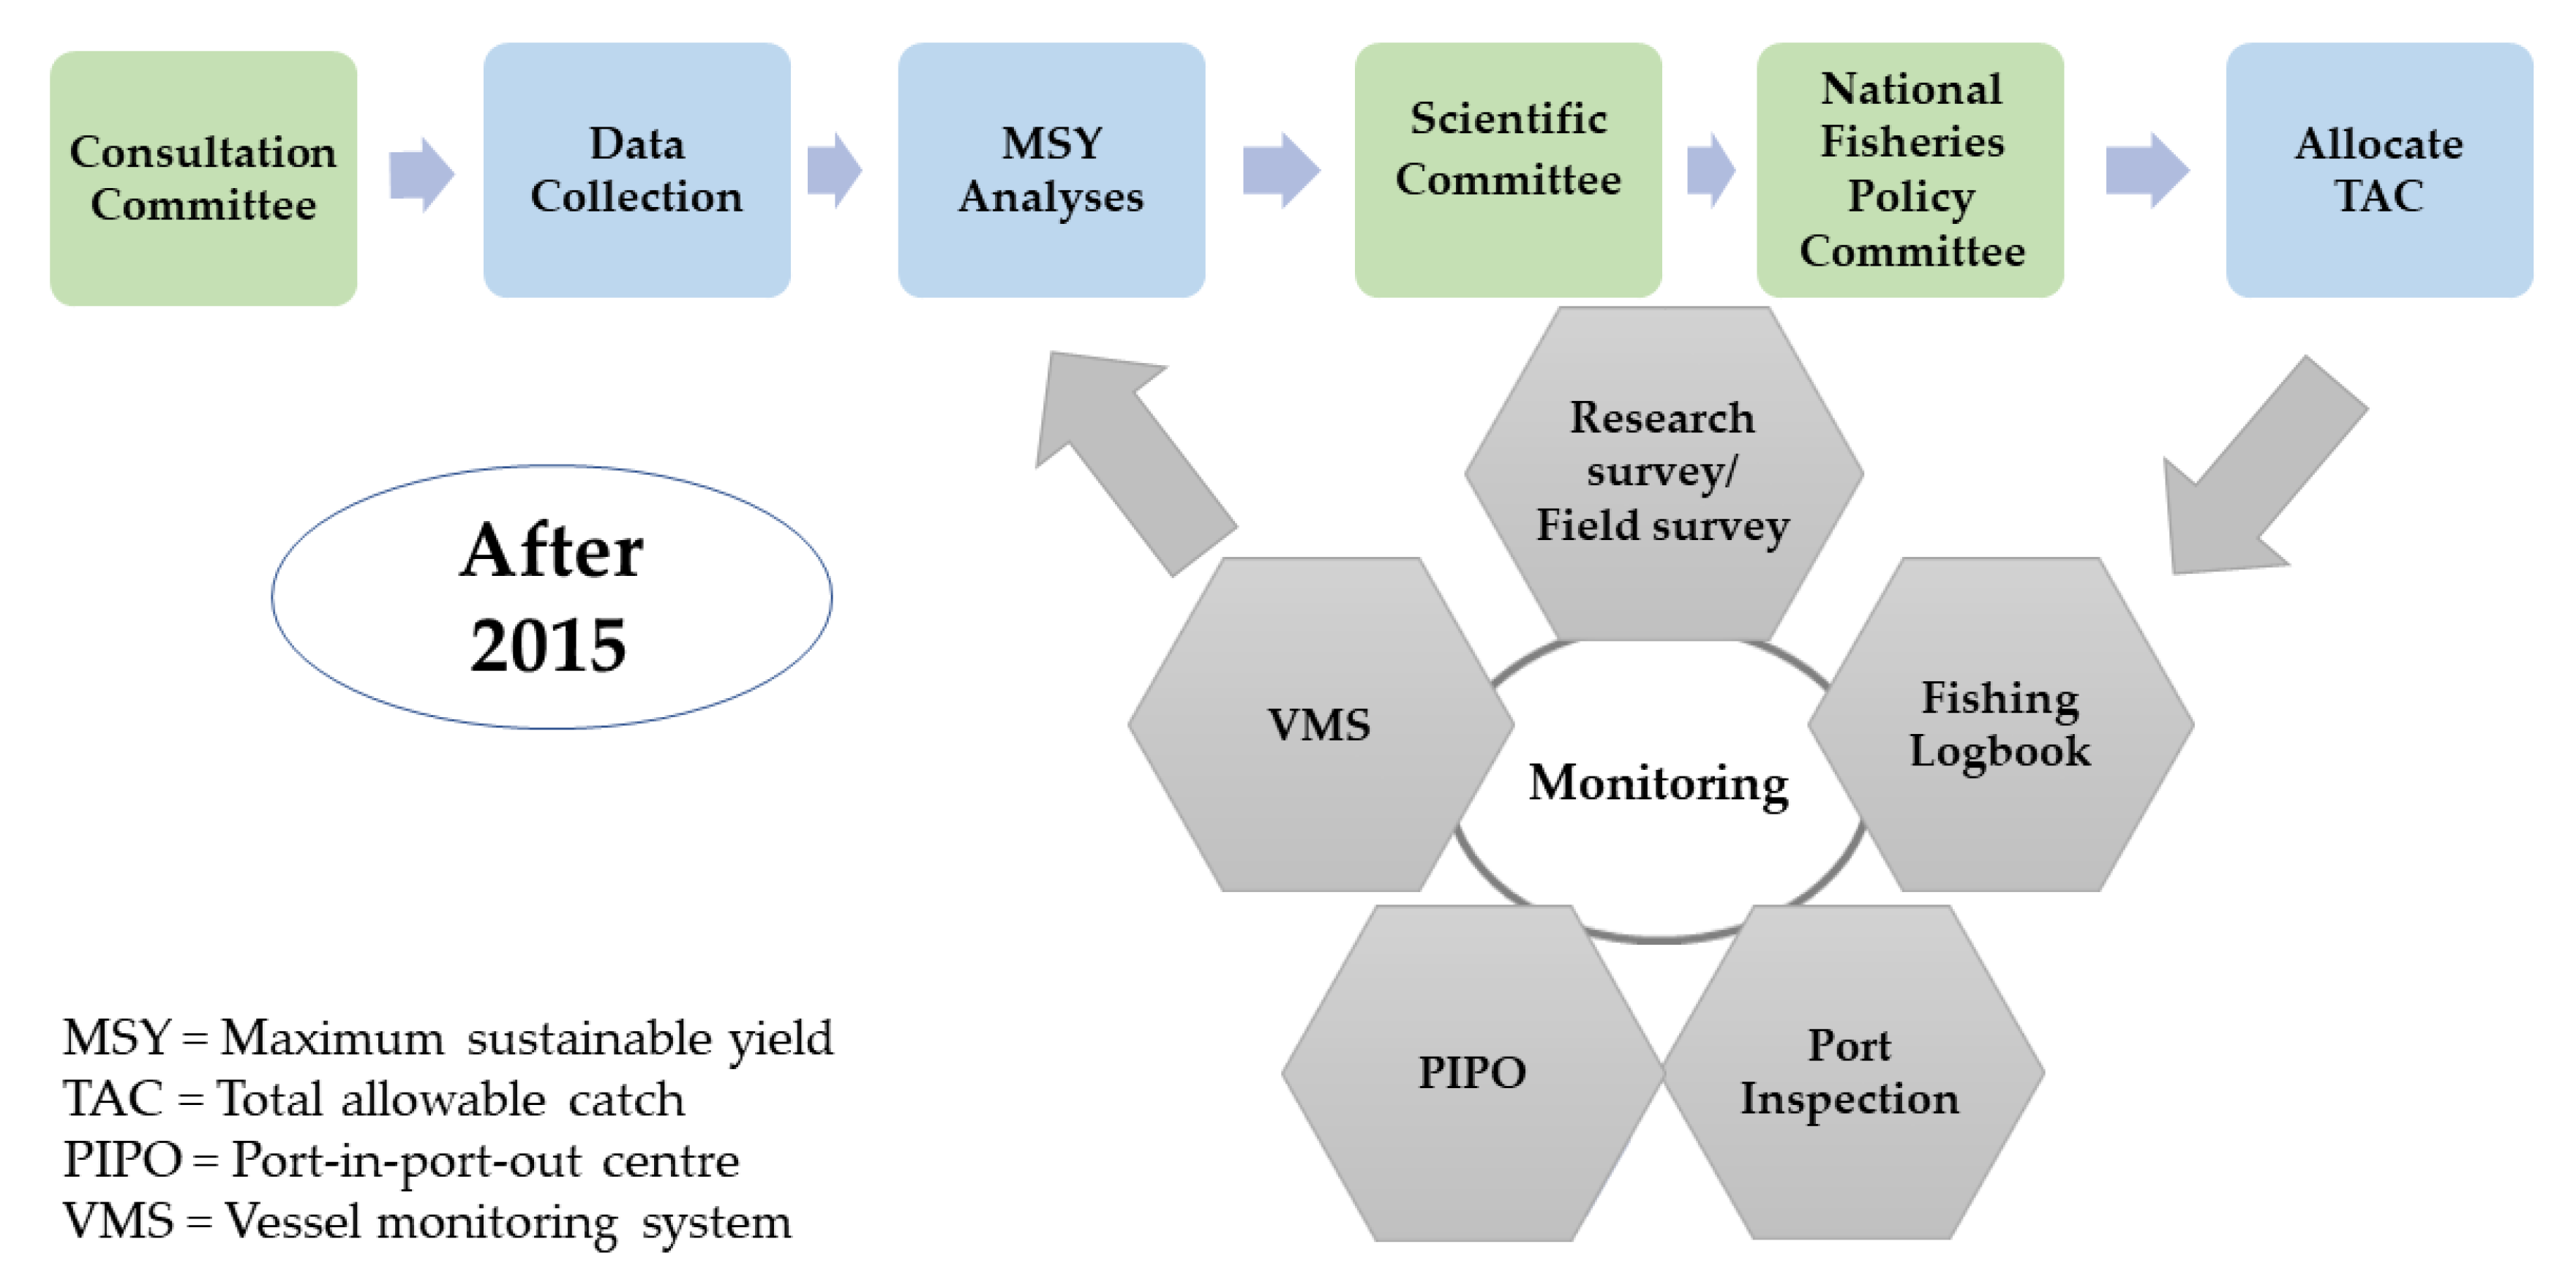
3.2. An Overview of the Fisheries Management Process after 2015

Fisheries management in Thailand was reformed in 2015. The Royal Ordinance on Fisheries, 2015, and its amendment, 2017, had replaced the old fisheries law that was in force for a long time [9,10]. Under the new legislation, the Department of Fisheries formed three committees. The MSY Consultation Committee, comprising DOF fisheries scientists, representatives from fishery associations (both artisanal and commercial fishers), and academics were responsible for scoping the way forward to solve the problems of unauthorized fishing, overfishing, and overcapacity, identify the fisheries resources for stock assessment, and develop the guide for new regulations. After identifying the species of fish to be examined, the corresponding data were collected, and the MSY analyzed. The results were referred to the second committee, the Scientific Committee, comprising the researchers from DOF and academics (both local and foreign) for further analysis. Since Thailand is in the tropics and has a high diversity of fish and more than 20 types of fishing gears to catch them [38], its marine fisheries resources were categorized into three separate species groups in the Gulf of Thailand and the Andaman Sea: (1) demersal; (2) pelagic; and (3) anchovies (Box 1). The Fox surplus production model was then applied to estimate the MSY for each species group and used as the biological reference point for the management of fisheries both in the Gulf and the Andaman Sea. The Scientific Committee then submitted the recommendations on MSY and TAC to the third committee, the National Fisheries Policy Committee, headed by the Prime Minister of Thailand. The TAC, which was approved by the National Fisheries Policy Committee, was allocated, and the corresponding fishing licenses were issued after the National Committee accepted the recommendations. Each fishing license was valid for two years, so that a monitoring process was deemed necessary to control the fishing activities. This was carried out through the use of fishing logbooks, operationalization of the port-in and port-out centers (PIPOs), Landing Declaration, installation of the vessel monitoring system (VMS), as well as through regular conduct of research surveys and field surveys by DOF researchers. The transformation in Thai fisheries management post-2015 is explained in Figure 5.
Box 1. Classification of fisheries resource groups in Thai marine waters.
Gulf of Thailand
  • Demersal fish
The demersal catch data during 1980–2017 from the operation of pair trawl, otter board trawl, krill push net, gill net for blue swimming crab and other gill nets, traps (for fish, squid, and crab), hook and line, squid falling net, and squid lift net were used for calculating MSY, while the CPUE data of research vessels using otter board trawl from 1980 to 2017 were used as a standard fishing gear in the Gulf of Thailand.
  • Pelagic fish
The catch statistics of pelagic fishing from 1997 to 2017 using purse seine (Thai purse seine, Thai purse seine with light luring, and fish aggregating devices (FAD) excluding anchovy purse seine, encircling gill net, fish gill net, and pound net were used for calculating MSY whereas the CPUE data of purse seine during 1997–2017 were used as standard fishing gear.
  • Anchovies
The catch data of anchovy fishing from anchovy purse seine, anchovy falling net and anchovy lift net during 1996–2017 were used for calculating MSY, while the CPUE data from anchovy purse seine during 1996–2017 were used as standard fishing gear.
Andaman Sea
  • Demersal fish
Data on the catch of demersal fish from pair trawl, otter board trawl, beam trawl, krill push net, blue swimming crab gill net, other gill nets, trap (fish, squid, and crab), hook and line, squid falling net and squid lift net from 1980 to 2017 were used for calculating MSY. The CPUE data of otter board trawl size “M” from 1980 to 2017 were used as a standard fishing gear in the Andaman Sea.
  • Pelagic fish
The catch data of pelagic fish from purse seine (Thai purse seine, Thai purse seine with light luring, and FAD) excluding anchovy purse seine, encircling gill net, fish gill net, and pound net during 1997–2017 were used for calculating MSY. The CPUE data of purse seine during 1997–2017 were used as standard fishing gear.
  • Anchovies
The catch data of anchovies from anchovy purse seine, anchovy falling net, and anchovy lift net during 1996–2017 were used for calculating MSY, while the CPUE data of anchovy purse seine from 1996 to 2017 were used as standard fishing gear.

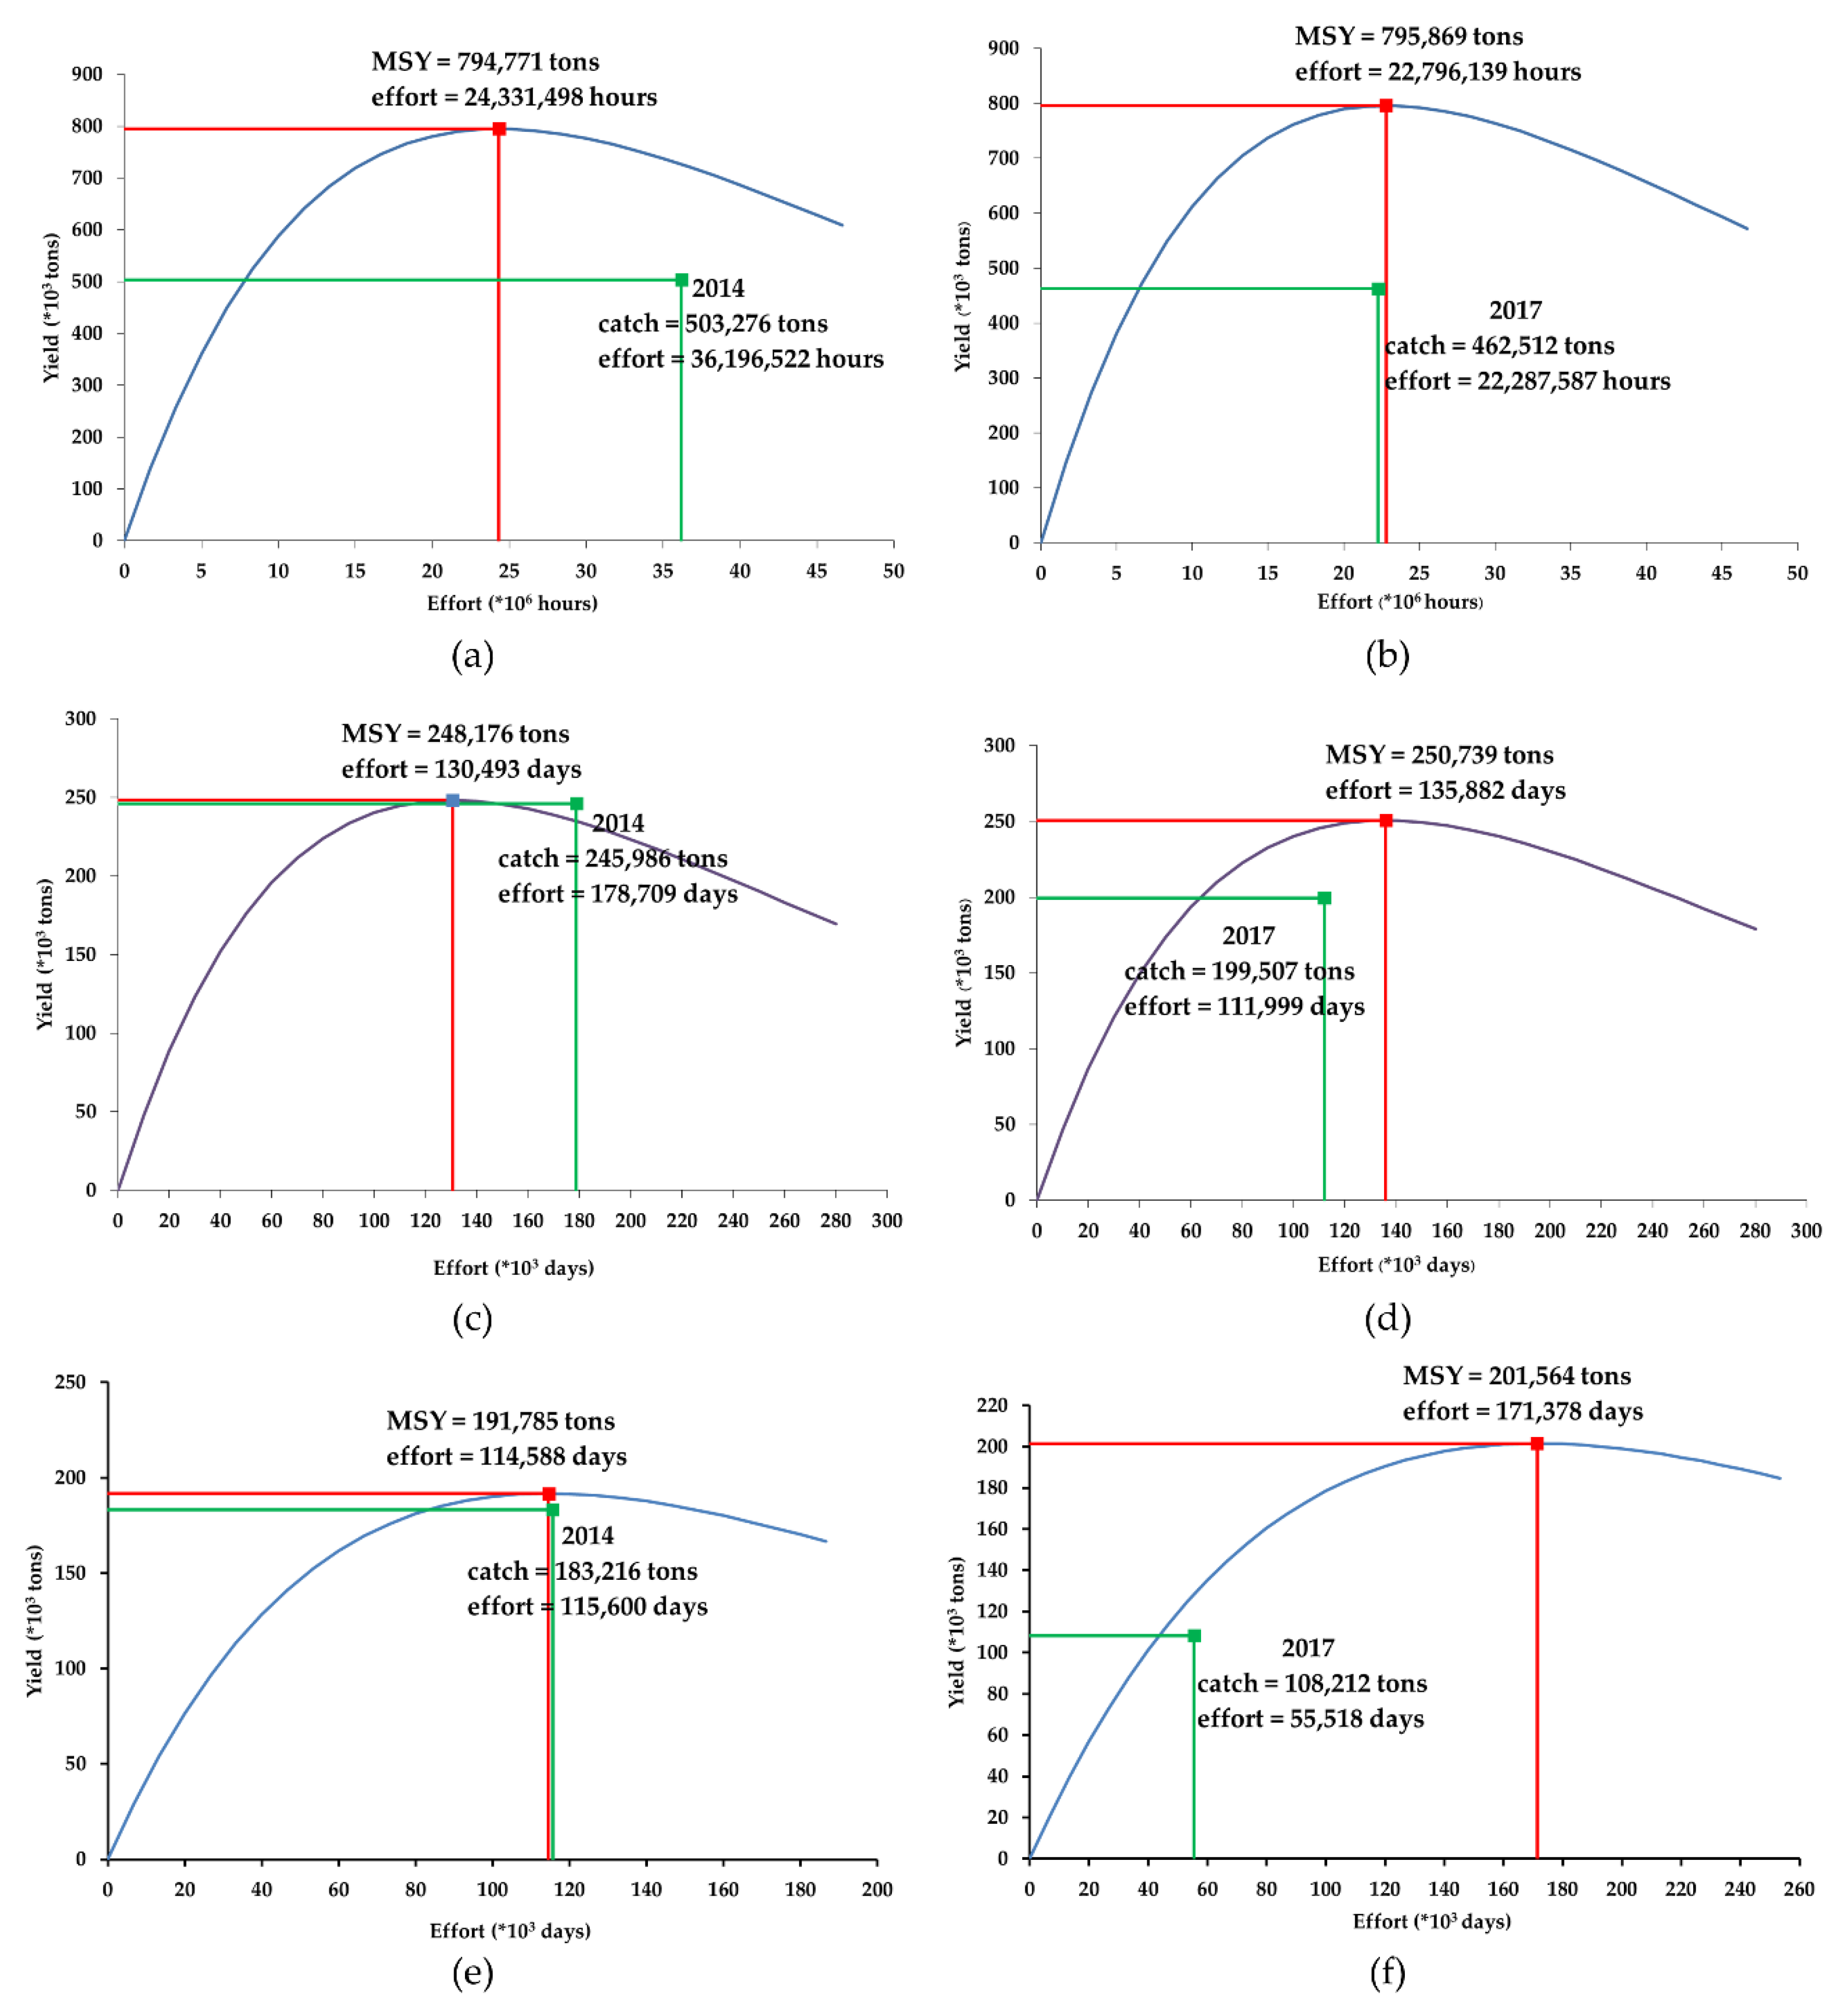
Results of MSY Analysis and Setting TAC

Table 2 shows that MSY assessment resulted in an MSY of 1.6 million tons, but the catch in 2017 was lower for all species groups in both fishing areas except for pelagic fish catch in the Andaman Sea. The fishing effort is now on par or below the fishing effort at MSY. The total allowable catch (TAC) and standard fishing effort for each of the three marine resource groups in the Gulf of Thailand and the Andaman Sea estimated by using Equation (2) (Section 2.2) are shown in Table 3. The TAC was allocated to each vessel by using Equations (6)–(9) considering CPUE, the number of fishing days per year, and the total number of vessels.

3.3. Fishing Effort Allocation

3.3.1. Commercial Fishing License Issuance Process

The activities and time frame for the fishing license issuance process are presented in Table 4. The fishing license application process was set to begin in January 2018 by announcing the principles, criteria, and the process of issuance of commercial fishing licenses for the period 2018–2019 and preparing the necessary forms such as the license request form, license form, license transfer form, license substitute form, and other documents or proofs for commercial license application were available to the public. For the 2018–2019 fishing year, new fishing licenses were issued during 16–31 March 2018, and they came into effect from 1 April 2018. The issuance of commercial fishing licenses is performed every two years. While the Marine Department prepare and issue new vessel permits, the DOF has ample time to screen the applications determine allocations, and issue fishing licenses [39].

3.3.2. Criteria for Allocating Commercial Fishing Licenses

The Royal Ordinance on Fisheries (2015) and its amendments of 2017, specified the areas that could be fished, the fishing gear types, and numbers that could be used in a particular fishing operation, maximum allowable catch, and the allowed fishing duration according to fishing capacity and the MSY of aquatic animal groups in a defined fishing ground. In consultation with fisherfolks and fisher associations, the new standards of fishing gear had been agreed upon to supplement the measures for fishing capacity reduction, and the specifications and conditions for each fishing gear were stipulated. However, during the new round of license issuance in 2018, these standards were applied only to those enlisted for commercial fishing licenses. A Ministerial Notification that became effective from 1 April 2018 prescribed livelihood protection and support for small-scale (lower income) fishers who use seven types of fishing gears in all vessels, viz., pair trawl, otter board trawl, beam trawl, purse seine, anchovy purse seine, all dredges, and light luring vessels by defining them to fall under “commercial fishing”, making it mandatory for these groups of vessels to have a commercial fishing license, even though the sizes of the vessels were well below 10 GT. The fishing gears used were categorized into two groups based on their efficiency, viz., low-efficiency fishing gear, and high-efficiency fishing gear (Table 5). The former category was given priority over the latter in the license allocation process. All types of vessels can apply for handline. Vessels that were without a fishing license in the 2016–2017 fishing year (locked vessel, after the fishing fleet survey in 2015) were able to apply only for low-efficiency fishing gears. The fishers can apply for licenses for all three types of fishing gear for one particular vessel; however, only one type of fishing gear is allowed to be used in one fishing trip. The applicants of high-efficiency fishing gears can apply for only the handline as the second fishing gear. The number of highly efficient fishing gears was reduced in consultation with fishers and fisher associations. Allocation of several low-efficiency fishing gears was allowed for small-scale fishers.

3.3.3. Issuance of Fishing Licenses

In the Gulf of Thailand, the TAC was set at 1,185,764 tons. A total of 1,096,053 tons of fisheries resources or standard fishing effort of 15,552,365 h for the demersal group, 85,910 days for the pelagic group, and 102,932 days for the anchovy group (Table 6) were allocated to a total of 27,507 fishing vessels (Table 7), in which 18,391 were artisanal, 542 were artisanal vessels with high-efficiency fishing gears, and 8574 were commercial vessels. Therefore, the remaining TAC of 89,711 tons was not allocated to the fishing vessels. Both artisanal and commercial fishing vessels in the Gulf of Thailand mostly target demersal fish. The number of commercial fishing vessels of S, M, L, and X size categories were 1408, 3888, 1962, and 65, respectively (Table 7).
In the Andaman Sea, the TAC was set at 373,221 tons. A total of 341,570 tons of fisheries resources or a standard fishing effort of 4,055,335 h for the demersal group, 50,805 days for the pelagic group, and 39,285 days for the anchovy group (Table 6) were allocated to a total of 8657 fishing vessels (Table 8), in which 7278 were artisanal, 64 were artisanal vessels with high-efficiency fishing gears, and 1315 were commercial vessels. Therefore, the remaining TAC of 31,651 tons was not allocated to the fishing vessels. Similar to the Gulf of Thailand, both artisanal and commercial fishing vessels in the Andaman Sea mostly target demersal fish. The number of commercial fishing vessels of S, M, L, and X size categories were 185, 558, 513, and 30, respectively (Table 8).

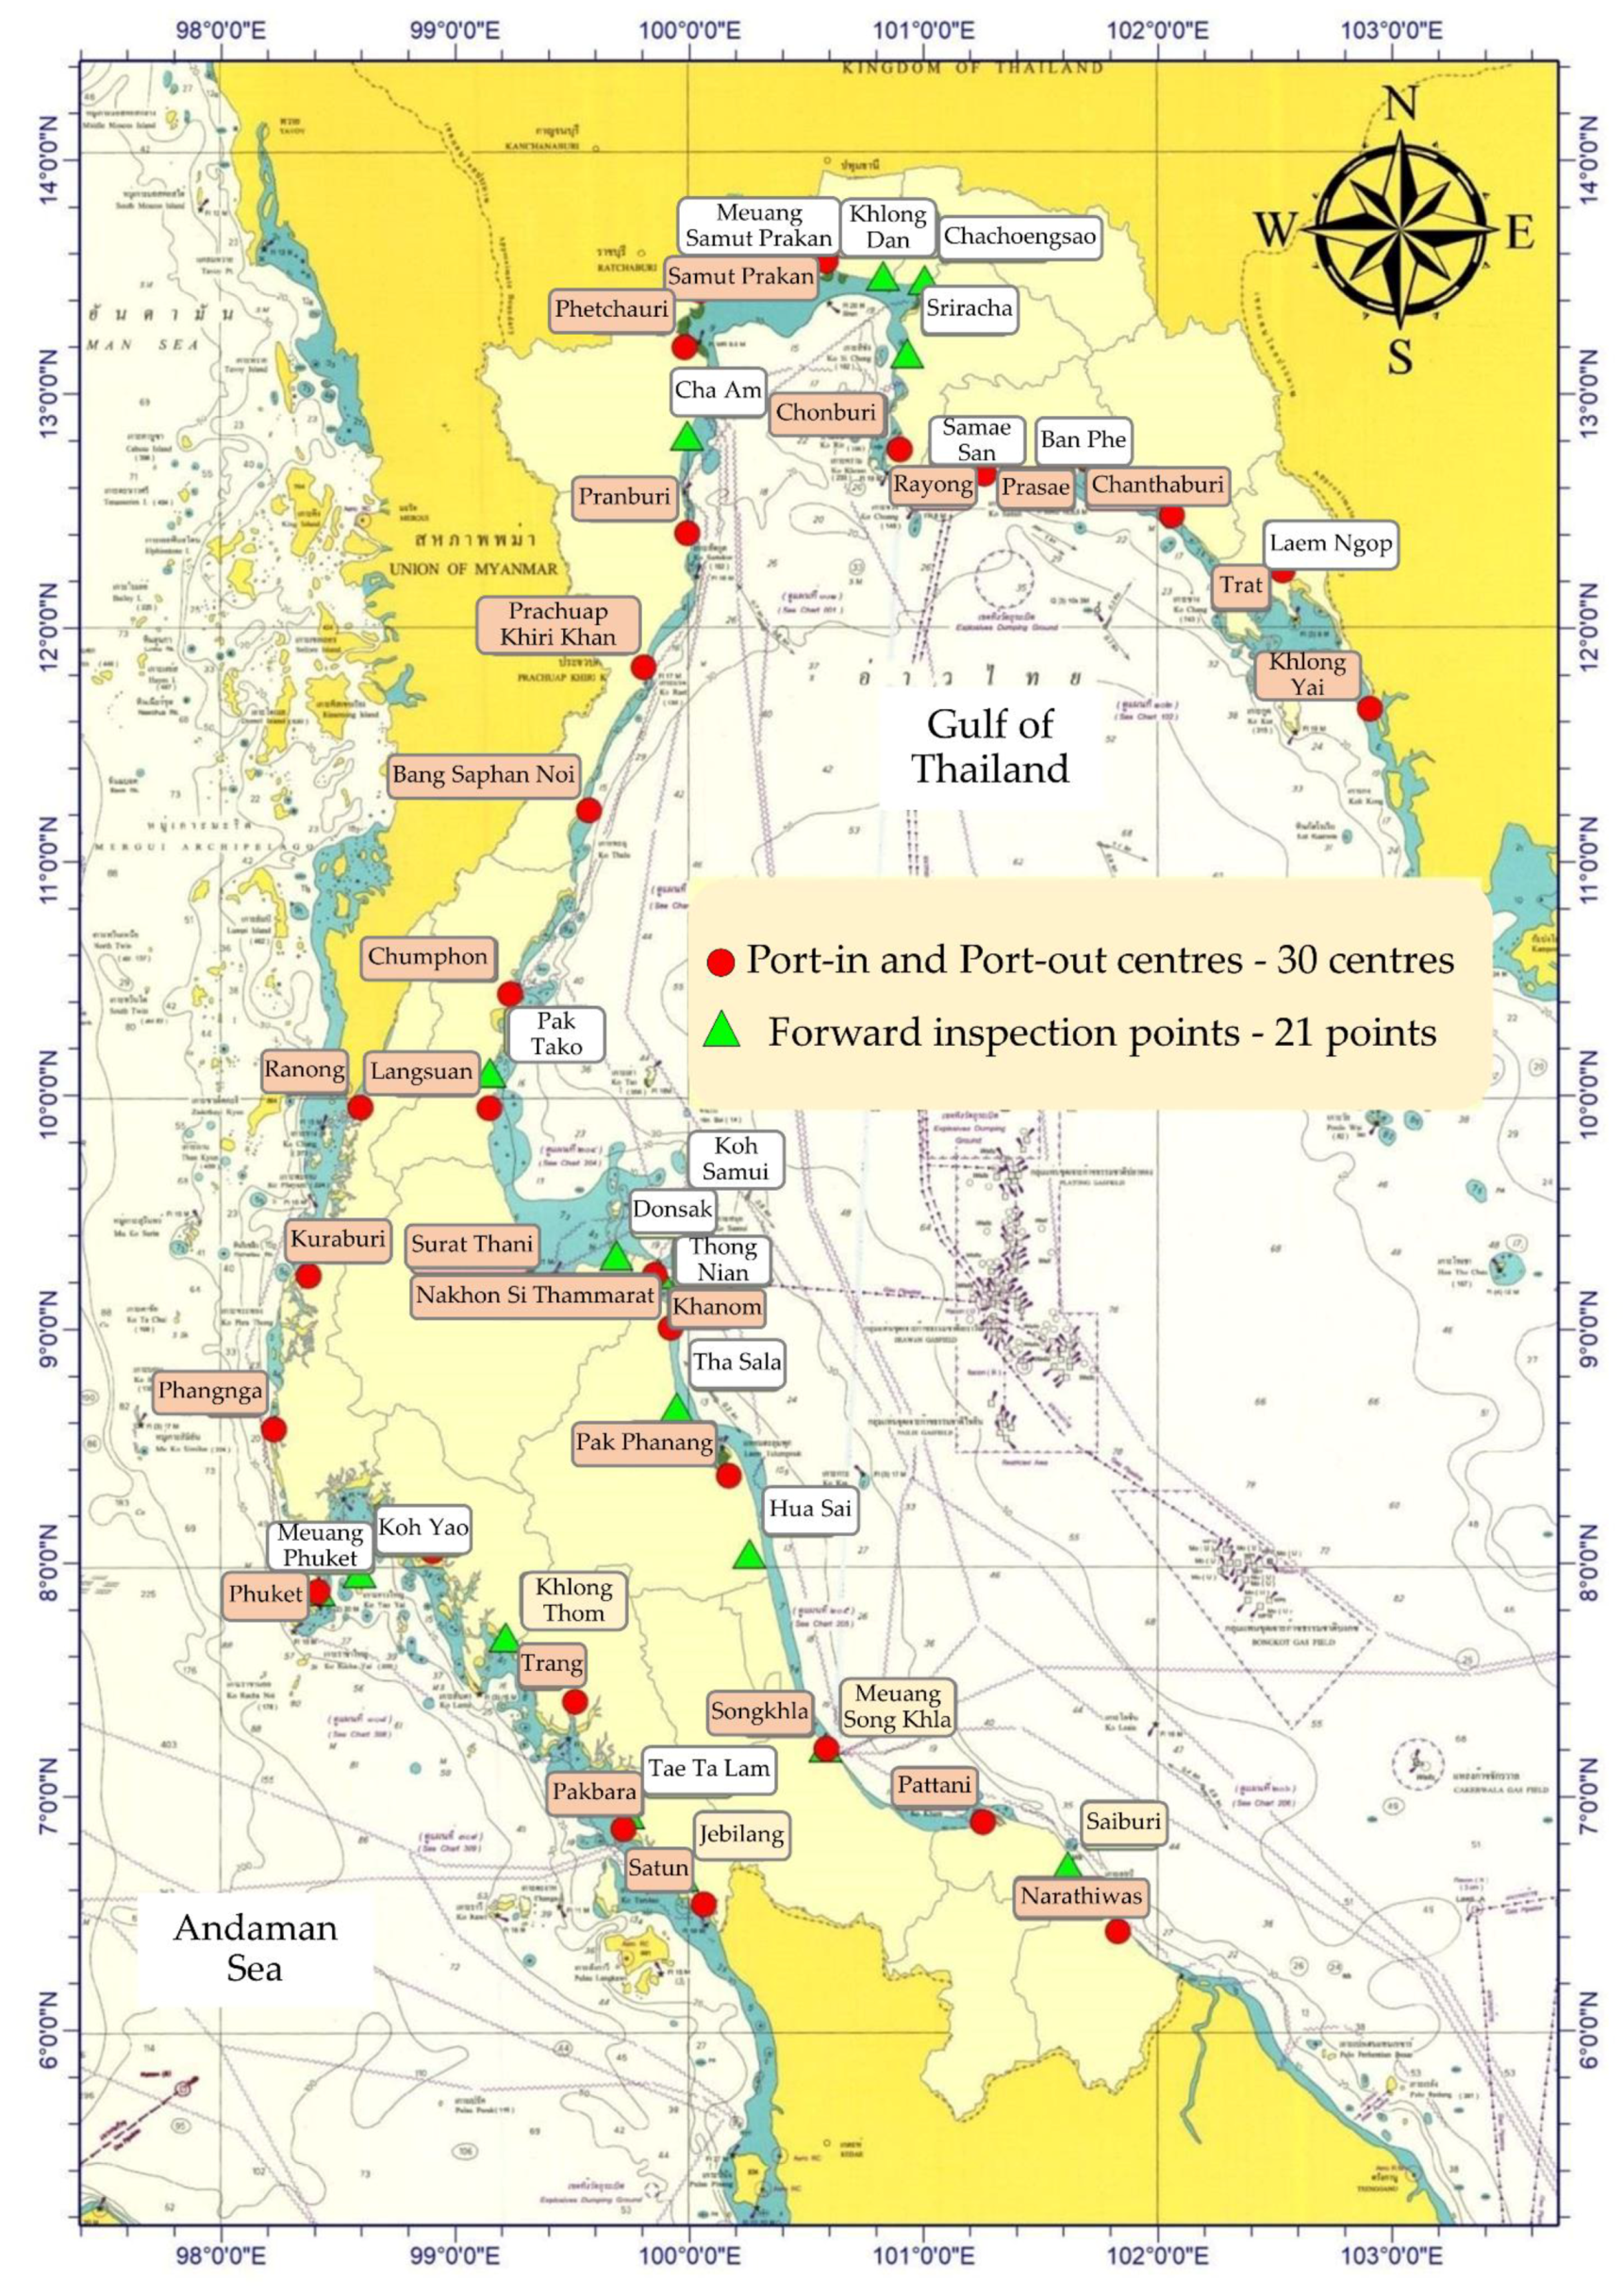
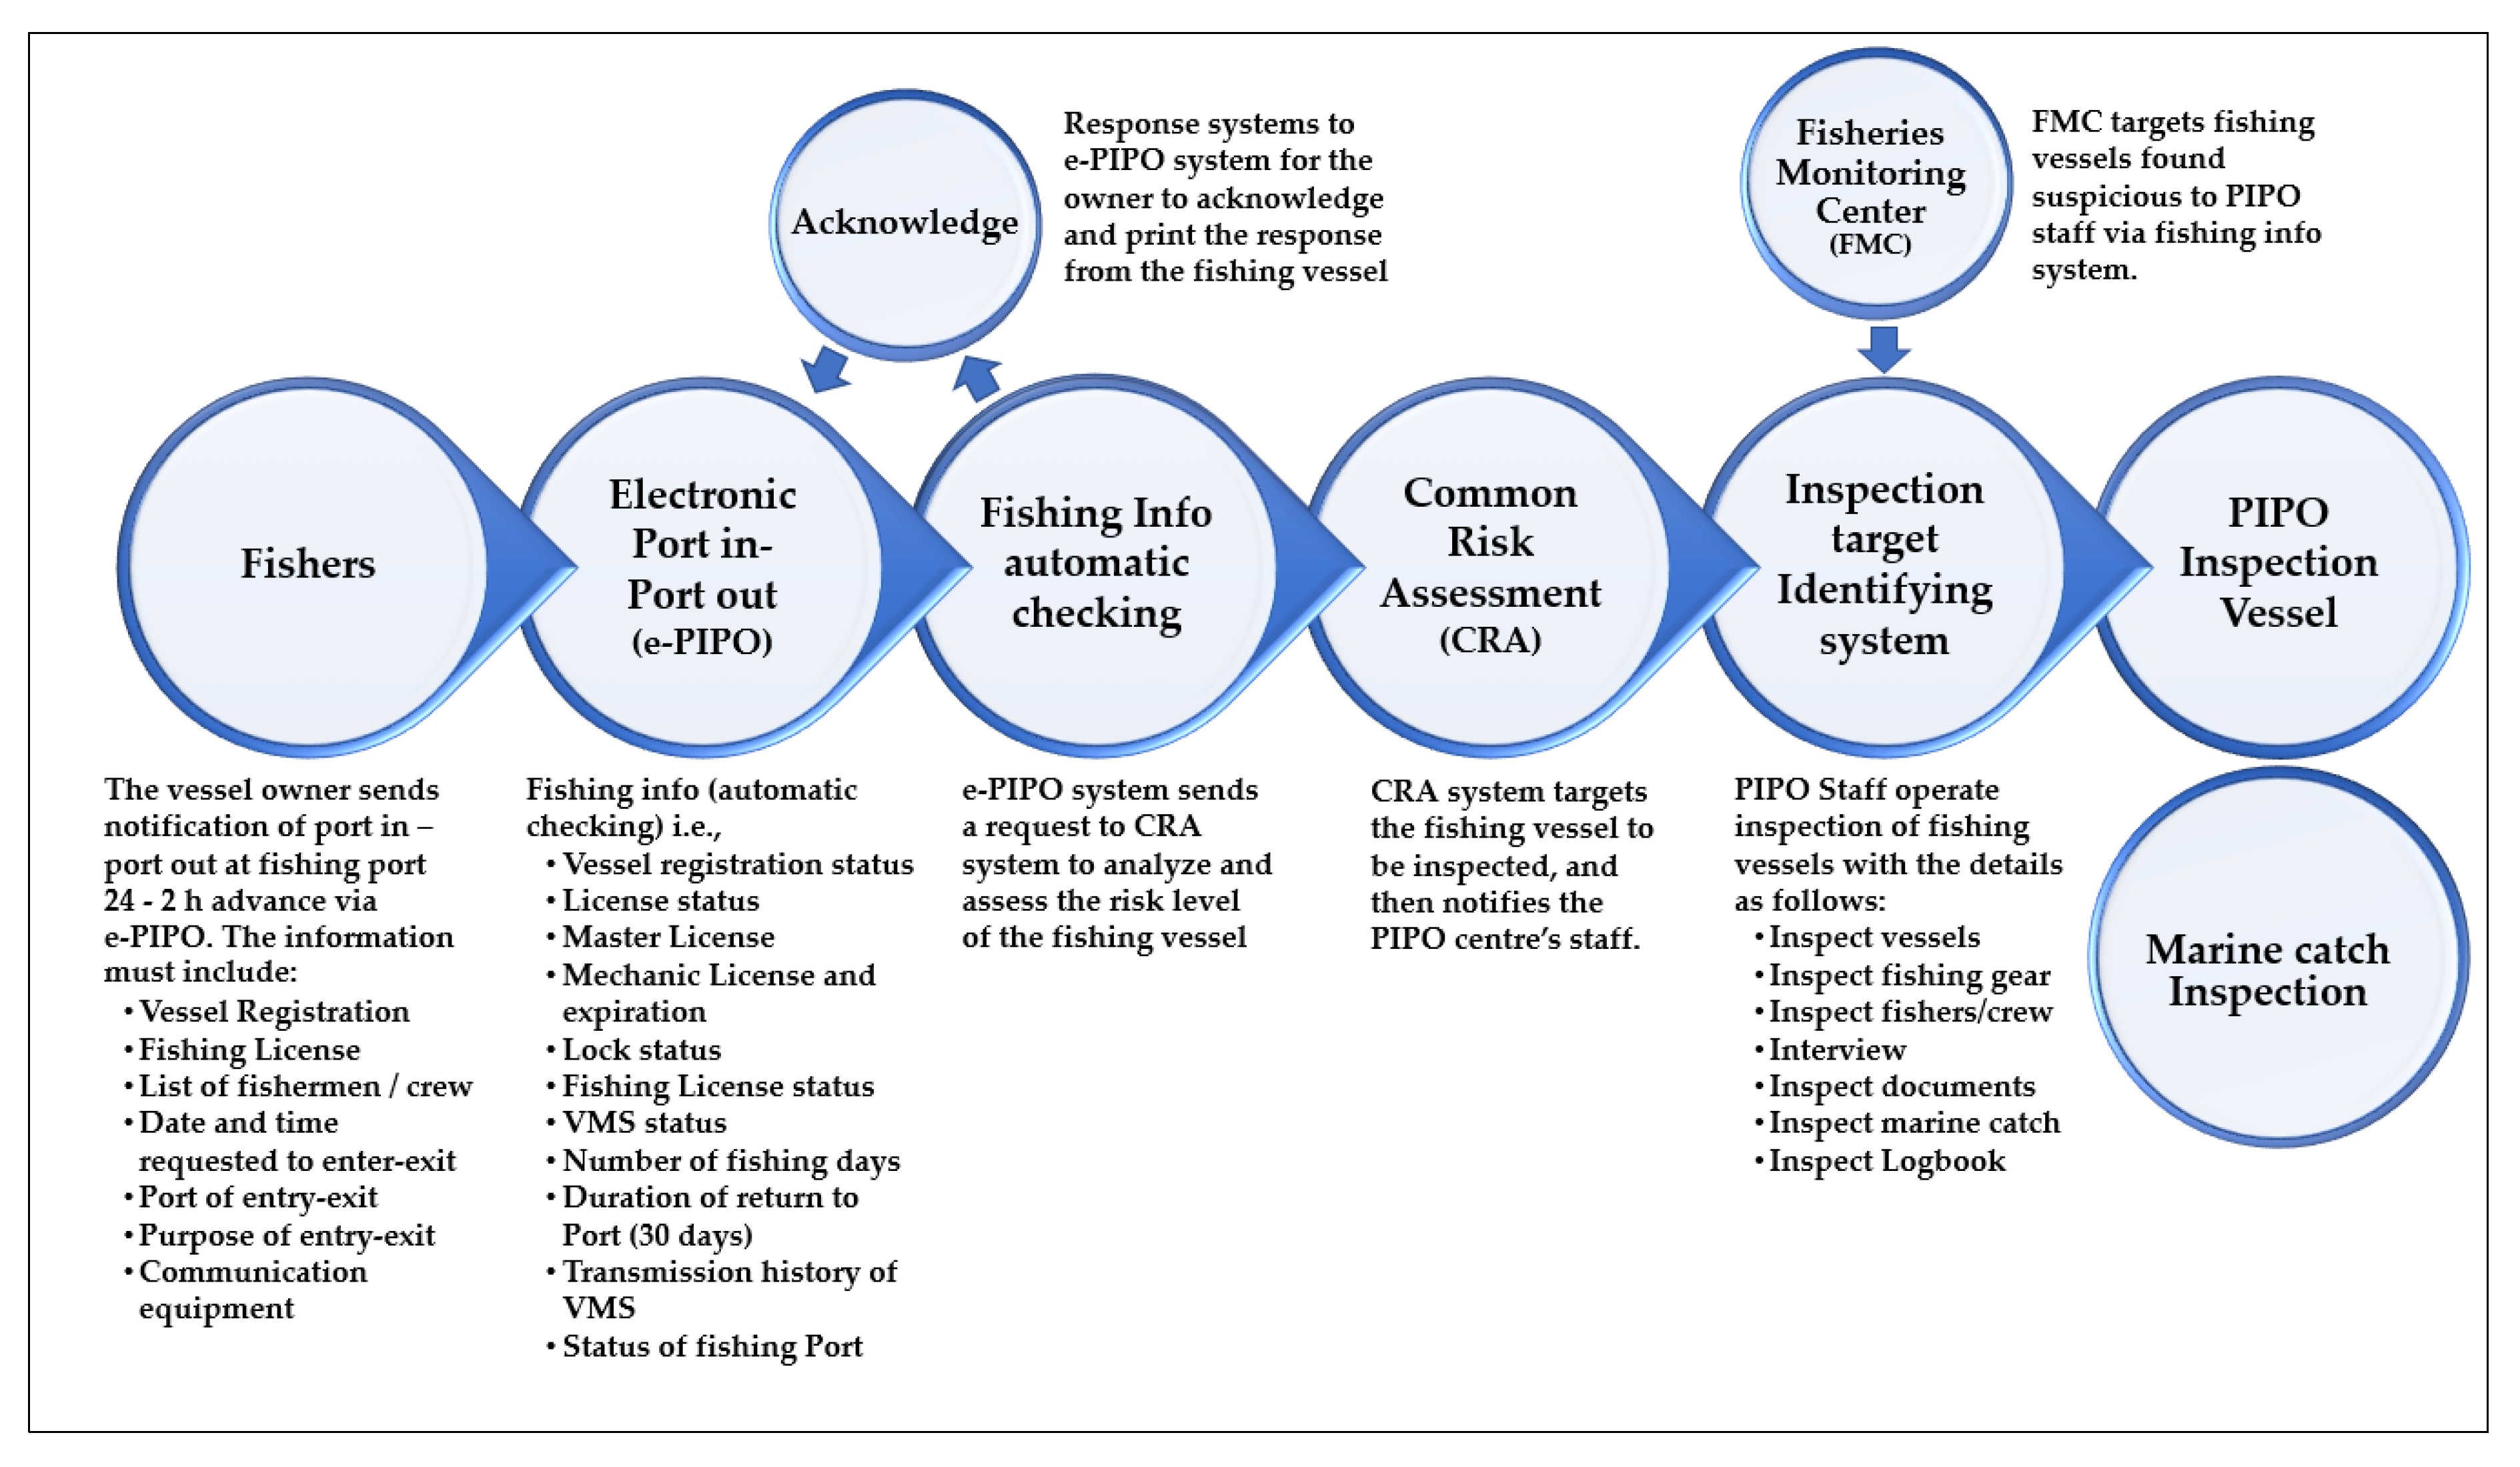
3.4. Measures for Regulating Fishing Effort

After allocating the fishing effort to each fishing vessel, Thailand monitored and controlled the fishing activities by establishing 30 port-in and port-out centers (PIPOs) and 21 forward inspection points (FIPs) along the coast (Figure 6). The electronic PIPO system automatically checks the various regulatory features, including the fishing license status and the number of fishing days.
The fishers who own fishing vessels ≥ 30 GT (gross tonnage) with licenses for any type of fishing gears and fishers who own any size of a fishing vessel and have licenses for trawl, purse seine, and anchovy falling nets must seek permission to enter or exit the port within 24 h, but not less than 2 h before entry or exit. Figure 7 shows an overview of the PIPO system. The inspections cover documentation, fishing gear, crew approval, fishing license, and the number of fishing days. The PIPO centers have about 1000 officers deputed from the Ministry of Labour, the Marine Police Division, the Marine Department, the DOF, and the Royal Thai Navy. The fishing vessel that exceeds allocated fishing days is not allowed to port-out. Moreover, to ensure that the fishers do not go out from the port without informing the PIPO officer, a vessel monitoring system (VMS) is also installed to control the fishing vessel movements. Inspection at sea is also done by the Fishing Control and Surveillance Division of DOF, and other agencies involved in joint operations such as the Marine Police Division, the Thai Maritime Enforcement Command Center, and the Royal Thai Navy.

3.5. Fisheries Resources Status

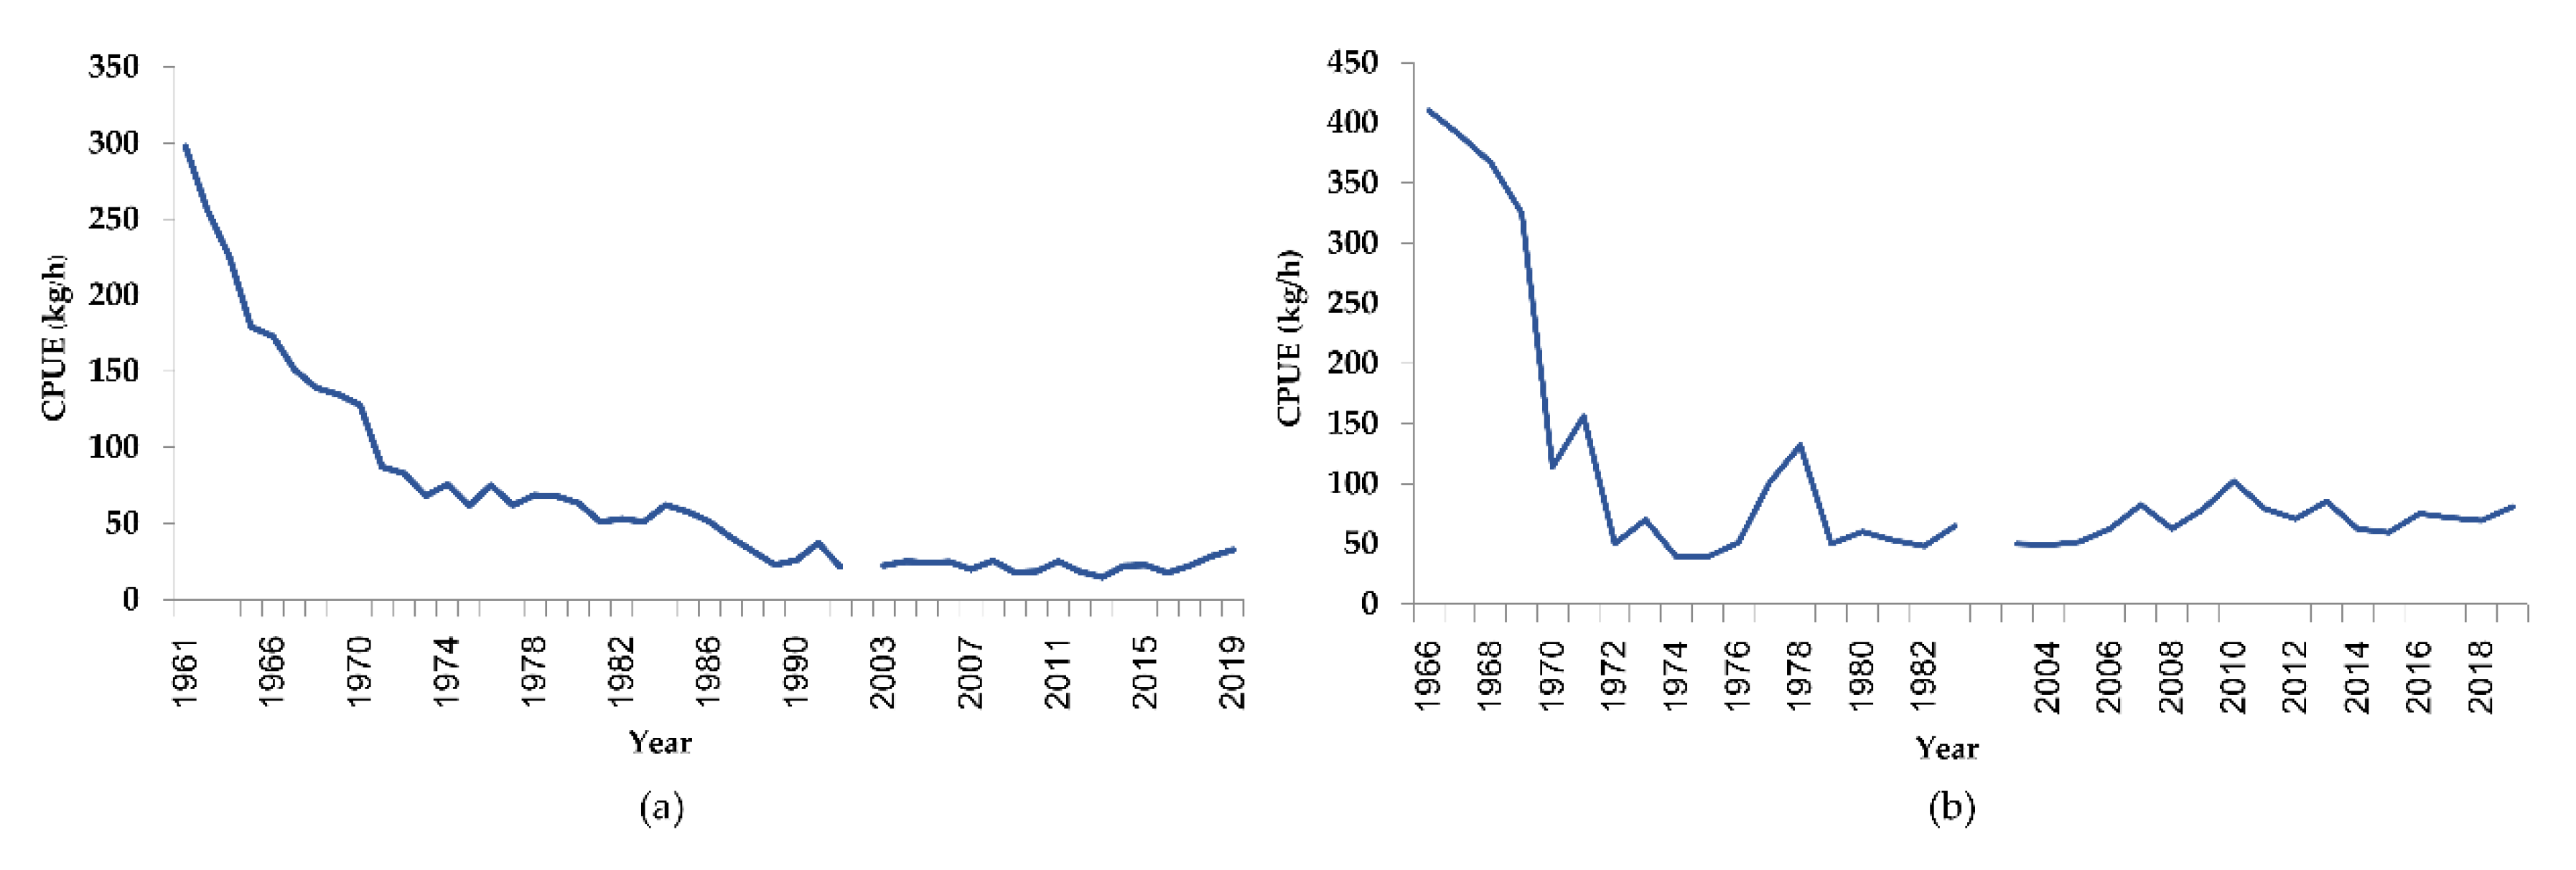
3.5.1. CPUE as an Indicator

As CPUE is a function of catchability coefficient and density of fish, CPUE and stock density are related. Catch refers to the weight of catch and the units of effort refer to the time such as an hour or a day. The use of standardized fishing effort made the estimated CPUE proportionate to the average density in the fishing area. Therefore, CPUE becomes a simple indicator of the abundance of fisheries resources at sea [40,41,42] provided that the efficiency of the fishing gear in use is constant.
  • Research vessels
The fisheries resource surveys by research vessels in Thailand have been carried out since the 1960s. The efficiency of five research vessels was compared, and it was found that the CPUE of the research vessels were not significantly different [17]. Figure 8 indicates a dramatic decline of CPUE both in the Gulf of Thailand and the Andaman Sea between 1961 and 2019. Although it is too early to conclude as a sign of a recovery, after the regulatory intervention of limited access in 2015, research vessel trawl surveys both in the Gulf of Thailand and the Andaman Sea showed a slight increase in CPUE in 2019. The CPUE in the Gulf of Thailand increased from 21.94 kg/h in 2014 and 21.99 kg/h in 2017 to 32.55 kg/h in 2019, while the CPUE in the Andaman Sea increased from 62.29 kg/h in 2014 and 71.81 kg/h in 2017 to 80.68 kg/h in 2019 (Figure 8).
  • Commercial Vessels
After two years of implementing the new fishing license system to limit the fishing effort in the waters of Thailand, the results of catch and standard fishing effort in 2017 showed that the CPUE in all groups had increased because the fishing effort had declined much greater than the reduction in catch (a and b of Figure 9 and Figure 10). In the Gulf of Thailand, the CPUE in 2014 and 2017 of each species group had increased: the demersal group from 13.90 kg/h to 20.75 kg/h; the pelagic group from 1376.46 kg/day to 1781.33 kg/day, and the anchovies from 1584.91 kg/day to 1949.13 kg/day. In the Andaman Sea, the CPUE in 2014 and 2017 of each species group had increased: the demersal group from 34.94 kg/h to 39.47 kg/h; the pelagic group from 1525.44 kg/day to 2692.15 kg/day, and the anchovies from 658.06 kg/day to 701.36 kg/day.

3.5.2. Fishing Effort Reduction

After the first access restriction of fishing vessels, the second stock assessment was done in 2018, and the results showed that the system was working satisfactorily. Figure 9 and Figure 10 show a comparison of the fishing effort and catch in 2014 and 2017. The fishing efforts in 2017 were lower than that of optimal fishing effort at MSY point (see also Table 1). The fishing effort of the demersal fish group had decreased by 38% in the Gulf of Thailand and 30% in the Andaman Sea, with the demersal fish catch also decreasing in 2017 in both areas since higher catches in 2014 were a result of overfishing. While the fishing effort of the pelagic fish group had decreased by 37% and 31%, respectively, there was a decreasing catch in the Gulf of Thailand and increasing catch in the Andaman Sea. Besides, the fishing effort of the anchovy group in 2017 had decreased more than one half compared to the fishing effort in 2014 in both areas. In general, the reduction of fishing effort resulted in a decrease of catch in the early years, which would allow fish stocks to recover. In the case of Thailand, strong measures for fishing effort reduction were implemented in order to accelerate the recovery of fish stocks.

4. Discussion

Thai fisheries management regime before 2015 was open access with little or inadequate regulation on both the inputs and outputs. It is well known that such a fishery would not last long as it depletes the stocks and would lead to its ultimate collapse. Moreover, open-access fisheries will prevent long term conservation of fisheries resources, and unregulated fishing is considered one of the greatest threats to fisheries sustainability. The overall need for restricting access is globally accepted as a basic premise in fishery management [5].
Open-access fisheries come along not only with weak law enforcement but also with IUU fishing in Thailand and other developing countries [43,44]. The DOF, Thailand, realized that unregulated fishing would destroy the fisheries resources under its jurisdiction, and IUU fishing will lead to the problem of market access. Research findings have revealed that the CPUE in 2014 was only 9% of that of the base-year of 1961 [8]. Fisheries statistics in 2015 have shown the DOF that most of the fishing efforts in 2014 exceeded the optimal fishing effort at the MSY level except for the anchovy fishery in the Andaman Sea (Figure 9 and Figure 10) [8]. Another problem of weak regulations was unauthorized fishing. The old fishing license system with no centralized database and no inspections bred the proliferation of fake, duplicated, or double licensing. The DOF recognized that the solution lay in strengthening the regulatory framework and restricting access to marine fisheries [5].
The DOF had also realized that a multi-species and multi-gear fishery with scarce and sparse qualitative and quantitative data made it impossible to develop a science-based fishery management strategy. Hence, as a starting point for devising strategies to control fishing capacity, the authorities conducted a fishing fleet census to understand how many fishing vessels were in operation and the structure of fishing fleets. Since developing a single-species management strategy and single species catch quota looked impossible when fishers caught more than 50 species in a single fishing trip, Thailand decided to apply the Fox model to a multi-species fishery. The Fox model has been reported to fit best with multi-species fisheries in lakes and reservoirs and reef-based fisheries in Africa, Asia, and South America [45].
There are various methods to calculate MSY, but the Fox model is a classic model and fits short-lived species in tropical areas, and the resultant MSY can be used as an upper limit reference point [18]. The DOF classified and grouped marine fish catch into three categories: demersal, pelagic, and anchovies both in the Gulf of Thailand and in the Andaman Sea, and the Fox production model was applied to calculate the MSY of the three groups. Applying the precautionary approach, the TAC was set at 95% of MSY, and then it was converted into the number of fishing days per year to allocate to each fishing vessel. Effort control was applied to reduce the impact on social and economic conditions by limiting the number of fishing days per year based on TAC. An effective licensing system and control of the allowable fishing vessels are expected to reduce the unregulated nature of the marine fishery and fishing activities in Thailand. Port-in and port-out centers (PIPOs) were created along the coastline to control the fishing activities, including the fishing days. The fishing vessels that exceed the allowable fishing days are prohibited to port-out. Installation of VMS and the associated equipment was made mandatory by law to control the fishing vessel movement for monitoring control and surveillance (MCS).
The common management control over the catch by setting TAC had been used worldwide to protect the fishery resources. The control over the effort by setting the total allowable effort (TAE) has recently been used [46]. As a step towards advancing from open-access to limited-entry, harvest rights were given to individual fishers as fishing day limits. In terms of control, surveillance, and enforcement, TAE is much easier and cheaper than that of TAC, and it is affordable for developing countries [47,48,49,50]. Close monitoring of catches and real-time reporting of catches from many ports along the coastline is costly and requires advanced technology. The problems of dealing with the catch that reaches or is beyond the quota should be addressed [47]. Misreporting or not reporting the catch could occur with the TAC system but not for the TAE system, so the latter will reduce uncertainties of the calculation of productivity and in the assessment of stocks [47,51]. The problems of discards and high grading, which are common in fisheries quota systems are even more severe in multi-species resources [47,52,53]. Fishers will select the valuable fish and throw the low-price fish back to the sea, where most of them are left to die [47]. A robust MCS and enforcement at the port and at sea are necessary and of more concern in the TAC system. The TAC management appears successful in single-species stock fisheries while TAE has clear advantages in multi-species fisheries [47,54,55,56]. Hence, Thailand converted the TAC into the TAE system by controlling the fishing days for each vessel, which took only a short time in developing the control system. The National Fisheries Policy Committee set the TAC at a level that was much easier to understand when used for decision making, and for fishers to estimate their income from the catch quota.
After a short time from the implementation of the regulation, the results show a substantial decrease in the fishing effort that lies left to the optimal fishing effort at the MSY point (Figure 9, Figure 10 and Table 1). However, control of fishing days could result in a catch that is over the catch quota and the MSY point [47]. Fishers tend to maximize their catch during the allowable number of fishing days to maximize their income. Problems of catching small size fishes also occur because fishers will focus on the quantity of fish caught rather than on quality products, leading to growth overfishing [47]. Application of some fishing techniques and technologies, modification of fishing gears, and fishing vessels that are aimed at increasing catchability can also take place, which should also be of great concern [50,51,57,58]. For example, the management of swordfish fisheries by fixing the number of longline sets, failed because fishers increased the number of hooks in the set [59]. Consequently, there is a need for close monitoring of the catchability of fishing vessels and fishing gears in a TAE system and one should be allowed to adjust the TAE to avoid catching over the optimum point [60].
Thailand data show that the fish catch in 2017 was mostly lower than the catch at the MSY point except for the pelagic fish in the Andaman Sea (Figure 8 and Figure 9). The main fishing gear that catches the pelagic fish is purse seine, which fishers operate by searching the school of fish either visually or by using echo sounders or using light or fish aggregating devices to lure the fish before surrounding them with the net. This shows that precautions should be applied when using TAE to manage the fisheries resources with respect to the nature of fishing activities. TAE management is best applied in Thailand with demersal fishers that use trawl as the primary fishing gear and catch more than 50 species at the same time, as has been shown in the use of the TAE system for trawl fishing elsewhere [50,54,56,61].
The life span of fish, squid, and other aquatic animals that form a major part of the fisheries catch in Thailand is short—only about two years. The stock response depends on the type of fish; pelagic fish such as anchovies respond quickly compared to demersal fish because of the characteristics of the life history of demersal fish that live on the sea bottom and with lower growth rates [42]. Nevertheless, the monitoring of fisheries resources should be conducted to ensure that these are sustainably utilized.
The DOF of Thailand undertook a time-bound exercise to control the fishing activities at a time when the fisheries resources were declining, and the market pressure for IUU fishing was on the rise, using the Fox model for reference point analysis selected by the Scientific Committee. Ensuring success in enforcing new regulations is always a challenge as these could be seen as laws that might have unfavorable livelihood outcomes for fishers. Application of the Fox model, which is a single species model on multi-species fisheries, could potentially drive some species to the verge of collapse while others might become over dominant. Therefore, this approach to the management of multi-species fisheries must be considered with caution, and the resources should be closely monitored.

5. Conclusions

Thailand is currently on the right path in addressing the issues of unregulated and unauthorized fishing, and overfishing and overcapacity of the Thai fishing fleet using a science-based approach to fisheries management in line with international standards. The open-access fishery has been converted to a limited access fisheries regime based on the science-based MSY reference points. Unauthorized fishing becomes authorized by providing a licensing system. The Department of Fisheries (DOF) of Thailand allocated the fisheries resource to fishers by giving them the fishing licenses that specify the catch and day limits to control fishing effort and by converting total allowable catch (TAC) into the total allowable effort (TAE) system. The overcapacity of the fishing fleet is now managed. Because of the urgency of solving the problem of unregulated fisheries, a single-species Fox model was applied to devise management strategies for a multi-species-multi-gear fishery. The success of these management measures to control overfishing, stock depletion, and collapse is yet to be assessed, but the results so far are promising. Controlling effort instead of controlling catch is yet to be recommended as a general management measure as precautions should be taken considering the nature of fishing activities and catchability. The Thai experience so far showed that the TAE system is best adoptable for demersal fish that are harvested by trawl fisheries than with pelagic fish harvested in purse seine fisheries. The TAE should be transferable in the future to reduce the number of fishing vessels and increase the number of fishing days per fishing vessel.

Author Contributions

N.K. conducted the research under the supervision of K.R.S. and A.Y., P.N. contributed to the data analysis and interpretation of the results. The first draft of the manuscript was prepared by N.K., which was reviewed and edited by A.Y., K.R.S. and P.N. All authors have read and agreed to the published version of the manuscript.

Funding

The research was funded by the Ministry of Agricultural and Cooperatives (MOAC), Thailand through its scholarship program.

Acknowledgments

The authors would like to thank the Ministry of Agricultural and Cooperatives (MOAC), Thailand, for the scholarship provided to the first author. Sincere gratitude is also extended to the fishers, and staff of the Department of Fisheries (DOF), Thailand, specially Ratanawalee Phoonsawat, Amnuay Khongpom, Songphon Dessane, and Jiraporn Kaewlao. The contribution of Fisheries Statistics Analysis and Research Group, Fisheries Development Policy and Strategy Division, and Marine Fisheries Research and Development Division of the DOF, who provided the information for this study are gratefully acknowledged.

Conflicts of Interest

The authors declare no conflict of interest.

References

  1. DOF. Fisheries Statistics of Thailand 2017; Fisheries Development and Strategy Division, Department of Fisheries, Ministry of Agriculture and Cooperatives; DOF: Bangkok, Thailand, 2019; pp. 1–92.
  2. DOF. Thailand National Plan of Action to Prevent, Deter and Eliminate Illegal, Unreported and Unregulated Fishing (Thailand NPOA-IUU 2015–2019); Department of Fisheries: Bangkok, Thailand, 2015.
  3. FAO. The State of World Fisheries and Aquaculture; FAO: Rome, Italy, 2012.
  4. FAO. Implementation of the International Plan of Action to Prevent, Deter and Eliminate Illegal, Unreported and Unregulated Fishing; FAO Technical Guidelines for Responsible Fisheries; FAO: Rome, Italy, 2002.
  5. Charles, A.T. Use Rights and Responsible Fisheries: Limiting Access and Harvesting through Rights-Based Management. In A Fishery Manager’s Guidebook. Management Measures and Their Application; Cochrane, K., Ed.; FAO Fisheries Tech. Paper #424; FAO: Rome, Italy, 2002. Available online: http://www.fao.org/3/y3427e/y3427e06.pdf (accessed on 5 November 2019).
  6. FAO. Oceans and the Seas; Sustainable Development Knowledge Platform. Available online: https://sustainabledevelopment.un.org/topics/oceanandseas (accessed on 17 April 2020).
  7. FAO. Sustainable Development Goal 14: Conserve and Sustainably Use the Oceans, Seas and Marine Resources for Sustainable Development. Available online: https://sustainabledevelopment.un.org/sdg14 (accessed on 17 April 2020).
  8. DOF. Marine Fisheries Management Plan of Thailand A National Policy for Marine Fisheries Management 2015–2019; Department of Fisheries, Ministry of Agriculture and Cooperative and Command Center of Combating Illegal Fishing: Bangkok, Thailand, 2015.
  9. Office of the Council of State. Royal Ordinance on Fisheries B.E.2015, Government of Thailand. 2015. Available online: http://www.ratchakitcha.soc.go.th/DATA/PDF/2560/A/067/1.PDF (accessed on 17 April 2020). (In Thai)
  10. Office of the Council of State. Royal Ordinance on Fisheries (No. 2) B.E.2017. Government of Thailand. 2017. Available online: https://www.fisheries.go.th/law/web2/images/PR2558/3-Royal-Ordinance-on-Fisheries-Amendment-No2.pdf (accessed on 17 April 2020).
  11. Kongprakhon, P. Conduct of Fisheries Statistics Manual for Users; Fisheries Development Policy and Strategy Division, Department of Fisheries, Ministry of Agriculture and Cooperatives: Bangkok, Thailand, 2018; p. 55. (In Thai)
  12. DOF. The Marine Fisheries Statistics 2014 Based on the Sample Survey; Fishery Statistics Analysis and Research Group, Fisheries Development Strategy and Policy Division, Department of Fisheries, Ministry of Agriculture and Cooperatives: Bangkok, Thailand, 2016; p. 157. (In Thai)
  13. DOF. Fishing Community Production Survey in 2010; Fishery Statistics Analysis and Research Group, Information Technology Center, Department of Fisheries, Ministry of Agriculture and Cooperatives: Bangkok, Thailand, 2012; p. 103. (In Thai)
  14. DOF. Thai Fishing Vessels Statistics 2016; Fisheries Development Policy and Strategy Division, Department of Fisheries, Ministry of Agriculture and Cooperatives: Bangkok, Thailand, 2017; p. 200. (In Thai)
  15. Dessane, S. The Study for Assessment of Catch and Fishing Effort of Trawl Fisheries by Data from Port in-Port out, Fishing Logbook and Composition; Fisheries Development Policy and Strategy Division, Department of Fisheries, Ministry of Agriculture and Cooperatives: Bangkok, Thailand, 2018; p. 160. (In Thai)
  16. Chuapan, K.; Sinanan, P.; Sanitmajjaro, W.; Hoimuk, S.; Augsornpaob, U.; Chimkaew, W. Marine Resources in the Gulf of Thailand and Andaman Sea from Research Vessel during 2003–2005; Department of Fisheries, Ministry of Agriculture and Cooperatives: Bangkok, Thailand, 2008; p. 132. (In Thai)
  17. Sanitmajjaro, W.; Cheuapun, K.; Sinanant, P.; Chimkaew, W.; Hoimuk, S.; Maila-iad, P. Comparisons of Catch per Unit Effort of Marine Resources from Research Vessels in the Gulf of Thailand; Marine Fisheries Research and Development Bureau, Department of Fisheries, Ministry of Agriculture and Cooperatives: Bangkok, Thailand, 2005; pp. 1–19.
  18. Die, D.J.; Caddy, J.F. Sustainable yield indicators from biomass: Are there appropriate reference points for use in tropical fisheries? Fish. Res. 1997, 32, 69–79. [Google Scholar] [CrossRef]
  19. Saikliang, P. Status of Sardine Resources and Fisheries in the Gulf of Thailand; Marine Fisheries Research and Development Bureau, Department of Fisheries, Ministry of Agriculture and Cooperatives: Bangkok, Thailand, 2003; pp. 1–57. (In Thai)
  20. Boonsuk, S.; Jaiyen, T.; Sumontha, M.; Nontapun, T. Stock Assessment of Round Scad Decapterus maruadsi (Temminck & Schlegel, 1843) along the Andaman Sea Coast of Thailand; Marine Fisheries Research and Development Bureau, Department of Fisheries, Ministry of Agriculture and Cooperatives: Bangkok, Thailand, 2010. (In Thai)
  21. Boonsuk, S.; Sumontha, M.; Sa-nga-ngam, C.; Tes-a-sen, K. Stock Assessment of Anchovies (Encrasicholina devisi (Whitley, 1940), E. punctifer Fowler, 1938 and E. heteroloba (Ruppell, 1837)) along the Andaman Sea Coast of Thailand; Marine Fisheries Research and Development Bureau, Department of Fisheries, Ministry of Agriculture and Cooperatives: Bangkok, Thailand, 2010.
  22. Hoimuk, S.; Krajangdara, T.; Sumontha, M.; Boonsuk, S.; Singtongyam, W. Stock Assessment of Delagoa Threadfin Bream, Nemipterus bipunctatus (Valenciennes, 1830) along the Andaman Sea Coast of Thailand; Marine Fisheries Research and Development Bureau, Department of Fisheries, Ministry of Agriculture and Cooperatives: Bangkok, Thailand, 2013.
  23. Hoimuk, S.; Sumontha, M.; Boonsuk, S.; Keereetut, P.; Singtongyam, W. Stock Assessment of Purple-spotted Bigeye (Priacanthus tayenus (Richardson, 1846)) along the Andaman Sea Coast of Thailand; Marine Fisheries Research and Development Bureau, Department of Fisheries, Ministry of Agriculture and Cooperatives: Bangkok, Thailand, 2013.
  24. Jaiyen, T.; Boonsuk, S.; Sumontha, M.; Signtongyam, W.; Nontapun, T. Stock Assessment of Yellowstripe Scad (Selaroides leptolepis (Cuvier, 1833)) along the Andaman Sea Coast of Thailand; Marine Fisheries Research and Development Bureau, Department of Fisheries, Ministry of Agriculture and Cooperatives: Bangkok, Thailand, 2011.
  25. Keereerut, P.; Sumontha, M.; Boonsuk, S.; Singtongyam, W.; Nontapan, T. Stock Assessment of Hardtail Scad, Megalaspis cordyla (Linnaeus, 1758) along the Andaman Sea Coast of Thailand; Marine Fisheries Research and Development Bureau, Department of Fisheries, Ministry of Agriculture and Cooperatives: Bangkok, Thailand, 2011.
  26. Panjarat, S.; Boonsuk, S.; Sumontha, M.; Hoimook, S.; Singtongyam, W. Stock Assessment of Lizardfishes, Saurida undosquamis (Richardson, 1848) and S. elongata (Temminck & Schlegel, 184)), along the Andaman Sea Coast of Thailand; Marine Fisheries Research and Development Bureau, Department of Fisheries, Ministry of Agriculture and Cooperatives: Bangkok, Thailand, 2012.
  27. Sonthaya, B.; Kongprom, A.; Hoimuk, S.; Sumongha, M.; Tes-a-sen, K. Stock Assessment of Squids, Photololigo chinensis Gray, 1849 and P. duvaucelii d’Orbigan, 1835 along the Andaman Sea Coast of Thailand; Marine Fisheries Research and Development Bureau, Department of Fisheries, Ministry of Agriculture and Cooperatives: Bangkok, Thailand, 2010.
  28. Sumontha, M.; Boonsuk, S.; Panjarat, S.; Jaiyen, T.; Ritthisaman, J. Stock Assessment of Indian Mackerel (Rastrelliger kanagurta (Cuvier, 1816)) along the Andaman Sea Coast of Thailand; Marine Fisheries Research and Development Bureau, Department of Fisheries, Ministry of Agriculture and Cooperatives: Bangkok, Thailand, 2010.
  29. Sumontha, M.; Boonsuk, S.; Keereerut, P. Stock Assessment of Bigeye Scad (Selar crumenophthalmus (Bloch, 1793)) along the Andaman Sea Coast of Thailand; Marine Fisheries Research and Development Bureau, Department of Fisheries, Ministry of Agriculture and Cooperatives: Bangkok, Thailand, 2012.
  30. Loychuen, K.; Hoimuk, S.; Boonsuk, S.; Ritthisaman, J. Stock Assessment of Sunrise Goatfish Upeneus sulphureus (Cuvier, 1829) along the Andaman Sea Coast of Thailand; Marine Fisheries Research and Development Bureau, Department of Fisheries, Ministry of Agriculture and Cooperatives: Bangkok, Thailand, 2010; pp. 1–41. (In Thai)
  31. Kongprom, A.; Chuapun, K.; Augsorpa-ob, U.; Sinanun, T.; Khongchai, N.; Phoonsawat, R. Stock Assessment of Purple-Spotted Bigeye (Priacanthus tayenus Ricahardson, 1846) in the Gulf of Thailand; Marine Fisheries Research and Development Bureau, Department of Fisheries, Ministry of Agriculture and Cooperatives: Bangkok, Thailand, 2010; pp. 1–42. (In Thai)
  32. Sinanun, P.; Pankaew, K.; Yamrungrueng, A.; Boonjorn, N.; Tossapornpitakkul, S. Stock Assessment of Torpedo Scad (Megalaspis cordyla (Linnaeus, 1758)) in the Gulf of Thailand in 2007; Marine Fisheries Research and Development Bureau, Department of Fisheries, Ministry of Agriculture and Cooperatives: Bangkok, Thailand, 2012.
  33. Sinanun, P.; Sinanun, T.; Chaimeesook, K.; Augsornpa-ob, U.; Kongprom, A. Stock Assessment of Saurida elongata (Temminck & Schlegel, 1846) and S. undosquamis (Richardson, 1848) in the Gulf of Thailand; Marine Fisheries Research and Development Bureau, Department of Fisheries, Ministry of Agriculture and Cooperatives: Bangkok, Thailand, 2012.
  34. Sinanun, T. Stock Assessment of Blue Swimming Crab (Portunus Pelagicus (Linnaeus, 1758)) in the Eastern Gulf of Thailand; Marine Fisheries Research and Development Bureau, Department of Fisheries, Ministry of Agriculture and Cooperatives: Bangkok, Thailand, 2012.
  35. Thongsila, K.; Sinanun, T.; Noranarttragoon, P.; Boonjorn, N.; Khemakorn, P. Stock Assessment of Indian Mackerel (Rastrelliger kanagurta (Cuvier, 1817)) in the Gulf of Thailand; Marine Fisheries Research and Development Bureau, Department of Fisheries, Ministry of Agriculture and Cooperatives: Bangkok, Thailand, 2012.
  36. Thongsila, K.S.; Sinanun, T. Stock Assessment of Banana Prawn (Penaeus merguiensis De Man, 1888) in the Eastern Gulf of Thailand; Marine Fisheries Research and Development Bureau, Department of Fisheries, Ministry of Agriculture and Cooperatives: Bangkok, Thailand, 2013.
  37. Petchkamned, J.K.; Yamrungrueng, A.; Sin-a-nun, T. Stock Assessment of Anchovy in the Gulf of Thailand; Marine Fisheries Research and Development Bureau, Department of Fisheries, Ministry of Agriculture and Cooperatives: Bangkok, Thailand, 2014.
  38. Janekitkosol, W.; Somchanakij, H.; Eiamsa-ard, M.; Supongpan, M. Strategic review of the fishery situation in Thailand. In Assessment, Management and Future Directions for Coastal Fisheries in Asia Countries, Malaysia; Silvestre, G.G., Garces, L., Stobutzki, I., Ahmed, M., Valmonte-Santos, R.A., Luna, C., Lachica-Alino, L., Munro, P., Christensen, V., Pauly, D., Eds.; Worldfish Center Malaysia: Penang, Malaysia, 2003; pp. 915–955. [Google Scholar]
  39. Royal Thai Government Gazette. Fisheries Announcement. In Rule No. 135, Section No. 29D; Cabinet and Royal Gazette Publishing Office: Bangkok, Thailand, 2018; pp. 14–16.
  40. Morgan, A.C.; Burgess, G.H. Fishery-Dependent Sampling: Total Catch, Effort and Catch Composition. In Management Techniques for Elasmobranch Fisheries; Musick, J.A., Bonfil, R., Eds.; FAO Fisheries Technical Paper; FAO: Rome, Italy, 2005; pp. 182–200. [Google Scholar]
  41. Gulland, J.A. Manual of Methods for Fish Stock Assessment, Part 1, Fish Population Analysis; Fish Stock Evaluation Branch Fishery Resources and Exploitation Division; FAO: Rome, Italy, 1969; pp. 1–154.
  42. Sparre, P.; Venema, S.C. Introduction to Tropical Fish Stock Assessment. Part 1. Manual; FAO Fisheries Technical Paper. No. 306.1, REV. 2; FAO: Rome, Italy, 1998.
  43. Drammeh, O.K.L. Illegal, Unreported and Unregulated Fishing in Small-Scale Marine and Inland Capture Fishieries. FAO Report. Available online: http://www.fao.org/3/Y3274E/y3274e09.htm (accessed on 29 March 2020).
  44. Erceg, D. Deterring IUU fishing through state control over nationals. Mar. Policy 2006, 30, 173–179. [Google Scholar] [CrossRef]
  45. Halls, A.S.; Welcomme, R.L.; Burn, R.W. The relationship between multi-species catch and effort: Among fishery comparisons. Fish. Res. 2006, 77, 78–83. [Google Scholar] [CrossRef]
  46. Squires, D.; Maunder, M.; Vestergaard, N.; Restrepo, V.; Metzner, R.; Herrick, S., Jr.; Hannesson, R.; Del Valle, I. Effort rights in fisheries management: General principles and case studies from around the world. In Effort Rights in Fisheries Management: General Principles and Case Studies from Around the World, 17–20 September 2012, Bilbao, Spain; Squires, D., Maunder, M., Vestergaard, N., Restrepo, V., Metzner, R., Herrick, S., Hannesson, R., del Valle, I., Andersen, P., Eds.; FAO: Rome, Itlay, 2014; pp. 1–9. [Google Scholar]
  47. Squires, D.; Maunder, M. Synthesis of workshop results: Pros and cons of effort based management. In Effort Rights in Fisheries Management: General Principles and Case Studies from Around the World, 17–20 September 2012, Bilbao, Spain; Squires, D., Maunder, M., Vestergaard, N., Restrepo, V., Metzner, R., Herrick, S., Hannesson, R., del Valle, I., Andersen, P., Eds.; FAO: Rome, Italy, 2014; pp. 11–27. [Google Scholar]
  48. Squires, D.; Maunder, M.; Herrick, S., Jr.; Helvey, M.; Clarke, R. Effort rights-based management. In Effort Rights in Fisheries Management: General Principles and Case Studies from Around the World, 17–20 September 2012, Bilbao, Spain; Squires, D., Maunder, M., Vestergaard, N., Restrepo, V., Metzner, R., Herrick, S., Hannesson, R., del Valle, I., Andersen, P., Eds.; FAO: Rome, Italy, 2014; pp. 37–77. [Google Scholar]
  49. Cotter, J. Reforming the European Common Fisheries Policy: A case for capacity and effort controls. Fish Fish. 2010, 11, 210–219. [Google Scholar] [CrossRef]
  50. Bellido, J.M.; Sumaila, U.R.; Sánchez-Lizaso, J.L.; Palomares, M.L.; Pauly, D. Input versus output controls as instruments for fisheries management with a focus on Mediterranean fisheries. Mar. Policy 2020, 118, 103786. [Google Scholar] [CrossRef] [Green Version]
  51. Hoydal, K. Management of demersal fisheries in the Faroese Fishing Zone, FFT. In Effort Rights in Fisheries Management: General Principles and Case Studies from Around the World, 17–20 September 2012, Bilbao, Spain; Squires, D., Maunder, M., Vestergaard, N., Restrepo, V., Metzner, R., Herrick, S., Hannesson, R., del Valle, I., Andersen, P., Eds.; FAO: Rome, Italy, 2014; pp. 181–197. [Google Scholar]
  52. Hannesson, R. Effort versus quota control when stocks cannot be targeted. In Effort Rights in Fisheries Management: General Principles and Case Studies from Around the World, 17–20 September 2012, Bilbao, Spain; Squires, D., Maunder, M., Vestergaard, N., Restrepo, V., Metzner, R., Herrick, S., Hannesson, R., del Valle, I., Andersen, P., Eds.; FAO: Rome, Italy, 2014; pp. 87–97. [Google Scholar]
  53. Ellefson, H. The transferable effort system in the Faroe Islands. In Effort Rights in Fisheries Management: General Principles and Case Studies from Around the World, 17–20 September 2012, Bilbao, Spain; Squires, D., Maunder, M., Vestergaard, N., Restrepo, V., Metzner, R., Herrick, S., Hannesson, R., del Valle, I., Andersen, P., Eds.; FAO: Rome, Italy, 2014; pp. 151–162. [Google Scholar]
  54. Rijnsdorp, A.D.; Daan, N.; Dekker, W.; Poos, J.J.; Van Densen, W.L.T. Sustainable use of flatfish resources: Addressing the credibility crisis in mixed fisheries management. J. Sea Res. 2007, 57, 114–125. [Google Scholar] [CrossRef]
  55. Rätz, H.-J.; Lloret, J. Inter-species quota flexibility—Exploring a new management tool in European Common Fisheries Policy. Ocean Coast. Manag. 2018, 163, 222–231. [Google Scholar] [CrossRef]
  56. Baudron, A.; Ulrich, C.; Nielsen, J.; Boje, J. Comparative evaluation of a mixed-fisheries effort-management system based on the Faroe Islands example. ICES J. Mar. Sci. 2010, 67, 1036–1050. [Google Scholar] [CrossRef] [Green Version]
  57. García-Carreras, B.; Dolder, P.; Engelhard, G.H.; Lynam, C.P.; Bayliss-Brown, G.A.; Mackinson, S. Recent experience with effort management in Europe: Implications for mixed fisheries. Fish. Res. 2015, 169, 52–59. [Google Scholar] [CrossRef]
  58. Hannesson, R. Is there a case for effort control? In Effort Rights in Fisheries Management: General Principles and Case Studies from Around the World, 17–20 September 2012, Bilbao, Spain; Squires, D., Maunder, M., Vestergaard, N., Restrepo, V., Metzner, R., Herrick, S., Hannesson, R., del Valle, I., Andersen, P., Eds.; FAO: Rome, Italy, 2014; pp. 79–85. [Google Scholar]
  59. Clarke, R.; Dalzell, P.; Ikehara, W. Hawaii pelagic longline fishery and sea turtle bycatch—The use of set certificates as an allocation solution. In Effort Rights in Fisheries Management: General Principles and Case Studies from Around the World, 17–20 September 2012, Bilbao, Spain; Squires, D., Maunder, M., Vestergaard, N., Restrepo, V., Metzner, R., Herrick, S., Hannesson, R., del Valle, I., Andersen, P., Eds.; FAO: Rome, Italy, 2014; pp. 135–149. [Google Scholar]
  60. Thunberg, E.; Lee, M.Y. The effort control programme in the northeast United States groundfish fishery. In Effort Rights in Fisheries Management: General Principles and Case Studies from Around the World, 17–20 September 2012, Bilbao, Spain; Squires, D., Maunder, M., Vestergaard, N., Restrepo, V., Metzner, R., Herrick, S., Hannesson, R., del Valle, I., Andersen, P., Eds.; FAO: Rome, Italy, 2014; pp. 215–234. [Google Scholar]
  61. Mulazzani, L.; Camanzi, L.; Bonezzi, A.; Malorgio, G. Individual transferable effort quotas for Italian fisheries? A preliminary analysis. Mar. Policy 2018, 91, 14–21. [Google Scholar] [CrossRef]
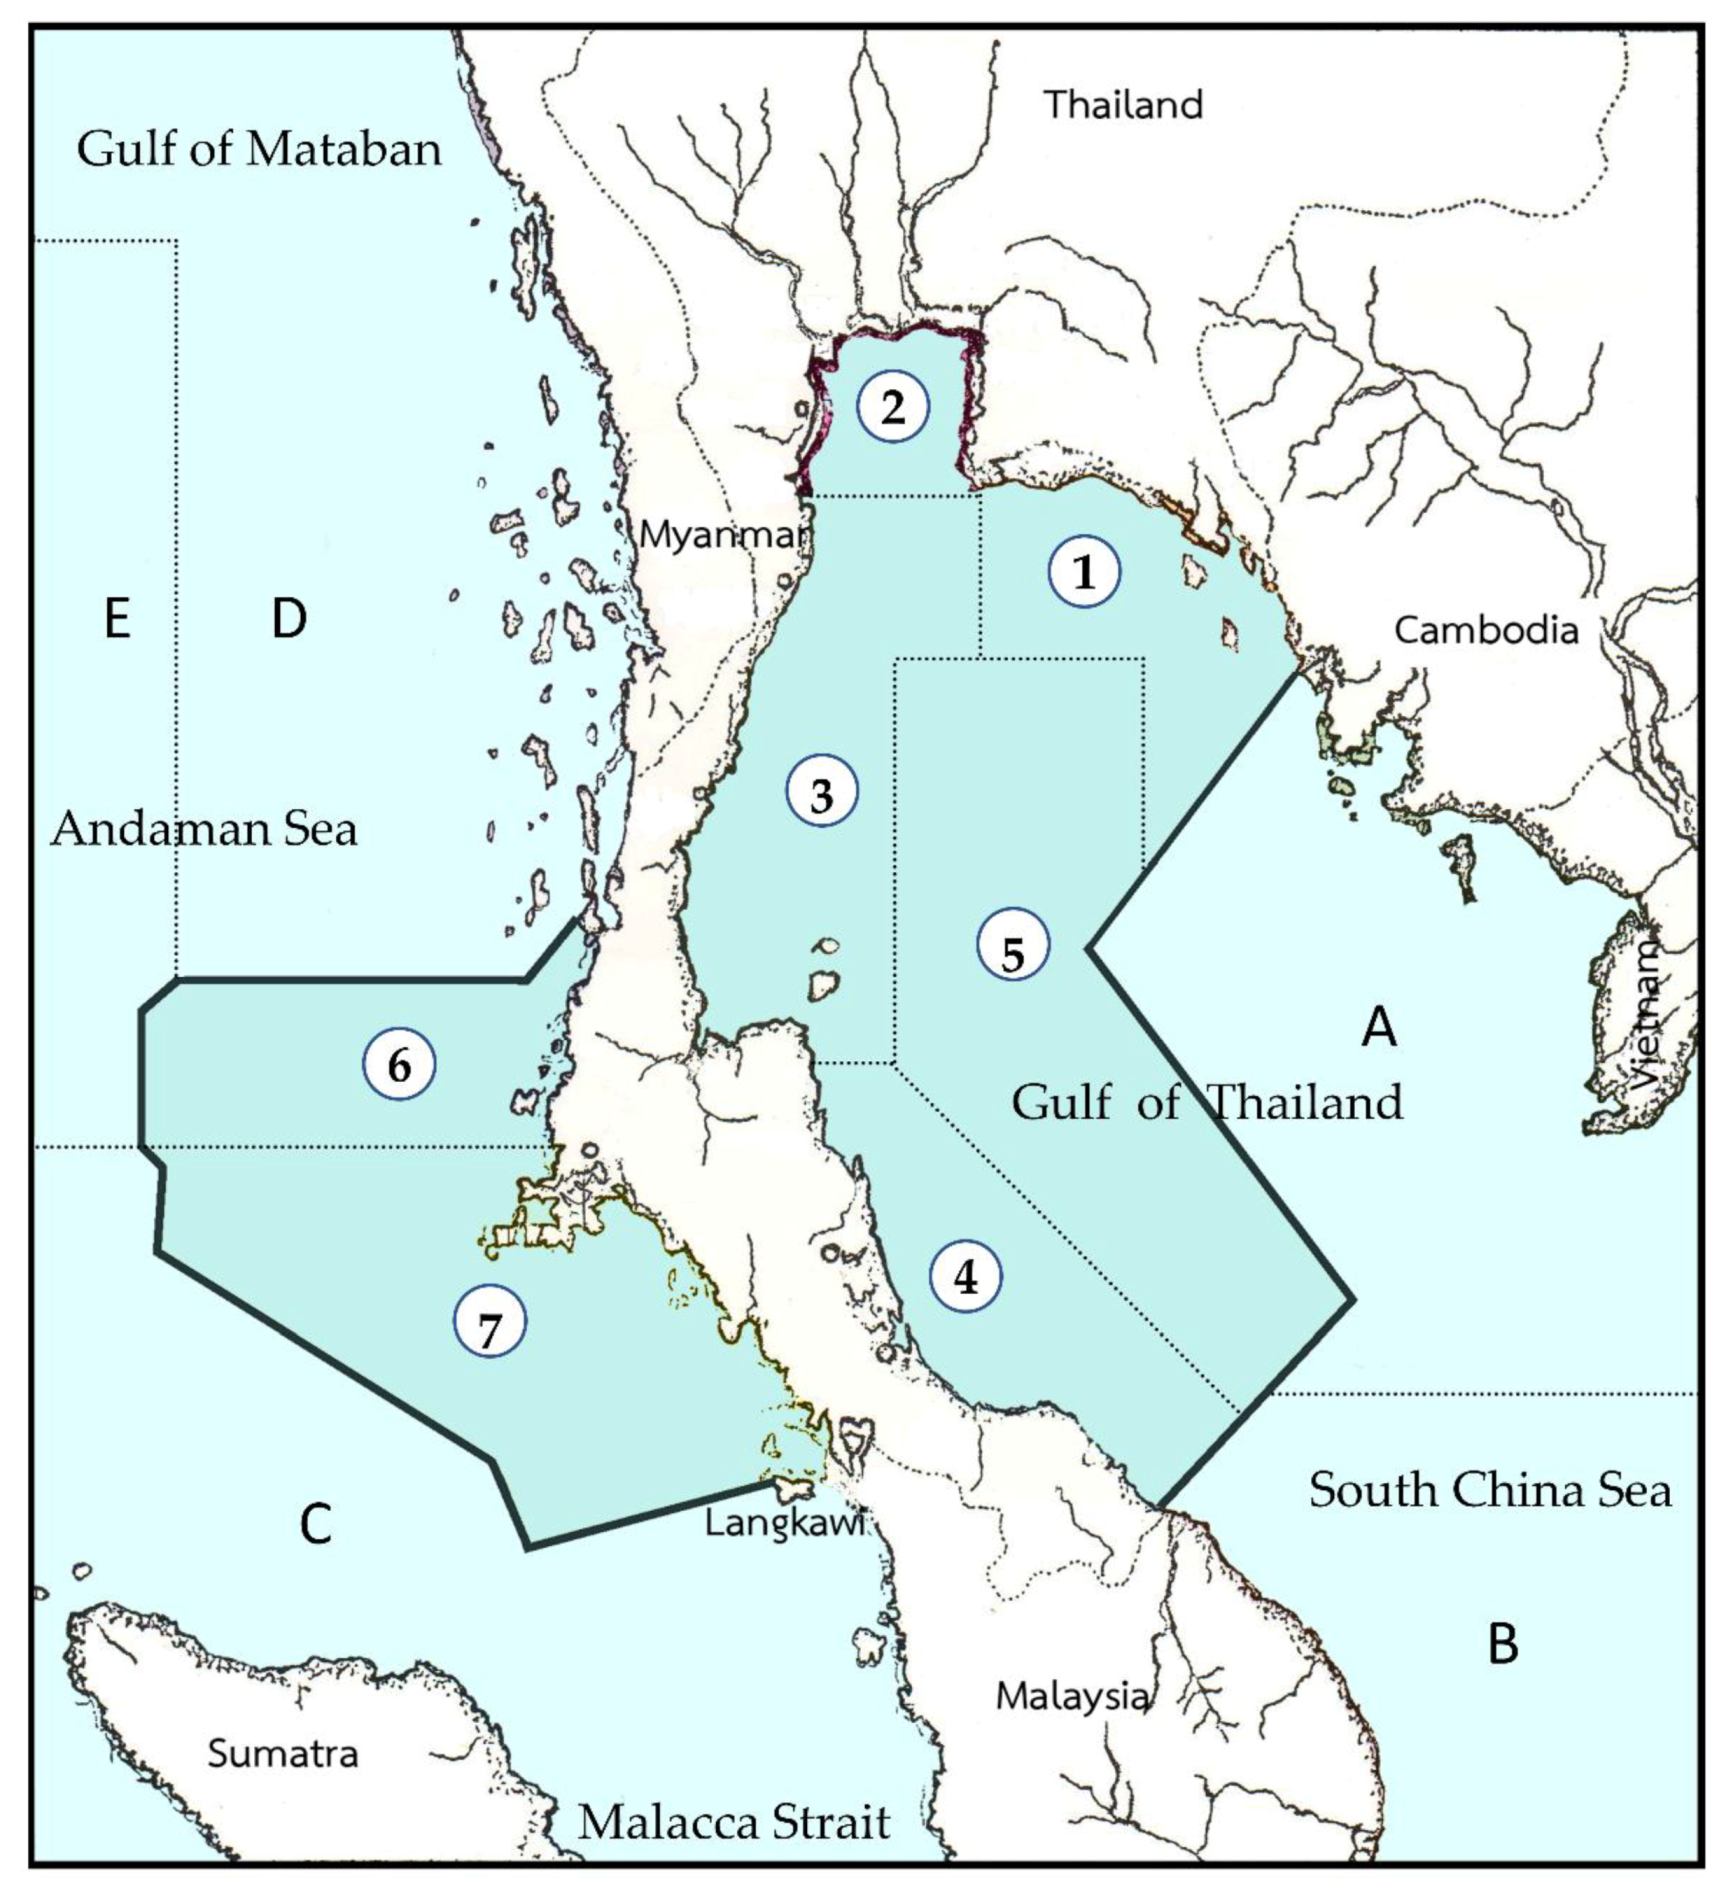
Figure 1. Fishing areas for fisheries statistic data collection in Thailand [11]. The thick lines represent the limits of the Exclusive Economic Zone (EEZ), and the dotted lines delineate the fishing areas.
Sustainability 12 05841 g001
Figure 2. Survey stations by research vessels [16] in the Gulf of Thailand and the Andaman Sea.
Sustainability 12 05841 g002
Figure 3. Fisheries management process in Thailand before 2015.
Sustainability 12 05841 g003
Figure 4. The number of active vessels in Thailand (Source: The National Fishing Fleet Survey, July 2015).
Sustainability 12 05841 g004
Figure 5. The process of fisheries management in Thailand after 2015.
Sustainability 12 05841 g005
Figure 6. The location of port-in and port-out (PIPO) centers and forward inspection points (FIPs); Source: Fishing and Fleet Management Division, DOF, Thailand.
Sustainability 12 05841 g006
Figure 7. An overview of the activities of the port-in and port-out (PIPO) Command Centre.
Sustainability 12 05841 g007
Figure 8. CPUE (kg/h) of research vessel trawl surveys; (a) the Gulf of Thailand during 1961–2019; (b) the Andaman Sea during 1966–2019.
Sustainability 12 05841 g008
Figure 9. Maximum sustainable yield (MSY) of selected marine fisheries resources in the Gulf of Thailand and actual catch and effort in 2014 (2015 is the first year of MSY assessment) compared with the actual catch in 2017; (a) Demersal fish in 2014; (b) Demersal fish in 2017; (c) Pelagic fish in 2014; (d) Pelagic fish in 2017; (e) Anchovy fish in 2014; (f) Anchovy fish in 2017.
Sustainability 12 05841 g009
Figure 10. Maximum sustainable yield (MSY) of selected marine fisheries resources in the Andaman Sea and actual catch and effort in 2014 (2015 is the first year of MSY assessment) compared with the actual catch in 2017; (a) Demersal fish in 2014; (b) Demersal fish in 2017; (c) Pelagic fish in 2014; (d) Pelagic fish in 2017; (e) Anchovy fish in 2014; (f) Anchovy fish in 2017.
Sustainability 12 05841 g010
Table 1. Fishing areas and stations surveyed by research vessels in the Gulf of Thailand and the Andaman Sea.
AreaStation Number
Gulf of ThailandArea 142, 44, 57
Area 218, 20, 28, 30, 38, 40
Area 32, 5, 7, 9, 11
Area 414, 16, 24, 26, 34, 36, 47, 49
Area 558, 60, 62, 73, 75, 87, 89, 101, 103
Area 6117, 119, 136, 138, 156, 158, 177, 179, 181
Area 7201, 221, 243, 245, 268, 270
Area 8294, 296, 319, 321, 345, 347, 371, 373
Area 9395, 397, 399, 420, 422, 424, 445, 447, 466
Andaman SeaArea 11, 3, 4, 7, 8
Area 211, 12, 16, 21
Area 314, 17, 23, 27, 29
Area 430, 32, 34, 36, 37, 38, 39, 43
Table 2. Maximum sustainable yield (MSY) of marine fisheries resources in Thai waters in 2017.
Fishing Areas/Resource GroupsMSY (Tons)Optimal Fishing Effortin 2017Status of Fisheries
Catch (Tons)Fishing EffortExceeded/Balanced/LowerPercentage
Gulf of Thailand
  • Demersal fish
795,86922.80 mh 1462,51222.29 mh0.51 mh−2.28%
  • Pelagic fish
250,739135,882 days199,507111,999 days23,883 days−21.32%
  • Anchovies
201,564171,378 days108,21255,518 days115,860 days−208.69%
Andaman Sea
  • Demersal fish
240,9165.69 mh140,1303.55 mh2.14 mh−60.20%
  • Pelagic fish
118,75571,260 days121,40045,094 days26,166 days−58.03%
  • Anchovies
33,19455,101 days13,57019,348 days35,753 days−184.79%
Grand total1,641,037-1,045,331---
1 mh = million hours.
Table 3. Total allowable catch and standard fishing effort allocated for the Gulf of Thailand and the Andaman Sea in 2018.
Fishing Areas/Resource GroupsMSY (Tons)Total Allowable Catch (Tons)Standard Fishing Effort at MSYStandard Fishing Effort at Total Allowable Catch (TAC)Catch Per Unit of Effort (CPUE) of Standard Gear at TAC
Gulf of Thailand
  • Demersal fish
795,869756,07622,796,139 h16,252,550 h46.52 kg/h
  • Pelagic fish
250,739238,202135,882 days96,877 days2458.81 kg/day
  • Anchovy
201,564191,486171,378 days122,185 days1567.18 kg/day
Sub-total1,248,1721,185,763---
Andaman Sea
  • Demersal fish
240,916228,8705,688,096 h4,055,350 h56.44 kg/h
  • Pelagic fish
118,755112,81771,260 days50,805 days2220.59 kg/day
  • Anchovy
33,19431,53455,101 days39,285 days802.70 kg/day
Sub-total392,865373,221---
Grand total1,641,0371,558,984---
Table 4. Activities and time frame for commercial fishing license issuance process in 2018.
ActivityPeriod
1.Application for the fishing license20 January to 20 February 2018
2.Vessel inspection for renewing of vessel permit20 January to 28 February 2018
3.Consideration and allocation of fishing licenses by the Consideration and Allocation Committee1–15 March 2018
4.Receive of fishing licenses (Pay for the license fee/Receive fishing license/Receive appointment document of fishing gear inspection)16–30 March 2018
5.Fishing gear inspection follows the Thai Department of Fisheries (DOF) fishing gear inspection procedureFrom 17 March 2018, onward
Table 5. The classification of fishing gears according to their catching efficiency.
High-Efficiency Fishing GearLow-Efficiency Fishing Gear
1. Pair trawl9. Squid falling net
2. Otter board trawl10. Pomfret lift net
3. Beam trawl11. Gillnet
4. Purse seine12. Krill push net
5. Anchovy purse seine13. Baby clam dredge
6. Anchovy falling net14. Blood clam dredge
7. Anchovy lift net15. Other shell dredges
8. Light luring vessel16. Fish trap
17. Crab trap
18. Squid trap
19. Octopus trap
20. Longline
21. Red frog crab lift net
22. Handline
Table 6. Total allowable catch and allocated fishing efforts to fishing vessels in the Gulf of Thailand and the Andaman Sea in 2018.
TAE in 2018Allocated Standard Fishing EffortBalance ofStandard EffortTAC in 2018Allocated Catch (Tons)Balance (Tons)
Gulf of Thailand
Total 1,185,7641,096,05389,711
1. Demersal16,252,550 h15,552,363 h700,187 h756,076723,50332,573
2. Pelagic96,877 days85,910 days10,967 days238,202211,23726,965
3. Anchovy122,185 days102,932 days19,253 days191,486161,31330,173
Andaman Sea
Total 373,221341,57031,651
1. Demersal4,055,335 h3,684,832 h370,503 h228,870207,96020,910
2. Pelagic50,805 days48,030 days2775 days112,817106,6556162
3. Anchovy39,285 days33,581 days5704 days31,53426,9554579
TAE = Total allowable effort; TAC = Total allowable catch.
Table 7. Number of fishing license and expected fishing effort and catch allocated to the existing fishing vessels in the Gulf of Thailand in 2018.
Fishing License (Gulf of Thailand; GoT)
S (10–29.99 GT)M (20–59.99 GT)L (60–149.99 GT)X (≥150 GT)TotalEstimated Total Standard EffortEstimated Catch
Total artisanal vessels in GoT 18,391 100,618
Total artisanal vessels with high-efficiency gear in GoT 542 53,999
Total commercial vessels in GoT 140838881962658574 941,436
1. Demersal
Total artisanal vessels 17,2692,015,54393,764
Total artisanal vessels with high-efficiency gear 413947,15344,062
Total commercial vessels11633031122513543212,589,670585,677
2. Pelagic
Total artisanal vessels 112227886854
Total artisanal vessels with high-efficiency gear 10426986635
Total commercial vessels17248255734124579,743197,748
3. Anchovy
Total artisanal vessels - -
Total artisanal vessels with high-efficiency gear 2521073302
Total commercial vessels7337518018646100,825158,011
GT = Gross tonnage.
Table 8. Number of fishing license and expected fishing effort and catch allocated to the existing fishing vessels in the Andaman Sea in 2018.
Fishing License (Andaman Sea; AS)
S (10–29.99 GT)M (20–59.99 GT)L (60–149.99 GT)X (≥150 GT)TotalEstimated Total Standard EffortEstimated Catch
Total artisanal vessels in AS 7278 50,688
Total artisanal vessels with high-efficiency gear in AS 64 14,360
Total commercial vessels in AS 1855585133013150296,269
1. Demersal
Total artisanal vessels 6737 817,623 46,144
Total Artisanal vessels with high-efficiency gear 39 90,703 5119
Total Commercial vessels147381339108772,776,522156,698
2. Pelagic
Total Artisanal vessels 541 2046 4544
Total Artisanal vessels with high-efficiency gear 25 4161 9241
Total commercial vessels15 77 151 20 263 41,822 92,870
3. Anchovy
Total artisanal vessels - -
Total artisanal vessels with high-efficiency gear - -
Total commercial vessels32 115 28 175 33,580 26,955
GT = Gross tonnage.

