Article

Comparison of Distribution and Density of Nemopilema nomurai by Water Columns Using Echo Counting and Echo Integration Methods

1
Climate Change Research Division, National Institute of Fisheries Sciences, Busan 46083, Korea
2
Marine Environmental Research & Information Laboratory, Gunpo 15850, Korea
3
Division of Fisheries Science, Chonnam National University, Yeosu 59626, Korea
*
Author to whom correspondence should be addressed.
Sustainability 2020, 12(14), 5823; https://doi.org/10.3390/su12145823
Submission received: 27 May 2020 / Revised: 15 July 2020 / Accepted: 16 July 2020 / Published: 20 July 2020
(This article belongs to the Special Issue Harmful Organisms and their Management for Sustainable Environment)

Abstract

:
In this study, the distribution of Nemopilema nomurai in the waters of Mijo-myeon, Namhae and Gijang-gun, Busan was analyzed; furthermore, echo counting and echo integration methods were used to compare the distribution density. The acoustic system used in the study was a split beam scientific echosounder operating at 38 and 120 kHz (EK-60, Simrad, Norway). Echo counting and echo integration methods were used to determine the density of N. nomurai distributed in the survey areas. The distribution of N. nomurai by water columns, estimated using an echo counting method, was concentrated at approximately 10 m deep in the waters of Mijo, Namhae and 10–50 m deep in the waters of Gijang, Busan; moreover, the distributed depth varied by the surveyed date and time. It was shown that analyzing the acoustic scattering strength of jellyfish obtained from the echo counting method would be more effective for distributional survey of N. nomurai with two frequency system.

1. Introduction

Owing to global warming, the water temperature is increasing, and N. nomurai, known to originate from the coastal waters of China, has been migrating into Korea’s coastal waters, causing direct and indirect damages to the fishery and maritime industries [1,2]. In general, the occurrence of jellyfish decreases the catch level of fish and the freshness of fish caught, causing serious economic repercussions to the fishery industry; in addition, it can cause sea bathers to experience jellyfish stings, which can result in a number of socio–economic problems [3,4].
Preventing or mitigating such damage requires the acquisition of a wide range of information, including migration routes as well as physiological and ecological behaviors of jellyfish [5]. Methods of studying the distribution and migration routes of jellyfish include visual surveys, aerial surveys, and sample collection using sampling gears [6]. Such methods are useful to rapidly determine the level of occurrence but pose difficulties for analyzing the distribution by water column [7,8].
The acoustic survey method enables information regarding marine organisms in all water columns in a wide area to be obtained in a short time period. Acoustic survey methods to examine marine organisms include the echo counting and echo integration methods. The echo counting method, first proposed by Trout et al. [9], can be applied when the target exists separately from other animals and involves counting each echo signal of an individual fish. The echo integration method, which receives echo signals of all organisms in a mixture to estimate the biomass, is regarded to have a higher degree of certainty than the echo counting method when estimating the biomass of aquatic organisms aggregated in schools [10,11]. The method has been applied to the estimation of clupeoids, gadoids, salmonids, krill, etc. [12,13,14]. The two methods above are complementary methods that can be used to obtain the biomass estimates of aquatic organisms in oceans. As N. nomurai distributes independently, both echo counting and echo integration can be applied [15].
Therefore, in this study, the distribution of N. nomurai in the waters of Mijo-myeon, Namhae and Gijang-gun, Busan was examined based on water columns, and echo counting and echo integration methods were used to compare the distribution density.

2. Material and Methods

2.1. The Surveyed Area and Date

In this study, an underwater acoustic survey was conducted to determine the distribution depth and density of N. nomurai in the waters of Mijo-myeon, Namhae and Gijang, Busan, and the acoustic survey transect lines are illustrated in Figure 1. Additionally, the surveyed time, length of transects, and survey area are presented in Table 1. For the case of Mijo-myeon, Namhae, the same transect was surveyed repeatedly for six times.

2.2. Acoustic Equipment System and Data Collection

The acoustic system used in the study was a split-beam-type scientific echosounder at frequencies 38 and 120 kHz (EK-60, Kongsberg Maritime AS, Horten, Norway). Prior to the collection of acoustic data, the system was calibrated at each frequency using a copper sphere in a seawater acoustics tank (5 m × 5 m × 5 m) installed at the Fisheries Science Institute, Chonnam National University (Dolsan-eup, Yeosu-si, Jeollanam-do). The calibration results of the scientific echosounder are presented in Table 2. During the in-situ acoustic data collection, the location information was continuously received and synchronized with the scientific echosounder by DGPS system (DSPR-1400, Samyung ENC, Busan, Korea), and the acoustic data were continuously recorded in the data storage device. The pulse width and repetition frequency of the acoustic data were set to 1.024 ms and 1 s, respectively, as recommended by the acoustic stock assessment method [14]. A transducer was installed on a towed object and placed at 1.5 m depth, whereas the vessel speed was maintained at 6–7 knots during the data collection.

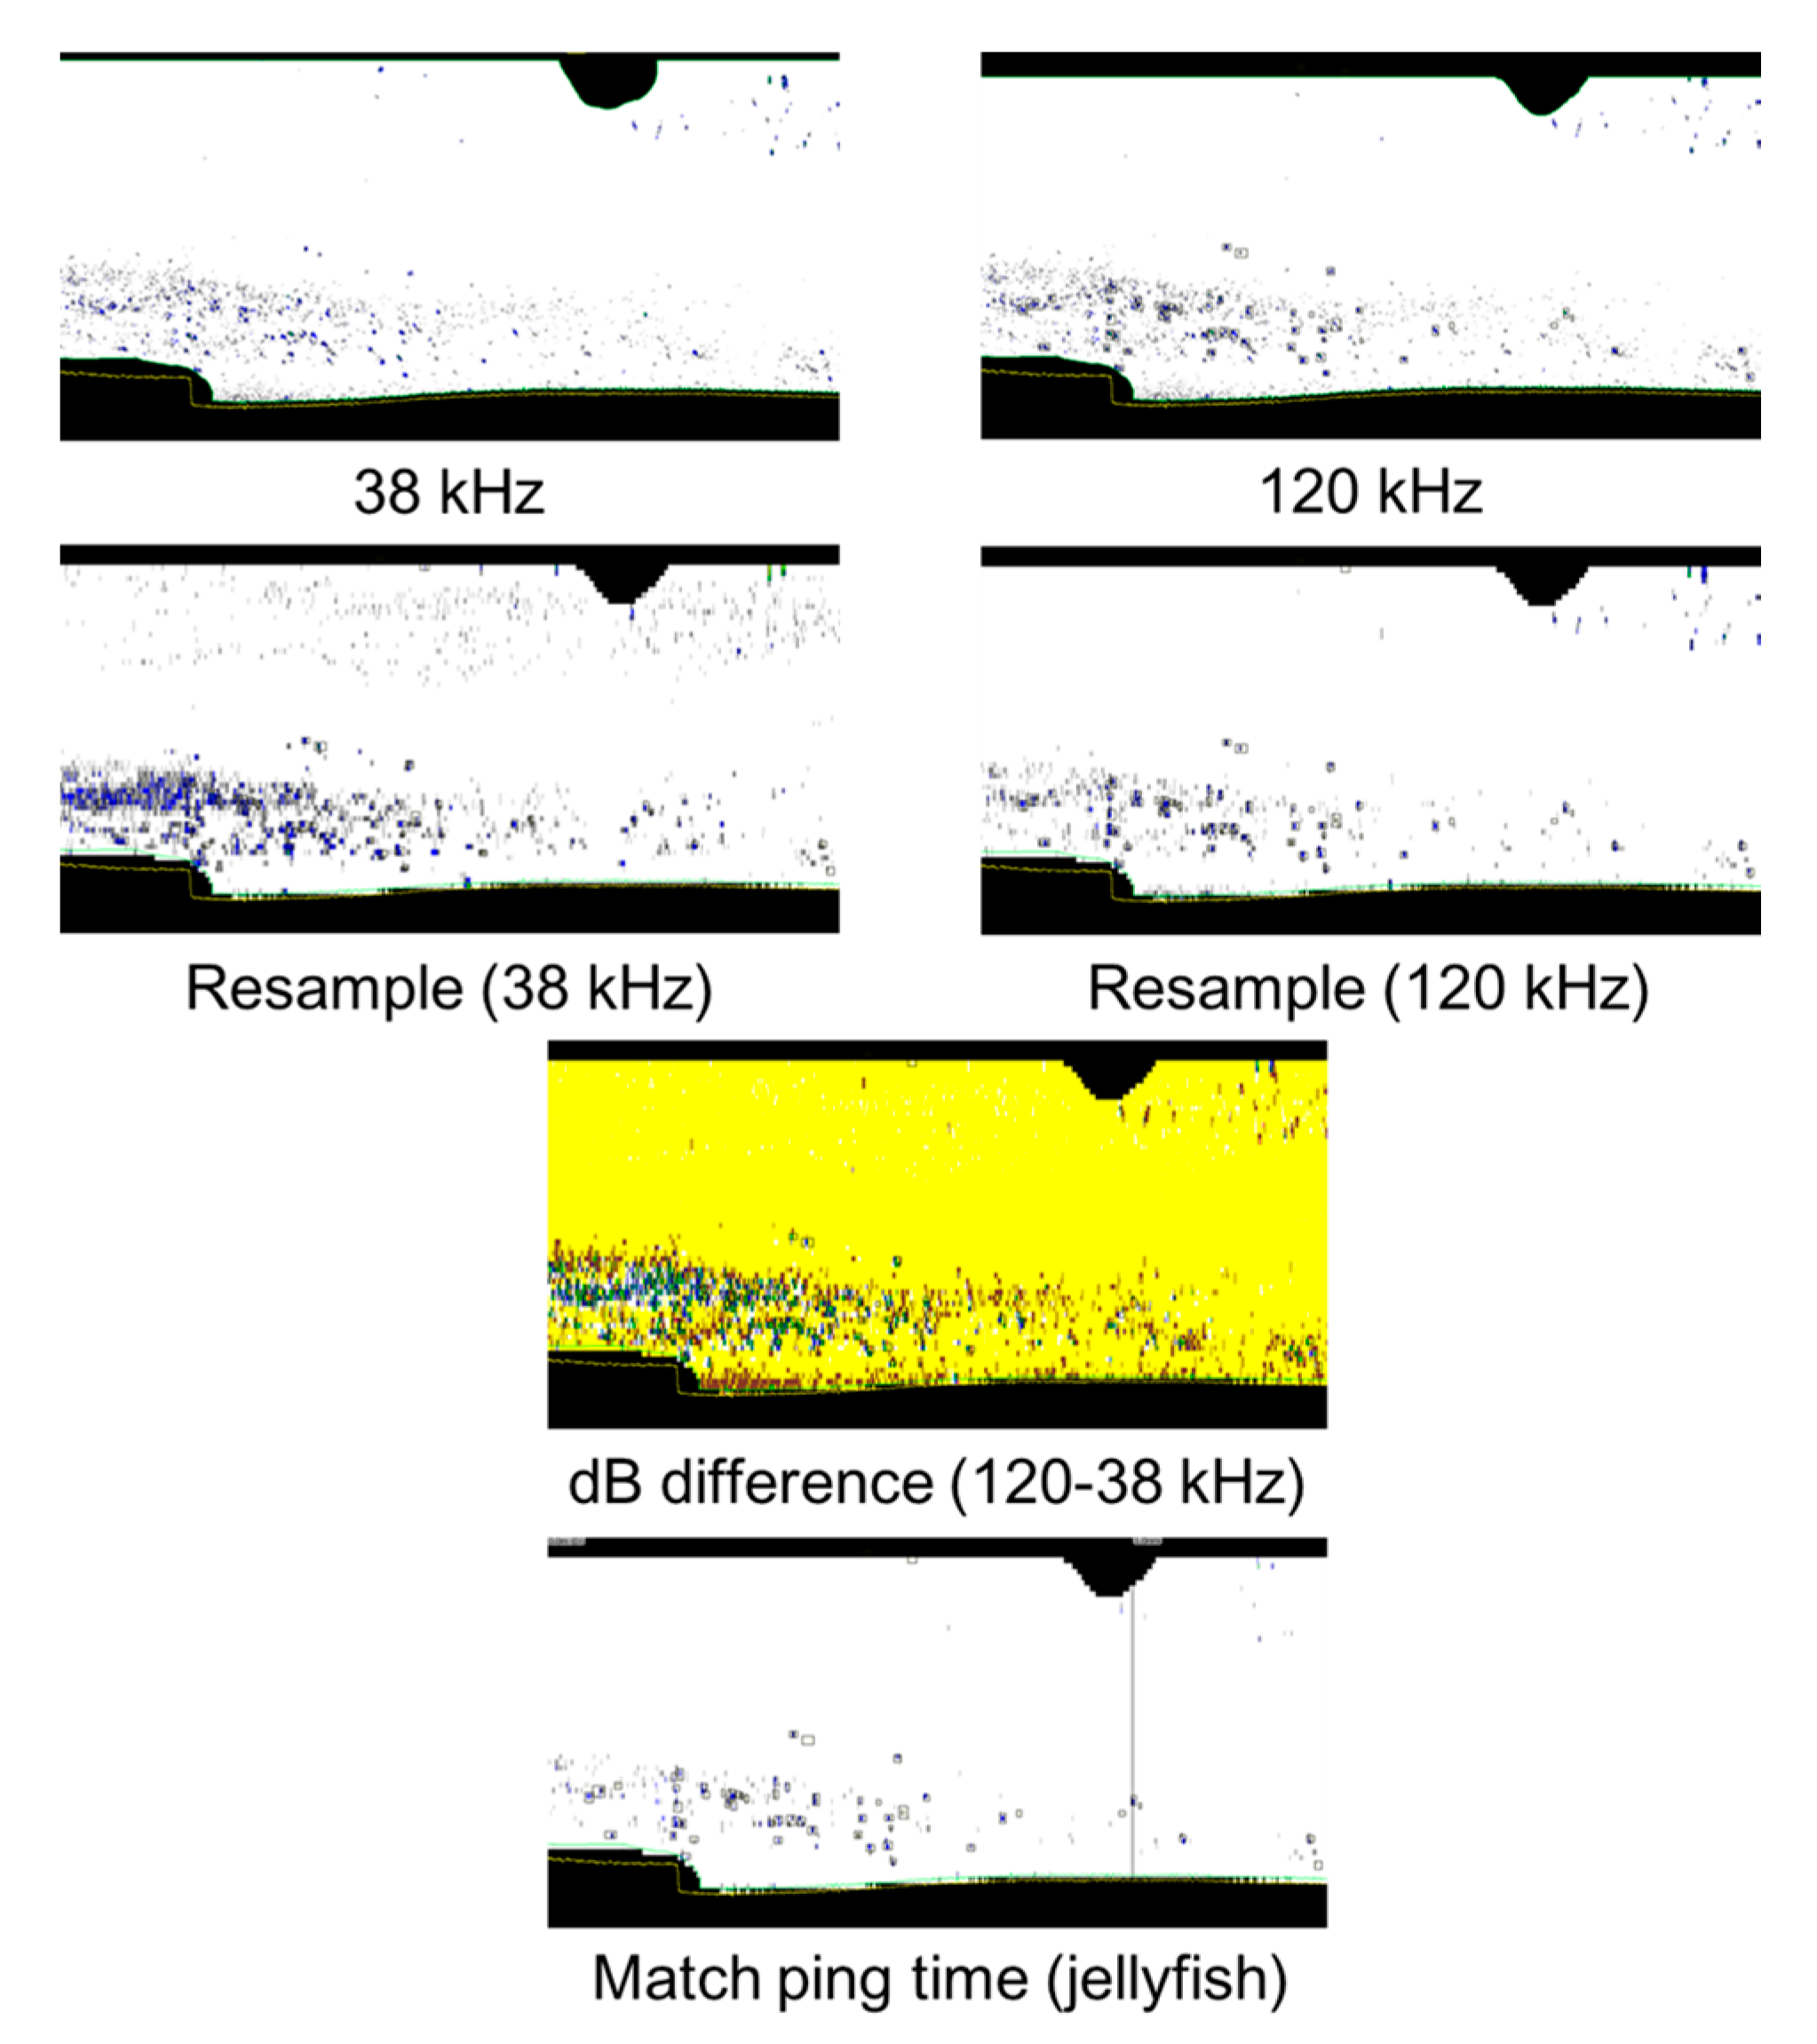
2.3. Acoustic Data Analysis

The analysis of acoustic data collected on site was conducted at the laboratory using a post-processing software (Echoview V9.0, Echoview Software Pty Ltd, Hobart, Australia). Methods to determine the density of N. nomurai distributed in the study area can be distinguished into the echo counting and echo integration methods. The echo counting method aggregates echo signals of jellyfish displayed on the echogram to obtain the number of jellyfish individuals detected within the beam width, and the detected density of the vessel’s log distance can be expressed as shown in Equations (1) and/or (2) [15].
Density (ind/m) = Count of individual jellyfish/Log distance
Density (ind/m3) = Count of individual jellyfish/(Log distance × beam area)
The echo integration method requires an estimation of the frequency differences between 38 and 120 kHz to separate the echo signal of the jellyfish from other organisms. Meanwhile, the frequency difference refers to the mean volume backscattering strength, i.e., ∆MVBS at multiple frequencies, which can be expressed as Equation (3).
Δ MVBS = TS   ( 120   kHz ) TS   ( 38   kHz ) = SV   ( 120   kHz ) SV   ( 38   kHz )
A data processing flowchart to describe the frequency difference and jellyfish identification is illustrated in Figure 2. As shown, noise was filtered from the sea surface area, sea bottom, etc., and an integral section was set to construct a matrix for each frequency and generate a new echogram. The cell size was set to 10 ping × 1 m (width × length) in this study to analyze the frequency difference between scattering objects by the water column.
After the frequency difference of the echo signals of N. nomurai became clear in the echogram, the range was selected to create a data range bitmap. The result obtained from masking the range with an echo signal of an equal cell size of 120 kHz was divided by the ping interval; subsequently, the resampled signal, which was equal to the cleaned 120 kHz signal, was considered an input echo signal of N. nomurai in the echo integration method, which enabled the simple separation of the jellyfish echo signals (Figure 3). Echogram images corresponding to the data processing flowchart in Figure 2 are presented in Figure 3.
The range of frequency difference used to extract signals from N. nomurai was determined using 2.2   dB < Δ MVBS 120 38   kHz < 5.6   dB to obtain the echo signals [2]. Furthermore, the target strength used in estimating the density of N. nomurai was obtained using TS 120   kHz = 10 log π ( D / 2 ) 2 83.15 [16].
The echo signals of N. nomurai derived using the described equation were integrated at intervals of 1 n.mile (elementary distance sampling unit) up to 100 m deep from the surface and are expressed as the nautical area scattering coefficient (NASC, m2/nmi2) values.

3. Results

3.1. Vertical Distribution of N. nomurai

The distribution of N. nomurai in the coastal waters of Mijo, Namhae by time of day and depth using the echo counting method is presented in Figure 4. A total of 107 jellyfish individuals were counted, and N. nomurai were mainly distributed at 10 m deep. The density of N. nomurai measured at different time periods was the highest at the fifth trial (i.e., 33.75 (10−4 ind/m)) and the lowest at the first trial (i.e., 6.25 (10−4 ind/m)) (Table 3).
The distribution of N. nomurai by depth in the waters of Gijang, Busan was determined using the echo counting method (Figure 5). N. nomurai distributed at 50 m deep in area Gijang-A in the afternoon; 10–40 m deep in area Gijang-B in the morning; and 10 m deep in areas Gijang-B and Gijang-C in the afternoon and morning, respectively. The highest mean density of N. nomurai among all surveyed areas was 370.63 (10−4 ind/m), obtained in area-C in the morning, whereas the lowest mean density was 163.38 (10−4 ind/m), obtained in area-B in the morning (Table 4).

3.2. Horizontal Distribution of N. nomurai in Survey Area

The horizontal distribution of N. nomurai was obtained using echo counting and echo integration methods (Figure 6). The occurrence of N. nomurai in the waters of Mijo, Namhae, measured using the echo counting method, was relatively high in the coastal area and waters adjacent to the island, whereas it was relatively low in the central waters. The echo integration method showed that the jellyfish were uniformly distributed in general but relatively higher in coastal waters adjacent to lands and islands.
The horizontal NASC values of N. nomurai in area-A of the waters of Gijang, Busan were strongly distributed at both ends of transect 1 in both the echo counting and the echo integration methods (Figure 7); however, they were relatively weak in other transects. In area Gijang-B in the morning, the echo counting method showed a high distribution in transect 2, whereas the echo integration method showed a relatively higher distribution in the open sea. In area Gijang-B in the afternoon, a higher distribution was observed in transects 1, 3, and 4 for both the echo counting and echo integration methods. In area Gijang-C in the morning, a relatively higher distribution was observed in the coastal waters than in the open seas for both the echo counting and echo integration methods.

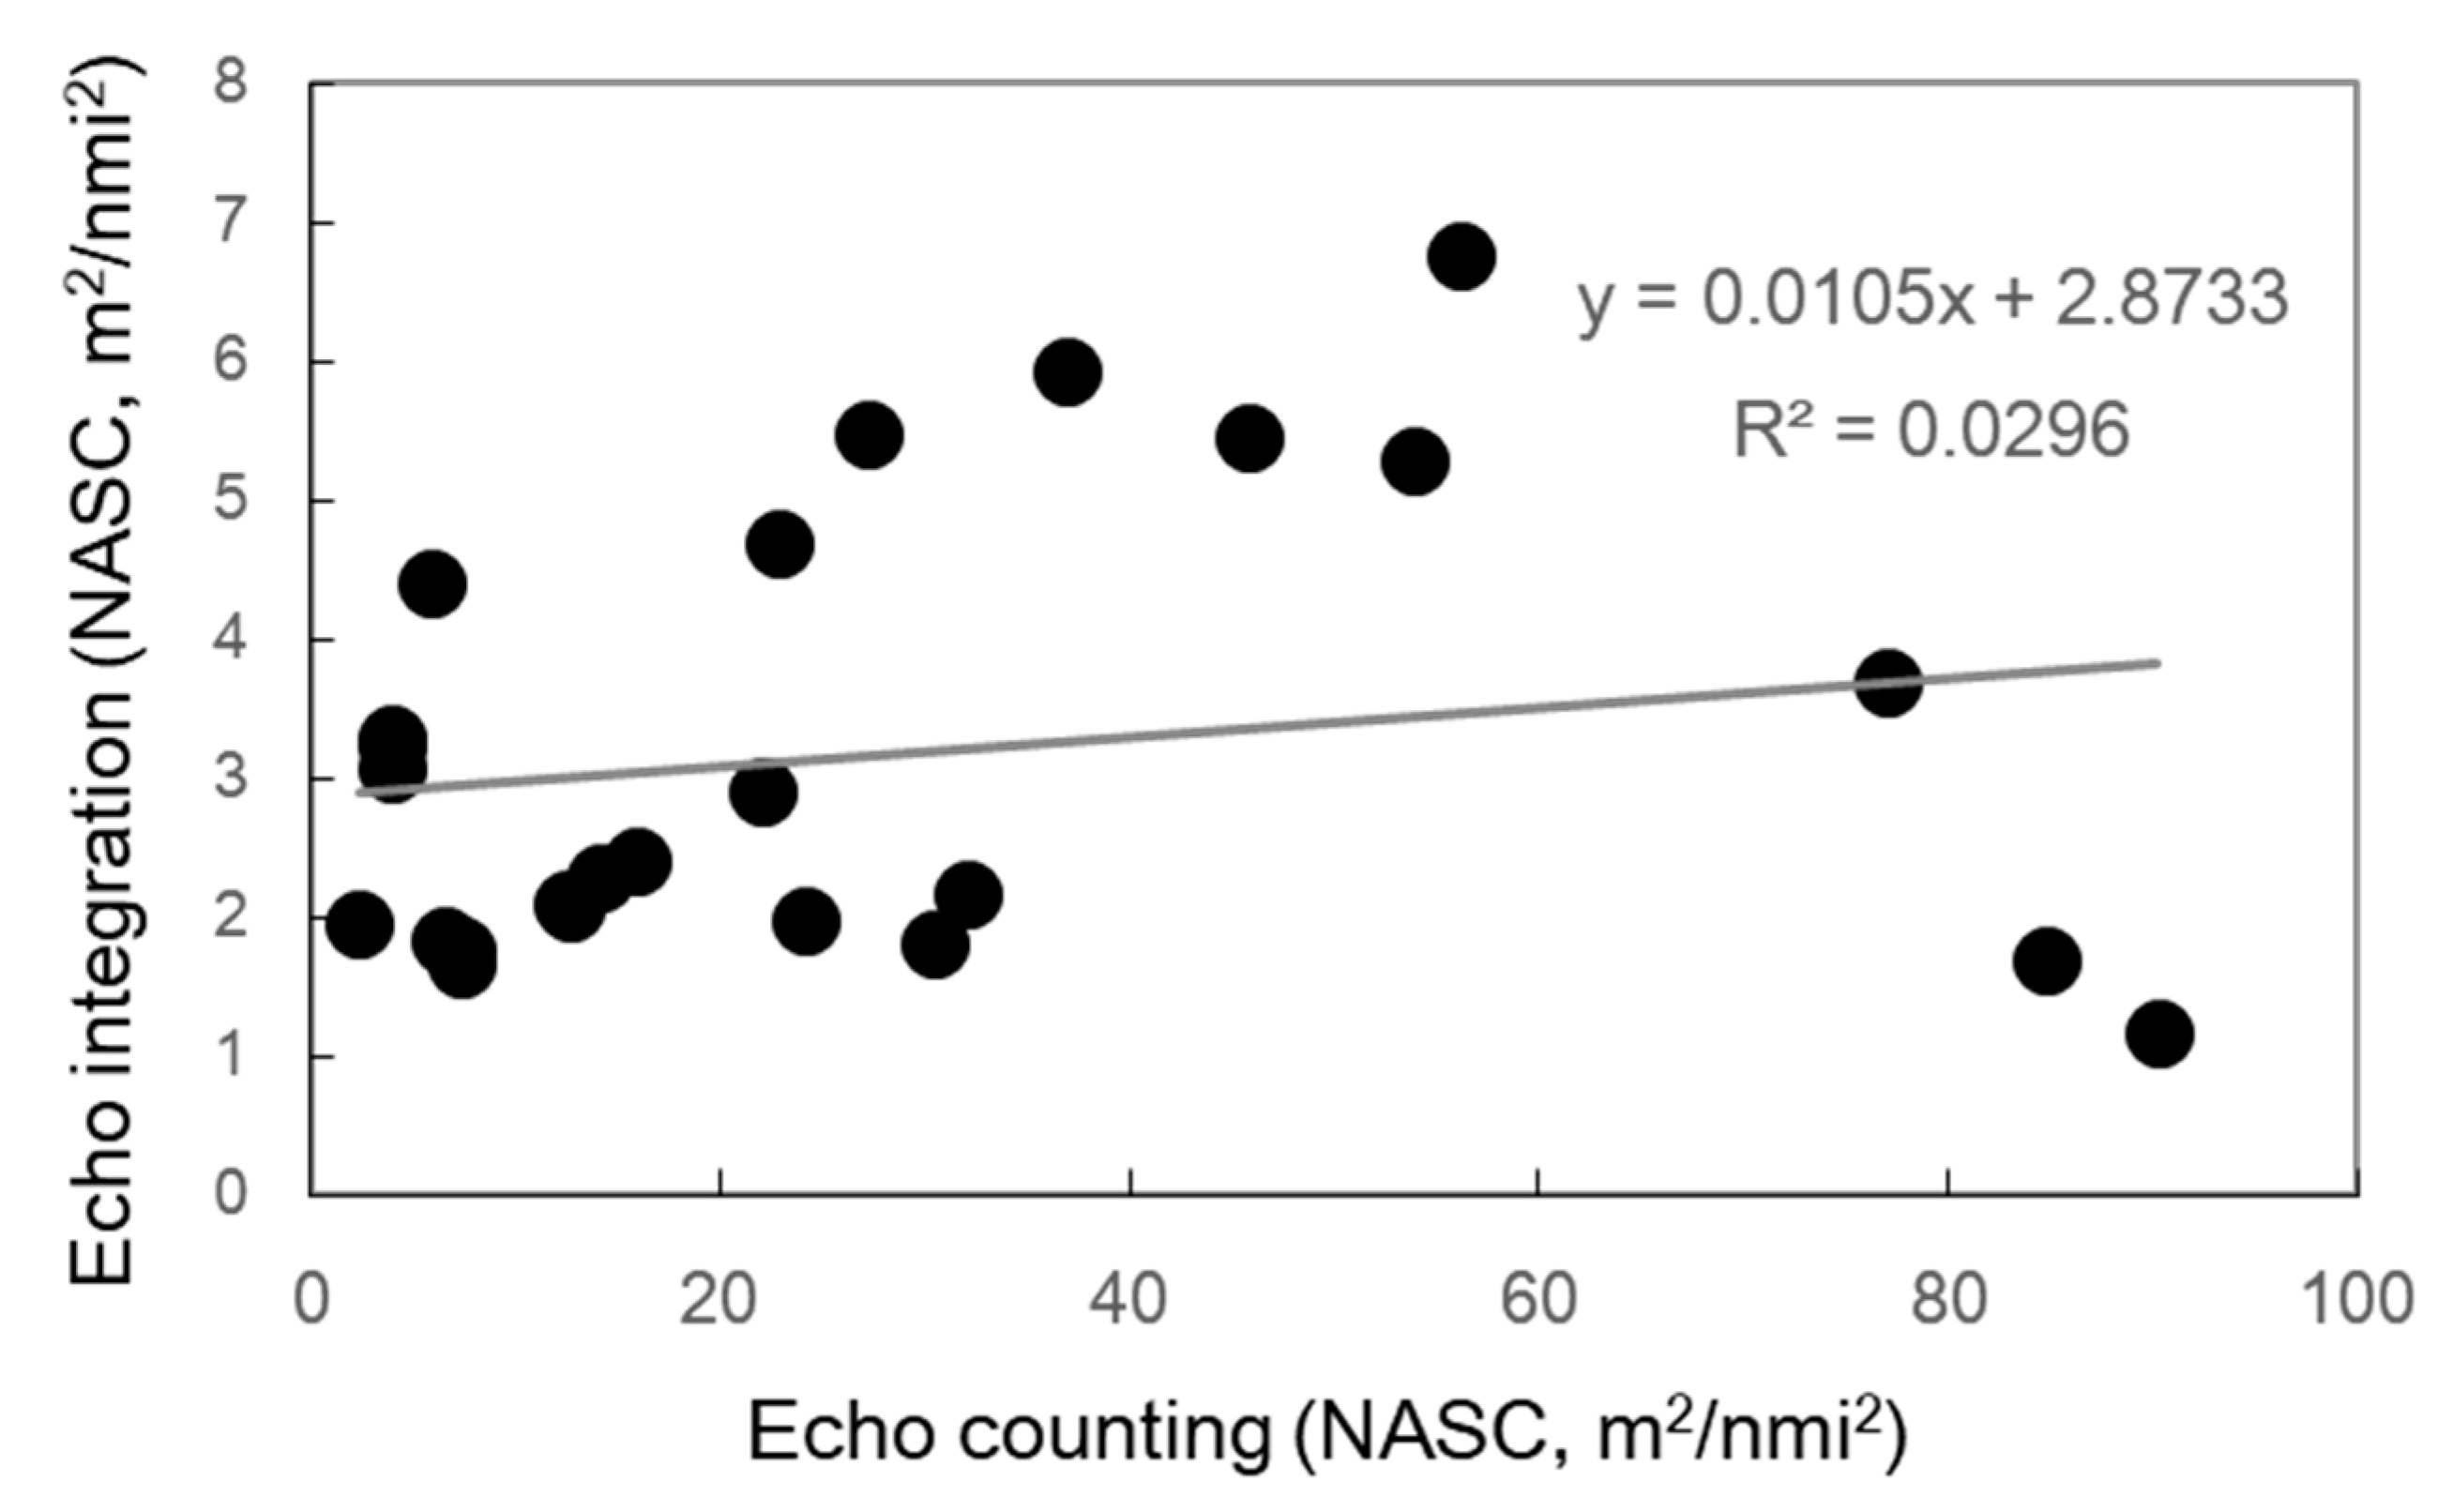
3.3. Correlation of NASC of N. nomurai by Analysis Methods

Figure 8 and Figure 9 show the correlation of the mean NASC for the transects in the waters of Mijo, Namhae and Gijang, Busan, obtained using the echo counting and echo integration methods. The mean NASC obtained using the echo integration method increased in general, similar to the echo counting method. However, for the waters of Gijang, Busan, its density calculated from the NASCs using the echo integration was found to be correlated slightly to that of the echo counting method. There was no significant difference in the 95% confidence interval in terms of the density estimates of echo counting and echo integration methods (t-test, p = 0.09, >0.05), although a significant difference was observed by the elongation (t-test, p = 0.001, <0.05). The test results followed a normal distribution (Kolmogorov–Smirnov test, p = 0.2, >0.05).

4. Discussion

In this study, the distributions of N. nomurai by depth, horizontal distribution, and density in the waters of Mijo, Namhae and Gijang, Busan using the echo counting and echo integration methods were analyzed.
The vertical distribution of N. nomurai varied by the surveyed date and time. Aurelia aurita are known to distribute closer to the surface layer than at the bottom. Malej et al. [17] reported that jellyfish migrated toward the surface at dusk but sank into deep layers during the night, showing a vertical migration. In addition, jellyfish are sensitive to light and migrate to the surface layer on clear days [18]. The distribution of Aurelia aurita is also known to be affected by the sun position [19], ocean current, tidal current, etc. [20,21]. In addition, it has been reported that the distribution of jellyfish correlated with their prey organisms but not correlated with chlorophyll, water temperature, and salinity [22]. Further studies regarding prey organisms and the oceanographic environment may be required to obtain a more accurate distribution of N. nomurai. In addition, it was observed that jellyfish were distributed mainly in the surface layer in clear weather conditions.
The mean densities of the jellyfish analyzed in this study were 0.01 (n/10−4 m2) in the waters of Mijo, Namhae and 0.20 (n/10−4 m2) in the waters of Gijang, Busan. As no prior studies have been conducted in the same area and time of day, a prior study conducted in the East China Sea was used as reference to compare the results. According to National Fisheries Research & Development Institute [23], the mean density of N. nomurai were 4.19 (n/10−4 m2) in 2005, 6.49 (n/10−4 m2) in 2006, and 7.81 (n/10−4 m2) in 2007. Additionally, the mean density values in the coastal waters of this study were lower than those of the open seas portion of the East China Sea.
The NASC values estimated using the echo counting and echo integration methods exhibited high correlations in the waters of Mijo, Namhae but low correlations in the waters of Gijang, Busan. The density values estimated using the echo integration method were higher in both survey areas. This was because the echo signal of one jellyfish was difficult to separate from those of other jellyfish, zooplankton, and planktonic organisms using only two frequencies. Therefore, the echo integration method may recognize more echoes as jellyfish, yielding higher values over those estimated by the echo counting method.
Acoustic devices and optical devices are typically used to identify fish, jellyfish, and other aquatic organisms with swimming ability. The limited detection range of an optical device can be complemented using an acoustic device that may be of low resolution but encompasses a wide range of detection. The optical studies on zooplankton referred to in this study involved silhouette photography [24] and the Critter Cam system [25]; however, they could not be implemented on site. Owing to the recent development of underwater monitoring technologies, video plankton recording devices have been applied extensively in the field [26,27,28].
Meanwhile, a method involving an optical device may be limited in terms of light transmittance and floating particles. These factors can cause distortions when analyzing interactions between aquatic organisms and their natural behaviors. A dual-frequency high-resolution underwater acoustic camera (Dual frequency Identification SONar, DIDSON, Ocean Marine Industries Inc., Chesapeake, VA, USA) has been developed to address this issue and has gained worldwide fame in the field of marine biology and structural analysis. This system is useful in identifying jellyfish and symbiotic organisms [29]. The system successfully observed the inflow of migratory fish species by time and the movement and pattern of fish by water levels [30]. The monitoring system to detect marine organisms immigrating into the coastal waters of Korea should incorporate the basic algorithm of echo signals to identify the types and quantity of immigrated organisms and minimize identification errors caused by fish and other marine organisms with greater swimming ability.

5. Conclusions

An acoustic survey method can investigate marine organisms distributing in the whole water columns of wide areas in a short period of time. The assessment techniques for marine organisms using acoustic survey methods include an echo counting method that can be applied when the target exists separately from other marine organisms and an echo integration method counting detected each echo signals. More specifically, an echo integration method estimates the biomass by receiving all echo signals from marine organisms aggregated in schools. However, both methods are complementarily used to estimate the biomass of marine organisms in the oceans. This study compared distributional densities of N. nomurai in the coastal waters using both an echo counting method and an echo integration method. The methods investigating the density of N. nomurai distributed in the study area are divided into the echo counting method and the echo integration method. The echo counting method indicates the number of jellyfish individuals by aggregating echo signals of the jellyfish displayed on the echogram, while the echo integration method extracts only echo signals of the jellyfish using the differences between 38 kHz and 120 kHz frequencies. The horizontal distributions of N. nomurai were analyzed by both echo counting and echo integration methods. Correlation coefficient between densities analyzed by both methods was shown to be high in the waters of Mijo (R = 0.70) while it was low in the waters of Gijang, Busan (R = 0.17). Comparing densities of N. nomurai analyzed by both methods, it was shown that the density analyzed by the echo counting method was approximately 5 times higher than that analyzed by the echo counting method. Therefore, it is thought that analyzing the acoustic scattering strength of jellyfish obtained from the echo counting method would be more effective for distributional survey and research of N. nomurai in the scientific echosounder with only two frequency system.

Author Contributions

Conceptualization, K.L.; methodology, J.C. and G.S.; formal analysis, W.O.; data curation, W.O.; writing—original draft preparation, K.L. and W.O.; visualization, W.O.; project administration, K.Y.K.; funding acquisition, K.Y.K. and W.A.L. All authors have read and agreed to the published version of the manuscript.

Funding

This study was financially a part of a project titled “Improvement of management strategies on marine disturbing and harmful organisms (No. 20190518) funded by the Ministry of Oceans and Fisheries, Korea.” and was partially supported by the National Institute of Fisheries Science (R2020063).

Acknowledgments

We are grateful to one editor and two anonymous reviewers for insightful comments that greatly helped to clarify and refine the paper, and we wish to thank Geunchang Park and Byungjo Kang for data acquisition and analysis support.

Conflicts of Interest

The authors declare no conflict of interest.

References

  1. Lee, Y.W.; Hwang, B.K. Theoretical examination of the effects of fluctuation of acoustic scattering on the swimming behavior of giant jellyfish. Korean J. Fish. Aquat. Sci. 2009, 42, 165–170. [Google Scholar] [CrossRef] [Green Version]
  2. Yoon, E.A.; Cha, C.P.; Hwang, D.J.; Yoon, Y.H.; Shin, H.H.; Gwak, D.S. Inter-annual occurrence variation of the large jellyfish Nemopilema nomurai due to the changing marine environment in the East China Sea. J. Korean Soc. Fish. Ocean Technol. 2012, 48, 242–255. [Google Scholar] [CrossRef]
  3. Lee, K.H.; Kim, I.O.; Yoon, W.D.; Shin, J.K.; An, H.C. A study on vertical distribution observation of giant jellyfish (Nemopilema nomurai) using acoustical and optical methods. J. Korean Soc. Fish. Ocean Technol. 2007, 43, 355–361. [Google Scholar] [CrossRef] [Green Version]
  4. Park, S.W.; Lee, K.H.; Yoon, W.D.; Lee, D.G.; Kim, S.H.; Yang, Y.S.; Lee, G.H. A Study on the Damage Reduction Strategy Against a Harmful Aquatic Organism, Jellyfish’s Bloom. J. Fish. Mar. Sci. Educ. 2015, 27, 49–62. [Google Scholar]
  5. Lee, D.G.; Han, I.W.; Chae, J.H.; Yoon, W.D.; Yang, Y.S.; Kim, D.H.; Lee, K.H. Analysis of the Advantage and Disadvantage of Harmful Jellyfish’s Damage Reduction Devices Strategy Types in the Beach. J. Korean Soc. Fish. Mar. Educ. 2019, 31, 1230–1241. [Google Scholar]
  6. Kang, D.H.; Lee, C.W.; Lee, H.B.; Kim, M.R. Measurements of sound speed and density contrasts of the moon jellyfish (Aurelia aurita sl) for Hydroacoustic Model. Ocean Polar Res. 2012, 34, 85–91. [Google Scholar] [CrossRef]
  7. Hirose, M.; Mukai, T.; Shimura, T.; Yamamoto, J.; Iida, K. Measurements of specific density of and sound speed in Nomura’s jellyfish Nemopilema nomurai to estimate their target strength using a theoretical scattering model. J. Mar. Acoust. Soc. Jpn. 2007, 342, 109–118. [Google Scholar] [CrossRef] [Green Version]
  8. Uye, S.I. Blooms of the giant jellyfish Nemopilema nomurai: A threat to the fisheries sustainability of the East Asian Marginal Seas. Plankton Benthos Res. 2008, 3, 125–131. [Google Scholar] [CrossRef] [Green Version]
  9. Trout, E.D.; Kelley, J.P.; Cathey, G.A. The use of filters to control radiation exposure to the patient in diagnostic roentgenology. Am. J. Roentgenol. Radium Ther. Nucl. Med. 1952, 67, 946–963. [Google Scholar]
  10. Hirose, M.; Mukai, T.; Hwang, D.J.; Iida, K. Target strength measurements on tethered live jellyfish Nemopilema nomurai. Bull. Jpn. Soc. Sci. Fish. 2005, 71, 571–577. [Google Scholar] [CrossRef]
  11. Simmonds, J.; MacLennan, D.N. Fisheries Acoustics: Theory and Practice; Blackwell Science: Oxford, UK, 2005; pp. 104–201. [Google Scholar]
  12. Shin, H.H.; Han, I.W.; Oh, W.S.; Chae, J.H.; Yoon, E.A.; Lee, K.H. Estimation of Moon Jellyfish Aurelia coerulea Using Hydroacoustic Methods off the Coast of Tongyeong, Korea. Korean J. Fish. Aquat. Sci. 2019, 52, 725–734. [Google Scholar]
  13. Yoon, E.A.; Lee, K.; Chae, J.; Yoon, W.; Han, C.; Lee, H.; Oh, W. Density Estimates of Moon Jellyfish (Aurelia coerulea) in the Yeongsan Estuary using Nets and Hydroacoustics. Ocean Sci. J. 2019, 54, 457–465. [Google Scholar] [CrossRef]
  14. Korneliussen, R.J.; Diner, N.; Ona, E.; Berger, L.; Fernandes, P.G. Proposals for the collection of multifrequency acoustic data. ICES J. Mar. Sci. 2008, 65, 982–994. [Google Scholar] [CrossRef] [Green Version]
  15. Kim, S.; Lee, K.; Yoon, W.D.; Lee, H.; Hwang, K. Vertical Distribution of Giant Jellyfish, Nemopilema nomurai using Acoustics and Optics. Ocean Sci. J. 2016, 51, 59–65. [Google Scholar] [CrossRef]
  16. Yoon, E.A.; Hwang, D.J.; Shin, H.H. In situ behavioral and acoustic characteristics of the large jellyfish Nemopilema nomurai by target tracking. J. Korean Soc. Fish. Ocean Technol. 2015, 51, 272–278. [Google Scholar] [CrossRef]
  17. Malej, A.; Turk, V.; Lucic, D.; Benovic, A. Direct and indirect trophic interactions of Aurelia sp. (Scyphozoa) in a stratified marine environment (Mljet Lakes, Adriatic Sea). Mar. Biol. 2007, 151, 827–841. [Google Scholar] [CrossRef]
  18. Albert, D.J. Vertical distribution of Aurelia labiata (Scyphozoa) jellyfish in Roscoe Bay is similar during flood and ebb tides. J. Sea Res. 2010, 64, 422–425. [Google Scholar] [CrossRef]
  19. Hamner, W.M.; Hamner, P.P.; Strand, S.W. Sun-compass migration by Aurelia aurita (Scyphozoa): Population retention and reproduction in Saanich Inlet, British Columbia. Mar. Biol. 1997, 119, 347–356. [Google Scholar] [CrossRef]
  20. Graham, W.M.; Martin, D.L.; Martin, J.C. In situ quantification and analysis of large jellyfish using a novel video profiler. Mar. Ecol. Prog. Ser. 2003, 254, 129–140. [Google Scholar] [CrossRef]
  21. Rakow, K.C.; Graham, W.M. Orientation and swimming mechanics by the scyphomedusae Aurelia sp in shear flow. Limnol. Oceanogr. 2006, 51, 1097–1106. [Google Scholar] [CrossRef] [Green Version]
  22. Han, C.H.; Uye, S.I. Quantification of the abundance and distribution of the common jellyfish Aurelia aurita s.l. with a Dual-frequency IDentification SONar (DIDSON). J. Plankton Res. 2009, 31, 805–814. [Google Scholar] [CrossRef] [Green Version]
  23. NFRDI. Mass occurrence of jellyfish and its prevention and utilization. Annu. Rep. 2008, 1, 19–26. [Google Scholar]
  24. Ortner, P.B.; Cummings, S.R.; Aftring, R.P.; Edgerton, H.E. Silhouette photography of oceanic zooplankton. Nature 1979, 277, 50–51. [Google Scholar] [CrossRef]
  25. Strickler, J.R. Observations of swimming performances of planktonic copepods. Limnol. Oceanogr. 1997, 22, 165–170. [Google Scholar] [CrossRef]
  26. Price, H.J. Swimming behavior of krill in response to algal patches: A mesocosm study. Limnol. Oceanogr. 1989, 34, 649–659. [Google Scholar] [CrossRef]
  27. Davis, C.S.; Gallager, S.M.; Solow, A.R. Microaggregations of oceanic plankton observed by towed video microscopy. Science 1992, 257, 230–232. [Google Scholar] [CrossRef]
  28. Mano, T.; Guo, X.; Fujii, N.; Yoshie, N.; Tsutsumi, E.; Saito, R. Moon jellyfish aggregations observed by a scientific echo sounder and an underwater video camera and their relation to internal waves. J. Oceanogr. 2019, 75, 359–374. [Google Scholar] [CrossRef]
  29. Honda, N.; Watanabe, T. Observation of the giant jellyfish Nemopilema nomurai using an underwater acoustic camera. Nippon Suisan Gakkaishi 2007, 73, 919–921. [Google Scholar] [CrossRef]
  30. Yang, Y.S.; Bae, J.H.; Lee, K.; Park, J.S.; Sohn, B.K. Fish monitoring through a fish run on the Nakdong River using an acoustic camera system. Korean J. Fish. Aquat. Sci. 2010, 43, 735–739. [Google Scholar]
Figure 1. Acoustic survey transects to obtain distribution depth and density of N. nomurai using hydro-acoustics.
Sustainability 12 05823 g001
Figure 2. Data processing flowchart to identify N. nomurai using frequencies 38 and 120 kHz.
Sustainability 12 05823 g002
Figure 3. Echogram example of data processing flowchart to identify the echo signals of N. nomurai using frequencies 38 and 120 kHz.
Sustainability 12 05823 g003
Figure 4. Distribution of N. nomurai in the waters of Mijo, Namhae by time of day and depth obtained using echo counting method.
Sustainability 12 05823 g004
Figure 5. Distribution of N. nomurai in the waters of Gijang, Busan by time of day and depth obtained using echo counting method.
Sustainability 12 05823 g005
Figure 6. Horizontal distribution of N. nomurai in the waters of Mijo, Namhae, determined using echo counting (a) and echo integration (b) methods.
Sustainability 12 05823 g006
Figure 7. Horizontal distribution of N. nomurai in the waters of Gijang, Busan, determined using echo counting and echo integration methods.
Sustainability 12 05823 g007
Figure 8. Correlation between echo counting and echo integration methods in the Namhae site.
Sustainability 12 05823 g008
Figure 9. Correlation between echo counting and echo integration methods in the Gijang site.
Sustainability 12 05823 g009
Table 1. Surveyed time, length of transects, and survey area designed to analyze the distribution depth and density of N. nomurai using hydro-acoustics.
AreaDate
(Time)
Line Length
(km)
Survey Area
(km2)
Namhae21 August 2019
(14:00–20:00)
820
Gijang-A3 September 2019
(14:00–16:00)
22.225.3
Gijang-B4 September 2019
(05:30–11:00/14:00–19:00)
15.013.5
Gijang-C5 September 2019
(05:30–10:00)
8.14.1
Table 2. Summary of calibration of underwater acoustic data collection system.
Parameters38 kHz120 kHz
Two-way beam angle (dB)−15.5−21.0
Transducer gain (dB)21.527.0
3-dB beam angle (athwart/along) (°)11.82/12.156.35/6.37
Absorption coefficient (dB m−1)0.00650240.0405578
Sound speed (m s−1)1523.091523.09
Power (W)1000250
Pulse length (ms)1.0241.024
Table 3. Density of N. nomurai in the waters of Mijo, Namhae by echo counting method.
No.TimeCount
(inds)
Distance
(m)
Density
(10−4 ind/m)
114:40–16:00580006.25
216:03–16:3011800013.75
316:53–17:1724800030.00
417:19–18.0722800027.50
518:08–18:2627800033.75
618:58–20:4218800022.50
Avg. 17.83 22.29
Table 4. Density of N. nomurai in the waters of Gijang, Busan by echo counting method.
Survey LineGijang-A (14:00–19:00)Gijang-B (05:30–11:00)Gijang-B (14:00–19:00)Gijang-C (05:30–10:00)
Count
(inds)
Distance
(m)
Density
(10−4 ind/m)
Count
(inds)
Distance
(m)
Density
(10−4 ind/m)
Count
(inds)
Distance
(m)
Density
(10−4 ind/m)
Count
(inds)
Distance
(m)
Density
(10−4 ind/m)
11618008201.05722967242.67972967326.93962114454.12
22387889301.691032990344.48582990193.98602021296.88
33547933446.24592987197.521462987488.78912038446.52
426792032.83463020152.32813020268.21572000285.00
5---21311167.50723111231.44---
6---483026158.63463026152.02---
7---30305098.36333050108.20---
8---14307345.566307319.52---
Avg. 245.45 163.38 223.64 370.63

