Abstract
This study investigated the differences in household energy consumption between urban and rural households in northern Thailand, with a particular focus on air-conditioner ownership and use. In-depth visits to 32 households in Chiang Rai were undertaken in 2016 and 2017. The data collection covered six aspects: household attributes, ownership of electric appliances, use of air conditioners (ACs), intentions to conserve electricity, desire to purchase electric appliances in the future, and prospects for a future lifestyle. Traditional stilt houses can still be found in rural areas, but ACs have been introduced as rural houses have modernized. The typical period of AC use in rural areas was 2 to 4 months during summer. In urban households, ACs were used for a longer period, from 3 to 12 months each year. In addition, rural households usually used ACs for only a few hours each day before sleeping, whereas urban households often used them while they slept and some used them throughout the day. Households with children and grandchildren tended to use the AC for longer periods. These results suggest that promotion of environmentally friendly lifestyles for younger adults to control overuse of ACs would be key to reducing energy consumption in the future.
1. Introduction
With the rapid economic growth and urbanization in Southeast Asian countries, primary energy demand in Southeast Asia grew by about 76% between 2000 and 2017, from 382 to 674 million tonnes of oil equivalent. It is expected to increase by another 60% by 2040. Two-thirds of the increase has come from the residential and service sectors that primarily serve middle-income people living in cities, largely a result of a rising urban middle class in Southeast Asia [1].
Because of the humid tropical climate of Southeast Asia and recent global warming, the number of cooling degree days (i.e., days when air conditioning is needed) is also increasing. The ownership and use of air conditioners (ACs) are projected to increase in Southeast Asia in the future [2,3]. According to an estimate by the Japan Refrigeration and Air Conditioning Industry Association in April 2017, the worldwide demand for ACs (used for houses, buildings, etc.) in 2012 was 120.31 million units. The largest demand was in China (4.59 million units), followed by India (4.51 million units), Indonesia (2.3 million units), Vietnam (1.98 million units), and Thailand (1.56 million units) [4]. From the perspective of economic growth and human development, it is unrealistic to stop or even place a cap on people’s energy use. Therefore, it is important to understand the patterns, determinants, and implications of household energy demand. For example, the high energy demand for cooling by ACs, on the one hand, helps to improve the quality of life and productivity of people in warm and humid climates like Thailand. On the other hand, it may cause additional global warming and environmental degradation.
Several studies of residential energy consumption have been conducted in Southeast Asia [5,6,7,8,9]. The MECON project investigated ways of increasing energy efficiency among low-income households who have access to grid electricity in the Greater Mekong Subregion (Cambodia, Laos, Myanmar, Thailand, and Vietnam). A questionnaire survey of approximately 300 households was conducted in each country to understand the characteristics of the target group’s energy consumption and their knowledge and attitudes toward energy-efficient products from June 2013 to September 2015 [5,6]. Novianto et al. [7] surveyed more than 600 households and compared the lifestyles and energy consumption of younger adults (in their 20s to 40s) in seven districts in large cities in three countries in Asia (Indonesia, Thailand, and China). They used multiple regression analysis to investigate the contribution of lifestyle-type variables to the total energy use per household. The result of the survey of Bangkok, Thailand, showed that households’ energy use was largely influenced by floor area, length of time in the residence, TV ownership, current contracted electricity charges, and daily cooking period. Hori et al. [8] conducted questionnaire surveys of energy-saving behaviors in households in rural and urban areas of five major Asian cities (Bangkok, Chongqing, Dalian, Fukuoka, and Ho Chi Minh City). The survey found a positive relationship between information (e.g., awareness of global warming) and energy-saving behaviors, whereas individual variables (e.g., income and age) had a weak positive effect on energy-saving behaviors in Bangkok. Murakoshi et al. [9] surveyed household energy use in four Southeast Asian countries (Cambodia, Malaysia, Thailand, and Vietnam). They analyzed how an improved lifestyle resulted in increased energy consumption and compared the results between Southeast Asia and Japan. They pointed out the importance of strengthening energy-efficiency labeling and promoting energy-efficient appliances.
Many studies have explored the relationship between the building environment and human comfort [10,11,12]. In addition, several studies have investigated the relationship between occupant behavior (e.g., opening/closing windows, AC usage, and lighting) and energy use, and they indicated that lifestyle has a significant impact on energy use in buildings [13,14,15,16,17]. Jareemit and Limmeechokchai [18,19] conducted a questionnaire survey of 400 households in Bangkok to investigate homeowners’ energy-saving behaviors. They found a significant relationship between the growth of household energy consumption and occupants’ behaviors. For example, female residents potentially conserved more energy than males by reducing AC use in their bedrooms.
In Thailand, energy consumption in the household sector both in rural and urban areas has been growing rapidly since 1995. Growth in residential energy consumption in the northern, northeastern, and southern regions has been strongly driven by changes in per capita income [20]. In a survey of energy use in northern Thailand and metropolitan Bangkok, Chiang Mai University [21] found that the average electricity consumption per household in rural areas and urban areas was 870 and 1467 kWh, respectively. The top five home appliances/devices in terms of household power consumption were refrigerators, ACs, lights, televisions, and electric fans. ACs accounted for about 16.9% of the average annual electricity consumption per household. Air conditioning, therefore, appears to be a major driving force of increased energy consumption in Thailand. While large samples allowed the previous studies to estimate the level of energy consumption for air conditioning, they provided limited understanding of occupants’ behaviors and housing status to identify hotspots for improvements. Several studies have pointed out significant differences between urban and rural residents’ level of comfort and energy-use patterns [8,22]. However, most previous studies on household energy consumption were carried out in Bangkok [7,8,9], and little information is available for other regions of Thailand.
The primary aim of this study was to obtain detailed data about the living conditions of people of different socio-economic classes and to understand the differences in household energy consumption between urban and rural households in northern Thailand. In particular, the study focused on residential energy consumption in Chiang Rai, northern Thailand. Specific research questions included: how and when are certain electric appliances used in the urban and rural areas of northern Thailand? What are the drivers for owning and using ACs? During what period of the year and for how many hours a day do people use ACs? How do people cool themselves besides using ACs/fans? To what extent are people willing to conserve energy? What kind of lifestyles do people want to have in the future?
2. Materials and Methods
2.1. Survey Area
Chiang Rai is the northernmost large city in Thailand, located about 780 km north of Bangkok and about 180 km from Chiang Mai (Appendix A). The total area of Chiang Rai is 11,678 km2, and the population was 1.28 million in 2015 [23]. The climate of Thailand is influenced by seasonal monsoon winds. Northern Thailand usually experiences a long period of warm weather because of its inland nature and tropical latitude (Figure 1). The hottest period of the year is from March to June, and maximum temperatures usually reach near 40 °C. Cold air from China occasionally reduces temperatures to fairly low values in winter, sometimes to near 0 °C, but the average is around 22 °C [24].
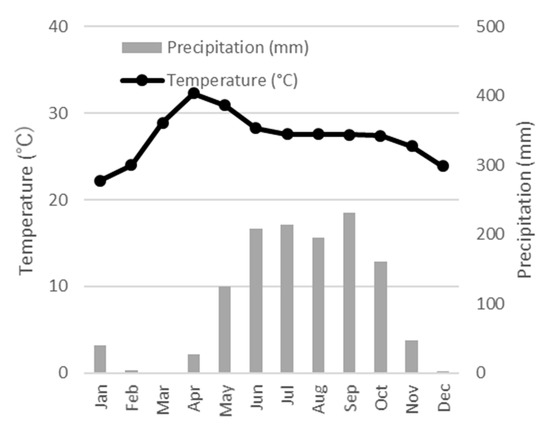
Figure 1.
Monthly average temperature and precipitation in northern Thailand in 2016. Source: the data from Thai Meteorological Department [24].
2.2. Household Survey
The survey targeted households in two areas in Chiang Rai: a municipal (urban) area and a non-municipal (rural) area. The rural areas included two villages, one in San Sai Subdistrict, Mae Chan District, and the other in Mae Kao Tom Subdistrict, Muang District, about 20–35 km outside of the Chiang Rai city center. Survey households were selected by using quota sampling. The researchers explained the purpose of the study to the village headmen and enlisted their help in selecting 10 representative households in each village. The headman or his assistant accompanied the research team to each household. This not only allowed the researchers to gain access to the households, but also helped facilitate the interviews due to the presence of the local leader. The interviews were conducted in March 2016.
It was more difficult to obtain support from the local community in urban areas. Therefore, we solicited support from staff members of Mae Fah Luang University and visited their own or their friends’ houses to conduct the survey. Twelve households were purposely selected to include all of the various types of housing in the urban area. The interviews were conducted in November 2017.
At the household interviews, a questionnaire survey was conducted by the authors. The questions were asked and answered by the head of each household or their family members in Thai and then translated into English on the spot. The survey had six parts covering household attributes, ownership of electric appliances, use of ACs, knowledge and intentions about conserving electricity, information related to the purchase of electric appliances, and future purchasing and lifestyle prospects (Sections A–F in Table 1). In Section B, the basic specifications of household electric appliances, such as the manufacturer’s name, model, year of manufacture, and power consumption, were identified by visually examining them or the product labels. The layout of each residence was recorded through photographs and hand drawings. The residential floor areas were measured for the urban households. For several households, information on monthly electricity bills was also obtained. We also asked questions that were not in the questionnaire during the conversation to understand the household’s lifestyle more completely. The household visits took 0.5–2 h, depending on the number of electrical devices in the household.

Table 1.
Questionnaire content.
3. Results
3.1. Household Characteristics
Subsubsection
In rural areas, three-generation households constituted the largest proportion of households, whereas one- or two-person (couples) households were the largest categories in urban Chiang Rai (Figure 2, see Appendix A for the detailed data). The average number of household members was 4.1 in the rural sample and 2.2 in the urban group.

Figure 2.
Household composition in (a) urban and (b) rural households.
The average monthly income of households in Chiang Rai was 13,497 THB per month in 2015 [25]. The National Statistics Office (NSO) categorizes five different income levels for socio-economic classes, but the classes are different in urban and rural areas because income levels are generally higher in urban areas. All interviewed households in urban Chiang Rai were in the high income (A, > 50,000 THB/month) or middle income (C, 20,000–39,999 THB/month) groups. Most of the main income earners were government employees or teachers. Rural households included members of five income groups (all THB/month): A (>40,000), B (30,000–39,999), C (15,000–29,999), D (10,000–14,999), and E (<10,000) (Figure 3). Most of the main income earners were farmers, but some households also earned income from secondary jobs such as hairdresser, grocery clerk, driver, or headman of the village. There were also several households in which the parents were farmers and the adult children worked as civil servants, mechanics, or nurses.

Figure 3.
Socio-economic class of households in (a) urban and (b) rural areas. Note: A to E refer to high income (A) to low income (E).
3.2. Housing Characteristics
Traditionally, Thai stilt houses were made of wood. According to our interviews with housing developers in Chiang Rai, concrete became popular as a building material about 20 years ago, and the share of new wooden houses dropped to 30% because of the rising cost of the wood materials. Examples of traditional and modern dwellings are shown in Figure 4.


Figure 4.
Photos of typical dwellings in urban (left) and rural (right) areas of Chiang Rai: (a) detached house, (b) traditional stilt house, (c) townhouse, (d) semi-renovated stilt house, (e) condominium, and (f) modern concrete house.
As in previous studies [26,27], several types of stilt houses and modern houses were found in rural Chiang Rai. The pillars (stilts) of the first floor were made of wood or had been renovated with concrete. There were many semi-open and outdoor spaces in the rural houses. A living room and a kitchen were usually found on the first floor, which was usually left open or partially covered by walls or fences to make a semi-open space. Shade trees were usually grown near the house to create breezy shaded areas, and vegetable gardens were nearby. Gas stoves were usually used for cooking, but firewood and charcoal were also commonly used, especially for steaming sticky rice (in place of a rice cooker). Some households said they use firewood even if they had a gas stove to save money. Some houses were designed with features to help maintain cooler conditions, such as having a space between roofs and walls to improve ventilation and using tiles on the first floor. The average number of rooms was 5.2 (excluding service areas), including 2.7 bedrooms. The average ages of the houses were 24.5 and 15.3 years in San Sai and Mae Kao Tom, respectively, and there were more stilt houses in San Sai and more modern houses in Mae Kao Tom. All of the houses were connected to the electrical grid and most also had tap water.
In the urban area, most of the dwellings were constructed with concrete and bricks. We visited seven detached houses, three townhouses, and two condominiums. Most of urban dwellings were new or had been relatively recently renovated (the average number of years in use was 3.4). The average number of rooms was 4.5 (excluding service areas), including an average of 2.3 bedrooms. All of them were connected to the electrical grid and had other utility services, including tap water and internet. Some households used electricity for cooking, primarily for safety reasons.
3.3. Ownership of Electric Devices
All households owned televisions (TVs), refrigerators, electric fans, and mobile phones. Most households also had washing machines, electric rice cookers, and electric pots/kettles. Small and medium-sized electric appliances, such as irons, water heaters, and DVD/VCD players were commonly used in both urban and rural households. A small number of households had microwaves, personal computers, or vacuum cleaners in rural areas, whereas more households owned these items in urban areas. In rural areas, all electric appliances were purchased by the household members, whereas in the urban area, some of the dwellings had been equipped with appliances, including ACs, by the housing developers.
In rural areas, the AC ownership rate was quite different between the two villages. Only one household owned an AC in San Sai, whereas seven did in Mae Kao Tom. There appeared to be a relationship between the housing type (i.e., the building materials) and AC ownership—people in traditional wooden houses were unable to have an AC unit. Other reasons for not having (or not using) an AC included “no need”, “dislike cold wind”, and “high electricity bills”. Many households had many electric fans, and they were regularly used. Unlike the previous study in Malaysia [28], few households had ceiling fans in Chiang Rai, and most ceiling fans were attached to lighting. Most households in rural areas did not use any heating equipment. They warmed themselves by wearing additional clothes or using blankets. Some households in rural areas used a coal stove or open fire for heat and some said they took warm showers.
In urban areas of Chiang Rai, ACs were very popular, all households except one household owned two or more units. One household owned eight ACs, including in their guest rooms, which were rarely used. Although it can get cold during the winter in Chiang Rai, few families had an air conditioning unit that also had a heating function. In urban areas, the majority of households said they used warm showers; some households also used a wood stove, an electric stove, or the heating function included on their AC unit.
Refrigerators in rural households were generally old and small (capacity of around 150 L; Figure 5). One-third of the refrigerators were very old (20–30 years old) (Table 2), in part because people tended to have physical difficulties disposing of large home appliances. Even though some households had replaced the old refrigerators, they still kept the old refrigerators at home because there is no waste collection service for waste electrical and electronic equipment in Thailand yet. Some old refrigerators were still used as a second refrigerator, while others were used for storage. Rural households mainly used their refrigerators for bottled water because they were usually farmers, and food can be procured from their own fields or from traditional markets just before consumption.
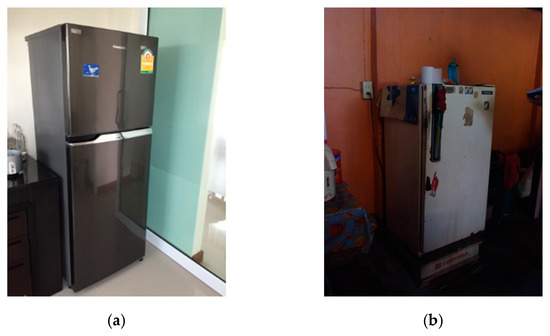
Figure 5.
Photos of typical refrigerators in (a) urban and (b) rural dwellings.
Table 2.
Refrigerators used in rural households in Chiang Rai, Thailand.
Urban households had larger refrigerators (about 200–300 L) and kept a much wider variety of things inside, including food and beverages, cosmetics, and medicines. The appliances were also relatively new, many less than 5 years old.
Some digital home appliances and kitchen appliances were observed in homes where younger adults lived. In some cases, the young adults who worked in the city actually made the decision to purchase the appliances when they came home for holidays, but these appliances were not all fully utilized by their parents.
3.4. AC Use
In the rural areas, the period of AC use was 4 months (March–June), with the most usage in April and May. In the urban area, some households used the AC in all 12 months. The heaviest usage was from March to September (Figure 6). Households with young children and those headed by a younger adult tended to use the AC for a longer period.

Figure 6.
Number of households that use air conditioners (ACs) (for cooling) each month during a year.
To determine the pattern of use, we asked each household how often (number of hours per day on average during the above-mentioned months) each unit was used in each room. In rural areas, many households used ACs for a few hours before their normal sleeping time, that is, from about 20:00 to 01:00 local time. In urban areas, many households also used ACs while they slept, so their use was from 20:00 to 06:00 local time. Some households also used ACs in their living rooms in the daytime (Figure 7). The average number of hours of AC use in main bedrooms was 2.9 h/day in rural households and 7.7 h/day in urban households. Although the average use was lower, some households in Chiang Rai used their ACs for as long or longer than households in Bangkok (Figure 7).

Figure 7.
The usage pattern of ACs by rural and urban households in Chiang Rai. Note: Some households have more than one AC unit, so the use rate is based on the number of units, not the number of households. The use rate is the number operating at a given time divided by the total number in that area.
According to the previous study in Bangkok [18], the operation hours of ACs in master bedrooms were 10 h/day during weekdays and 18 h/day during weekends. Another survey of AC use in Bangkok also showed that ACs were mainly used during nighttime and that the average length of AC use on weekdays was 10 h/day [9]. The usage pattern of ACs varied depending on differences in human comfort, energy use habits, and family lifestyle [20,29].
Most of both the rural and urban households normally set the temperature at 25 °C in the bedrooms and somewhat lower than 25 °C in the living areas, even though some households set a 2–3 °C lower temperature for the first 30 min to 1 h. The Thai government has established a temperature setting of 25 °C as a part of energy-saving campaigns, so it appears that most households may be aware of this target.
Urban and rural households had very different answers to the question “What do you usually do to reduce the electricity consumption in cooling (AC use)?” Whereas urban households chose “close windows/doors” followed by “use the automatic mode”, “don’t turn on/off frequently” and “do not set the temperature too low”, most rural respondents chose “limit the time/hours of use” (Figure 8). Rural households appeared to be more willing to conserve energy, with the only exception being for the comfort or well-being of their young children or grandchildren.

Figure 8.
Responses to the question “What do you usually do to reduce the electricity consumption in cooling (AC use)?”
In Japan, “set air flow direction to horizontal” and “turn on a fan” are well-known tips for saving electricity because cooler air descends to down near the floor. Air flow direction and air circulation help prevent uneven temperature distribution within a room and improve the cooling efficiency of ACs. This allows people to feel cool and comfortable even at a higher temperature setting. In our survey, only one-third of households also used a fan when using the AC, so these practices do not seem to be well known in Thailand.
3.5. Alternative Methods of Cooling
Interviewees were also asked about alternative methods of cooling. Many people responded that they “have a cold drink”, “open a window and let the wind in”, and “take a shower”. Rural respondents usually chose one or more of these options, whereas urban respondents also chose “go to a public space, shopping mall, café, etc.” (Figure 9). In rural areas, many people also cool off in the shade of trees or in outdoor living spaces, but this was not included as a response in our questionnaire.

Figure 9.
Methods of cooling besides using ACs/fans (multiple answers are possible).
3.6. Energy Saving
More than 70% of rural households said they intended to conserve energy, as compared to 42% of urban respondents. Almost all respondents chose “economic reasons” as the motivation for conserving energy. Most people in both areas said they knew about the energy-saving labels (i.e., the no. 5 label) that appear on electric appliances. Because energy-saving labels are publicized on TV commercials, most people indicated that they understood the meaning. Thai households have previously been observed to choose to use highly energy-efficient equipment [20,21].
Monthly energy consumption in rural areas was lower than urban areas. An average electricity bill was about 300 THB for consumption of 84 kWh a month in rural areas, but three households paid at least 1000 THB (250 kWh) a month. Eight of the rural households also used electricity for their business (e.g., grocery store, hair salon, curtain-making facility, rice mill, and laundry). Electricity consumption was typically about 1200 THB (300 kWh) a month in urban areas, and one household, which operates a bakery shop, reached as high as 2400 THB (600 kWh) a month. The unit price of electricity (1 kWh) was about 4 THB at the time of our survey.
3.7. Purchase of Electric Appliances
Most households in both rural and urban areas purchased their electric appliances at either modern retail/department stores or large appliance stores. Almost all households in rural areas paid with a one-time cash payment, whereas urban households used one-time cash payments as well as credit card installment payments.
The three most important factors when purchasing electric appliances are summarized in Table 3. “Price” and “brand name” were listed most often as the most important factor in rural areas, whereas “function” was the most-cited first factor in urban areas. “Brand name” was most often selected as the second factor in both rural and urban areas. In urban areas, “price” and “function” were selected equally as the third factor, and “price” and “brand name” were selected in rural areas, followed by “energy consumption” and “warranty”. “Durability” and “warranty” were emphasized more in rural areas, but “good looking/appearance” was not an important factor in either area. In rural areas, some people were not able to answer the question because their children make the purchase decisions.
Table 3.
Three important factors when purchasing electric appliances.
3.8. Future Prospects
Interviewees were asked what kind of electric appliances they wanted to buy in the future. At the beginning, many rural respondents answered they did not want to buy any because they were satisfied with what they already had. However, when probed further, some people listed products that they would potentially buy in the future (Table 4 and Table 5). In the urban area, the top appliances were ACs, ovens, and TVs. Rural households, on the other hand, stated that they preferred washing machines, TVs, electric fans, and refrigerators. Most households answered that money was the main barrier/obstacle to obtaining new products; very few households also said that space and electrical capacity were barriers.
Table 4.
Electric appliances people in rural areas (n = 20) wanted to buy in the future. Respondents could list up to three.
Table 5.
Electric appliances people in urban areas (n = 12) wanted to buy in the future. Respondents could list up to three.
Interviewees were also asked about whether they considered secondhand products. The results show that most people do not buy secondhand goods, except for low-income households in rural areas. The majority of respondents said that secondhand goods were not durable and that their energy consumption was higher than that of comparable new products.
It was difficult to get answers about role models for the respondents’ ideal lifestyles. Some said parents or grandparents. In rural areas, several respondents said community leaders. When asked about what kind of lifestyle they wanted to have in the future, many urban respondents chose “convenient and comfortable” rather than “environmentally friendly” or “healthy”. The majority of rural respondents chose “healthy”.
4. Discussion
According to Hachiya and Inoue [26], housing modernization in Thailand often begins with the purchase of electric appliances. TVs and electric fans have been the first appliances purchased, followed by refrigerators, washing machines, and ACs. The first items purchased are in aid of family gatherings or comfort, whereas the second group is mainly related to improving housework efficiency.
In this study, although we did not ask about the order in which electric appliances were introduced, the progression of ownership of the different types of electric appliances was apparent. TVs, electric fans, and mobile phones were considered necessities by all of the households. Refrigerators, washing machines, electric rice cookers, and electric pots/kettles were also widely used. High-income households also had a variety of digital appliances, small and medium-sized electric devices, and health equipment (e.g., massage machines).
Several factors contributed to increased energy consumption due to the use of AC. The increasing number of modern-type houses appears to be an important factor. Households use ACs in housing constructed with concrete walls, which is typically used in renovations, particularly in rural areas. Because these dwellings are usually more airtight and have poor ventilation, the occupants tend to purchase and use ACs. Although it is possible to turn on fans or use natural ventilation, people tend to use ACs nonetheless. Other possible factors include global warming, urban heat islands, a desire to keep windows closed because of traffic noise or outdoor pollution (e.g., the high level of particulate matter smaller than 2.5 µm), and a rising awareness of health issues. For example, in our survey, there were cases in which grandparents installed ACs in consideration of the health of their grandchildren. This study also found gender and lifestyle differences between urban and rural areas in Chiang Rai. For example, in some households, a female member sometimes preferred not to use the AC, whereas the male preferred to turn it on. In addition, elderly people in rural households preferred natural ventilation and to minimize the use of AC. These findings are similar to those in previous studies [19,30,31].
Thailand introduced a voluntary energy efficiency labeling program for consumer electric appliances in 1994 [32]. Despite respondents’ generally high recognition of energy-efficiency labels, there was an overall lack of desire to conserve energy, particularly in the urban households. As modernization of houses in rural areas continues, the climate warms, and air quality declines, it is quite likely that consumption of electricity by ACs in both urban and rural areas will increase in the future. In addition, because the younger generation appears to be more interested in purchasing new electric equipment for their homes, household energy consumption may increase with demographic change.
In rural areas, people tended to use their ACs in the hotter months (March–June), whereas they were used for a longer period (sometimes even year-round) in urban areas. As in previous studies [9,18,19], ACs were mainly used at night in bedrooms. The average period of AC use in bedrooms was longer in urban households (7.7 h/day) than in rural households (2.9 h/day).
It may become necessary to propose energy-saving lifestyles, particularly to younger adults, and promote environmental education. For example, to reduce the electricity consumption by ACs in urban areas it would be preferable for people to congregate in one cool place in a home or in public spaces rather than running an AC in each room in each house. In addition, promoting energy-saving tips, such as changing the direction of the air flow on an AC unit, using electric fans to circulate cool air, and preventing direct sunlight from entering households, would also contribute to reducing the use of electricity for ACs. As housing is modernized in rural areas or new areas are built or renovated in urban areas, building design should be reconsidered to introduce noise and vibration countermeasures as well as improve natural ventilation. In addition, the promotion of proper collection, recycling, and disposal of old home appliances should be considered to encourage the use of more energy-efficient appliances. As in previous studies [6,20], many respondents were aware of energy-saving labels (about 70%) and were willing to consider buying an energy-efficient product, but price was a concern. Monetary incentives provided either through the public sector or private companies could help encourage early replacement with efficient appliances.
5. Conclusions
In-person interviews were conducted with members of 32 households from urban and rural areas of Chiang Rai, Thailand, to study differences in lifestyle and electricity consumption, with a particular focus on ACs. In rural areas, traditional stilt houses with good ventilation still exist, but the number of households who have purchased ACs has increased as traditional dwellings have been renovated with modern materials (e.g., concrete). In urban areas, many people already live in modern houses, and the installation of at least two AC units is common in urban households. The typical period of AC use in rural areas was 2 to 4 months each year during summer (about March to June), while the use period in urban areas was longer (from 3 to 12 months). In addition, rural households usually used ACs for only a few hours each day before sleeping, whereas urban households often used the ACs for a longer period each day. Households with children and grandchildren tended to use the AC for longer periods. Most people in both urban and rural households recognized the energy-saving labels on electric appliances, but more households in rural areas were willing to conserve electricity as compared to urban households. In urban areas, interviewees said they expected more convenient and comfortable lifestyles in the future.
Policies are needed at the national level to promote energy-efficient design and construction of housing in Thailand to conserve energy without compromising convenience and comfort. In addition, especially in rural areas, proper disposal methods are needed for old energy-inefficient appliances (e.g., refrigerators) combined with promotion of earlier replacement of old appliances. Finally, environmentally friendly lifestyles should be promoted to control overuse of ACs, particularly by young people.
This study was based on the results of a qualitative survey, not a rigorous and fully representative quantitative survey. The sampling, particularly in the urban area, was not uniform across income classes and was not random. Our urban respondents were primarily from the highest income groups, which may have had an effect on our results because they involve owning/purchasing expensive items. Furthermore, sensors can be used to measure real energy consumption to more accurately evaluate cooling systems in different residential buildings. Future studies should include a more diverse group of respondents and use field measurements to gain a more comprehensive view of AC usage, particularly in regional cities in Thailand.
Author Contributions
Field investigation, all authors; writing—original draft preparation, A.Y.; writing—review and editing, P.M., T.T. and P.U. All authors have read and agreed to the published version of the manuscript.
Funding
This research received funding from the Environmental Restoration and Conservation Agency in Japan (JPMEERF16S11606).
Acknowledgments
The authors gratefully acknowledge the financial support provided by the Environmental Restoration and Conservation Agency in Japan (JPMEERF16S11606).
Conflicts of Interest
The authors declare no conflict of interest.
Appendix A

Figure A1.
Urban and rural study areas. Note: urban households were located along the main road from the city center toward the north.
Table A1.
Background of rural households.
Table A1.
Background of rural households.
| Household | Gender of Respondents | Age of Respondents | Monthly Income (THB) | No. of Household Members | Household Members’ relation to Respondents (age) | Education of Main Income Earners | Occupation of Main Income Earners | Location | TVs in Use | Air Conditioners in Use | Electric Fans in Use | Refrigerators in Use | Rice Cookers in Use |
|---|---|---|---|---|---|---|---|---|---|---|---|---|---|
| 1 | F | 59 | 36,000 | 5 | Husband (60), daughter (22), son-in-law (24), grandchild (<1) | Upper secondary | Farmer (rice & veg.), representative to local council | San Sai | 2 | 2 | 4 | 1 | 1 |
| 2 | M | 34 | 28,000 | 3 | Wife (35), Son (7) | College/university | Government employee | San Sai | 2 | 0 | 6 | 2 | 1 |
| 3 | M | 60 | 17,867 | 2 | Wife (58) | Elementary | Farmer (rice & veg.) | San Sai | 1 | 0 | 6 | 1 | 2 |
| 4 | M | 54 | 54,700 | 4 | Wife (48), son (27), son (24) | Upper secondary | Farmer (rice & veg.), grocery store owner | San Sai | 1 | 0 | 2 | 2 | 1 |
| 5 | M | 58 | 42,000 | 4 | wife (56), daughter (30), grandchild (7) | Elementary | Farmer (rice & veg.), general work | San Sai | 2 | 0 | 6 | 1 | 2 |
| 6 | M | 50 | 175,000 | 6 | Wife (47), father (79), son (25), daughter-in-law (26), grandchild (7) | Upper secondary | Farmer (rice & veg.) | San Sai | 3 | 0 | 8 | 2 | 1 |
| 7 | M | 68 | 3600 | 2 | Wife (58) | Lower secondary | Hairdresser | San Sai | 1 | 0 | 6 | 1 | 1 |
| 8 | F | 59 | 30,000 | 7 | Husband (59), daughter (35), daughter (30), grandchildren (8, 5, and <1) | Elementary | Farmer (rice & veg.) | San Sai | 1 | 0 | 3 | 2 | 2 |
| 9 | F | 64 | 16,200 | 6 | Husband (66), daughter (44), son-in-law (52), grandchildren (21 and 18) | Elementary | Grocery store | San Sai | 3 | 0 | 6 | 1 | 1 |
| 10 | M | 56 | 123,600 | 3 | Wife (53), brother or relative (61) | Elementary | Trading, handicraft | San Sai | 1 | 0 | 4 | 1 | 2 |
| 11 | M | 62 | 21,200 | 2 | Husband (65) | No formal education | Farmer (rice & veg.) | Mae Kao Tom | 2 | 1 | 2 | 2 | 1 |
| 12 | F | 54 | 13,000 | 5 | daughter (32), grandchildren (13, 10, and <1) | Lower secondary | Hairdresser, computer assembly | Mae Kao Tom | 5 | 5 | 10 | 2 | 1 |
| 13 | M | 57 | 55,000 | 6 | Wife (58), daughter (31), son-in-law (28), grandchildren (9 and 2) | Elementary | Farmer (rice & veg.), assistant to a village head | Mae Kao Tom | 3 | 1 | 3 | 2 | 1 |
| 14 | F | 65 | 3600 | 1 | - | Elementary | Rice mill | Mae Kao Tom | 2 | 1 | 4 | 1 | 0 |
| 15 | M | 73 | 23,700 | 4 | Daughter (43), son-in-law (43), grandchildren (20, 14) | Vocational | Mechanic, farmer (rice) | Mae Kao Tom | 2 | 0 | 4 | 1 | 1 |
| 16 | M | 55 | 12,200 | 3 | Sister or relative (65), sister or relative (47) | Elementary | Hairdresser and farmer (frog) | Mae Kao Tom | 4 | 0 | 7 | 2 | 3 |
| 17 | F | 54 | 15,000 | 4 | Husband (55), daughter (22), son-in-law (23) | Elementary | Driver | Mae Kao Tom | 3 | 2 | 4 | 2 | 1 |
| 18 | M | 36 | 26,200 | 7 | Wife (30), child (4), nephew (21), niece (15), mother (63), father (63) | Upper secondary | Government employee, general work | Mae Kao Tom | 2 | 0 | 5 | 1 | 1 |
| 19 | F | 57 | 12,000 | 2 | Husband (59) | Elementary | Farmer (rice), driver | Mae Kao Tom | 2 | 1 | 9 | 2 | 1 |
| 20 | F | 29 | 62,000 | 5 | Father (60), mother (57), husband (33), son (1) | College/University | Nurse | Mae Kao Tom | 3 | 2 | 10 | 2 | 2 |
Table A2.
Background of urban households.
Table A2.
Background of urban households.
| Household | Gender of Respondents | Age of Respondents | Monthly Income (THB) | No. of Household Members | Household Members’ relation to Respondents (age) | Education Level of Main Income Earners | Occupation of Main Income Earners | House Type | ACs in Use | TVs in Use | Electric Fans in Use | Refrigerators in Use | Rice Cookers in Use |
|---|---|---|---|---|---|---|---|---|---|---|---|---|---|
| 1 | F | 27 | 30,000 | 2 | Sister (30) | Master | Government employee | Two-story detached house | 2 | 1 | 4 | 1 | 2 |
| 2 | F | 50 | 80,000 | 2 | Husband (53) | Bachelor | Government officer | One-story detached house | 0 | 2 | 3 | 1 | 1 |
| 3 | F | 36 | 152,000 | 2 | Husband (69) | Bachelor | Retired/consultant/organic farmer | One-story detached house | 3 | 1 | 2 | 1 | 1 |
| 4 | F | 44 | 84,000 | 3 | Husband (46), daughter (9) | Bachelor | Teacher/music tutor | Two-story detached house | 2 | 2 | 1 | 1 | 1 |
| 5 | M | 36 | 105,000 | 4 | Wife (30), son (<1), mother-in- law (55) | PhD | Teacher | One-story detached house | 2 | 0 | 3 | 2 | 1 |
| 6 | F | 31 | 55,000 | 2 | Roommate (31) | Master | Teacher/selling daily commodities | Two-story row/shop house | 3 | 1 | 4 | 1 | 1 |
| 7 | M | 28 | 25,000 | 1 | None | Vocational | Bakery shop owner | Two-story row/shop house | 1 | 0 | 3 | 1 | 1 |
| 8 | F | 45 | 39,000 | 4 | Niece (29), son (21), daughter (9) | Master | Government officer | Two-story row/shop house | 2 | 1 | 4 | 1 | 1 |
| 9 | F | 36 | 50,000 | 2 | Roommate (28) | PhD | Teacher | Two-story detached house | 2 | 1 | 3 | 1 | 1 |
| 10 | M | 65 | 50,000 | 1 | None | Bachelor | Retired/missionary | Condo | 2 | 1 | 1 | 1 | 1 |
| 11 | F | 67 | 90,000 | 2 | Husband (70) | PhD | Teacher | Two-story detached house with guest house | 8 | 4 | 8 | 2 | 3 |
| 12 | F | 51 | 83,000 | 4 | None (live away from family for work) | PhD | Teacher | Condo | 1 | 1 | 1 | 1 | 0 |
References
- International Energy Agency (IEA). World Energy Outlook 2017. Available online: https://www.iea.org/reports/world-energy-outlook-2017 (accessed on 9 June 2020).
- Sahakian, M. Keeping Cool in Southeast Asia: Energy Consumption and Urban Air-Conditioning; Palgrave Macmillan: New York, NY, USA, 2014. [Google Scholar]
- International Energy Agency (IEA). The Future of Cooling in Southeast Asia 2019. Available online: http://www.indiaenvironmentportal.org.in/files/file/The_Future_of_Cooling_in_Southeast_Asia.pdf (accessed on 9 June 2020).
- Japan Refrigeration and Air Conditioning Industry Association. Estimation of Global Air Conditioner Demand, 2019 (In Japanese). Available online: https://www.jraia.or.jp/download/pdf/we2019.pdf (accessed on 9 June 2020).
- The MECON Project. Effective Energy Efficiency: Policy Implementation Targeting “New Modern Energy CONsumers” in the Greater Mekong Subregion. Available online: http://meconproject.com/ (accessed on 9 June 2020).
- Piyasil, P. Deliverable Report for MECON Project, Household Energy Efficiency: A Socio-Economic Perspective in Thailand. Available online: http://www.meconproject.com/wp-content/uploads/report/[Task%203-Household%20energy%20efficiency]%20Thailand%20country%20report.pdf (accessed on 9 June 2020).
- Novianto, D.; Gao, W.; Kuroki, S. Review on People’s Lifestyle and Energy Consumption of Asian Communities: Case Study of Indonesia, Thailand, and China. Energy Power Eng. 2015, 7, 465–476. [Google Scholar] [CrossRef]
- Hori, S.; Kondo, K.; Nogata, D.; Ben, H. The determinants of household energy-saving behavior: Survey and comparison in five major Asian cities. Energy Policy 2013, 52, 354–362. [Google Scholar] [CrossRef]
- Murakoshi, C.; Nakagami, H.; Xuan, J.; Takayama, A.; Takaguchi, H. State of Residential Energy Consumption in Southeast Asia: Need to Promote Smart Appliances Because Urban Household Consumption Is Higher than Some Developed Countries. European Council for an Energy efficient economy Summer Study proceedings 2017. Available online: https://www.eceee.org/library/conference_proceedings/eceee_Summer_Studies/2017/7-appliances-products-lighting-and-ict/state-of-residential-energy-consumption-in-southeast-asia-need-to-promote-smart-appliances-because-urban-household-consumption-is-higher-than-some-developed-countries/ (accessed on 9 June 2020).
- Mishra, A.; Ramgopal, M. Field studies on human thermal comfort—An overview. Build. Environ. 2013, 64, 94–106. [Google Scholar] [CrossRef]
- Rupp, R.F.; Natalia, G.V.; Roberto, L. A review of human thermal comfort in the built environment. Energy Build. 2015, 105, 178–205. [Google Scholar] [CrossRef]
- Mancini, F.; Nastasi, B. Energy Retrofitting Effects on the Energy Flexibility of Dwellings. Energies 2019, 12, 2788. [Google Scholar] [CrossRef]
- Haldi, F.; Robinson, D. Adaptive actions on shading devices in response to local visual stimuli. J. Build. Perform. Simul. 2010, 3, 135–153. [Google Scholar] [CrossRef]
- Yun, G.Y.; Steemers, K. Behavioural, physical and socio-economic factors in household cooling energy consumption. Appl. Energy 2011, 88, 2191–2200. [Google Scholar] [CrossRef]
- Peng, C.; Yan, D.; Wu, R.; Wang, C.; Zhou, X.; Jiang, Y. Quantitative description and simulation of human behaviour in residential buildings. Build. Simul. 2012, 5, 85–94. [Google Scholar] [CrossRef]
- Andersen, R.; Fabi, V.; Toftum, J.; Corgnati, S.; Olesen, B. Window opening behaviour modelled from measurements in Danish dwellings. Build. Environ. 2013, 69, 101–113. [Google Scholar] [CrossRef]
- D’Oca, S.; Hong, T.; Langevin, J. The human dimensions of energy use in buildings: A review. Renew. Sustain. Energy Rev. 2018, 81, 731–742. [Google Scholar] [CrossRef]
- Jareemit, D.; Limmeechokchai, B. Understanding Resident’s Perception of Energy Saving Habits in Households in Bangkok. In 2017 International Conference on Alternative Energy in Developing Countries and Emerging Economies; Waewsak, J., Sangkharak, K., Othong, S., Gagnon, Y., Eds.; Elsevier: Amsterdam, The Netherlands, 2017; pp. 247–252. [Google Scholar]
- Jareemit, D.; Limmeechokchai, B. Impact of homeowner’s behaviours on residential energy consumption in Bangkok, Thailand. J. Build. Eng. 2019, 21, 328–335. [Google Scholar] [CrossRef]
- Supasa, T.; Hsiau, S.-S.; Lin, S.-M.; Wongsapai, W.; Wu, J.-C. Household Energy Consumption Behaviour for Different Demographic Regions in Thailand from 2000 to 2010. Sustainability 2017, 9, 2328. [Google Scholar] [CrossRef]
- Chiang Mai University. Report of Thailand Household Energy Survey in Northern and Bangkok Metropolitan; unpublished. (In Thai)
- Han, J.; Yang, W.; Zhou, J.; Zhang, G.; Zhang, Q.; Moschandreasb, D.J. A comparative analysis of urban and rural residential thermal comfort under natural ventilation environment. Energy Build. 2009, 41, 139–145. [Google Scholar] [CrossRef]
- Department of Provincial Administration. Number of Citizens throughout the Kingdom according to the Civil Registration Evidence as of 31 December 2015 (In Thai). Available online: http://stat.bora.dopa.go.th/stat/pk/pk_58.pdf (accessed on 9 June 2020).
- Thai Meteorological Department (TMD). Annual Weather Summary over Thailand in 2016. Available online: https://www.tmd.go.th/programs/uploads/yearlySummary/weather2016.pdf (accessed on 9 June 2020).
- National Statistics Office (NSO). Major Findings of the 2015 Household Energy Consumption. Available online: http://service.nso.go.th/nso/nsopublish/themes/files/EnergyPocket58.pdf (accessed on 9 June 2020).
- Hachiya, Y.; Inoue, T. Housing in a Modern Farm Village in the Northeastern Part of the Kingdom of Thailand. Geijutsu Kogaku, J. Des. 2012, 16, 39–52. (In Japanese) [Google Scholar]
- Zhang, Y.; Kondo, K.; Chutchaipolrut, A.; Arampongpun, S.; Kikusawa, I. Influence of Favorite Place in House—Outdoor or Indoor—On Energy Consumption and Happiness in Rural Thailand. Sustainability 2017, 9, 1350. [Google Scholar] [CrossRef]
- Kubota, T.; Jeong, S.; Toe, D.; Ossen, D. Energy Consumption and Air-Conditioning Usage in Residential Buildings of Malaysia. J. Int. Dev. Coop. 2011, 17, 61–69. [Google Scholar]
- Leelakulthanit, O. Barriers and benefits of changing people’s behavior regarding energy saving of air conditioners at home. Asian Soc. Sci. 2017, 13, 130–136. [Google Scholar] [CrossRef][Green Version]
- Rangsiraksa, P. Thermal comfort in Bangkok residential buildings. In Proceedings of the 23rd International Conference on Passive and Low Energy Architecture PLEA 2006, Geneva, Switzerland, 6–8 September 2006. [Google Scholar]
- Karjalainen, S. Gender differences in thermal comfort and use of thermostats in everyday thermal environments. Build. Environ. 2007, 42, 1594–1603. [Google Scholar] [CrossRef]
- Asia-Pacific Economic Cooperation. Peer Review on Energy Efficiency in Thailand. Available online: https://aperc.ieej.or.jp/file/2010/9/26/PREE20100414_Thailand.pdf (accessed on 9 June 2020).
© 2020 by the authors. Licensee MDPI, Basel, Switzerland. This article is an open access article distributed under the terms and conditions of the Creative Commons Attribution (CC BY) license (http://creativecommons.org/licenses/by/4.0/).