Article

Use of Sentinel-1 GRD SAR Images to Delineate Flood Extent in Pakistan

1
Key Laboratory of Digital Earth Science, Aerospace Information Research Institute, Chinese Academy of Sciences, No. 9 Dengzhuang South Road, Beijing 100094, China
2
State Key Laboratory of Remote Sensing Science, Aerospace Information Research Institute, Chinese Academy of Sciences, No. 9 Dengzhuang South Road, Beijing 100094, China
3
Hainan Key Laboratory of Earth Observation, Aerospace Information Research Institute, Chinese Academy of Sciences, Sanya 572029, China
*
Author to whom correspondence should be addressed.
Sustainability 2020, 12(14), 5784; https://doi.org/10.3390/su12145784
Submission received: 29 May 2020 / Revised: 15 July 2020 / Accepted: 16 July 2020 / Published: 17 July 2020
(This article belongs to the Section Hazards and Sustainability)

Abstract

:
Floods are some of the most serious and devastating natural hazards on earth, bringing huge threats to lives, properties, and living environments. Rapid delineation of the spatial extent of flooding is of great importance for the dynamic monitoring of flood evolution and corresponding emergency strategies. Some of the current flood mapping methods mainly process single date images characterized by simple flood situations and homogenous backgrounds. Although other methods show good performance for images with harsh conditions for floods, they must be trained—many times based on pre-classified samples—or undergo complicated parameter tuning processes, which require computation efforts. The widely used change detection methods utilize multi-temporal Synthetic Aperture Radar (SAR) images for the detection of flood area, but the results are largely influenced by the quality of defined reference images. Furthermore, these methods were mostly applied for some river basin floods, which are not effective for the large scale, semi-arid regions with complex flood conditions, and various land cover types. All of these extremely limited the use of these methods for the timely and accurate extraction of the spatial distribution pattern of floods in other typical and broad areas. Based on the above considerations, this paper presents a new method for rapidly determining the extent of flooding in large, semi-arid areas with challenging environmental conditions, based on multi-temporal Sentinel-1 Synthetic Aperture Radar (SAR) data. First, a preprocessing scheme is applied to perform geometric correction and to estimate the intensity of the imagery. Second, an automatic thresholding procedure is used to generate an initial land and water classification through the integration of the probability density distribution. A fuzzy logic-based approach, combining SAR backscattering information and other auxiliary data, is then used to refine the initial classified image. The fuzzy logic-based refinement removes areas that look similar to water in the SAR images, significantly enhancing the flood mapping accuracy. Finally, a post-processing step consisting of morphological operations and extraction improves the homogeneity of the extracted flood segments, discards isolated pixels, and gives the final flood map. This method can automatically detect the extent of floods at little computational cost. As Sentinel-1 data are publicly available and have a fast repeat cycle, the procedure can provide near real time results for rapid emergency response following flash floods. The accuracy of the proposed method is assessed at three test sites in Pakistan, which covered diverse landscapes and suffered large scale serious flooding after a long and severe drought in 2015. In comparison with the more recent studies from Ohki et al., 2020, and Shahabi et al., 2020, our results indicate the best spatial agreement with GF-2 panchromatic multi-spectral (PMS) water classification, with an encouraging overall accuracy ranging from 91.1% to 96.6%, and Kappa coefficients ranging from 0.893 to 0.954. Especially for the areas with fragmented floods, heterogeneous backgrounds, and the areas where samples are highly unbalanced in the SAR images, our method combines the global statistics and local relationships of backscattering properties, terrain, and other auxiliary information, enabling to effectively preserve the detailed structures and also remove the noise.

1. Introduction

Floods are very serious, frequently occurring natural hazards that cause great damage to infrastructure, lives, and economies [1,2]. Management authorities require timely information about flood conditions in inundated areas to effectively organize emergency response. The rapid estimation of the spatial extent of flooding over large areas provides a key data source for assessing the disaster risk and spatial planning [3,4,5].
Satellite remote sensing is increasingly important for flood mapping [2,6]. Optical remote sensing has been used for dynamic flood monitoring based on the low reflectance of water in the infrared bands and high reflectance in the blue/green bands [7,8,9]. In practice, however, flood events often happen in bad weather, characterized by heavy clouds and intense rainfall, which hampers the effective use of optical imaging instruments because of the lack of cloud-free, high-quality images. In densely vegetated areas, optical sensors are often unable to detect standing water under vegetation [10]. Synthetic Aperture Radar (SAR) is of special interest in observing flood situations, it actively emits electromagnetic waves, which are unaffected by the weather and time of day, and can be used to detect flooding in vegetated or urban areas because of its high penetration capability [2,11,12]. Therefore, the use of SAR data has been investigated by many researchers.
SAR-based techniques for flood detection include thresholding-based methods [13], image segmentation [14], statistical active contouring [15], rule-based classification [16], and data fusion approaches [17]. Among these, thresholding-based methods are the most commonly used for flood detection. As a computationally efficient method, although a split-based thresholding process provides reliable results in near real time mapping [18], it performs well, mainly for the area with simple flood situations and homogeneous land surfaces, the flood mapping results are even quite sensitive to the chosen threshold values. The classical image segmentation methods are based on spatial domain for the detection of floods; they work poorly when the extension of the flood area is small, and meanwhile, the parameters used for these methods are determined empirically after many experiments [19,20]. Considering the complex environment in flood scenarios, statistical active contouring rely on the high resolution SAR images to calculate the active contour energy for the segmentation of an image with a defined and initialized boundary [21]. However, computational complexity is also continuously increased for these methods, which prevent them for the processing of SAR images in applications of rapid monitoring of floods over large-scale regions. Apart from the use of SAR images, rule-based classification was done based on the derived expert rules using multi-source data like texture and shape information [22]. Data fusion methods, such as Bayesian networks, offer good performance in terms of flood observations in a complex system in combination with geomorphic and hydrological data [17]. While both of these methods are trained for several times on a set of pre-classified features, which is impractical for sudden flood events in harsh conditions [23]. Therefore, although good results have been achieved, most of the abovementioned methods only process a single image; some can be successfully applied for an image that has simple flooded pattern and surrounding backgrounds. Other methods work well for areas with harsh conditions for floods, but should be trained repeatedly on pre-classified samples or the parameters used are estimated after many attempts, indicating expensive computation for large flood area. Based on multi-temporal SAR images, change detection is an effective tool for the rapid monitoring of abrupt changes to the land surface, as occurs in the event of flooding, and can mask out some permanent water bodies [12,24]. However, the results of change detection are largely dependent on the selected reference image, which remains a key issue in many studies. Some researches use topographic data for the analysis of floods; however, it may be impossible to access this accurate information for remote and large scale areas of the world [25,26].
Currently, most SAR-based methods for flood detection are intended to monitor large river floods located in northern temperate latitudes, including eastern Europe [27], Germany [28], Canada [29], and the UK [14]. Few studies have focused on flooding in large-scale semi-arid regions, such as Pakistan, which has diverse landscapes, such as glaciated mountainous terrain, snow/ice, dense drainage network, farmland, desert, etc., and suffers regular severe flooding in the wet season and intense periods of drought for a whole year. The application of already-developed methods for delineating large flood areas in these regions are not effective and feasible.
In summary, a flood mapping method must be able to capture floods in near real time, which means that it should operate rapidly with little computational cost instead of tedious training and parameter adjustment process, especially when using multiple images in order to observe the flood evolution patterns. Additionally, the procedure for flood detection must have broader applicability to large, semi-arid regions with complex flood situations and diverse land cover types. Finally, an operational flood detection process should be independent of the reference image and specific satellite sensors. Based on these requirements, this paper presents an approach to automatic and rapid detection of floods in semi-arid regions using multi-temporal Sentinel-1A/1B ground range detected (GRD) images. Unlike the methods that are presented above, the proposed approach has small computation efforts, can detect floods in a consistent and reliable way in images of large size, covering extensive floods and also some small and disperse flood areas. The Sentinel-1 mission is operated by the European Space Agency (ESA), which offers its products free to the scientific community, and has a high repetition rate (six days). Therefore, there is good data availability for flood analysis. As for large-scale applications, the developed flood mapping algorithm is based on a four-step process consisting of image preprocessing, initialization of the classification by global thresholding, fuzzy logic-based classification refinement, and morphological post-processing. A fuzzy logic-based algorithm integrating SAR backscatter information and different auxiliary data into the classification process is used to refine the classification accuracy. The proposed method is used to determine the extent of inundation during seasonal flood events in Pakistan in 2015 using available Sentinel-1 images.

2. Study Area and Dataset
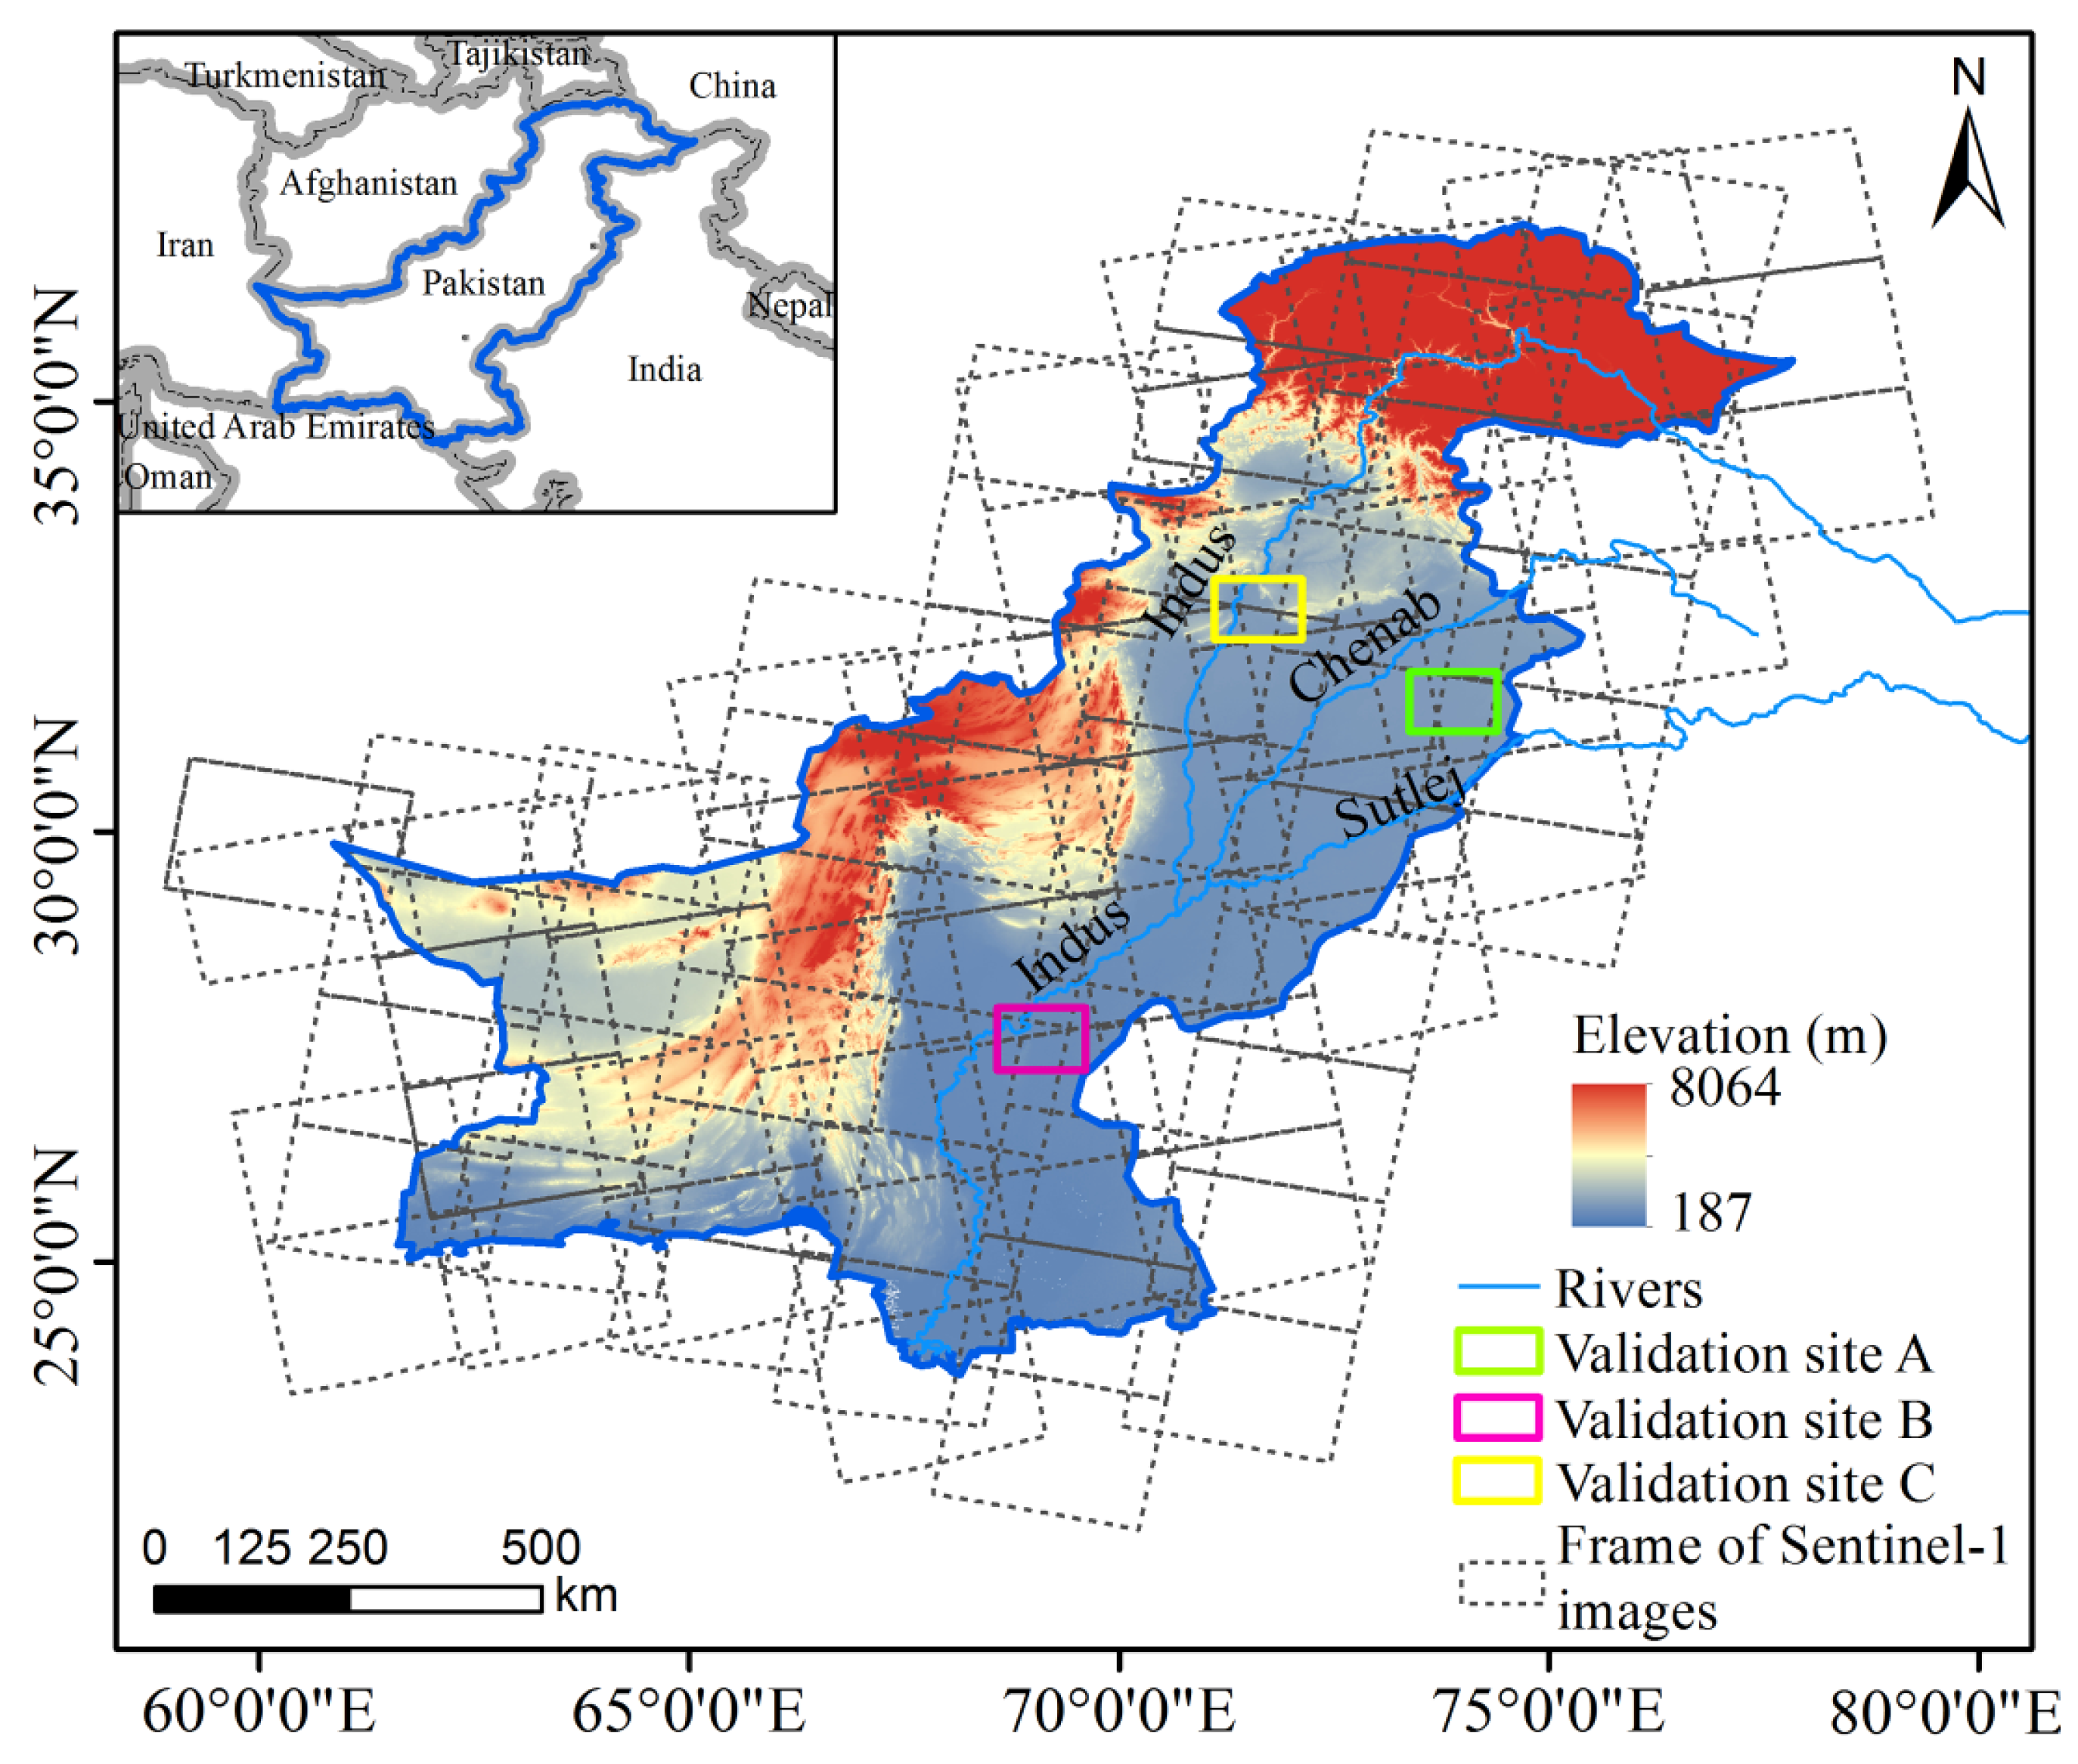
2.1. Study Area

Pakistan is located in the northwest of the South Asian subcontinent, bordering the Arabian Sea in the south, India in the east, China in the northeast, and Afghanistan in the northwest (Figure 1). The territory of Pakistan covers an area of 880,254 km2 (including the Kashmir district) [30]. Some 60% of the country is mountainous and hilly. There are extensive deserts in the southern coastal regions, with plateau grasslands extending to the north [31,32]. The Himalayas, Karakoram, and Hindu Kush, three of the most famous mountain ranges in the world, converge in the northwest of Pakistan and feed numerous glaciers and glacial lakes. Pakistan lies in the temperate zone and has a subtropical and semiarid climate, characterized by high temperatures and scarce precipitation. The annual mean temperature is 27 °C [33]. On average, the mountainous area of Pakistan receives 200–960 mm precipitation annually, and the rest of the country, which is mostly covered by plains, receives 180–460 mm [32,34].
Floods are the most frequent and destructive natural disaster in Pakistan. This region experiences seasonal flooding and a long dry period each year. Of those who are affected by natural hazards, 90% suffer the effects of flooding [35]. In July 2015, Pakistan suffered one of the most severe floods in its history, killing 238 people, injuring 157 people, and affecting more than 1.57 million people. The economic losses amounted to approximately US $3.3 billion. According to official statistics, more than 18,000 houses and 3500 villages were affected to varying degrees. Although the heavy monsoon rainfall tends to weaken in late August, there are persistent flood risks until the monsoon season ends in September.

2.2. Dataset

We accessed Sentinel-1 C band Interferometric Wide (IW) swath mode GRD datasets from the Google Earth Engine (GEE) cloud computing platform (https://code.earthengine.google.com/) in order to map the extent of flooding over the whole Pakistan. The satellite offers a viewing swath width of 250 km, and acquires data in dual-polarization at 5 m × 20 m spatial resolution. In 2015, heavy rain caused long-lasting and widespread flooding during July and August. The images used in this study are Sentinel-1 VV (i.e., Vertical-polarized wave transmitted returns as Vertical-polarized signal) scenes acquired in both ascending and descending pass directions with a revisit cycle of six days from July–August 2015. Approximately 91 footprints and 455 images were required to cover the whole study region. The frames of these images are shown in Figure 1. Three subareas to the north and south of the country were selected for validation (see the green, magenta, and yellow rectangles in Figure 1). The corresponding optical GF-2 PMS data acquired on the date closest to the Sentinel-1 data were used as validation data. The GF-2 images used are almost free of cloud and have a high resolution of 4 m for its multispectral bands. The ground truth was generated from the GF-2 PMS images by means of the normalized difference water index (NDWI) [36].
Across Pakistan, land cover types such as large areas of desert and snow/ice exhibit similar backscatter profiles to open water surfaces, which could result in misclassification. Therefore, to mask out these objects from the inundated areas in the Sentinel-1 images and to distinguish with permanent water bodies, a land cover map of Pakistan was obtained from the Global Land Cover Facility (http://glcf.umd.edu/data/). To remove pixels with a low signal return from the back of the mountains, slope information derived from the Shuttle Radar Topography Mission (SRTM) were used. The SRTM 1-arcsecond global digital elevation model (DEM) for Pakistan was acquired from the United States Geological Survey (USGS) online resource and was used for all SAR imagery.

3. Methodology

The proposed method for delineating the flood extent based on Sentinel-1 images is illustrated in Figure 2. This process involves: (a) accessing a large number of Sentinel-1 GRD images from GEE and preprocessing the SAR images for subsequent water area identification, (b) initial classification of the images using automatic thresholding segmentation, (c) refinement of the initially classified results based on fuzzy logic, and (d) post-processing to obtain the final flood maps and validating the results using the reference water mask derived from higher-resolution optical images.

3.1. Accessing and Preprocessing Images

Sentinel-1 GRD data obtained in IW mode and with VV polarization covering the whole Pakistan were acquired from GEE. During the preprocessing step, we firstly performed the Range–Doppler terrain correction of Sentinel-1 imagery and radiometric calibration to sigma naught (dB). In the GRD imagery provided by ESA, geometric distortions due to terrain effects are not considered for some specific areas. Therefore, the GRD data were corrected to improve the geolocation accuracy. Using the corresponding SRTM 1-arcsecond global data, the Sentinel-1 GRD imagery was terrain-corrected [37] and projected to World Geodetic System-1984 (WGS-84) Coordinate System geographical coordinates. The images were then radiometrically calibrated to derive backscatter intensity values using the sensor calibration parameters. The refined Lee filter with 7 × 7 window size [38] was applied to all calibrated data to reduce the inherent SAR speckle noise and improve the signal-to-noise ratio. The result of this preprocessing is a georeferenced, radiometrically calibrated, and speckle-removed image. Figure 3 shows some examples of preprocessed Sentinel-1 images taken before and after the flood event. The refined Lee filter removed speckles and smoothed the image. Darkened areas are associated with flooding.
To avoid misclassification wherever possible and optimize the results of flood identification, a land cover map of Pakistan was used to eliminate potential flood-lookalikes such as extensive desert areas in the south and snow/ice in the northern glaciated regions. With the aid of the land cover map, the flood inundation can then be separated from permanent water bodies such as rivers in the study area, enabling the generation of final flood maps.

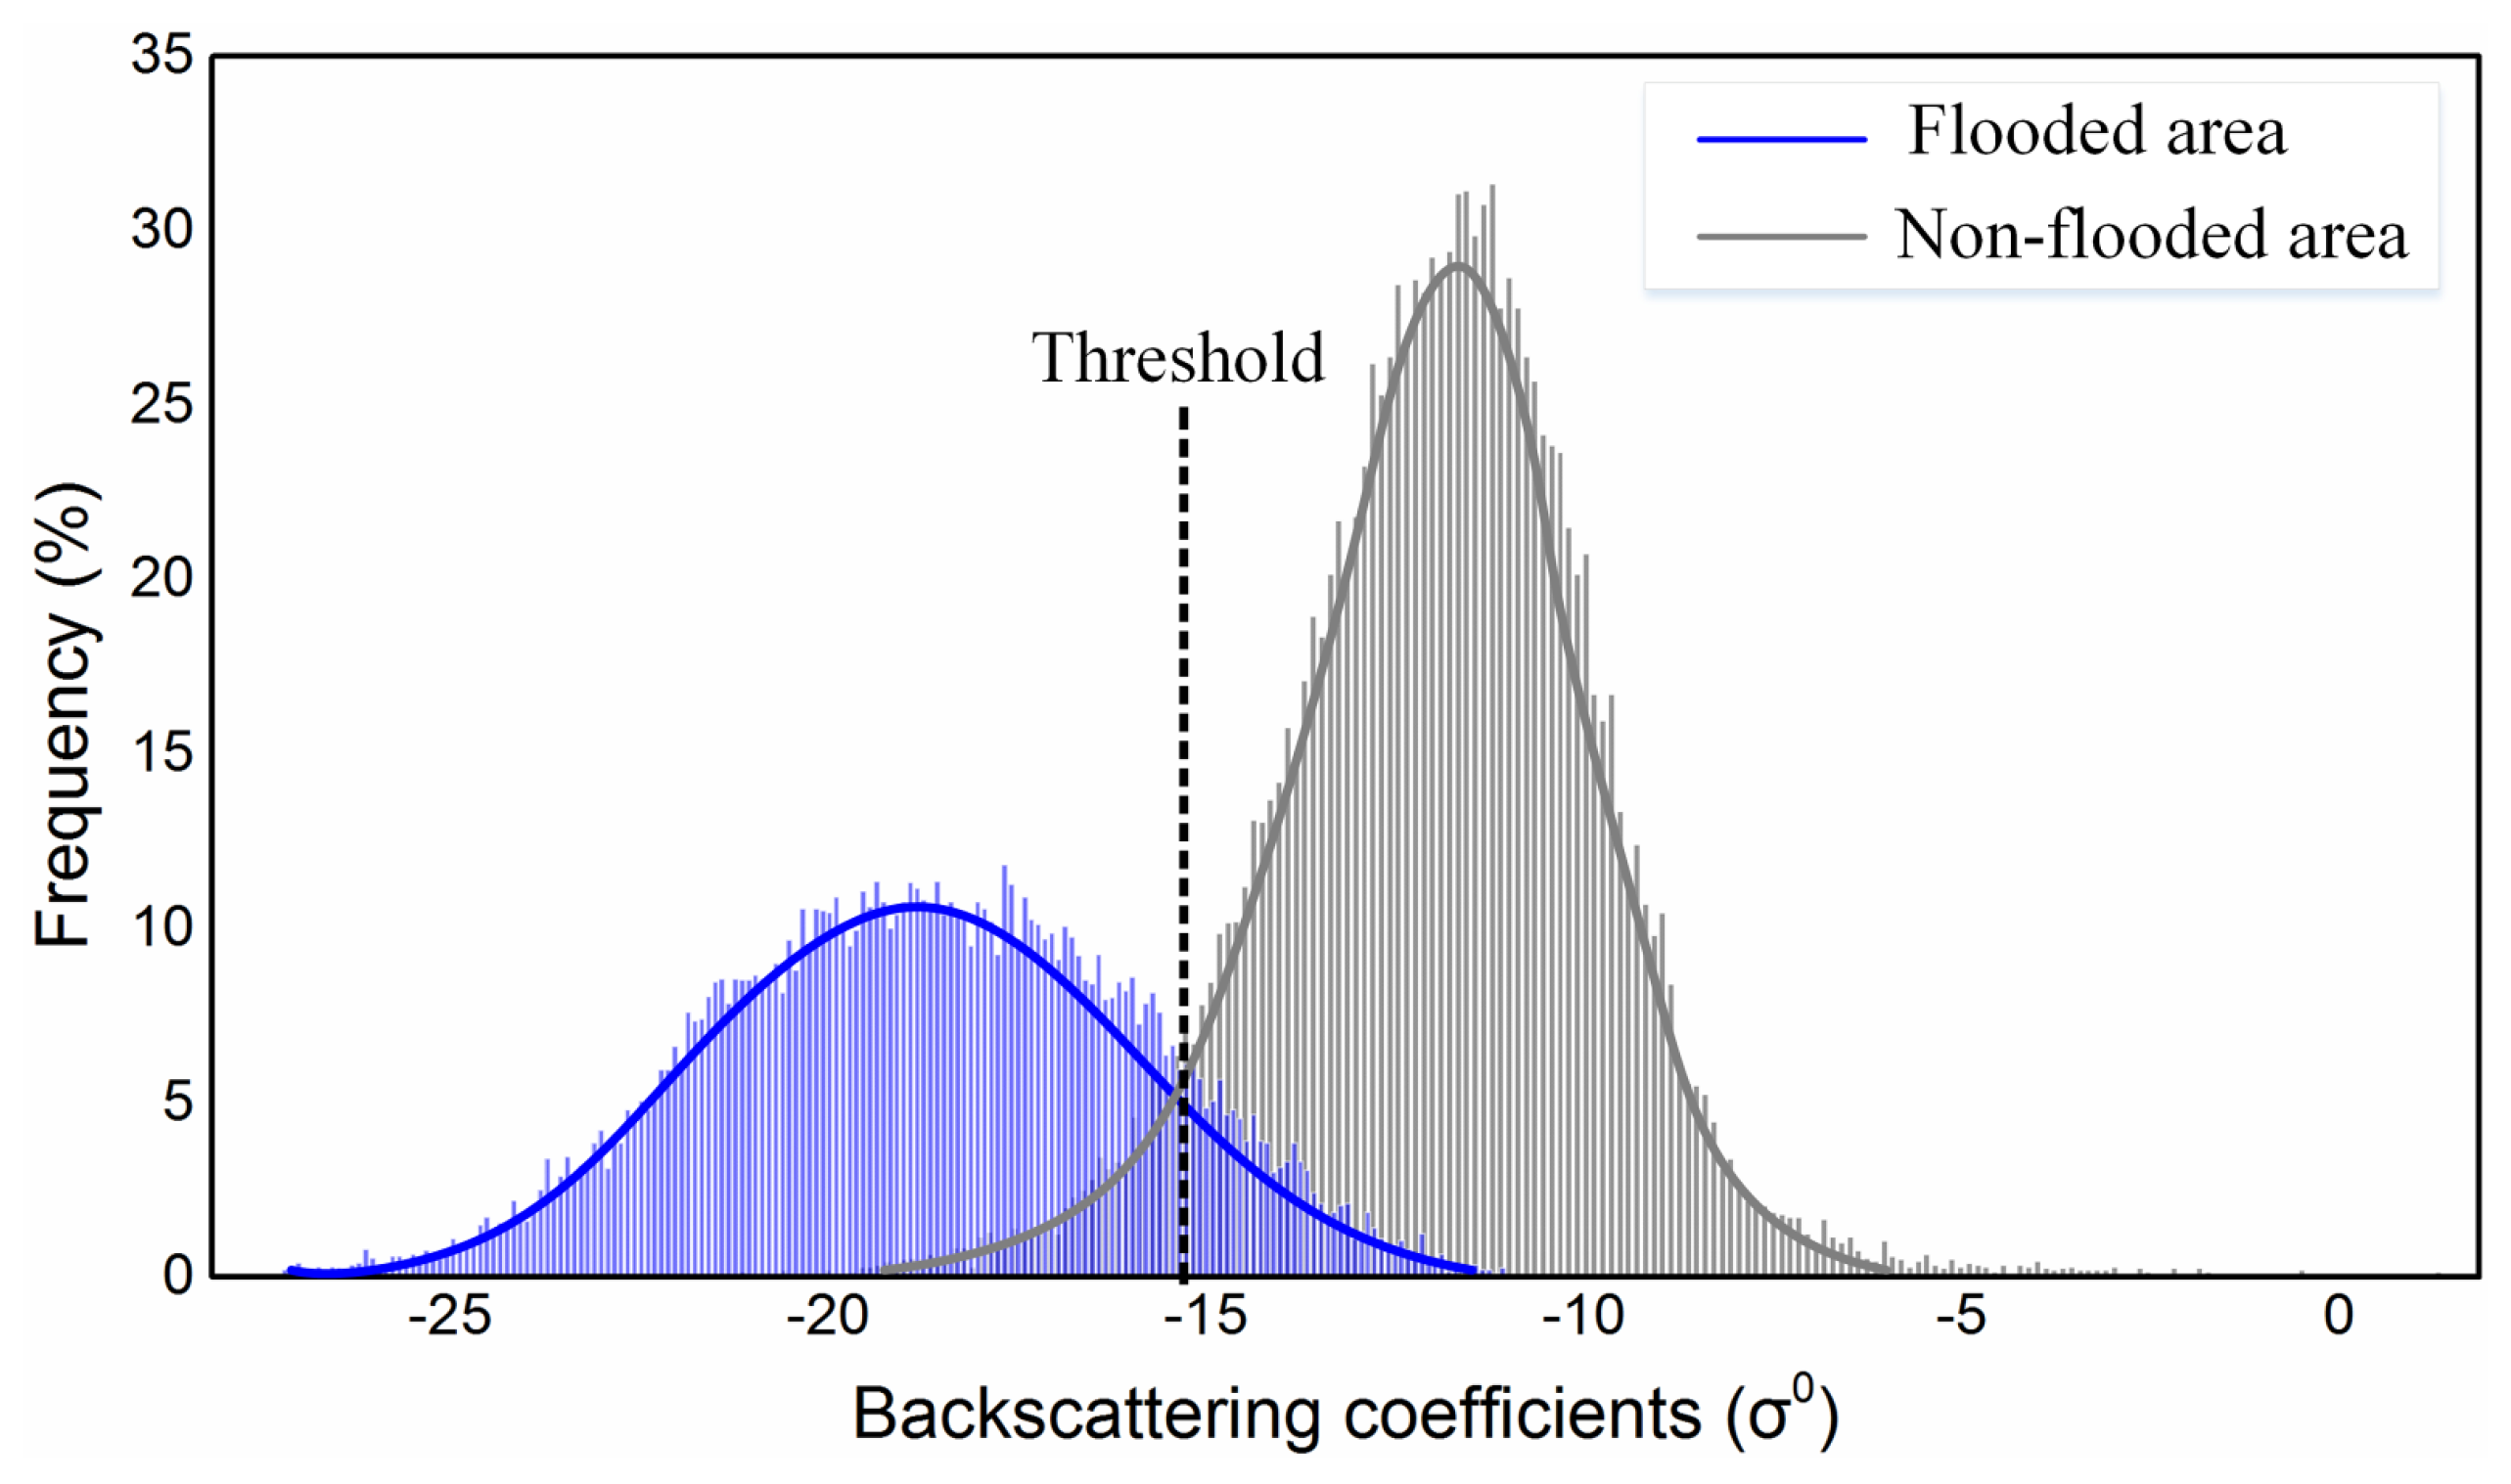
3.2. Thresholding Based on Probability Density Function

For the mountainous areas in the north of Pakistan, noise from topographic shadows produces similar backscattering as open water, and thus has a significant impact on the results of flood mapping from SAR images. To remove the shadow and dark surface noise before determining the flood extent, the slope of the input SRTM DEM data was analyzed. Some researchers have found that areas with slopes of less than 10° are most susceptible to rainfall, making them prone to flood disasters [39]. Besides, as there are gaps and errors in the SRTM data in high-relief areas, we therefore selected a standard slope of 10°, and masked out the pixels of the preprocessed images where the slope was greater than 10°. This step masks out these steeper slopes and removes any pixels in the SAR image that may show low backscattering response due to terrain shadows [11]. The removal of these dark pixels is also important for calculating the subsequent local statistics during thresholding.
An automatic thresholding procedure was used to generate the initial water and non-water classification. The selection of this threshold is performed using a probability density function (PDF). Firstly, the sample data were separated into water and non-water pixels, the backscattering coefficients of which were defined for use in the development of the statistical distributions. Each class was further represented by the statistical expression for its PDF [40]. The threshold selection process uses the statistical relations between the water and non-water objects. It should be noted that a number of ground truth samples for water and non-water areas were built, and these have a low standard deviation in their backscattering coefficient values. This criterion serves as a measure of the variation degree within each sample set and can be used as an indicator of the spatial homogeneity of the sample areas. Because the sample backscattering intensity i serves as the maximum likelihood estimate of the statistical backscattering intensity I, we developed a statistical expression of each PDF, D i ( i | I ) , which can be expressed in terms of the sample backscattering intensity i , the independent number of looks m, and the hypergeometric function G [41]:
D i ( i | I ) = 2 ( m 1 ) ( 1 I 2 ) m i ( 1 i 2 ) m 2 × G ( m , m ; 1 ; I 2 i 2 )
Finally, the established PDFs were used to determine the threshold of intensity for initial flood mapping. This scheme restricts the thresholding to pixels situated in flood-prone regions by eliminating other disturbances. The statistical distributions of the backscattering coefficients are fully considered, proving to be more reliable for identifying flooding than the thresholding segmentation used in previous studies [14,42]. The selected threshold is generally high, as this guarantees the successful mapping of areas with a relatively small extent of surface water or with dispersed water bodies. In this study, a relatively conservative global threshold value of −15 dB was derived and applied to the scenes. Histograms of the backscattering coefficient of 2015 flood and non-flood sample objects, and the corresponding PDF curves, are shown in Figure 4. The range of the flooded images relies on the statistical relationships of the pixel backscattering values of the entire image. The number of pixels below −15 dB represents the large population of flooded pixels.

3.3. Fuzzy Logic-Based Refinement

To further improve the mapping accuracy, a fuzzy logic-based approach was developed to refine the initial classification by removing some areas that look like floods and could thus be misclassified. Based on the initial classification results, a fuzzy set is built using the mean elevation (h) and backscattering intensity ( i ) of the initially derived water regions and the size (a) of each individual water object. We then use the membership functions to determine the degree of an element’s membership to the flood class [43]. The degree of membership ranges from 0–1, with a higher membership degree indicating a greater likelihood of belonging to the water class.
From the fuzzy standard function, it can be found that the membership degree is strongly dependent on two fuzzy thresholds, t1 and t2 [44]. The fuzzy threshold values are either set empirically or defined by statistical computations for each element. For the digital elevation h, the fuzzy thresholds are defined as
t 1 ( h ) = μ h and t 2 ( h ) = μ h + l σ σ h
l σ = σ h + 3.5
where μ h and σ h refer to the mean and standard deviation, respectively, of the elevation of all the derived water objects through automatic thresholding. Using this fuzzy set, areas incorrectly classified as water in the mountainous terrain, which has a greater elevation than the mean elevation of all the water areas, are largely removed. Moreover, (3) can be integrated to reduce the effect from areas with low elevation.
Using the radar backscatter i , the standard membership function based on the two fuzzy thresholds describes the degree of membership to flood areas. The corresponding fuzzy thresholds are expressed as
t 1 ( i ) = μ i and t 2 ( i ) = T i
where μ i are the mean backscattering coefficients of the initially classified flood extent and T i is the global threshold for initial classification; in this study, T i   =   15   dB . Image elements for which the backscatter is lower than the fuzzy threshold t 1 ( i ) are given full membership, while a membership degree of 0 is assigned to image pixels with values greater than t 2 ( i ) .
The size of water bodies is integrated as a third element in the fuzzy system using the membership function with t 1 ( a )   =   1000   m 2 ,   t 2 ( a )   =   5000   m 2 . A membership degree of 0 is assigned to elements with a size of less than t 1 ( a ) , and a membership degree of 1 is assigned to elements with a size greater than t 2 ( a ) . Using this information layer, isolated water objects with low backscattering responses are filtered out.
These three fuzzy elements are combined into one composite fuzzy set by averaging the membership degree for each pixel [18]. The refined flooding map is created through a threshold defuzzification step, which extracts discrete flood classes from image elements by applying a membership degree threshold of 0.6 [7].

3.4. Morphological Processing and Extraction

Morphological dilation tool can be used to expand the region of image data to the appropriate edge of the desired object [45]. Dilation is a useful post-processing tool for radar image, because it preserves the edge and detailed information, corrects the insert error in the region, and effectively ignores the scattered light and dark pixels related to the speckle noise missed in the pre-processing step. In order to improve the spatial homogeneity of the detected flood area and integrate the image elements of water boundary, this study implemented a morphological dilation operation. The refined results of water bodies were used as the base data for dilating the flood regions, with the dilation operator restricted to the neighborhood of pre-classified flood areas with a filtering window size of 7 × 7 pixels. Thus, denser and smoother flooded pixels can be identified for flood mapping. The final flood mapping validation employed high-resolution GF-2 PMS images over the three test sites. The time differences between the Sentinel-1 and GF-2 images were no more than 48 h. During this time, the flood conditions were stable and no significant fluctuations in water level were observed in the consecutive SAR and optical satellite data. The reference water mask was extracted from the NDWI calculated by the multi-spectral bands of the GF-2 images and used to evaluate the flood mapping results.

4. Results and Discussion

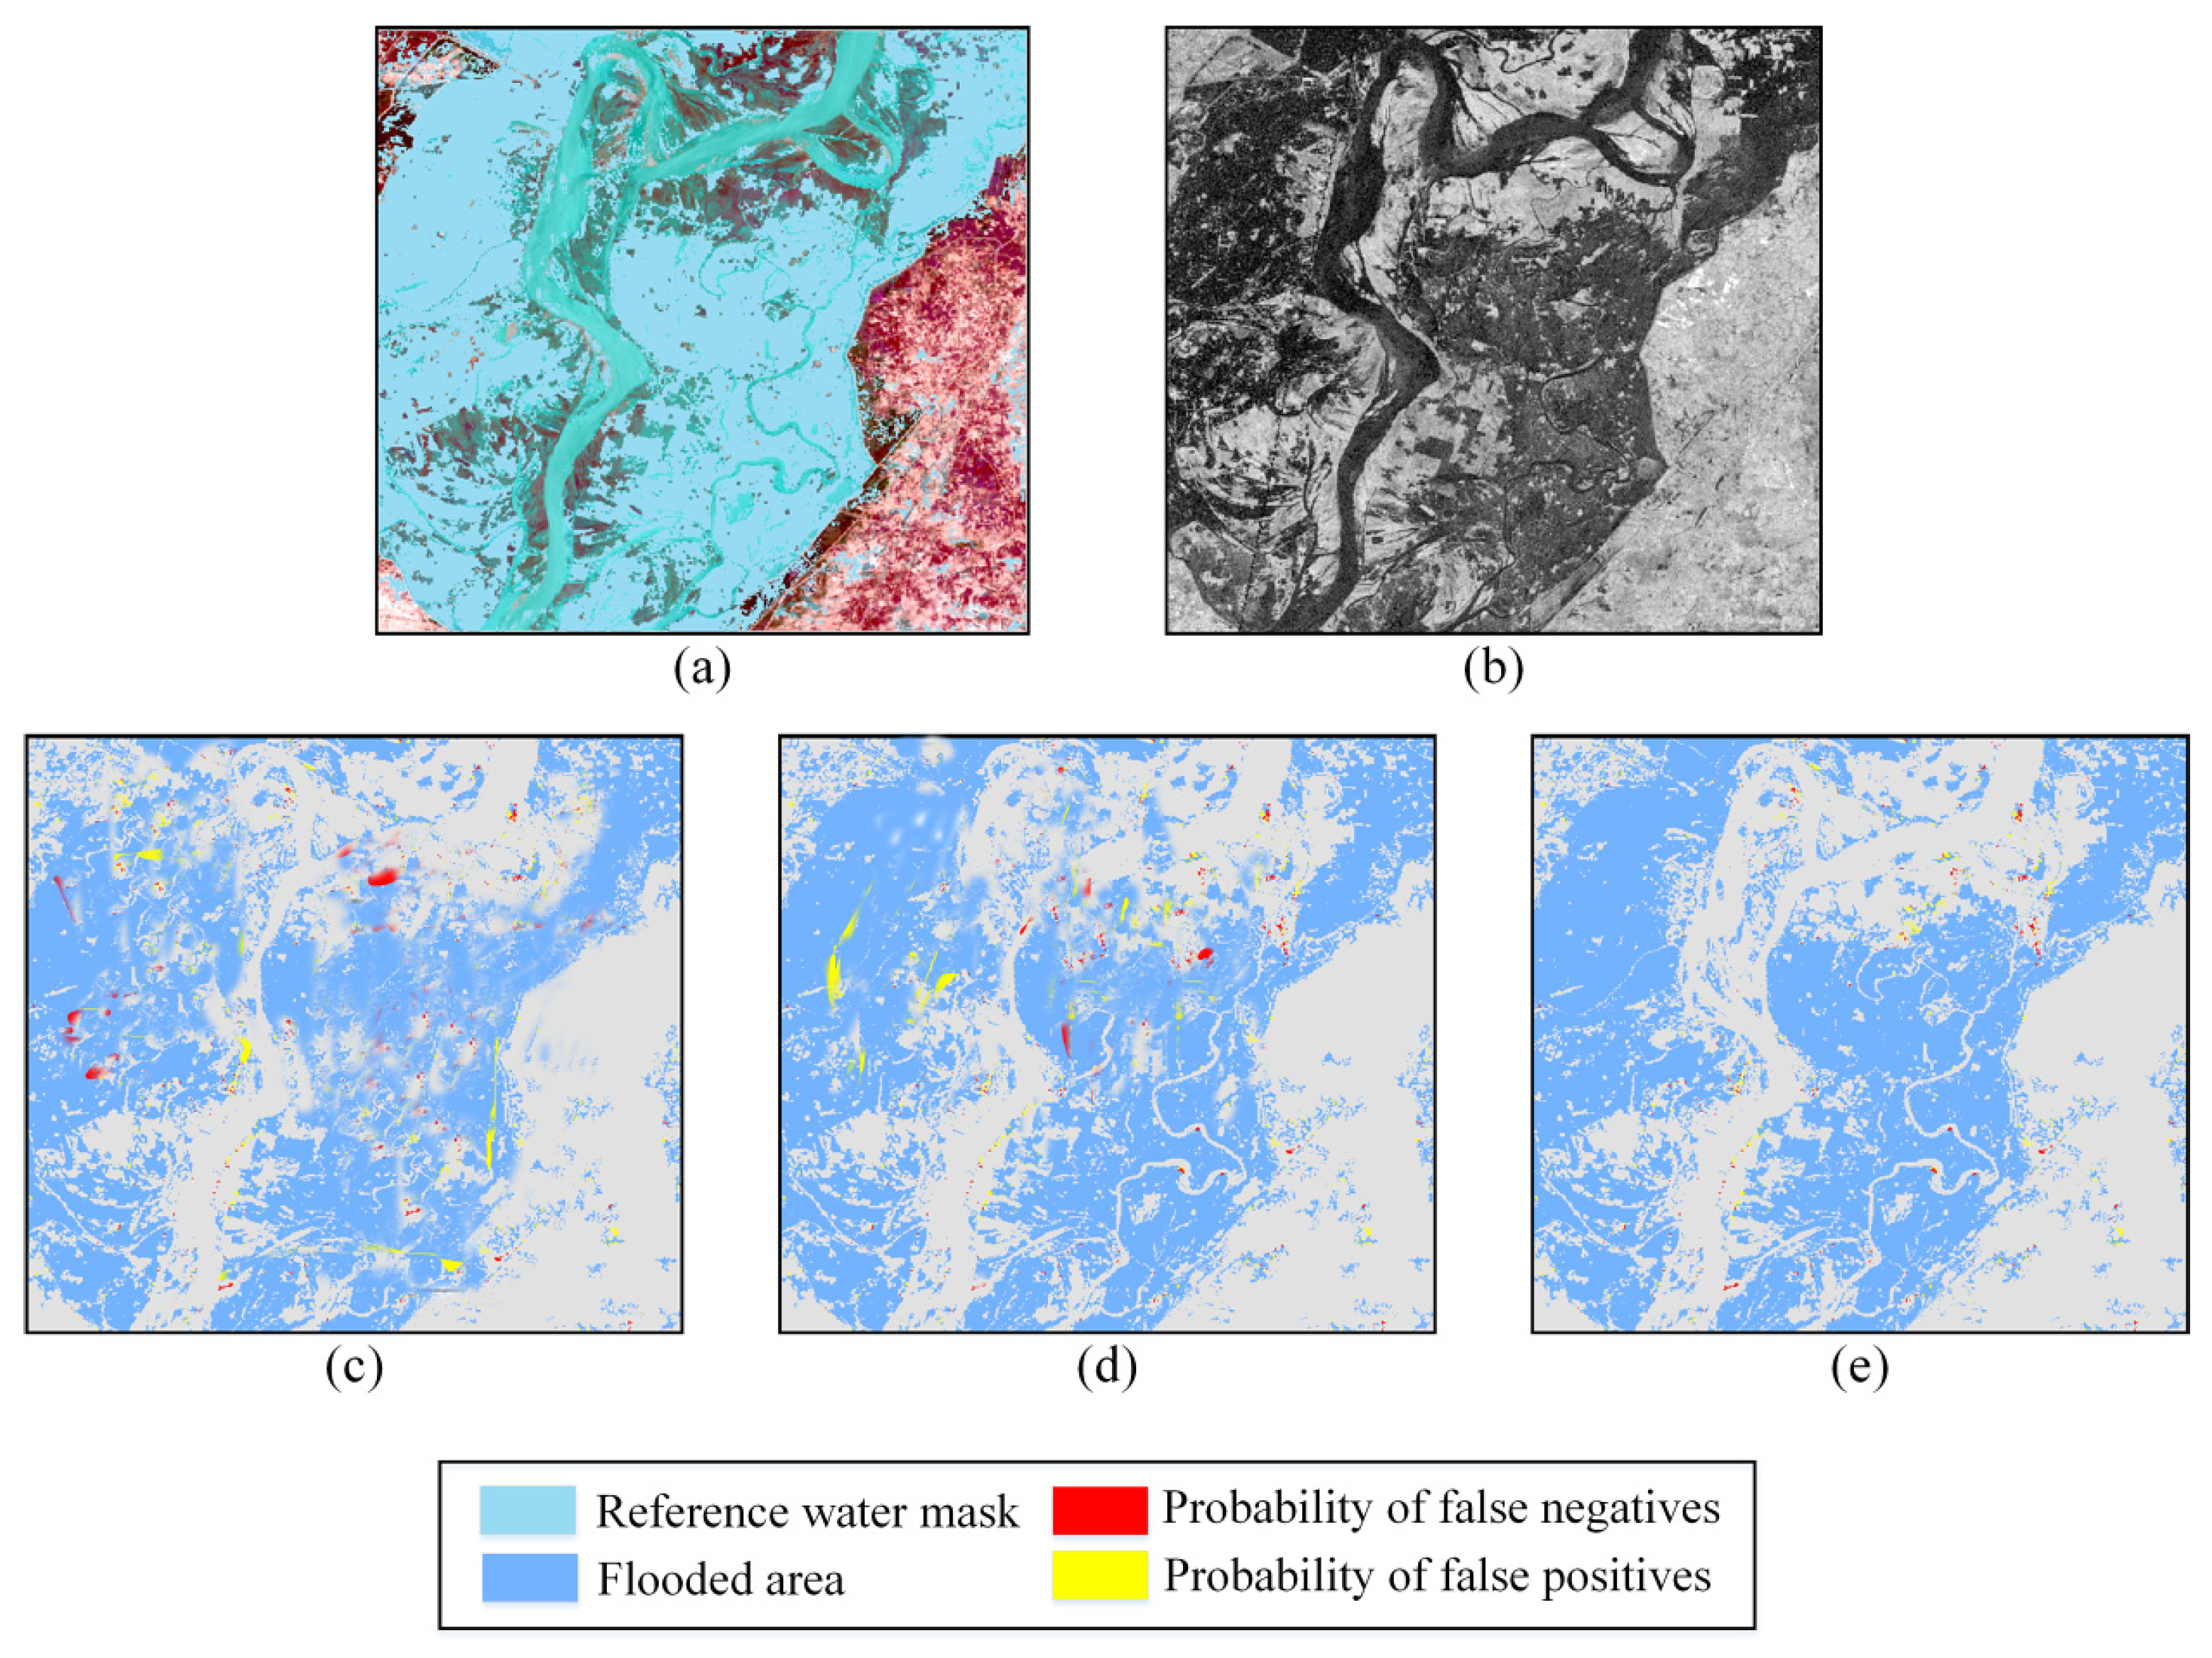
4.1. Results and Quantitative Analysis

To demonstrate the robustness of the developed flood mapping method under challenging environmental conditions, for instance, prevalence of objects that look like water such as snow or radar shadow in mountainous areas, the highly vegetated floodplain and dense drainage network were considered as the basis for the analysis of the results. In such cases, three subareas covered by different background land cover and located from the north to south of the country were used for validation.
The performance of the proposed algorithm was evaluated by comparing the classification results of the automatic Sentinel-1 based processing chain to the water extent of the GF-2 PMS dataset. For a quantitative assessment of accuracy, the probabilities of false positives (PFP) and false negatives (PFN), which denote the commission and omission errors, respectively, the F-measure, which balances the producer’s and user’s accuracy by performing a weighted average computation [46], the Kappa coefficient, and the overall accuracy were computed for the three validation sites.
Here, the first two indicators represent the overall classification accuracy, and can be expressed as:
P F P = p i ( D F R W ¯ ) p i ( R W )   , P F N = p i ( D F ¯ R W ) p i ( R W )
DF refers to the delineated flood areas using the proposed method, and RW refers to the reference water mask derived from the high resolution GF-2 PMS images. pi denotes the number of pixels in each flood element.
The third metric F-measure describes balanced producer’s accuracy pr and user’s accuracy us:
F m e a s u r e = 2 × p r × u s p r + u s
The producer’s accuracy is the probability that a value in a given class was classified correctly, and the user’s accuracy is the probability that a value predicted to be in a certain class really is that class. Besides, the Kappa coefficient measures the agreement between classification and truth values. A Kappa value of 1 represents perfect agreement, while a value of 0 represents no agreement. The overall accuracy is calculated by summing the number of correctly classified pixels and dividing by the total number pixels.
Based on validation methods presented above, we have compared our mapping results with more recent studies from Ohki et al., 2020 [47], and Shahabi et al., 2020 [48], to show the improvement of the proposed method for the delineation of flood region. Ohki et al. found that interferometric phase are more accurate than coherence, and developed a method for the flood mapping in built-up areas using interferometric phase statistics. Shahabi et al. employed a machine learning approach that using bagging ensemble based on K-Nearest Neighbor classifier to spatially map flood-prone areas in the Haraz watershed in northern Iran.
Because these recent studies do not mask the existing water regions from the flood maps, for comparative analyses under the same conditions, some permanent waters in the mapping results of the three validation sites produced by different methods are all masked by the land cover map of Pakistan, as shown in Figure 5, Figure 6 and Figure 7, corresponding quantitative comparisons and accuracy assessments are listed in Table 1. Generally, all the methods can achieve good results in the three test sites. The results obtained by our method reached the highest accuracy, since there are no major differences between the Sentinel-1 based flood map and the GF-2 derived flood extent. The method proposed by Ohki et al. 2020 outperforms the machine learning based method from the study of Shahabi et al. 2020 in all the validation sites in terms of overall accuracy, Kappa coefficients, and F-measure. Some misclassifications can be identified by comparing the backscattering behavior of VV polarization with the corresponding classification results.
Validation site A covers the upper portion of the Indus River, at the border between Khyber Pakhtunkhwa and Punjab province (Figure 5). Our proposed method achieves the best result, with an overall accuracy of 91.1% and Kappa coefficient of 0.893 (Table 1). However, the results obtained for this subarea show the high number of false negatives (14.75%) in VV polarization. This is because, in mountainous areas, geometric distortions, such as foreshortening and layover, are produced by the side-looking geometry of the sensor, meaning that the SAR-derived flood extent is commonly underestimated in these areas. Commission of fragmented snow cover at relatively high altitudes and thin roads as false positive water was also observed in the SAR image. For this area, the method developed by Ohki et al. 2020 has the capability to remove noise that like flood targets in built-up areas since interferometric phase is more sensitive to flooding buildings. There are big differences in the extracted flood area between our algorithm and the other two methods shown in the recent studies, indicating that although these two methods can obtain appropriate potential estimations for the flood-prone areas, then may be not successfully eliminate the inferences from other backgrounds and remain the detailed flood information at the same time. The reason could be that the distribution of flood is fragmented and the validation area is not homogeneous with various land cover types that is largely affected by the speckle noise. On these conditions, the measured interferometric phase are not very reliable. Besides, selection of representative and complete samples, which is the key step for the implementation of bagging ensemble classifier developed by Shahabi et al. 2020, is rather difficult and cannot be fully ensured for training the model.
Validation site B covers part of Punjab province, surrounded by large, bare areas of land (Figure 6). This area suffered from spatially and temporally variable flooding during July 2015 and August 2015. In comparison with the other test regions, it offers the lowest PFP of 2.59% and PFN of 4.62% for the flood area using our proposed method (Table 1). Both the methods used in the recent studies are capable to smooth out noises in the region with simple backgrounds, which makes these methods sufficient to distinguish the flood and non-flood area without excessive noises. However, one drawback of the method shown in Ohki et al. 2020 is that phase statistics are noisier than intensity and coherence, the perpendicular baselines between image pairs and applied filter methods still have great influences on the phase measurements.
Similar situations are also shown in the results of the third area. The third subarea covers the lower portion of the Indus River, which is mostly covered by cropland and grassland (Figure 7). In the left part of this region, false positives shown in the results obtained by our method should not be considered as real errors, because they are directly related to the poor penetration capability of optical sensors. In fact, the actual flood surface under the vegetation was accurately detected by the SAR signal, but was missed in the mapping results derived from the optical images. Some false negatives are caused by wet and flooded muddy soil, which has a high dielectric constant value [49] that increases the SAR intensity, resulting in some misclassifications as non-water. As only local statistics are considered in the study from Ohki et al. 2020, this approach tends to over smooth the mapping results and ignore some details. As a consequence, there are some flood areas undetected along the riverside, corresponding to high false negative (17.69%) in Table 1. Further, there are large areas misclassified as flood area (with the highest PFP of 14.35%) using the machine learning method established by Shahabi et al., 2020. This indicates that in a complex environment and unbalanced sample dataset, the machine learning based algorithm is unfeasible to separate the flood and non-flood pixels accurately. In contrary, our method consider the global statistics and local relationships from the aspects of backscattering properties, terrain and object size, enable to effectively preserve the detailed structures and also remove the noise.

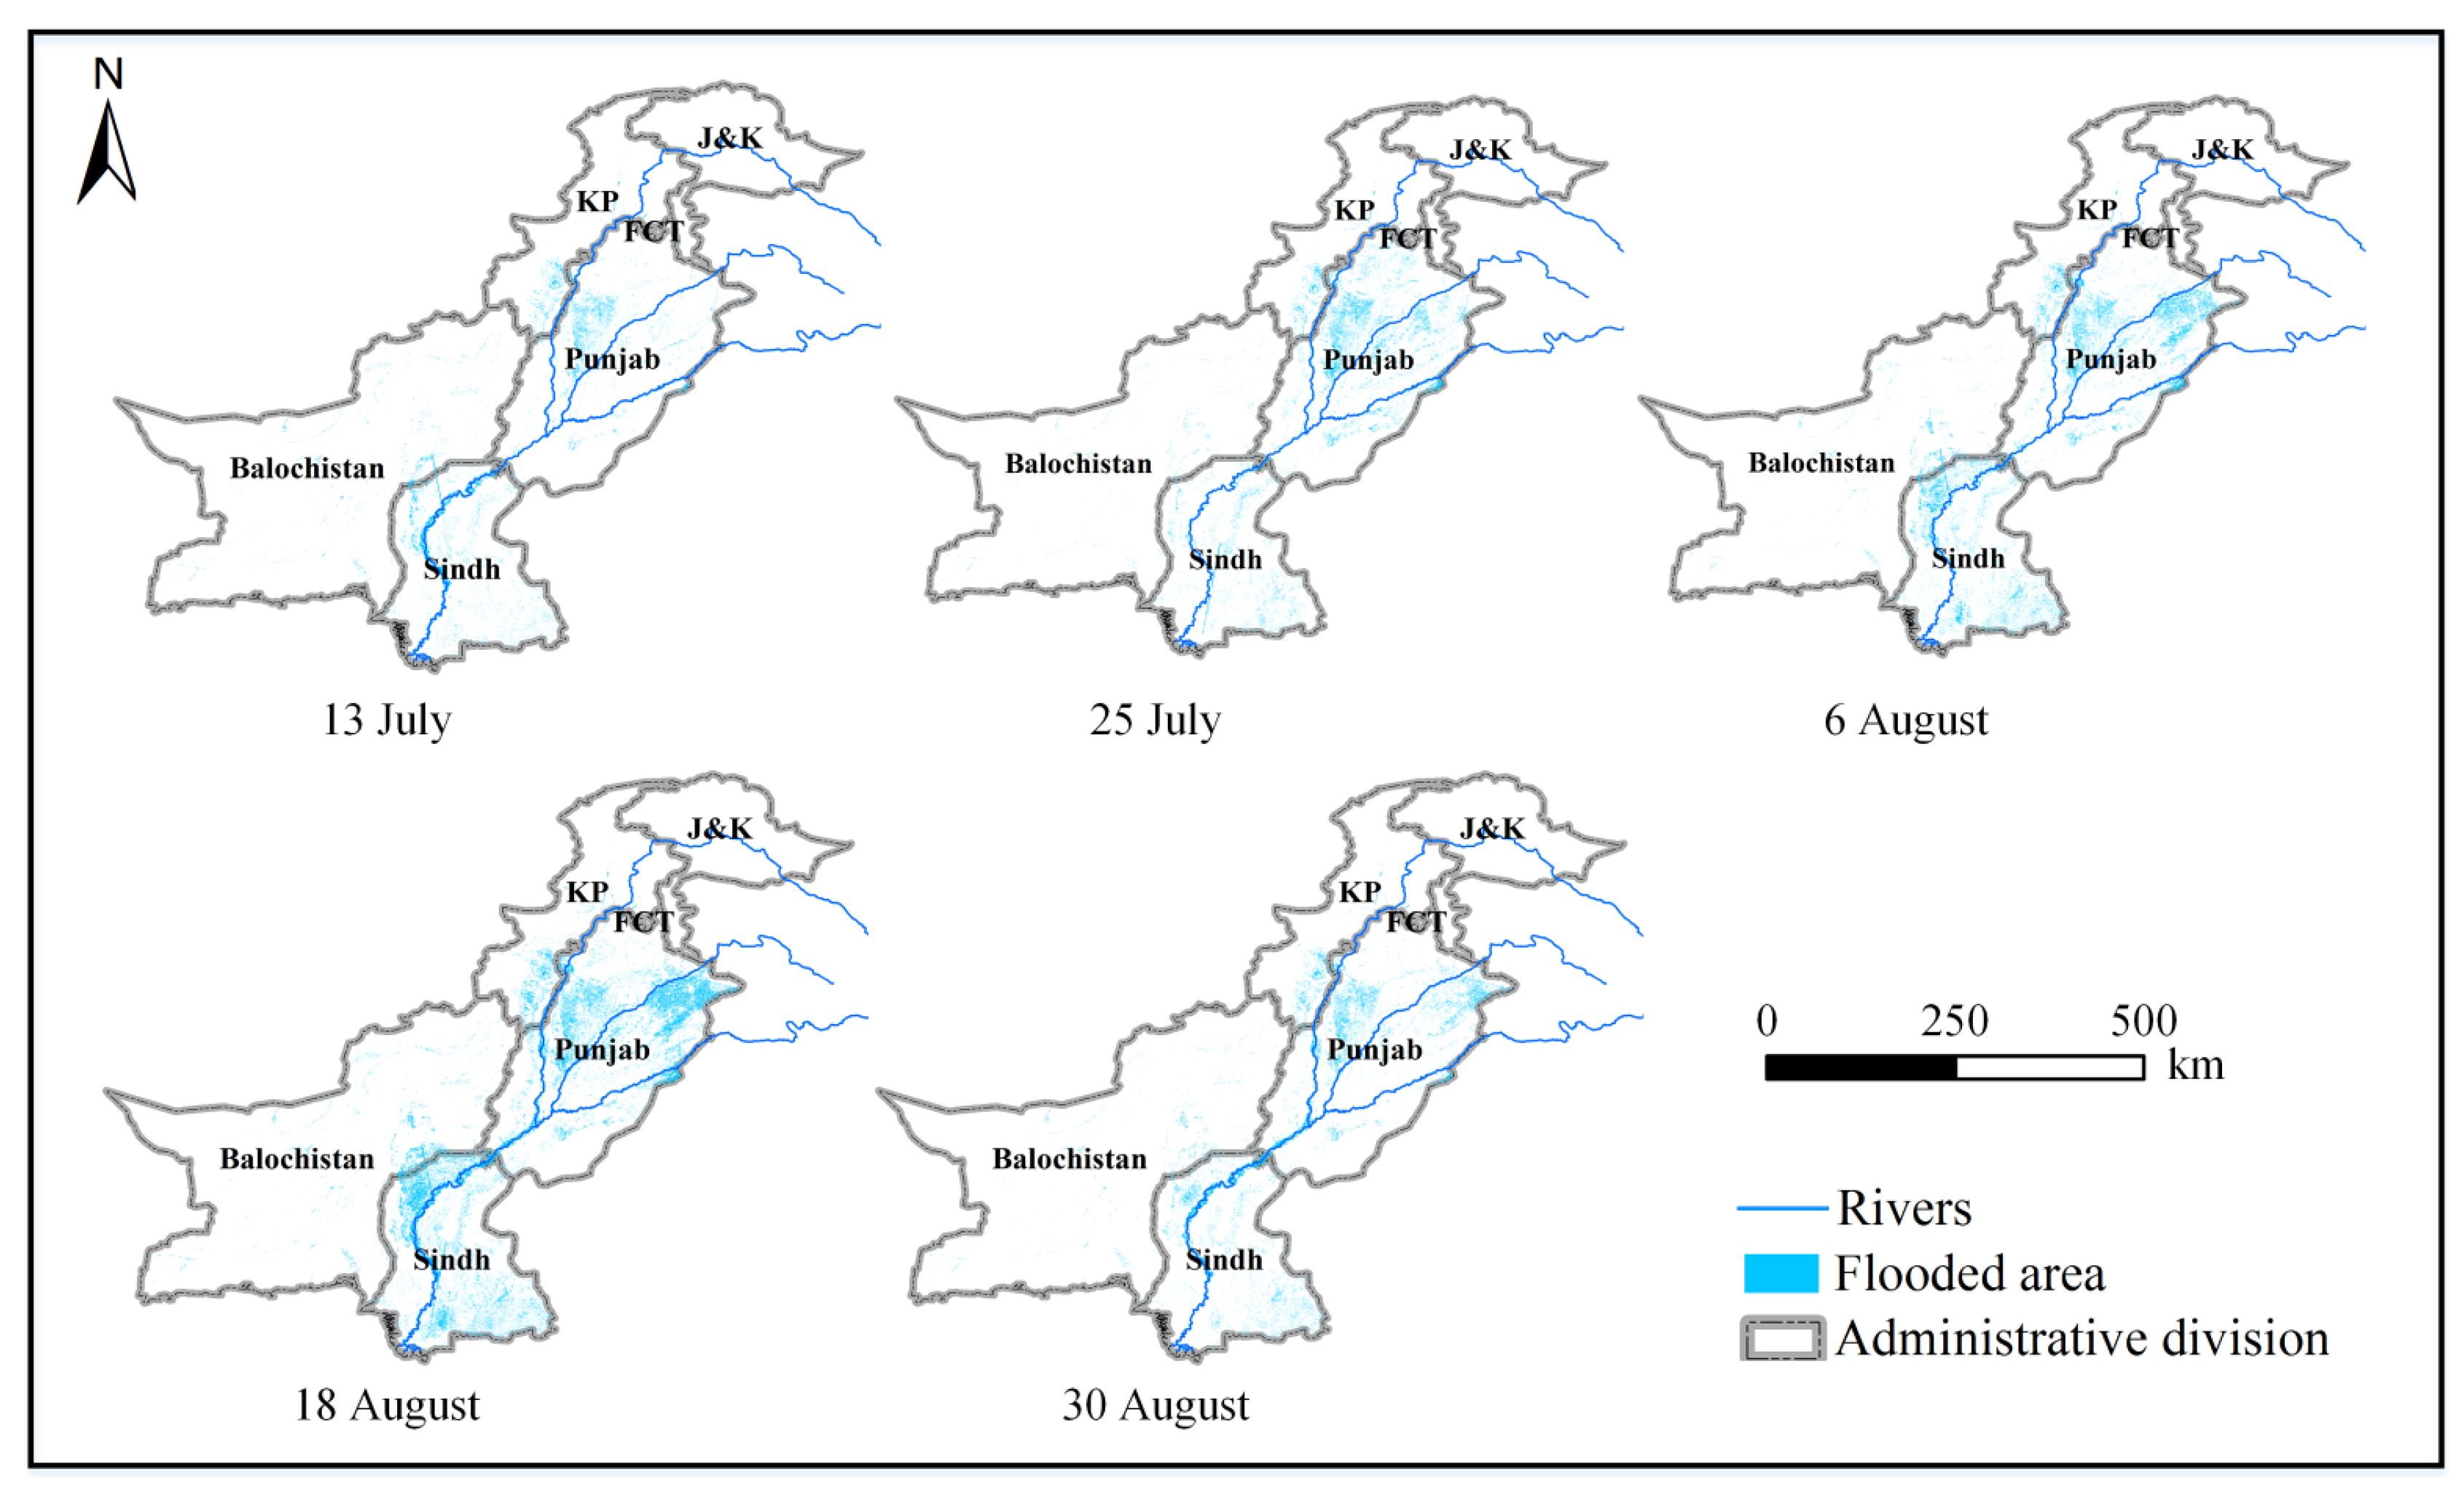
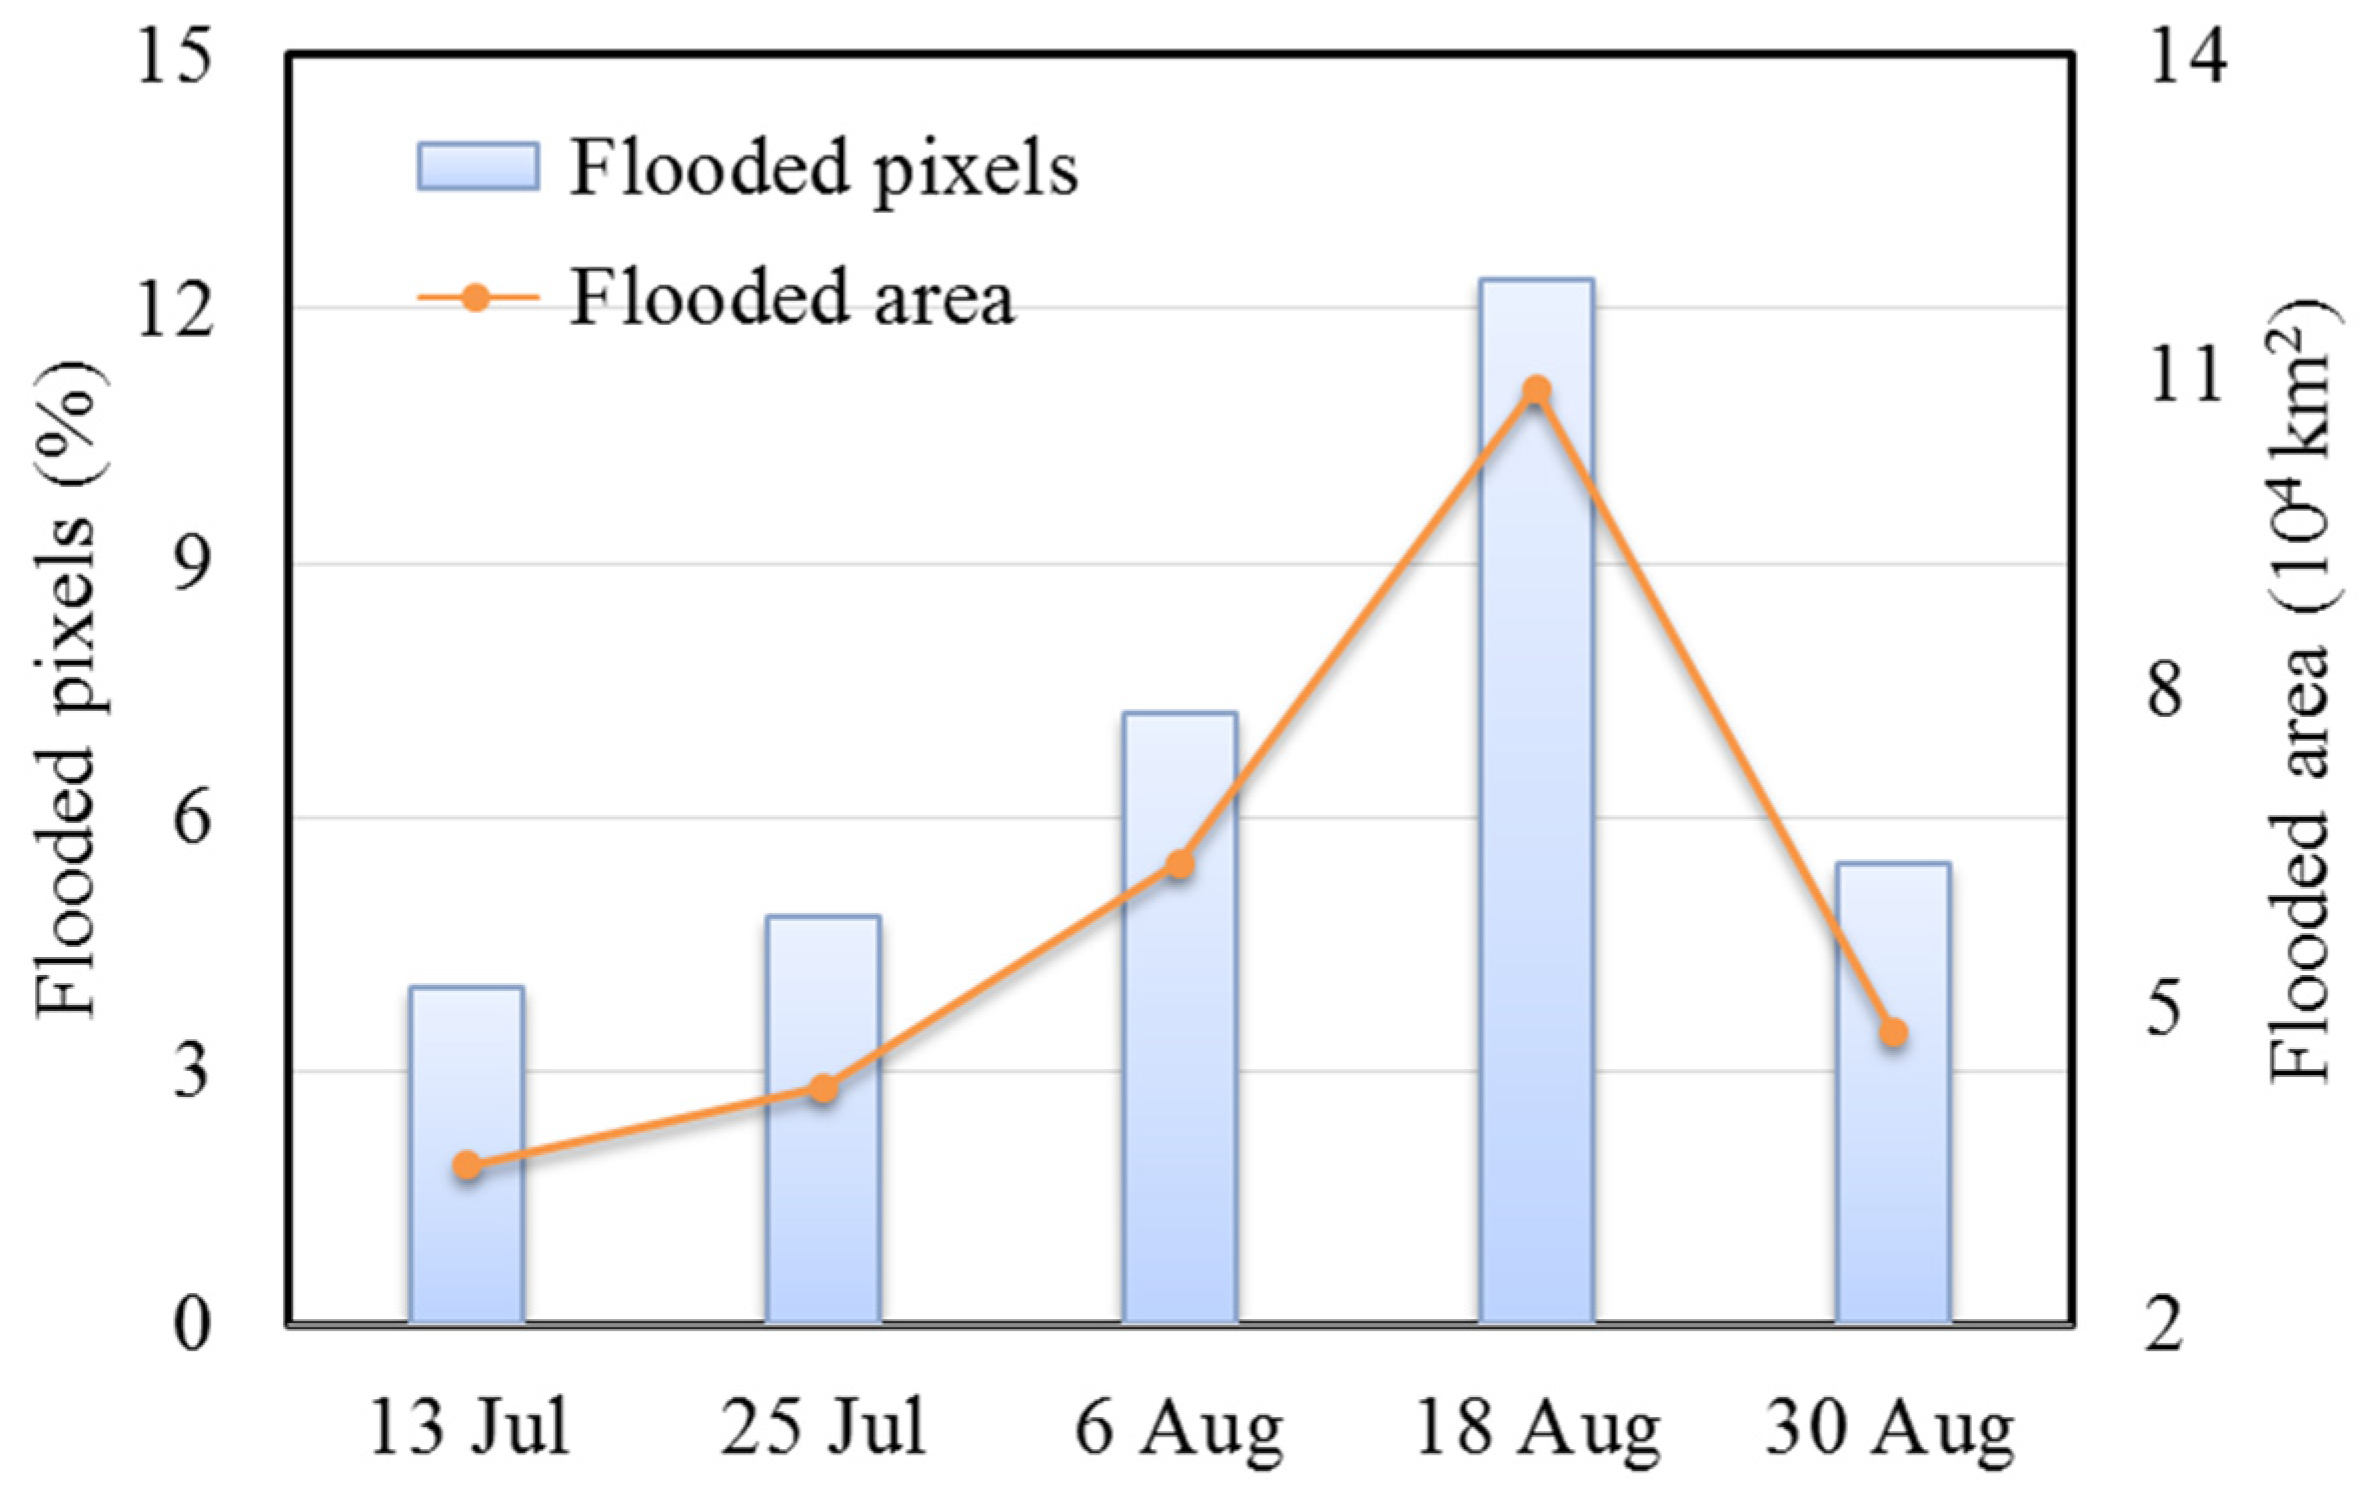
4.2. Flood Extent in Pakistan

A time series of Sentinel-1 images for the 2015 flood season was evaluated to determine the extent of flooding in Pakistan. Figure 8 shows the extent of inundation over time as extracted by the proposed method, as denoted by blue overlaid on the administrative boundaries of Pakistan. Figure 9 illustrates the percentage of flooded pixels and the total area during the flood season in 2015. The entire flood extent increased from 13 July to 18 August, flooding along the drainage network is clearly more extensive than at the previous stage. Flooding in 13 July displays the least amount of flooding (about 3.97% of the total area of the country), had the smallest extent of 35,000 km2, as this is the initiation of flooding in the year of 2015. Due to the influence of the monsoon season, the time to maximum flood extent is rapid in Pakistan. The largest extent of flooding appeared in 18 August (covering ~108,500 km2), occupied an area of about 12.33% of the whole country. These maps dynamically capture the temporal and spatial distribution of the floods. All the maps show flooding mainly occurred in Punjab and Sindh provinces, along the major rivers of the Indus, Chenab, Sutlej, and their deltas. The flood was most densely distributed at the upper reaches of the Indus River confluence. Khyber Pakhtunkhwa province, in the northwest of Pakistan, was also hit by varying degrees of devastation. Besides, flood water spread rapidly near the eastern edge of Punjab province. After mid-August, there is a large reduction in the flooded area, which is quite similar to the flood extent on 25 July, possibly indicating that the flood in 30 August was starting to recede. Based on the above analyses, we can see that widespread and rapid flooding occurred in Pakistan from July 2015, especially in eastern regions, and the flooding disaster was most devastating in mid-August.
The spatial and temporal variations in the extent of floods can be attributed to many factors, such as the precipitation characteristics, topographic conditions, and land cover types, etc. Precipitation play an important role in the formation of floods. In Pakistan, monsoon season arrives in early July, bringing extensive and persistent heavy rainfall. Successive days of rain led to flooding, and continued expansion of inundation area from 13 July to 18 August over the whole region. With the monsoon rainfall gradually weakened at the end of August, the flood began to recede, resulting in the decrease in the flooded area in 30 August. Topographic conditions are critical to the evolution and development of floods during the observation period. Flat terrain is less prone to the drainage of flood water [50], also the flood from river courses transfer easily in space. In the eastern part of Pakistan, the terrain is flat and open along the three major river basins, which provides conditions for the formation of large areas of flooding, the plain topography also controls flow direction of flood water towards eastern edge. Moreover, different land cover types have different capacities for the interception of rainfall. In the delineated flooded areas, the widely distributed cropland and grassland have poor ability to store water, intensifying the rapid expansion of floods in the short term [51]. Forest can contain part of precipitation and thus reduce the risk of floods, but is rarely distributed in the eastern regions.

4.3. Flood Frequency

Figure 10 illustrates the spatial frequency of the flooding. This also indicates the potential extent of flooding and the level of flood risk. From Figure 10, it can be found that red and orange areas flooded more frequently in July–August 2015; these areas are located between the Indus and Chenab rivers, and this result may reflect the certainty of flooding in future flood seasons. The multiple occurrences of flood events in these key areas suggest the presence of high risk and an increased degree of destruction. For these five periods, 7% of flooded pixels have been inundated at least twice and 3% have been flooded at least three times.

4.4. Discussion

The proposed automatic flood mapping process based on Sentinel-1 data significantly enhances the capabilities of flood disaster monitoring. This improvement mainly stems from the combination of PDFs for global thresholding and fuzzy logic-based classification refinement, which automatically initialize the classification and then greatly reduce the number of objects that look like water by integrating elevation, backscattering response, and slope information. In large areas with significant topographical changes, the processing chain of this method substantially increases the classification accuracy.
In the process of establishing flood mapping method, several parameters estimation are included in the different steps to weight the data term, can produce a more robust and fast mapping results. Firstly, the PDF approach is employed to derive the global threshold values based on the statistical distributions of the backscattering coefficients for the samples of water and other background types. The selected samples should comply with the rules that having low standard deviation in their backscattering coefficient values, which can then serve as a criteria to measure the spatial homogeneity and purity of the samples. The PDF based thresholding method was applied for the pixels located in the flood-prone regions that already remove some interferences from other classes, it also fully considered the statistical distributions of the backscattering coefficients, is definitely has less uncertainty and much more reliable than histogram-based thresholding segmentation methods. To ensure the accurate extraction of most of the flood regions and some water bodies with small size or dispersed distribution, based on the probability distribution results, a relatively high global threshold value of −15 dB was set in this study. The selected threshold also consider the rare cases that some small water bodies in the image do not appear as very dark regions with low backscattering response, for example, the rough water surfaces that was produced by the strong winds will have slightly high backscattering values.
Although the presented automatic global thresholding method can reduce the omission errors as much as possible, many objects such as terrain shadows, floodplain and snow cover that has low radar signal return were also retained. This can lead to some false positives that greatly impact the final mapping accuracy. In such cases, a fuzzy logic-based approach was then proposed to improve the accuracy of the detected flood area by removing the misclassified regions that present similar backscattering profiles with water. As one of the elements in the fuzzy system, the fuzzy threshold of backscattering intensity was derived by computing the mean values of the locally derived flood objects to eliminate low backscatter characteristics. Digital elevation, the thresholds of which was derived through statistical computations, was integrated as another fuzzy element to reduce the misclassified areas that has fairly high or low elevation. Finally, to filter out some isolated water areas induced by the inherent speckle noise, two fuzzy thresholds of water sizes (1000 m2 and 5000 m2, respectively) were set empirically for the development of the membership function. Although these two thresholds are determined by subjective experience and have influence on the small area reserved for flooding, which may results in fuzzy estimates for flood mapping to some extent, this uncertainty can be well overcome by a defuzzification step that based on the averaged membership degree for each pixel, for the further refinement of the flooding map.
In this paper, the processing chain has considered VV polarization images rather than VH (i.e., V-polarized wave transmitted returns as H-polarized signal) polarization in Sentinel-1 IW mode to derive information about the 2015 flood extent in Pakistan. This is because, for largely vegetated areas, it is much easier to detect flood water under vegetation using VV polarization images than using VH polarization. The priority of VV polarization in flood monitoring can be explained by the double-bounce effects generated from a water surface and vegetation stalks, and a great percentage of the backscattered waves exhibit preserved polarization [52]. VH polarization is mainly induced by volume scattering from tree crowns [53], it has low penetration depth into tree crowns, and may struggle to reach the water in the subsurface area. Moreover, VH-polarized data exhibits greater backscattering variability in vegetated regions, being high for forest areas but low for farmland compared to VV-polarized data. The strong contrast between forest and farmland areas in VH polarization increases the risk of misclassifying areas as water, and will lead to a high false positive rate for open water [7]. Therefore, the proposed procedure has only used VV-polarized data to detect flooded area. The runtime of the complete workflow is approximately 25 min for a Sentinel-1 GRD scene operated on an Intel Xeon X5670 Central Processing Unit (CPU) with 16 GB Random Access Memory (RAM).
As can be seen in some test areas, snow, smooth man-made surfaces, and radar shadow, which have a low surface roughness and therefore low backscatter characteristics, are often incorrectly classified as water regions [43]. Snow and some manmade surfaces appear dark due to specular reflection, are hardly separated from the surface water of flooded areas. Conversely, the omissions in flood areas are often due to wet flooded soil with enhanced signal returns resulting from an increase in surface roughness and the dielectric constant. Due to the side-looking geometry of the SAR sensor, the flood extent in mountainous regions is also underestimated. Additionally, as artifacts are visible in the SRTM DEM data, noise in the water bodies may result in high slope values within flat regions, which will lead to an increased false negative rate for water. In future research, the global TanDEM-X (TerraSAR-X add-on for DEM) DEM with a spatial resolution of 12 m will be used to replace the SRTM data.
In terms of applicability of the proposed method, since no complicate training and parameter tuning process are required, this method can automatically detect the extent of floods at little computational cost, it is also suitable and feasible for the application in the regions that have similar climates like Pakistan. For the regions that have different climate and environmental backgrounds with Pakistan, which also bring up different vegetation types and topographic conditions, VV-polarized C-band radar may be invalid for the densely vegetated area as volume scattering is the main backscattering component instead of double-bounce. Therefore, SAR images acquired at long wavelengths with horizontal polarization should be used for the detection of hydrological conditions beneath the tall or dense vegetation. For the monitoring the floods occurred in rugged alpine mountainous areas, due to the large effects from the terrain shadows, it is necessary to adopt the low orbit satellite that has ascending and descending passes, and carry out the precise correction of the orbit of the satellite images. Wet snow caused by rising temperature in summer show low backscattering response in the image, can be removed using external auxiliary information such as glacier inventory data and snow cover distribution map. Other low backscatter areas such as irrigation land and wetlands must be excluded for flood mapping with an overlaid updated land classification map. All these influencing factors can be effectively eliminated by modifying partial processing steps, and will not affect the core algorithm and whole technique process of our study. Therefore, in the different environmental and climatic regions, only a little modifications are needed in the preprocessing or other post-processing steps, and core algorithm remains unchanged, which further shows that the method has good applicability and generalization.

5. Conclusions

The devastating flooding in Pakistan in 2015 caused widespread loss of life and livelihood for the surrounding communities. There is a pressing need for flood extent mapping techniques that can be used to process images quickly, providing near real time flooding information to relief agencies. Most of the current flood mapping methods are computationally expensive, have confusing reference image selection processes, and are not intended for large-scale semi-arid regions. This study aimed at bridging these gaps by introducing an automatic flood detection scheme for rapid flood mapping using Sentinel-1 SAR data. As the most critical steps, initialization of the classification through PDF-based global thresholding, as well as classification refinement by using a fuzzy logic-based approach is automatically executed after data pre-processing, significantly improving final classification results. More importantly, the classification can be greatly refined using the fuzzy logic-based algorithm, which involves SAR backscattering, topographic, and other auxiliary information. The potential for erroneous mapping derived from non-water areas, such as radar shadow, snow-covered areas in mountainous terrain, and other smooth surfaces, is hence reduced.
To demonstrate the performance of the proposed method on a large scale and to determine the influence of the fuzzy logic-based step on the final classification results, three validation sites characterized by challenging environmental conditions following a 2015 flood event in Pakistan were examined. GF-2 PMS optical images were used for the accuracy assessment. The results show excellent spatial correlation to the actual flooded areas from optical data, with high overall accuracies from 91.1% to 96.6%, demonstrating the robustness and effectiveness of the proposed method for rapid flood mapping across complex environments.
SAR images from the start of the flood season in July 2015 to the end in August 2015 were used to evaluate the seasonal flood extent over the whole Pakistan. The flooding maps exhibit large variability in both spatial and temporal scales, with the floods mainly occurring along the drainage network and being most extensive at the upper reaches of the Indus River confluence. The mapping results illustrate the increase in the entire flood extent from 13 July into 18 August, and suggest that the maximum extent of flooding was reached on 18 August, 2015. The extent of flooding changed very rapidly, increasing to 12.33% of the whole country and inundating over 108,500 km2 in 36 days. Flooding in the areas between the Indus and Chenab River was found to have the highest frequency of occurrence, and pose considerable risk.
The method presented in this study can extract the flood area from C-band SAR data well and is sufficiently sustainable for the application in other regions. The method also has high sustainability for other multi-temporal satellite SAR imagery, large-area flood mapping under different climatic conditions, and for use with various features. Although intensity data was used in this study, full-polarized features and interferometric coherence can be utilized to derive useful information. Based on the proposed method in this study, because Sentinel-1 and other satellite SAR imagery with high spatial and temporal resolution, such as TerraSAR and GaoFen-3 (GF-3), are being acquired continuously and systematically, time series of flood maps will be generated over other vulnerable flood regions, and serving as a useful monitoring services. Our future work will examine possible climatic, geological drivers, and artificial water control of flood extent changes, explore the response mechanism between these influence factors, so that the occurrence and evolution trend in the short and long term can be predicted. In addition, the application area of proposed method is not limited to flood detection. This study also has an implication for other fields of study to assess spatial patterns of disaster risk, for instance, it can be extended to improve the mapping of landslide susceptibility by incorporating relevant image features.

Author Contributions

Conceptualization, M.Z. and F.C.; methodology, M.Z.; software, D.L.; validation, M.Z., D.L. and B.T.; formal analysis, A.Y.; investigation, M.Z.; resources, F.C.; data curation, D.L.; writing—original draft preparation, M.Z.; writing—review and editing, F.C.; visualization, B.T.; supervision, A.Y.; project administration, M.Z.; funding acquisition, F.C. All authors have read and agreed to the published version of the manuscript.

Funding

This research was funded by the National Key R&D Program of China (Grant No. 2017YFE0100800), the International Partnership Program of the Chinese Academy of Sciences (Grant Nos. 131551KYSB20160002, 131211KYSB20170046), and the National Natural Science Foundation of China (Grant No. 41701481).

Conflicts of Interest

The authors declare no conflict of interest.

References

  1. Martinez, J.M.; Toan, T.L. Mapping of flood dynamics and spatial distribution of vegetation in the amazon floodplain using multitemporal sar data. Remote Sens. Environ. 2007, 108, 209–223. [Google Scholar] [CrossRef]
  2. Landuyt, L.; Van Wesemael, A.; Schumann, G.J.P.; Hostache, R.; Verhoest, N.E.C.; Van Coillie, F.M.B. Flood mapping based on synthetic aperture radar: An assessment of established approaches. IEEE Trans. Geosci. Remote Sens. 2019, 57, 722–739. [Google Scholar] [CrossRef]
  3. Dumitru, C.O.; Cui, S.; Faur, D.; Datcu, M. Data analytics for rapid mapping: Case study of a flooding event in germany and the tsunami in japan using very high resolution sar images. IEEE J. Sel. Top. Appl. Earth Obs. Remote Sens. 2015, 8, 114–129. [Google Scholar] [CrossRef]
  4. García-Pintado, J.; Mason, D.C.; Dance, S.L.; Cloke, H.L.; Neal, J.C.; Freer, J.; Bates, P.D. Satellite-supported flood forecasting in river networks: A real case study. J. Hydrol. 2015, 523, 706–724. [Google Scholar] [CrossRef] [Green Version]
  5. Klemas, V. Remote sensing of floods and flood-prone areas: An overview. J. Coast. Res. 2015, 31, 1005–1013. [Google Scholar] [CrossRef]
  6. Li, Y.; Martinis, S.; Plank, S.; Ludwig, R. An automatic change detection approach for rapid flood mapping in sentinel-1 sar data. Int. J. Appl. Earth Obs. Geoinf. 2018, 73, 123–135. [Google Scholar] [CrossRef]
  7. Twele, A.; Cao, W.; Plank, S.; Martinis, S. Sentinel-1-based flood mapping: A fully automated processing chain. Int. J. Remote Sens. 2016, 37, 2990–3004. [Google Scholar] [CrossRef]
  8. Long, S.; Fatoyinbo, T.E.; Policelli, F. Flood extent mapping for namibia using change detection and thresholding with sar. Environ. Res. Lett. 2014, 9, 035002. [Google Scholar] [CrossRef]
  9. Townsend, P.A.; Walsh, S.J. Modeling floodplain inundation using an integrated gis with radar and optical remote sensing. Geomorphology 1998, 21, 295–312. [Google Scholar] [CrossRef]
  10. Pricope, N.G. Variable-source flood pulsing in a semi-arid transboundary watershed: The chobe river, botswana and namibia. Environ. Monit. Assess. 2013, 185, 1883–1906. [Google Scholar] [CrossRef]
  11. Hess, L.L.; Melack, J.M.; Simonett, D.S. Radar detection of flooding beneath the forest canopy—A review. Int. J. Remote Sens. 1990, 11, 1313–1325. [Google Scholar] [CrossRef]
  12. Mason, D.C.; Davenport, I.J.; Neal, J.C.; Schumann, G.J.-P.; Bates, P.D. Near real-time flood detection in urban and rural areas using high-resolution synthetic aperture radar images. IEEE Trans. Geosci. Remote Sens. 2012, 50, 3041–3052. [Google Scholar] [CrossRef] [Green Version]
  13. Inglada, J.; Mercier, G. A new statistical similarity measure for change detection in multitemporal sar images and its extension to multiscale change analysis. IEEE Trans. Geosci. Remote Sens. 2007, 45, 1432–1445. [Google Scholar] [CrossRef] [Green Version]
  14. Martinis, S.; Twele, A.; Voigt, S. Towards operational near real-time flood detection using a split-based automatic thresholding procedure on high resolution terrasar-x data. Nat. Hazards Earth Syst. Sci. 2009, 9, 303–314. [Google Scholar] [CrossRef]
  15. Horritt, M.S.; Mason, D.C.; Luckman, A.J. Flood boundary delineation from synthetic aperture radar imagery using a statistical active contour model. Int. J. Remote Sens. 2001, 22, 2489–2507. [Google Scholar] [CrossRef]
  16. Pradhan, B.; Tehrany, M.S.; Jebur, M.N. A new semiautomated detection mapping of flood extent from terrasar-x satellite image using rule-based classification and taguchi optimization techniques. IEEE Trans. Geosci. Remote Sens. 2016, 54, 4331–4342. [Google Scholar] [CrossRef]
  17. D’Addabbo, A.; Refice, A.; Pasquariello, G.; Lovergine, F.P.; Capolongo, D.; Manfreda, S. A bayesian network for flood detection combining sar imagery and ancillary data. IEEE Trans. Geosci. Remote Sens. 2016, 54, 3612–3625. [Google Scholar] [CrossRef]
  18. Amitrano, D.; Martino, G.D.; Iodice, A.; Riccio, D.; Ruello, G. Unsupervised rapid flood mapping using sentinel-1 grd sar images. IEEE Trans. Geosci. Remote Sens. 2018, 56, 3290–3299. [Google Scholar] [CrossRef]
  19. Wang, N.; Chen, F.; Yu, B.; Qin, Y. Segmentation of large-scale remotely sensed images on a spark platform: A strategy for handling massive image tiles with the mapreduce model. ISPRS J. Photogramm. Remote Sens. 2020, 162, 137–147. [Google Scholar] [CrossRef]
  20. Yu, B.; Yang, L.; Chen, F. Semantic segmentation for high spatial resolution remote sensing images based on convolution neural network and pyramid pooling module. IEEE J. Sel. Top. Appl. Earth Obs. Remote Sens. 2018, 11, 3252–3261. [Google Scholar] [CrossRef]
  21. Chen, F.; Zhang, M.; Tian, B.; Li, Z. Extraction of glacial lake outlines in tibet plateau using landsat 8 imagery and google earth engine. IEEE J. Sel. Top. Appl. Earth Obs. Remote Sens. 2017, 10, 4002–4009. [Google Scholar] [CrossRef]
  22. Zhang, J.; Li, Z.; Wang, X.; Lei, X.; Liu, P.; Feng, M.; Khu, S.-T.; Wang, H. A novel method for deriving reservoir operating rules based on flood classification-aggregation-decomposition. J. Hydrol. 2019, 568, 722–734. [Google Scholar] [CrossRef]
  23. Li, Y.; Martinis, S.; Wieland, M.; Schlaffer, S.; Natsuaki, R. Urban flood mapping using sar intensity and interferometric coherence via bayesian network fusion. Remote Sens. 2019, 11, 2231. [Google Scholar] [CrossRef] [Green Version]
  24. Zhao, M.; Ling, Q.; Li, F. An iterative feedback-based change detection algorithm for flood mapping in sar images. IEEE Geoence Remote Sens. Lett. 2019, 16, 231–235. [Google Scholar] [CrossRef]
  25. Cook, A.; Merwade, V. Effect of topographic data, geometric configuration and modeling approach on flood inundation mapping. J. Hydrol. 2009, 377, 131–142. [Google Scholar] [CrossRef]
  26. Clement, M.A.; Kilsby, C.G.; Moore, P. Multi-temporal sar flood mapping using change detection. J. Flood Risk Manag. 2018, 11, 152–168. [Google Scholar] [CrossRef]
  27. Gan, T.Y.; Zunic, F.; Kuo, C.-C.; Strobl, T. Flood mapping of danube river at romania using single and multi-date ers2-sar images. Int. J. Appl. Earth Obs. Geoinf. 2012, 18, 69–81. [Google Scholar] [CrossRef]
  28. Martinis, S.; Rieke, C. Backscatter analysis using multi-temporal and multi-frequency sar data in the context of flood mapping at river saale, germany. Remote Sens. 2015, 7, 7732–7752. [Google Scholar] [CrossRef] [Green Version]
  29. Stevens, M.R.; Hanschka, S. Municipal flood hazard mapping: The case of british columbia, canada. Nat. Hazards 2014, 73, 907–932. [Google Scholar] [CrossRef]
  30. Miyoun, J.; Peyré, G.; Cohen, L.D. Non-local active contours. Siam J. Imaging Sci. 2012, 5, 1022–1054. [Google Scholar]
  31. Aubert, G.; Barlaud, M.; Faugeras, O.; Jehan-Besson, S. Image segmentation using active contours: Calculus of variations or shape gradients? Siam J. Appl. Math. 2003, 63, 2128–2154. [Google Scholar] [CrossRef] [Green Version]
  32. Iqbal, N.; Hossain, F.; Lee, H.; Akhter, G. Satellite gravimetric estimation of groundwater storage variations over indus basin in pakistan. IEEE J. Sel. Top. Appl. Earth Obs. Remote Sens. 2016, 9, 3524–3534. [Google Scholar] [CrossRef]
  33. Sankaya, M.A.; Bishop, M.P.; Shroder, J.F.; Ali, G. Remote-sensing assessment of glacier fluctuations in the hindu raj, pakistan. Int. J. Remote Sens. 2013, 34, 3968–3985. [Google Scholar]
  34. Rowan, L.C.; Schmidt, R.G.; Mars, J.C. Distribution of hydrothermally altered rocks in the reko diq, pakistan mineralized area based on spectral analysis of aster data. Remote Sens. Environ. 2006, 104, 74–87. [Google Scholar] [CrossRef]
  35. Khan, S.I.; Hong, Y.; Gourley, J.J.; Khattak, M.U.; De Groeve, T. Multi-sensor imaging and space-ground cross-validation for 2010 flood along indus river, pakistan. Remote Sens. 2014, 6, 2393–2407. [Google Scholar] [CrossRef] [Green Version]
  36. McFeeters, S.K. The use of the normalized difference water index (ndwi) in the delineation of open water features. Int. J. Remote Sens. 1996, 17, 1425–1432. [Google Scholar] [CrossRef]
  37. Schreier, G. Sar geocoding: Data and systems. Karlsruhe Wichmann 1993. [Google Scholar]
  38. Wu, S.; Liu, R.; Yommy, A.S. Sar image despeckling using refined lee filter. In Proceedings of the 2015 7th International Conference on Intelligent Human-Machine Systems and Cybernetics (IHMSC), Hangzhou, China, 26–27 August 2015. [Google Scholar]
  39. Jafarzadegan, K.; Merwade, V. A dem-based approach for large-scale floodplain mapping in ungauged watersheds. J. Hydrol. 2017, 550, 650–662. [Google Scholar] [CrossRef]
  40. Zhang, M.; Li, Z.; Tian, B.; Zhou, J.; Zeng, J. A method for monitoring hydrological conditions beneath herbaceous wetlands using multi-temporal alos palsar coherence data. Remote Sens. Lett. 2015, 6, 618–627. [Google Scholar] [CrossRef]
  41. Touzi, R.; Lopes, A. Statistics of the stokes parameters and of the complex coherence parameters in one-look and multilook speckle fields. IEEE Trans. Geosci. Remote Sens. 1996, 34, 519–531. [Google Scholar] [CrossRef]
  42. Martinis, S.; Twele, A. A hierarchical spatio-temporal markov model for improved flood mapping using multi-temporal x-band sar data. Remote Sens. 2010, 2, 2240–2258. [Google Scholar] [CrossRef] [Green Version]
  43. Martinis, S.; Kersten, J.; Twele, A. A fully automated terrasar-x based flood service. ISPRS J. Photogramm. Remote Sens. 2015, 104, 203–212. [Google Scholar] [CrossRef]
  44. Pulvirenti, L.; Pierdicca, N.; Chini, M.; Guerriero, L. An algorithm for operational flood mapping from synthetic aperture radar (sar) data using fuzzy logic. Nat. Hazards Earth Syst. Sci. 2011, 11. [Google Scholar] [CrossRef] [Green Version]
  45. Jain, M.; Dimri, A.P. Efficacy of filtering techniques in improving landsat slc-off thermal infrared data. IEEE J. Sel. Top. Appl. Earth Obs. Remote Sens. 2018, 11, 271–284. [Google Scholar] [CrossRef]
  46. Zhang, M.; Chen, F.; Tian, B. Glacial lake detection from gaofen-2 multispectral imagery using an integrated nonlocal active contour approach: A case study of the altai mountains, northern xinjiang province. Water 2018, 10, 455. [Google Scholar] [CrossRef] [Green Version]
  47. Ohki, M.; Tadono, T.; Itoh, T.; Ishii, K.; Yamanokuchi, T.; Shimada, M. Flood detection in built-up areas using interferometric phase statistics of palsar-2 data. IEEE Geosci. Remote Sens. Lett. 2020, 1–5. [Google Scholar] [CrossRef]
  48. Shahabi, H.; Shirzadi, A.; Ghaderi, K.; Omidvar, E.; Al-Ansari, N.; Clague, J.J.; Geertsema, M.; Khosravi, K.; Amini, A.; Bahrami, S.; et al. Flood detection and susceptibility mapping using sentinel-1 remote sensing data and a machine learning approach. Remote Sens. 2020, 12, 266. [Google Scholar] [CrossRef] [Green Version]
  49. Mohammadimanesh, F.; Salehi, B.; Mahdianpari, M.; Brisco, B.; Motagh, M. Multi-temporal, multi-frequency, and multi-polarization coherence and sar backscatter analysis of wetlands. ISPRS J. Photogramm. Remote Sens. 2018, 142, 78–93. [Google Scholar] [CrossRef]
  50. Uddin, K.; Matin, M.A.; Meyer, F.J. Operational flood mapping using multi-temporal sentinel-1 sar images: A case study from bangladesh. Remote Sens. 2019, 11, 1581. [Google Scholar] [CrossRef] [Green Version]
  51. Martinis, S.; Plank, S.; Ćwik, K. The use of sentinel-1 time-series data to improve flood monitoring in arid areas. Remote Sens. 2018, 10, 583. [Google Scholar] [CrossRef] [Green Version]
  52. Zhang, M.; Li, Z.; Tian, B.; Zhou, J.; Tang, P. The backscattering characteristics of wetland vegetation and water-level changes detection using multi-mode sar: A case study. Int. J. Appl. Earth Obs. Geoinf. 2016, 45, 1–13. [Google Scholar] [CrossRef]
  53. Touzi, R.; Deschamps, A.; Rother, G. Phase of target scattering for wetland characterization using polarimetric c-band sar. IEEE Trans. Geosci. Remote Sens. 2009, 47, 3241–3261. [Google Scholar] [CrossRef]
Figure 1. Map of the study area with frames of Sentinel-1 images for 2015. The green, magenta, and yellow rectangles indicate the locations of the three validation sites.
Sustainability 12 05784 g001
Figure 2. Flowchart of the proposed method for flood detection in Pakistan.
Sustainability 12 05784 g002
Figure 3. Example showing preprocessed Sentinel-1 Synthetic Aperture Radar (SAR) images taken (a) before the flood and (b) after the flood. The dark portions of the image represent flat water surfaces. (c) Corresponding optical GF-2 PMS images acquired after the flood.
Sustainability 12 05784 g003
Figure 4. Estimated probability density function (PDF) together with histograms of the backscattering coefficient showing the flooding and non-flooding ranges. The bars correspond to the histograms and the curves are the PDFs.
Sustainability 12 05784 g004
Figure 5. Results for validation site A. (a) GF-2 PMS scene acquired 14 July, 2015, band combination 3-2-1 (natural color). Overlay: reference water mask. (b) Sentinel-1 scene acquired 13 July, 2015, in VV polarization. The final flood areas are extracted from the SAR image using the method developed by (c) Ohki et al., 2020, (d) Shahabi et al., 2020, and (e) our study. See Figure 1 for the location of the validation site.
Sustainability 12 05784 g005
Figure 6. Results for validation site B. (a) GF-2 PMS scene acquired 20 July, 2015, band combination 3-2-1 (natural color). Overlay: reference water mask. (b) Sentinel-1 scene acquired 18 July, 2015, in VV polarization. The final flood areas are extracted from the SAR image using the method developed by (c) Ohki et al., 2020, (d) Shahabi et al., 2020, and (e) our study. See Figure 1 for the location of the validation site.
Sustainability 12 05784 g006
Figure 7. Results for validation site C. (a) GF-2 PMS scene acquired 27 July, 2015, band combination 3-2-1 (natural color). Overlay: reference water mask. (b) Sentinel-1 scene acquired 25 July, 2015 in VV polarization. The final flood areas are extracted from the SAR image using the method developed by (c) Ohki et al., 2020, (d) Shahabi et al., 2020, and (e) our study. See Figure 1 for the location of the validation site.
Sustainability 12 05784 g007
Figure 8. Flood extent maps from July to August in 2015 for the whole Pakistan overlaid on administrative boundaries. J&K represents Jammu & Kashmir, KP represents Khyber Pakhtunkhwa, and FCT represents Federal Capital Territory.
Sustainability 12 05784 g008
Figure 9. Percentage of flooded pixels and flooded area during the flood season in 2015.
Sustainability 12 05784 g009
Figure 10. Frequency of flooding for the five periods in the 2015 flood season.
Sustainability 12 05784 g010
Table 1. Quantitative comparisons and accuracy assessments for the three validation sites, PFP and PFN refer to the probabilities of false positives and false negatives, respectively.
Validation SiteMethodPFP (%)PFN (%)F-Measure (%) KappaOverall Accuracy (%)
AProposed method4.1214.7590.250.89391.1
Ohki et al., 202010.9519.6884.460.82683.5
Shahabi et al., 202012.4625.4780.510.79578.4
BProposed method2.594.6296.380.95496.6
Ohki et al., 20206.8310.9791.050.89589.4
Shahabi et al., 20205.9612.2990.760.87388.1
CProposed method4.0310.8992.410.91893.4
Ohki et al., 20205.2117.6988.110.84187.6
Shahabi et al., 202014.3513.8485.900.83785.4

