Environmental Life Cycle Assessment of Rapeseed and Rapeseed Oil Produced in Northern Europe: A Latvian Case Study


Abstract
1. Introduction
2. Materials and Methods
2.1. Goal and Scope Definition
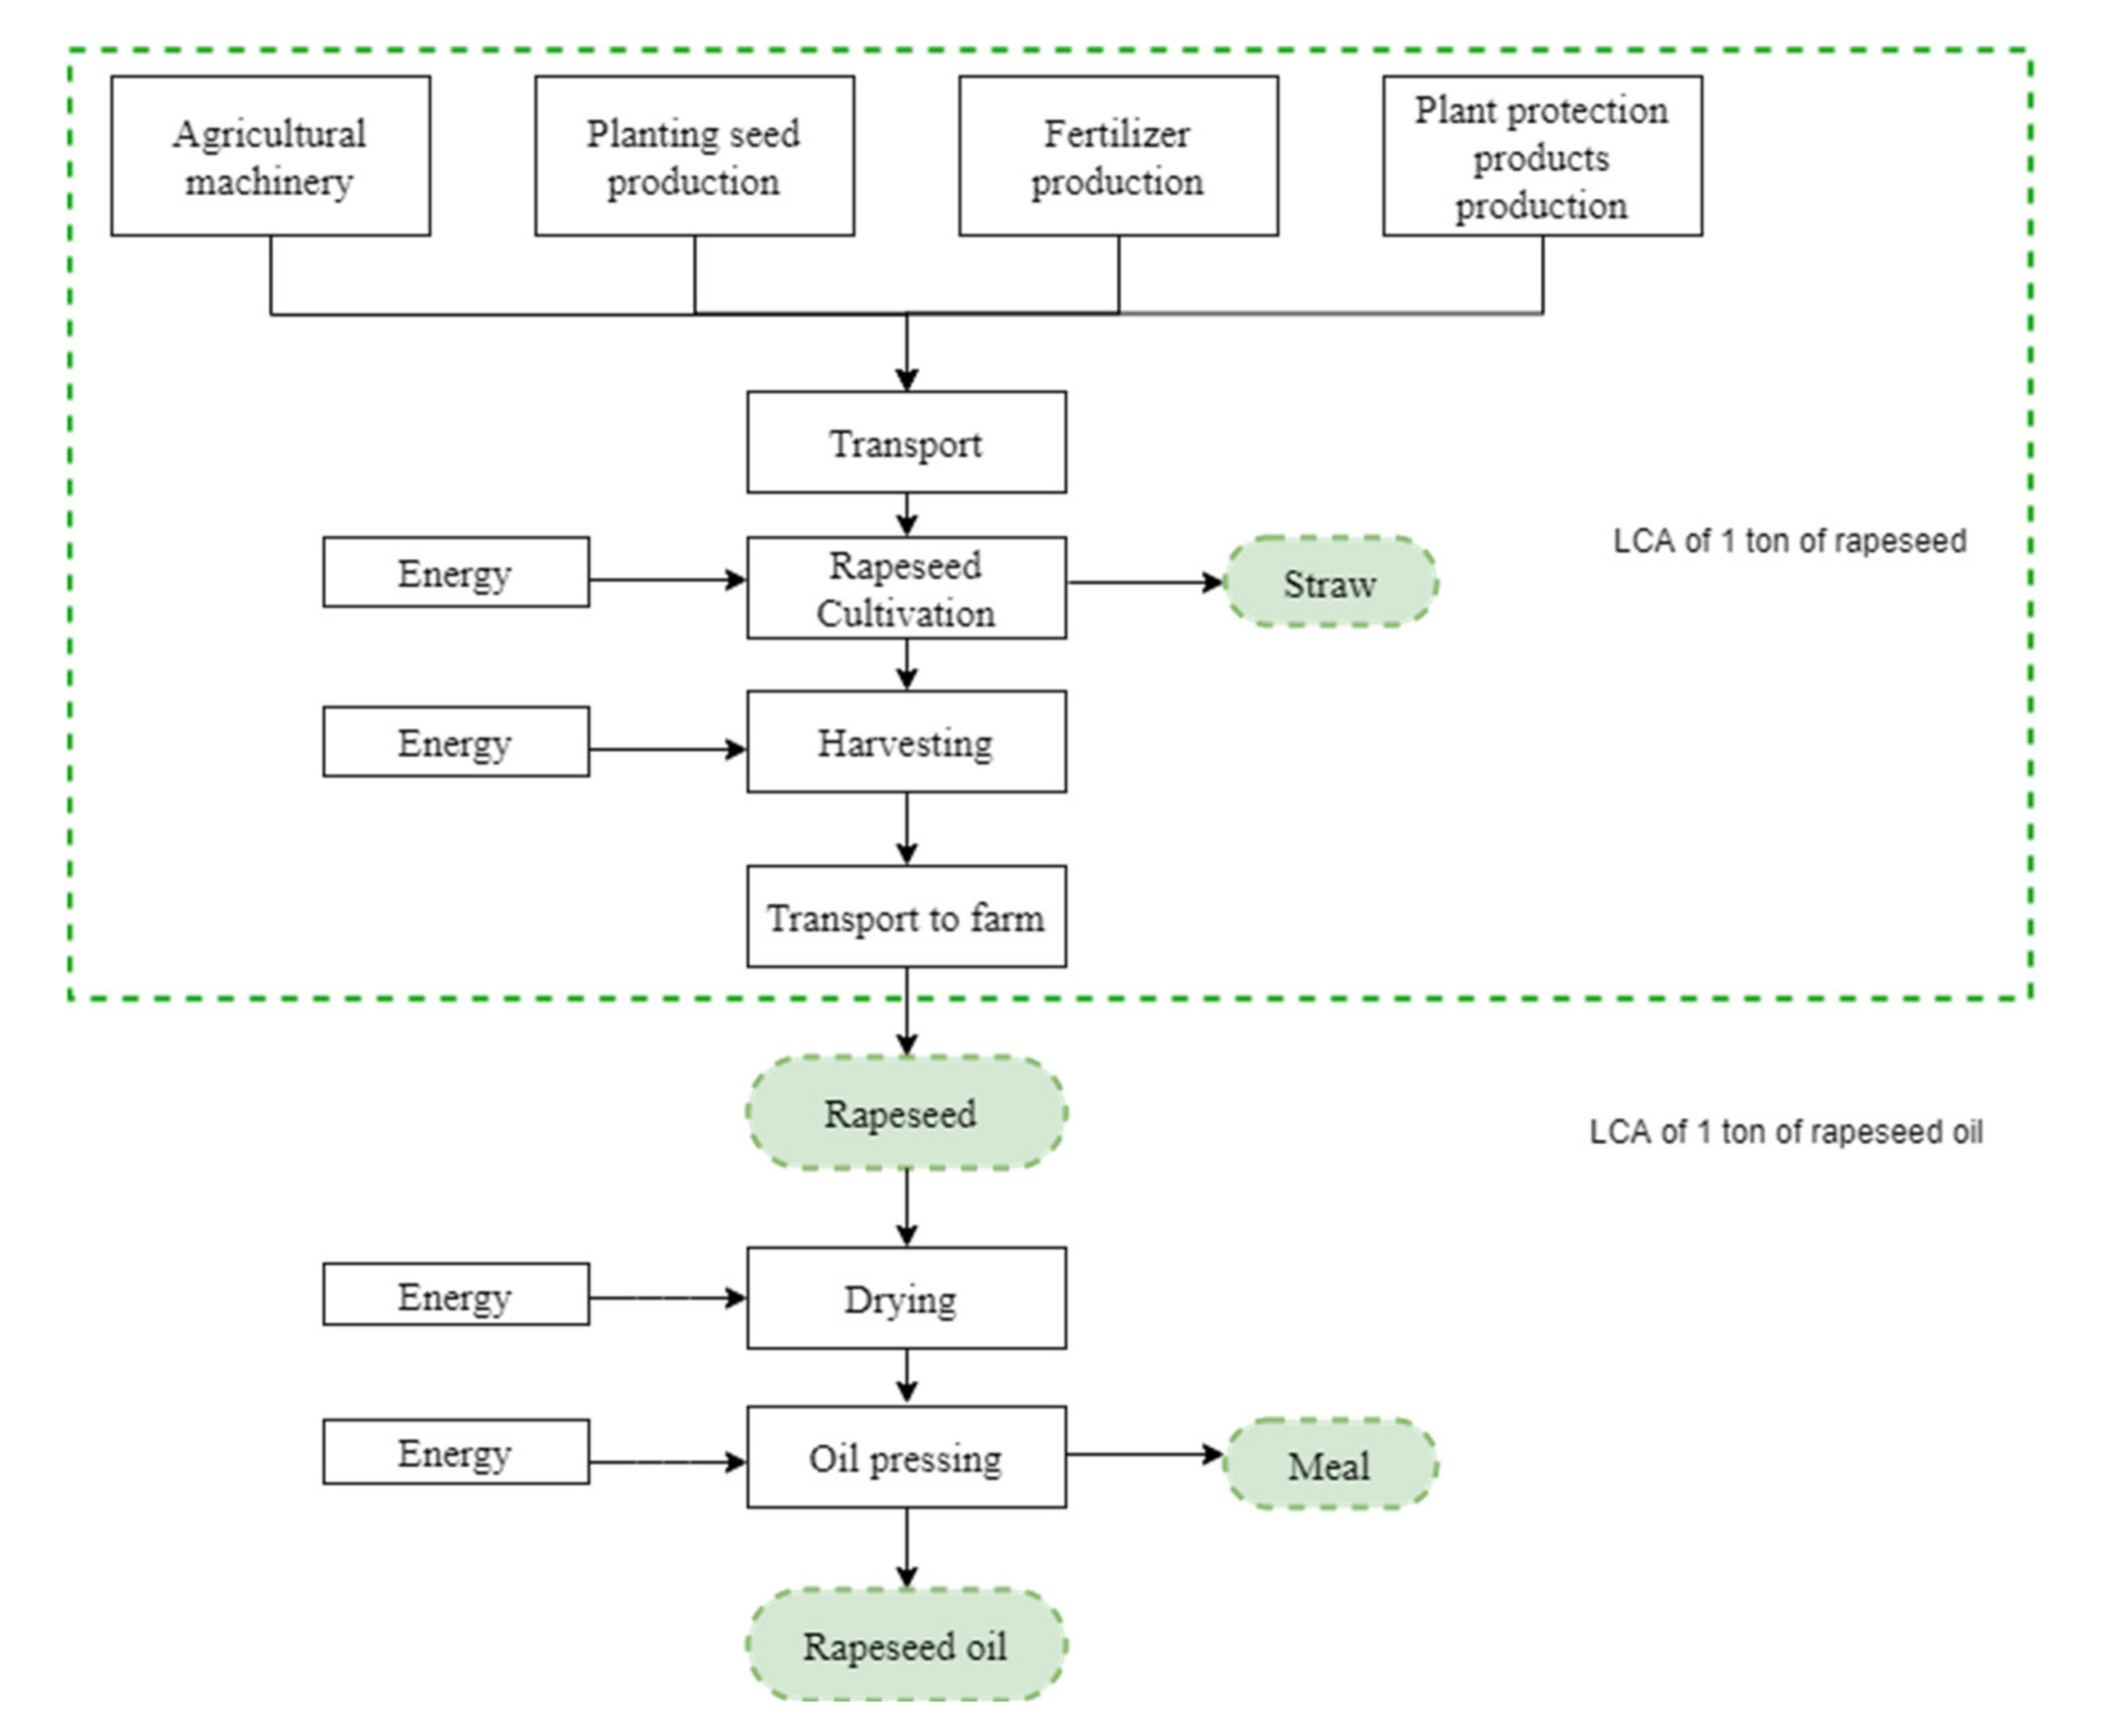
2.2. Functional Unit and System Boundary
2.3. Quality of Data
2.4. Life Cycle Inventory Data
2.4.1. Rapeseed Cultivation and Drying
2.4.2. Rapeseed Oil Production
2.4.3. Allocation Procedure for Oil Mill Stage
3. Results and Discussion
3.1. Life Cycle Impact Assessment of Rapeseed Oil Production
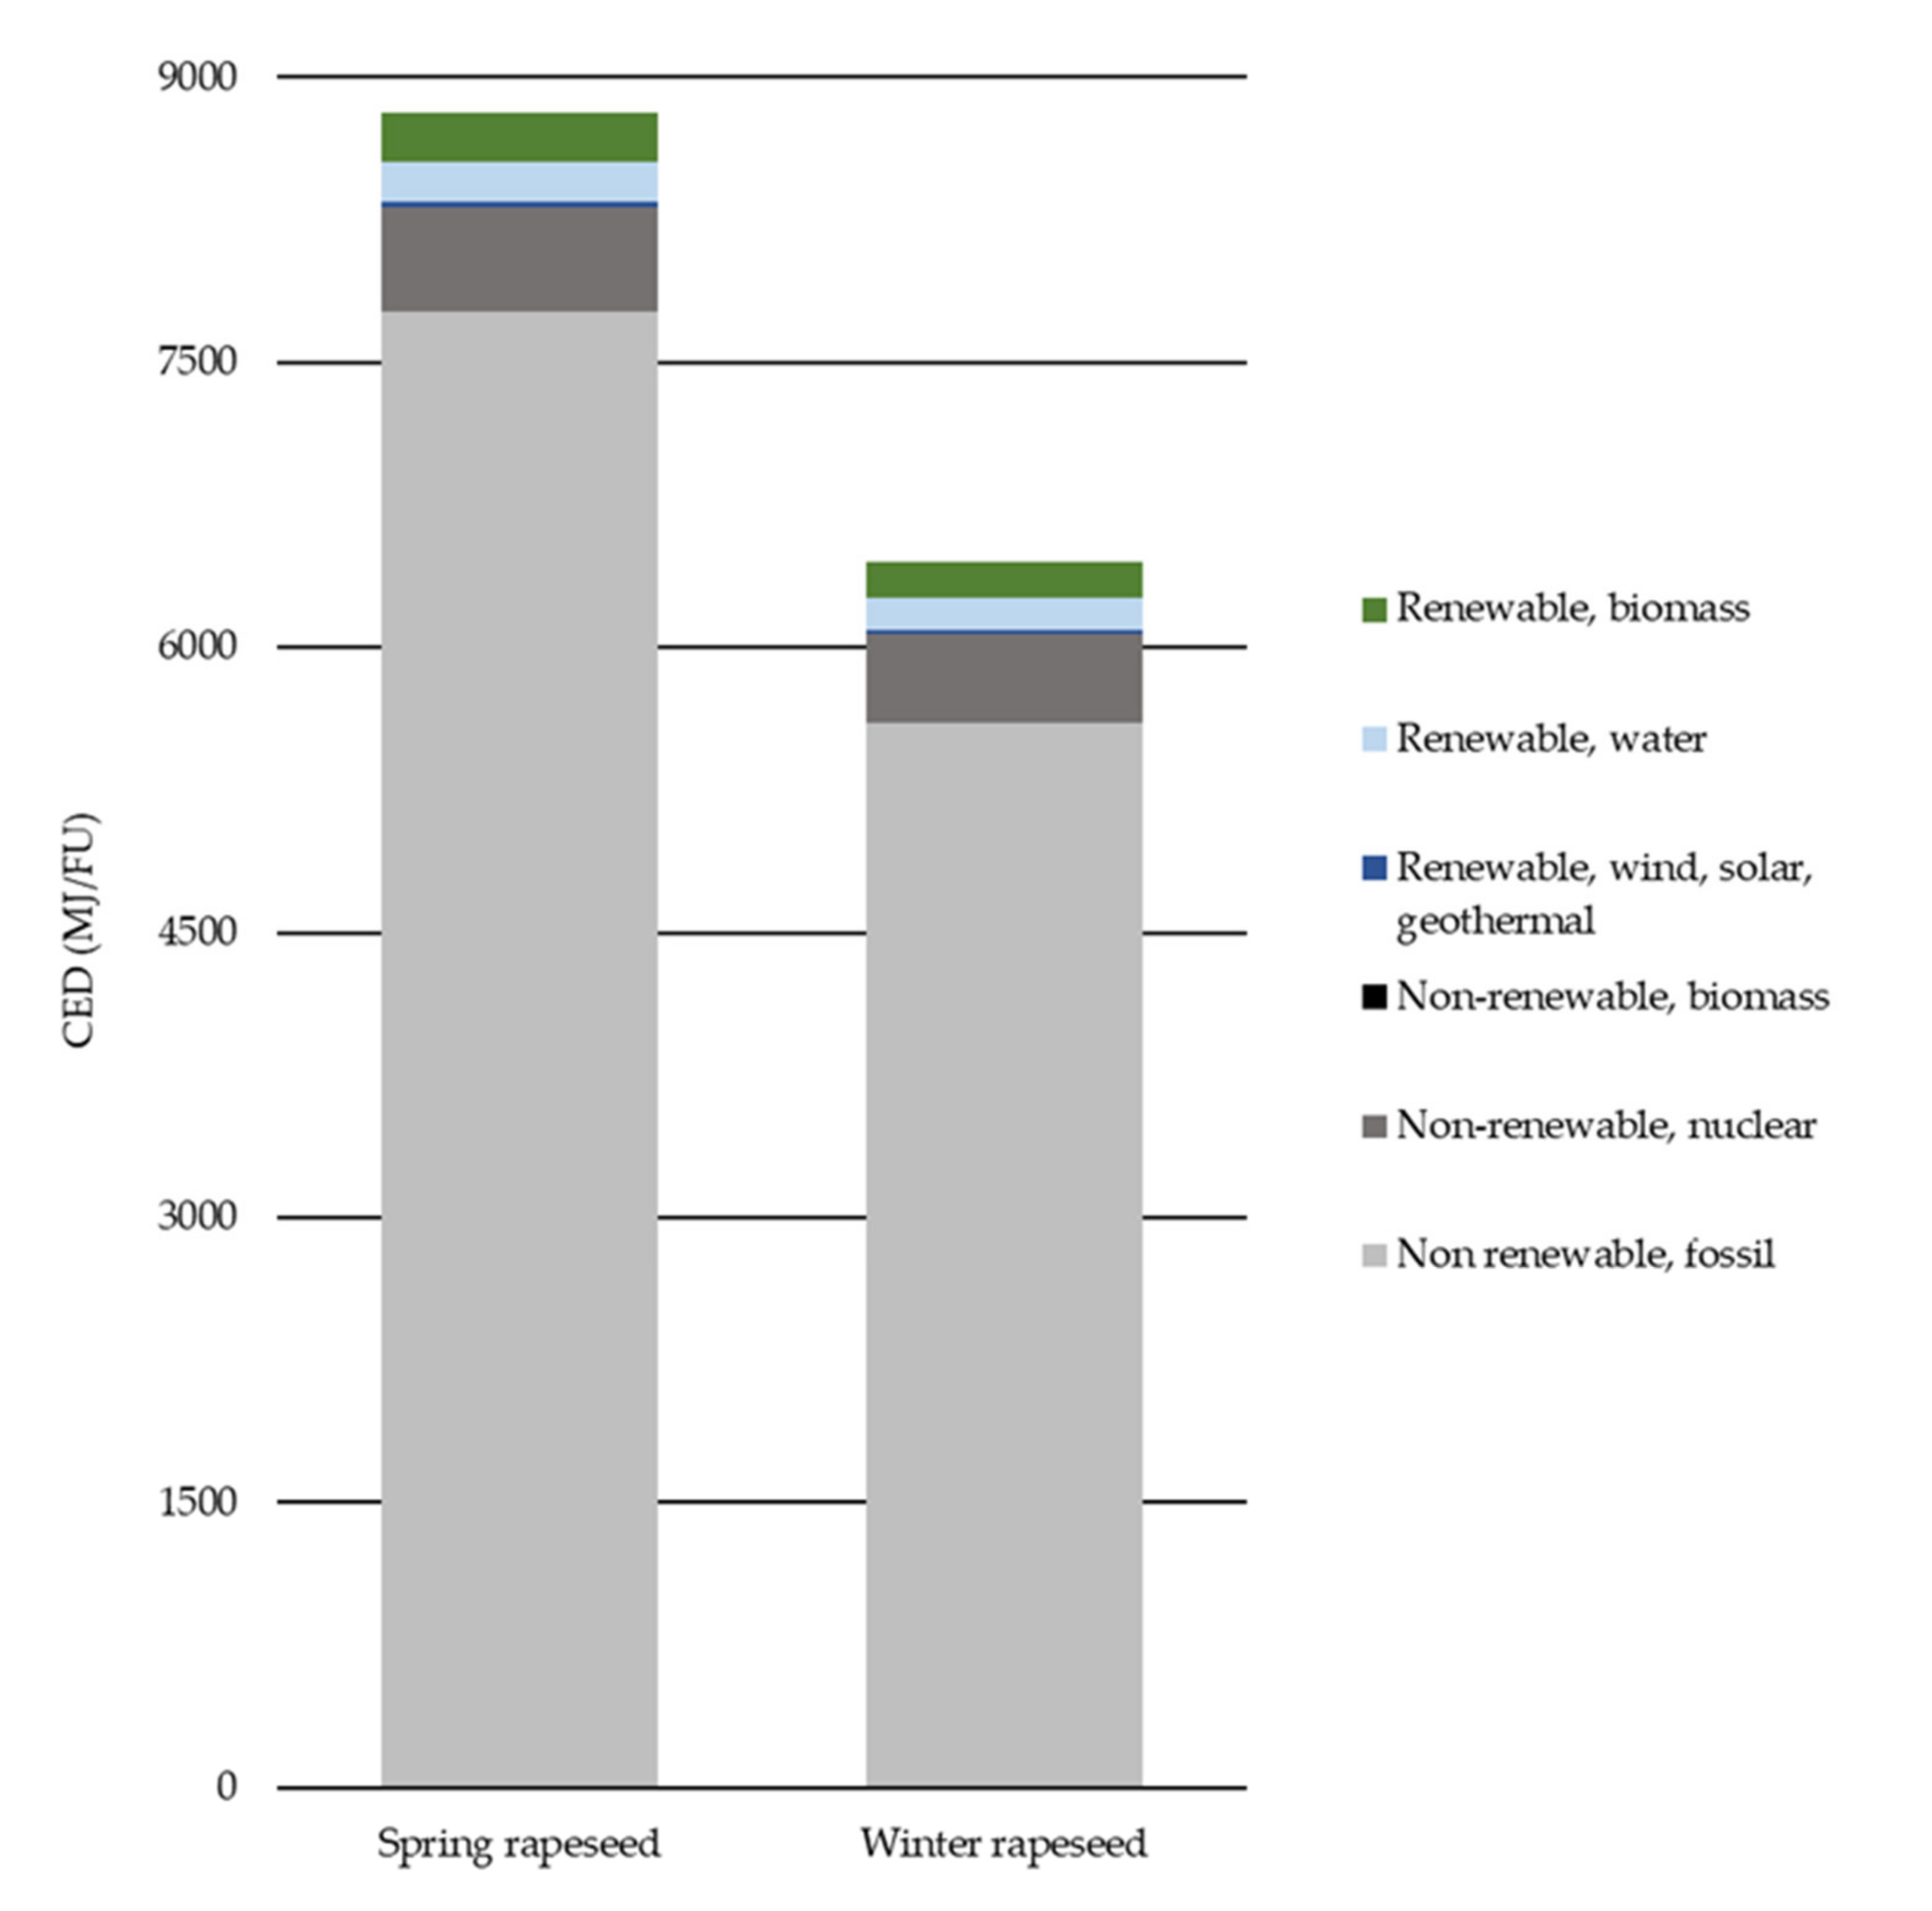
3.1.1. CED Method
3.1.2. ReCiPe Method Endpoint Level
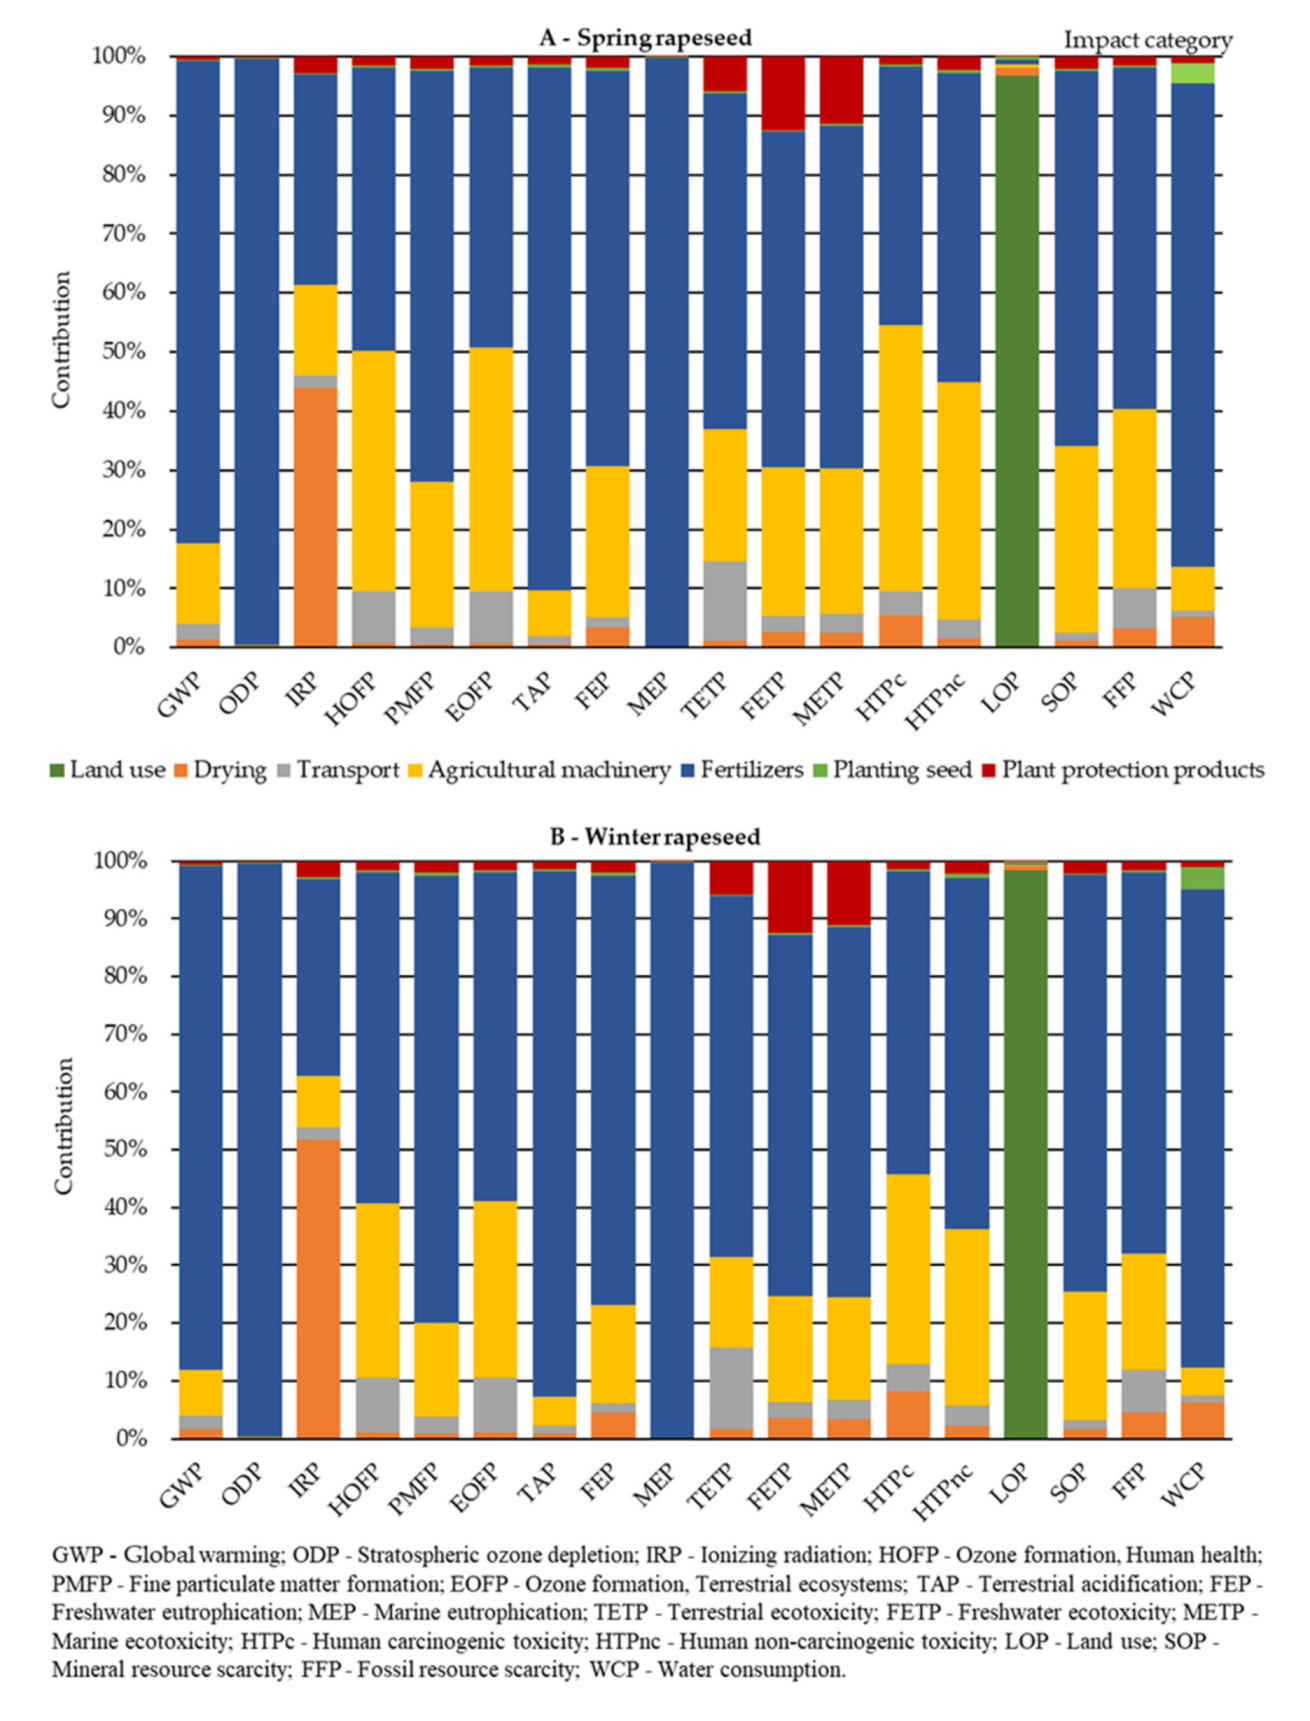
3.1.3. ReCiPe Method Midpoint Level
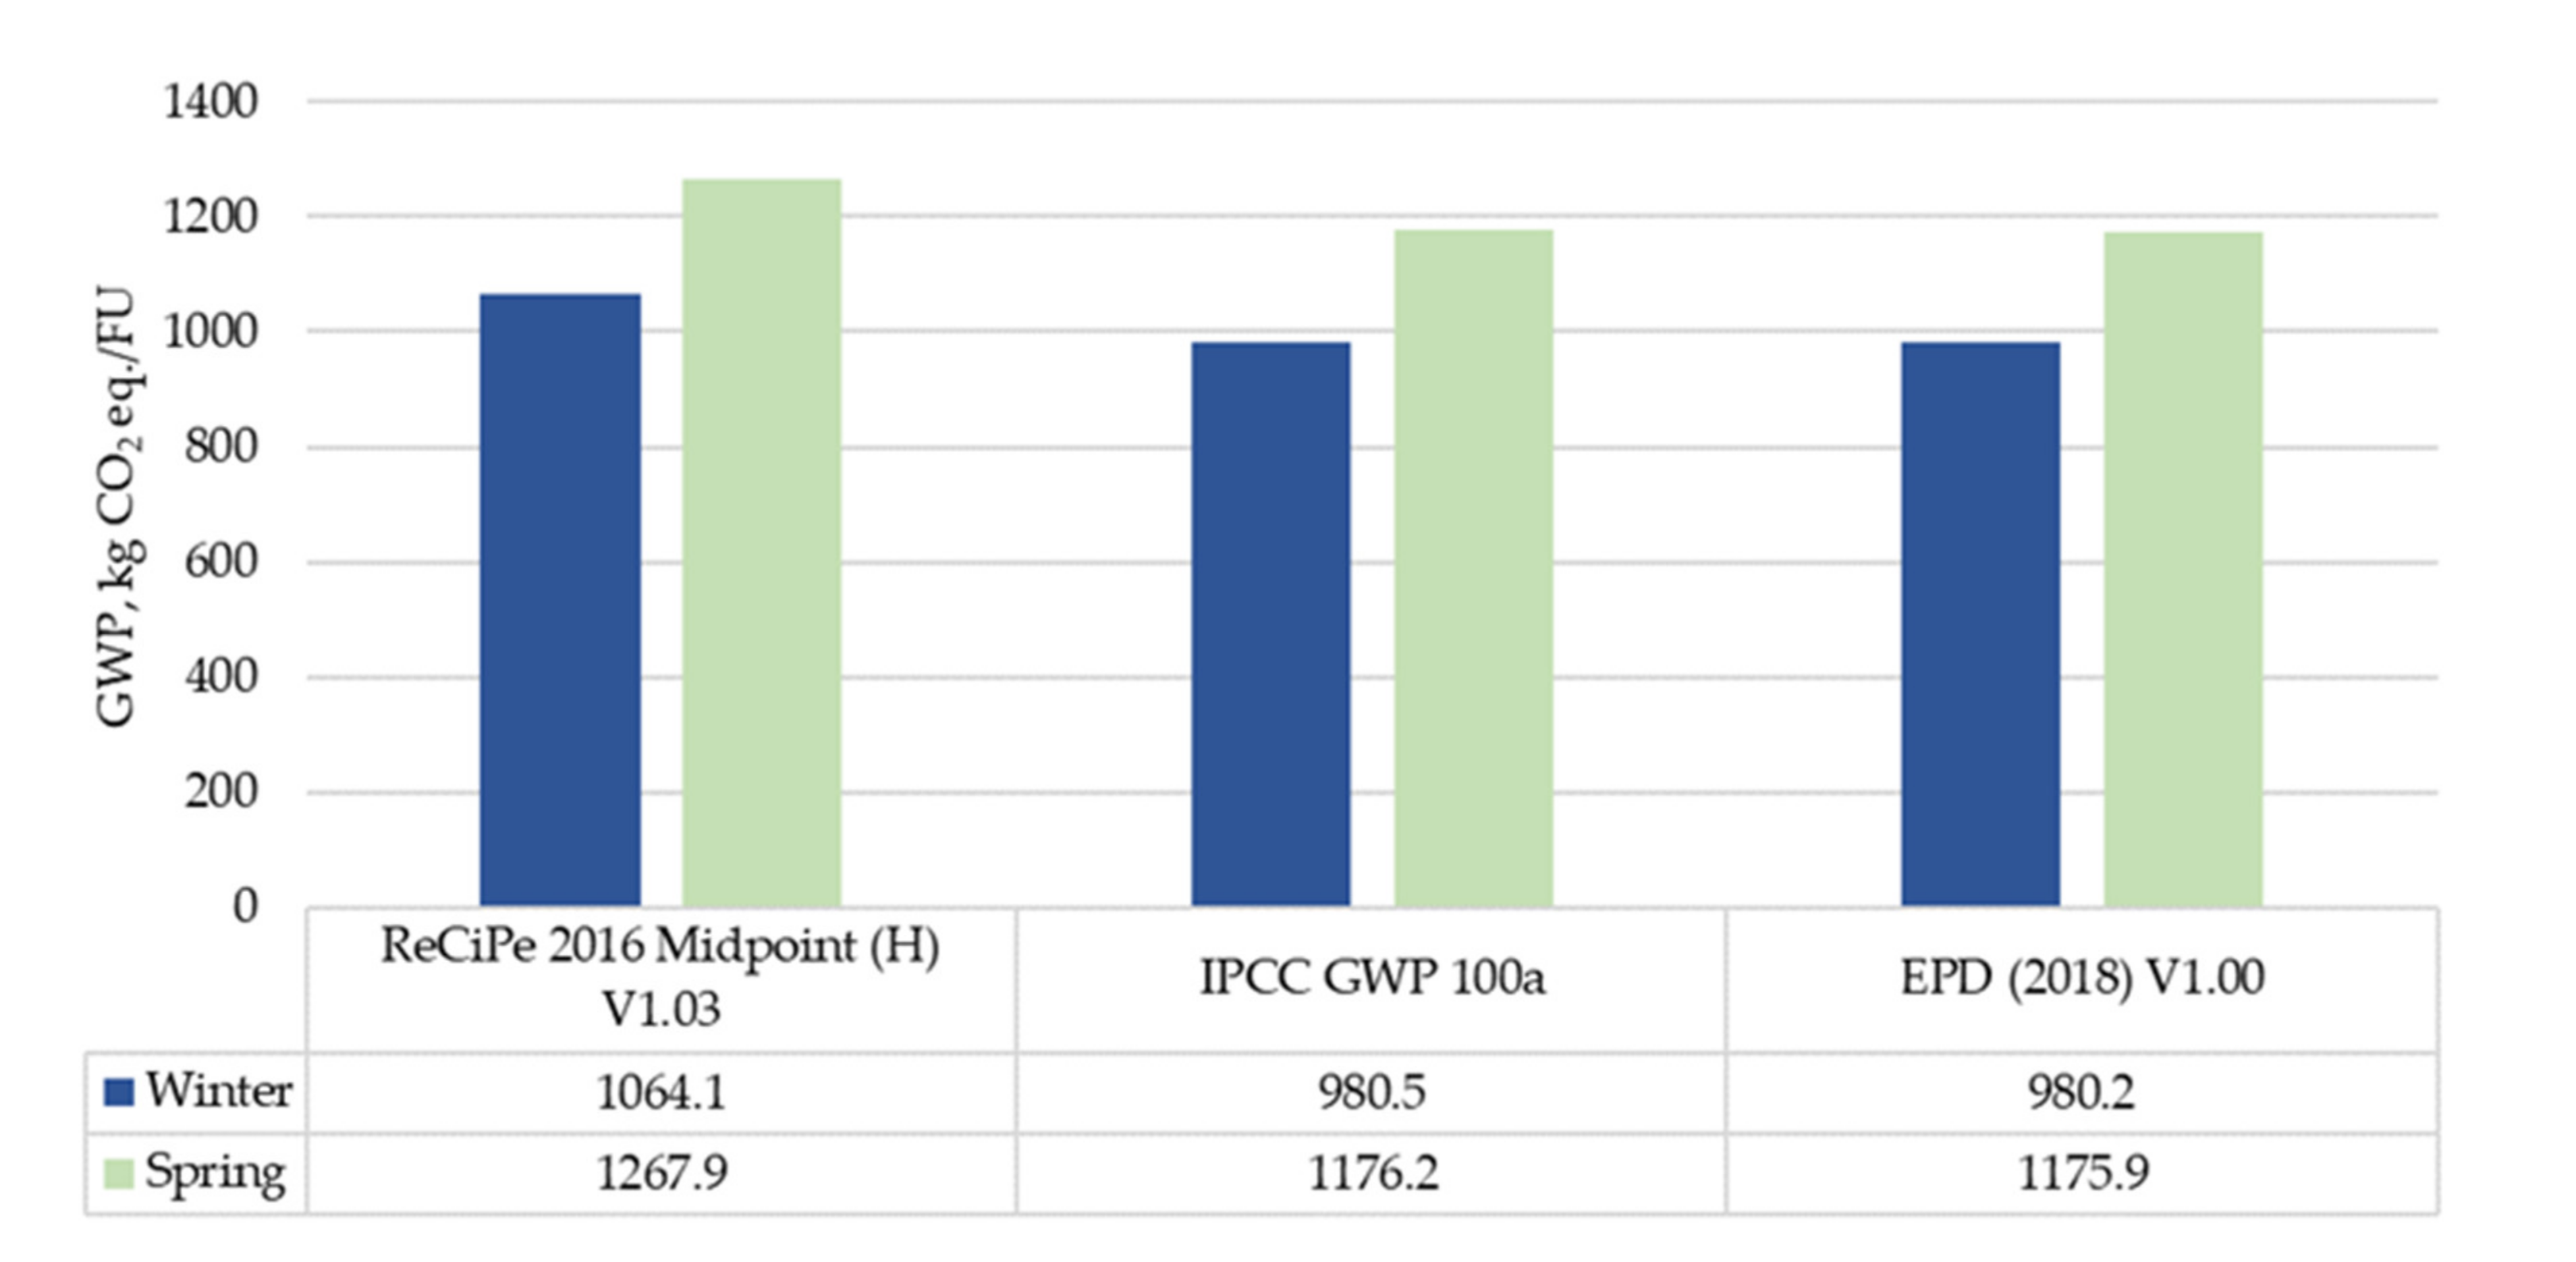
3.1.4. Sensitivity Analysis for Rapeseed Production
3.2. Life Cycle Impact Assessment of Rapeseed Oil Production
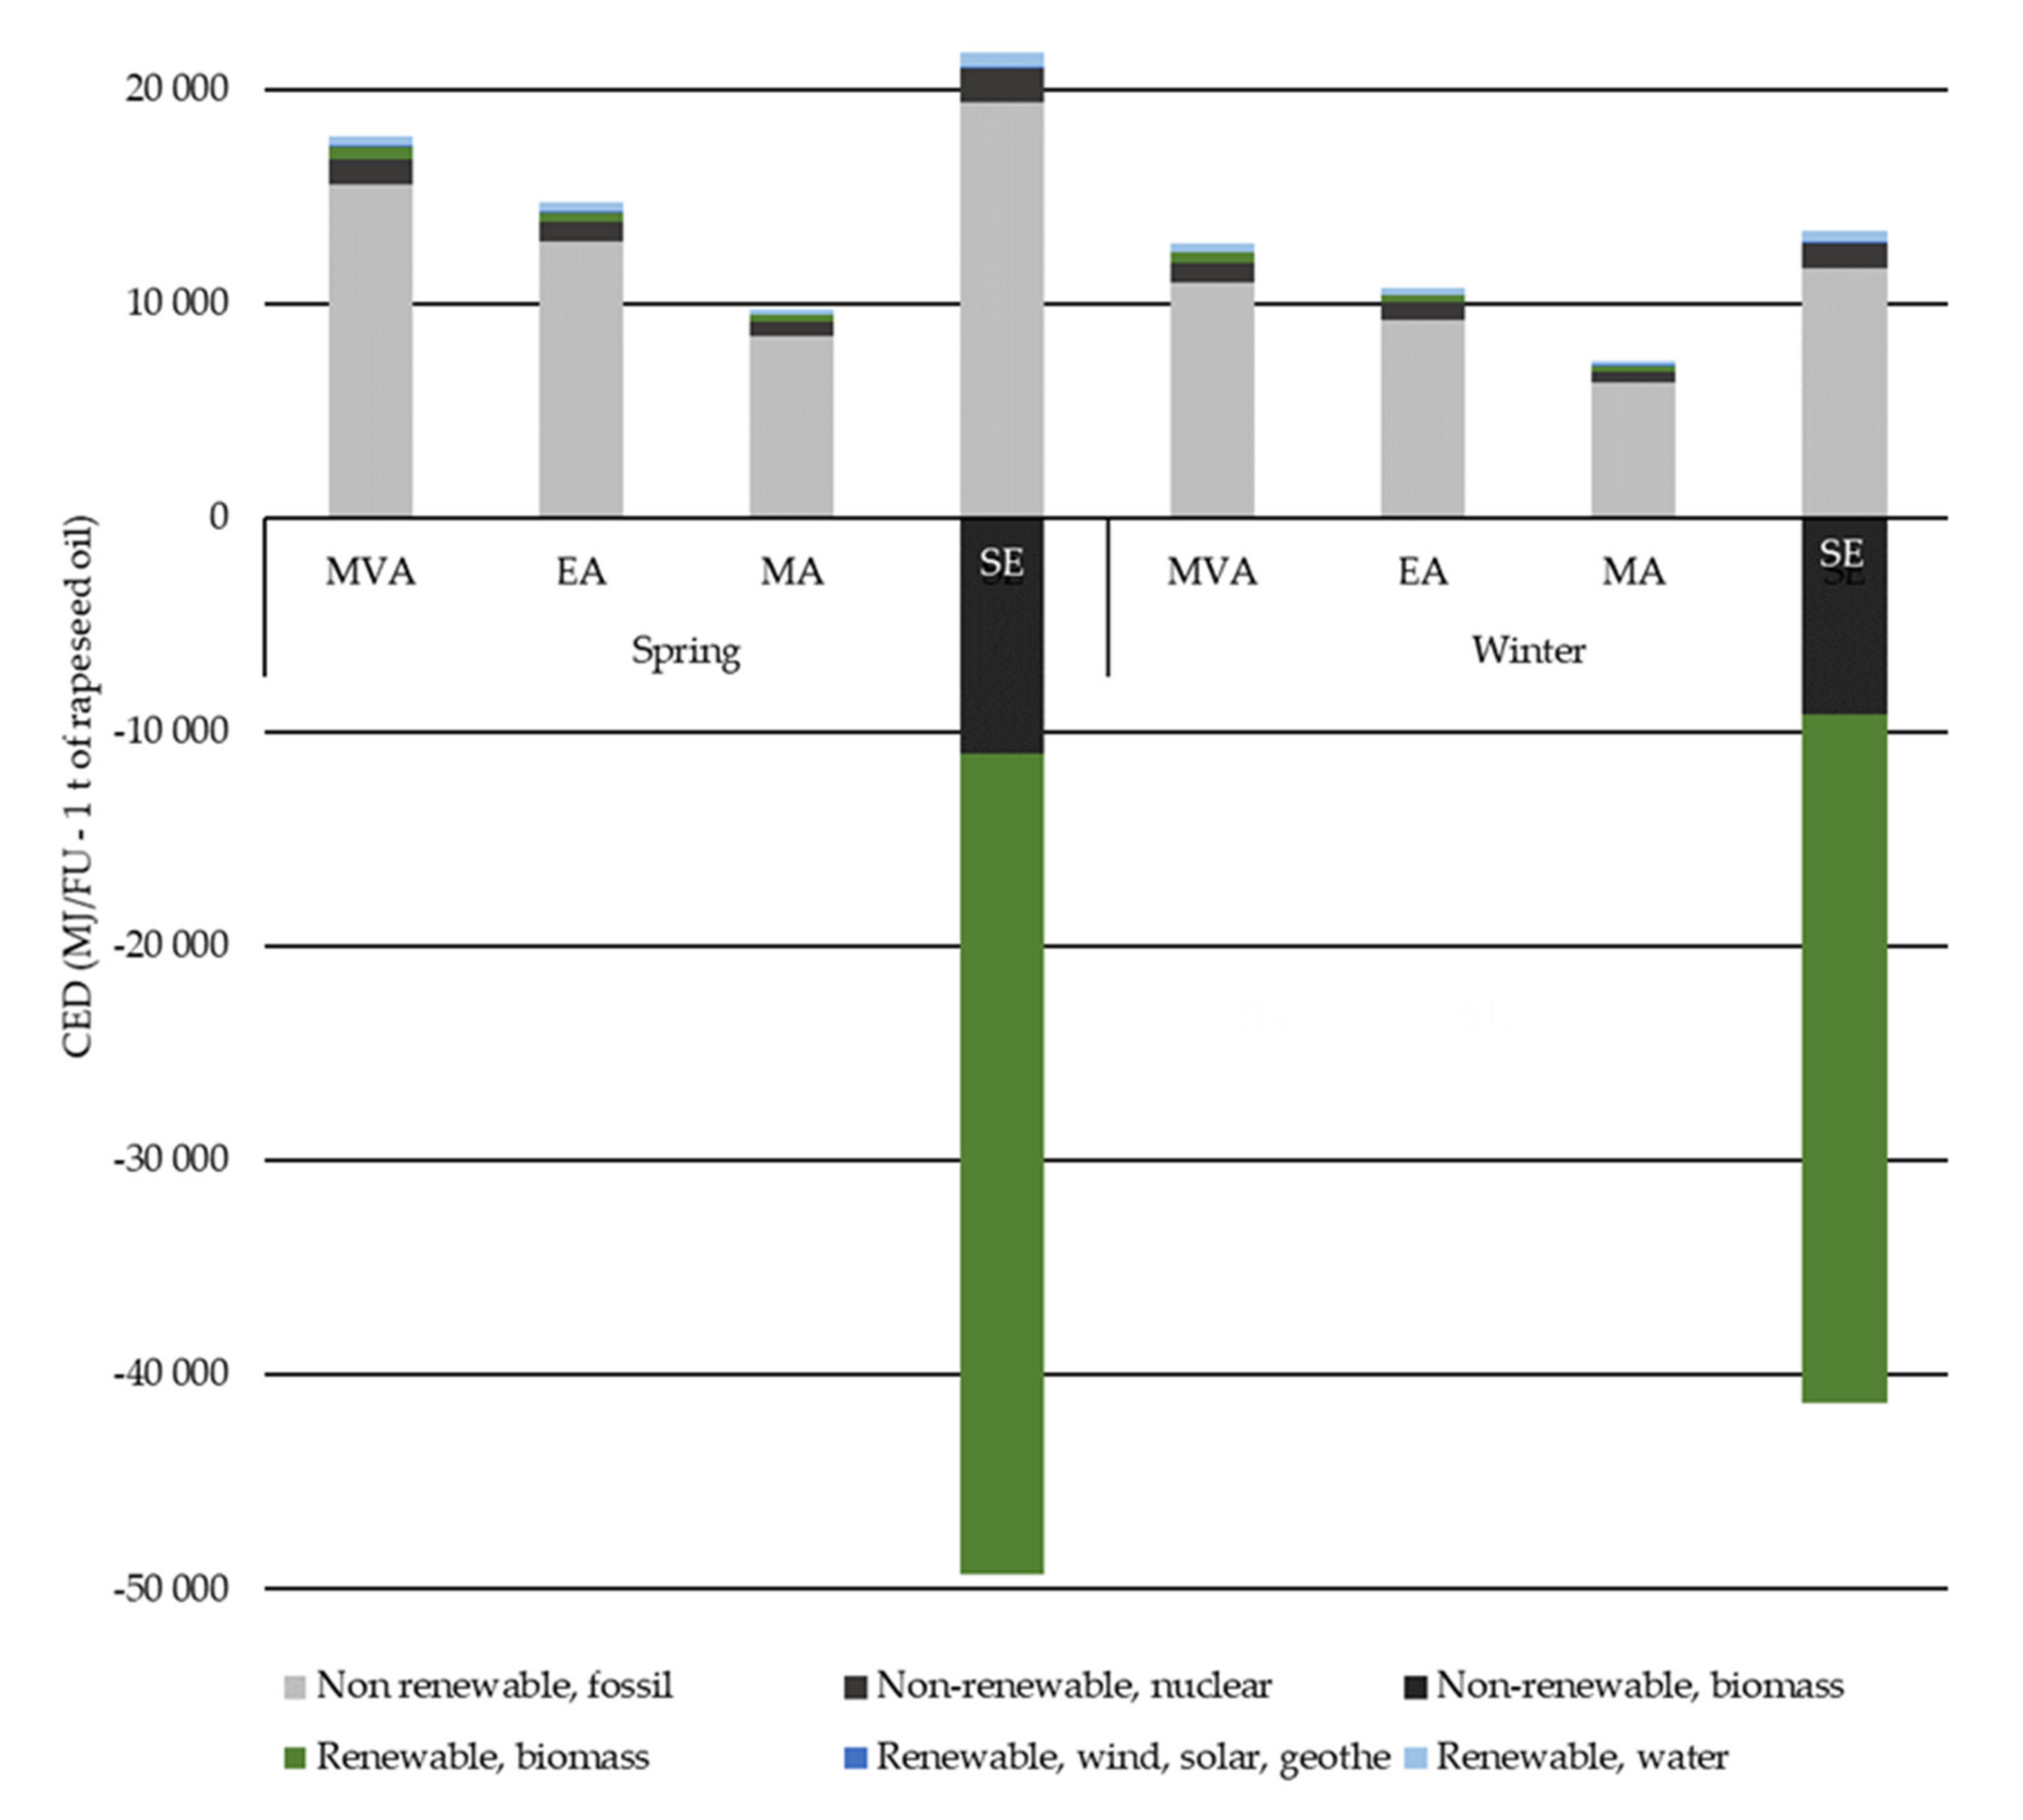
3.2.1. CED Method
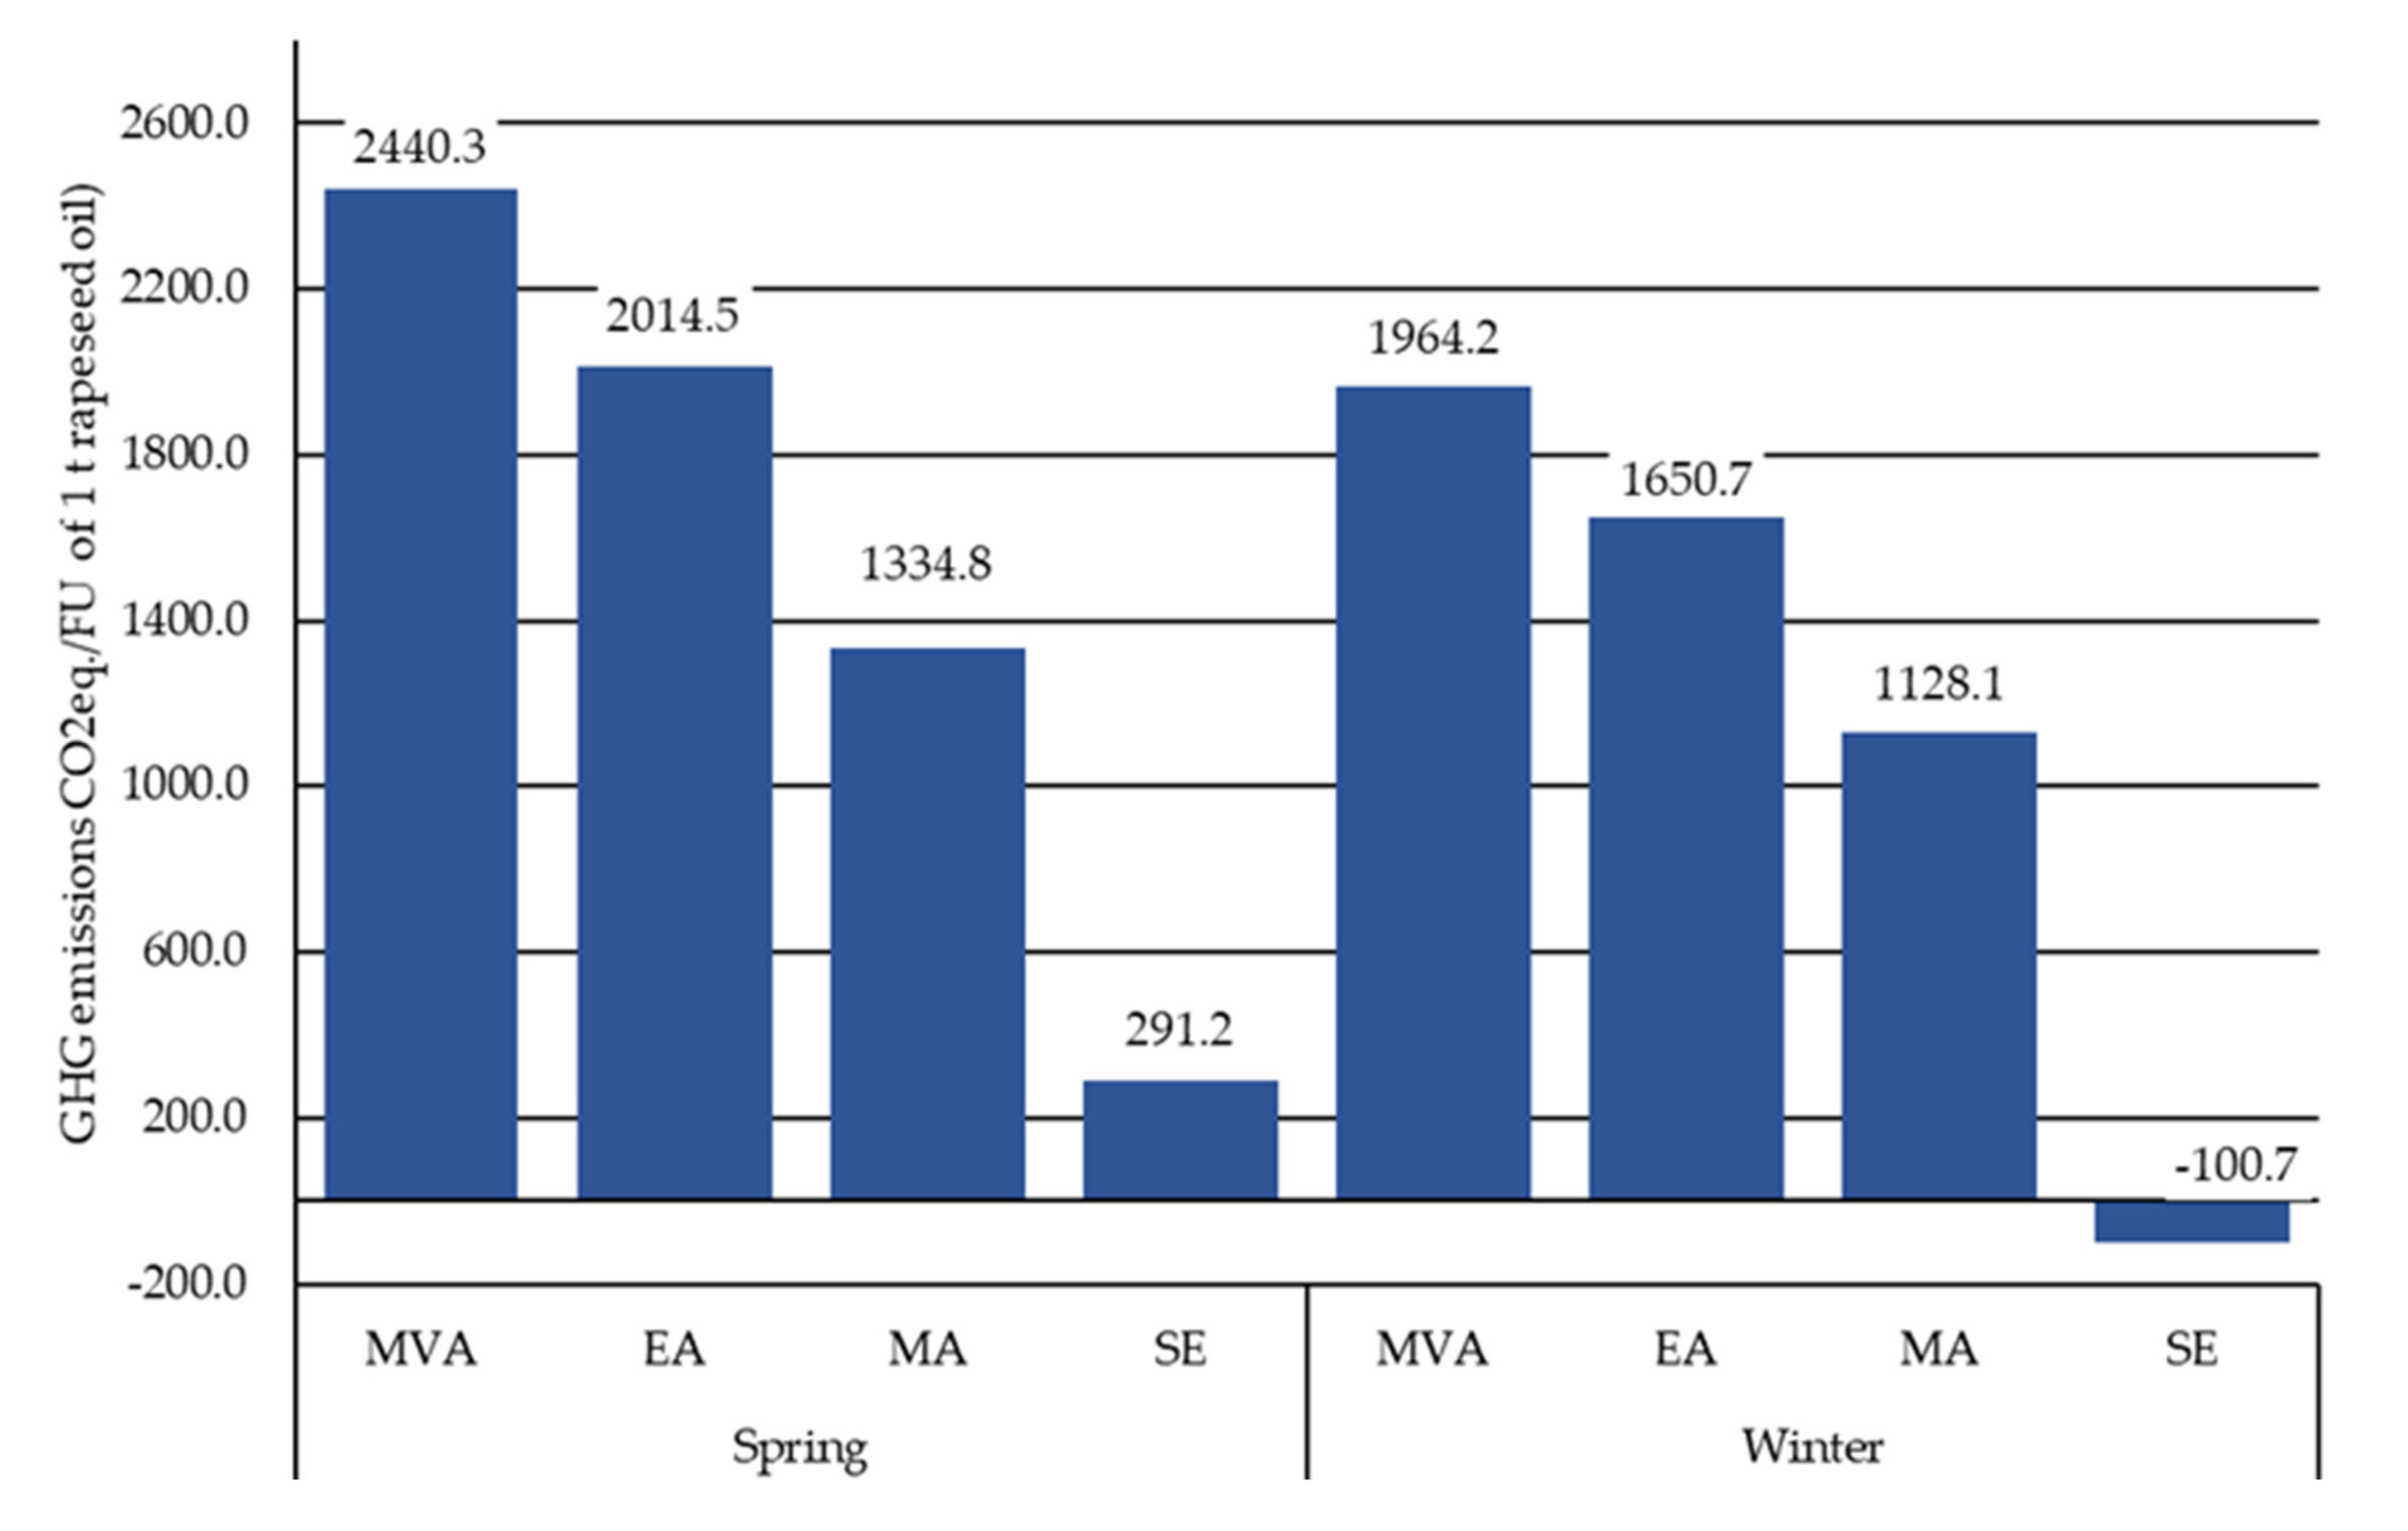
3.2.2. ReCiPe Method
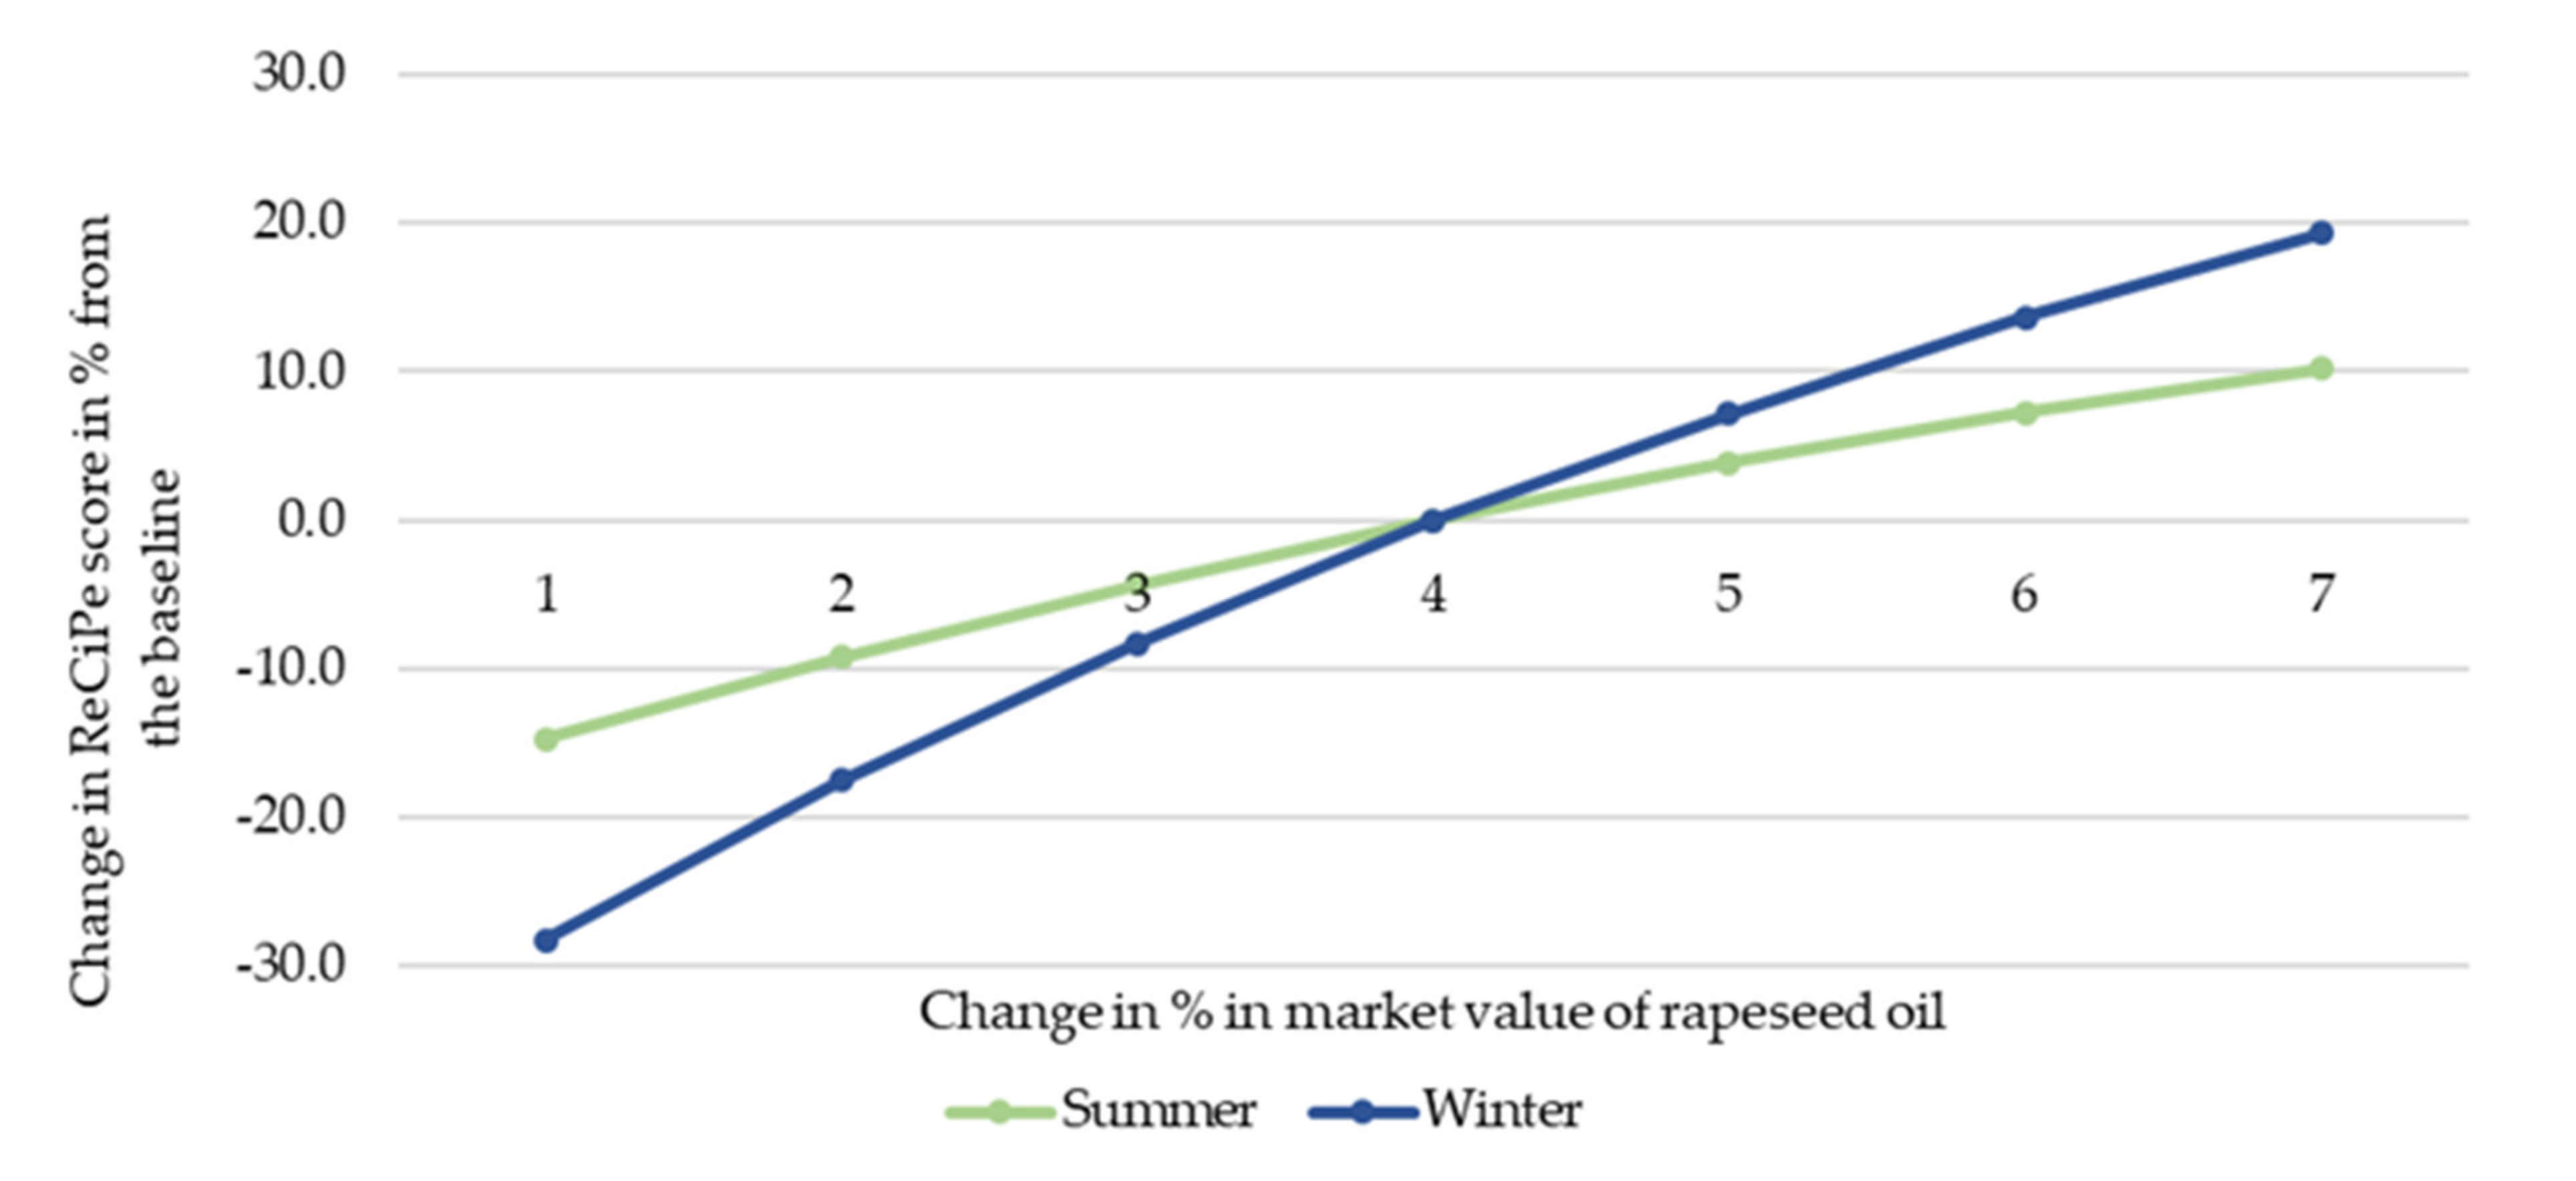
3.2.3. Sensitivity Analysis for Rapeseed Oil Production
4. Conclusions
Author Contributions
Funding
Acknowledgments
Conflicts of Interest
References
- Fridrihsone, A.; Romagnoli, F.; Cabulis, U. Life Cycle Inventory for winter and spring rapeseed production in Northern Europe. J. Clean. Prod. 2018, 177, 79–88. [Google Scholar] [CrossRef]
- Fridrihsone, A.; Romagnoli, F.; Kirsanovs, V.; Cabulis, U. Life Cycle Assessment of vegetable oil based polyols for polyurethane production. J. Clean. Prod. 2020, 266, 121403. [Google Scholar] [CrossRef]
- ISO 14044 International Standard. Environmental Management-Life Cycle Assessment-Requirements and Guidelines; International Organization for Standardization: Geneva, Switzerland, 2006. [Google Scholar]
- ISO 14040 International Standard. Environmental Management—Life Cycle Assessment—Principles and Framework; International Organization for Standardization: Geneva, Switzerland, 2006; p. 46. [Google Scholar]
- Iriarte, A.; Rieradevall, J.; Gabarrell, X. Life cycle assessment of sunflower and rapeseed as energy crops under Chilean conditions. J. Clean. Prod. 2010, 18, 336–345. [Google Scholar] [CrossRef]
- Schmidt, J.H. Life Cycle Assessment of Rapeseed Oil and Palm Oil. Part 3: Life Cycle Inventory of Rapeseed Oil and Palm oil. Ph.D. Thesis, Aalborg University, Aalborg, Denmark, 2007. [Google Scholar]
- Queirós, J.; Malça, J.; Freire, F. Environmental life-cycle assessment of rapeseed produced in Central Europe: Addressing alternative fertilization and management practices. J. Clean. Prod. 2015, 99, 266–274. [Google Scholar] [CrossRef]
- Katanenko, S. (Uzvara lauks Ltd., Bauska Municipality, Latvia). Personal communication, 2017.
- State Plant Protection Service Volume of Produced and Imported Fertilizers in 2018, in Tonnes. 2018. Available online: http://www.vaad.gov.lv/sakums/informacija-sabiedribai/par-meslosanas-lidzeklu-apriti.aspx (accessed on 15 May 2019).
- Nemecek, T.; Kagi, T. Life Cycle Inventories of Swiss and European Agricultural Production Systems; Final Report Ecoinvent V.2.0 No. 15a; Ecoinvent Centre: Zurich, Switzerland, 2007; p. 360. [Google Scholar]
- Malça, J.; Coelho, A.; Freire, F. Environmental life-cycle assessment of rapeseed-based biodiesel: Alternative cultivation systems and locations. Appl. Energy 2014, 114, 837–844. [Google Scholar] [CrossRef]
- GASO Dabasgāzes Izcelsme un Kvalitātes Parametri | Gaso. Available online: https://www.gaso.lv/dabasgazes-izcelsme-un-kvalitates-parametri (accessed on 15 May 2019).
- ADEME Life Cycle Assessments Applied to First Generation Biofuels Used in France 2010. Available online: https://www.ademe.fr/life-cycle-assessments-applied-to-first-generation-biofuels-used-in-france (accessed on 15 May 2019).
- Borzecka-Walker, M.; Faber, A.; Jarosz, Z.; Syp, A.; Pudełko, R. Greenhouse gas emissions from rape seed cultivation for FAME production in poland. J. Food Agric. Environ. 2013, 11, 1064–1068. [Google Scholar]
- Berghout, N. Technological Learning in the German Biodiesel Industry: An Experience Curve Approach to Quantify Reductions in Production Costs, Energy Use and Greenhouse Gas Emissions. Master’s Thesis, Utrecht University, Copernicus Institute, Utrecht, The Netherlands, 2008. [Google Scholar]
- Blonk Consultants Agri-Footprint Description of Data. 2014. 131. Available online: https://www.agri-footprint.com/ (accessed on 15 May 2019).
- Audsley, E.; Alber, S.; Clift, R.; Cowell, S.; Crettaz, P.; Gaillard, G.; Hausheer, J.; Jolliett, O.; Kleijn, R.; Mortensen, B.; et al. Harmonisation of Environmental Life Cycle Assessment for Agriculture: Final Report Concerted Action AIR3-CT94-2028; CE DG VI-Centre de Documentation: Brussels, Belgium, 2003. [Google Scholar]
- IPCC N2O Emissions From Managed Soils, and CO2 Emissions From Lime and Urea application. Guidel. Natl. Greenh. Gas Invent. 2006, 4, 54.
- Reijnders, L.; Huijbregts, M.A.J. Biogenic greenhouse gas emissions linked to the life cycles of biodiesel derived from European rapeseed and Brazilian soybeans. J. Clean. Prod. 2008, 16, 1943–1948. [Google Scholar] [CrossRef]
- Köble, R. GNOC—Global Nitrous Oxide Calculator. Available online: http://gnoc.jrc.ec.europa.eu/ (accessed on 20 May 2019).
- Nemecek, T.; Schnetzer, J. Methods of Assessment of Direct Field Emissions for LCIs of Agricultural Production Systems; Agroscope Reckenholz-Tanikon Research Station ART: Zurich, Switzerland, 2011; p. 34. [Google Scholar]
- Börjesson, P.; Tufvesson, L.M. Agricultural crop-based biofuels—Resource efficiency and environmental performance including direct land use changes. J. Clean. Prod. 2011, 19, 108–120. [Google Scholar] [CrossRef]
- Forleo, M.B.; Palmieri, N.; Suardi, A.; Coaloa, D.; Pari, L. The eco-efficiency of rapeseed and sunflower cultivation in Italy. Joining environmental and economic assessment. J. Clean. Prod. 2018, 172, 3138–3153. [Google Scholar] [CrossRef]
- Malça, J.; Freire, F. Life-cycle studies of biodiesel in Europe: A review addressing the variability of results and modeling issues. Renew. Sustain. Energy Rev. 2011, 15, 338–351. [Google Scholar] [CrossRef]
- Celitane, S. (Iecavnieks Ltd., Iecava Municipality, Latvia). Personal communication, 2019.
- European Commission—Joint Research Centre Definition of Input Data to Assess GHG Default Emissions from Biofuels in EU Legislation: Version 1c—July 2017; Publications Office of the European Union: Brussels, Belgium, 2017.
- Corré, W.J.; Conijn, J.G.; Meesters, K.P.H.; Bos, H.L. Accounting for co-products in energy use, greenhouse gas emission savings and land use of biodiesel production from vegetable oils. Ind. Crops Prod. 2016, 80, 220–227. [Google Scholar] [CrossRef]
- Huijbregts, M.; Rombouts, L.; Hellweg, S.; Frischknecht, R.; Hendriks, A.; Van de Meent, D.; Ragas, A.; Reijnders, L.; Struijs, J. Is Cumulative Fossil Energy Demand a Useful Indicator for the Environmental Performance of Products? Environ. Sci. Technol. 2006, 40, 641–648. [Google Scholar] [CrossRef] [PubMed]
- Arvidsson, R.; Svanstrom, M. A Framework for Energy Use Indicators and Their Reporting in Life Cycle Assessment. Integr. Environ. Assess. Manag. 2015, 12, 429–436. [Google Scholar] [CrossRef] [PubMed]
- Huijbregts, M.A.J.; Hellweg, S.; Frischknecht, R.; Hendriks, H.W.M.; Hungerbühler, K.; Hendriks, A.J. Cumulative Energy Demand As Predictor for the Environmental Burden of Commodity Production. Environ. Sci. Technol. 2010, 44, 2189–2196. [Google Scholar] [CrossRef] [PubMed]
- Pelletier, N.; Arsenault, N.; Tyedmers, P. Scenario modeling potential eco-efficiency gains from a transition to organic agriculture: Life cycle perspectives on Canadian canola, corn, soy, and wheat production. Environ. Manag. 2008, 42, 989–1001. [Google Scholar] [CrossRef]
- Moeller, D.; Sieverding, H.L.; Stone, J.J. Comparative Farm-Gate Life Cycle Assessment of Oilseed Feedstocks in the Northern Great Plains. Biophys. Econ. Resour. Qual. 2017, 2, 1–16. [Google Scholar] [CrossRef]
- Iriarte, A.; Rieradevall, J.; Gabarrell, X. Environmental impacts and energy demand of rapeseed as an energy crop in Chile under different fertilization and tillage practices. Biomass Bioenergy 2011, 35, 4305–4315. [Google Scholar] [CrossRef]
- Cardone, M.; Mazzoncini, M.; Menini, S.; Rocco, V.; Senatore, A.; Seggiani, M.; Vitolo, S. Brassica carinata as an alternative oil crop for the production of biodiesel in Italy: Agronomic evaluation, fuel production by transesterification and characterization. Biomass Bioenergy 2003, 25, 623–636. [Google Scholar] [CrossRef]
- Rathke, G.W.; Diepenbrock, W. Energy balance of winter oilseed rape (Brassica napus L.) cropping as related to nitrogen supply and preceding crop. Eur. J. Agron. 2006, 24, 35–44. [Google Scholar] [CrossRef]
- Letcher, T.M. Why Do We Have Global Warming? Elsevier Inc.: Cambridge, MA, USA, 2019; ISBN 9780128141045. [Google Scholar]
- Willem, P.N.; Cooper, C.J. Implications of fossil fuel constraints on economic growth and global warming. Energy Policy 2009, 37, 166–180. [Google Scholar] [CrossRef]
- Pré Consultants Introduction to LCA with SimaPro Title: Introduction to LCA with SimaPro. Available online: https://www.pre-sustainability.com/download/SimaPro8IntroductionToLCA.pdf (accessed on 25 May 2019).
- Edwards, D.; Batley, J.; Parkin, I.; Kole, C. Genetics, Genomics and Breeding of Oilseed Brassicas (Genetics, Genomics and Breeding of Crop Plants); CRC Press: Boca Raton, FL, USA, 2011. [Google Scholar]
- Wang, L.; Littlewood, J.; Murphy, R.J. Environmental sustainability of bioethanol production from wheat straw in the UK. Renew. Sustain. Energy Rev. 2013, 28, 715–725. [Google Scholar] [CrossRef]
- Pawelzik, P.; Carus, M.; Hotchkiss, J.; Narayan, R.; Selke, S.; Wellisch, M.; Weiss, M.; Wicke, B.; Patel, M.K. Critical aspects in the life cycle assessment (LCA) of bio-based materials—Reviewing methodologies and deriving recommendations. Resour. Conserv. Recycl. 2013, 73, 211–228. [Google Scholar] [CrossRef]
- Khatri, P.; Jain, S. Environmental life cycle assessment of edible oils: A review of current knowledge and future research challenges. J. Clean. Prod. 2017, 152, 63–76. [Google Scholar] [CrossRef]
- Guinée, J.B.; Heijungs, R.; Huppes, G. LCA Methodology Economic Allocation: Examples and Derived Decision Tree. Int. J. Life Cycle Assess. 2004, 9, 23–33. [Google Scholar] [CrossRef]


| Flow | Unit | Winter | Spring | Comments |
|---|---|---|---|---|
| Yield | t/ha | 3.5 | 2.5 | |
| Material Use | ||||
| Planting seed material | kg/t | 1.4 | 1.6 | |
| Fertilizer application rates | ||||
| P2O5 | kg P2O5/t | 17.4 | 24.3 | Modeled as diammonium phosphate |
| K2O | kg K2O/t | 36.9 | 51.7 | Modeled as KCl |
| Nitrogen in total | kg N/t | 63.2 | 74.8 | |
| (6.9% as NPKS 4-16-32-2S) | kg N/t | 4.3 | − | Nitrogen in NPKS fertilizer was modeled as an input of ammonium sulfate |
| (46.7% as NH4NO3) | kg N/t | 29.5 | − | |
| (17.1% as (NH4)2SO4) | kg N/t | 10.8 | − | |
| (29.4% as KAS N25+S3) | kg N/t | 18.6 | − | 14.5 kg of urea ammonium nitrate with N content 32% * |
| (8.1% as NPKS 4-16-32-2S) | − | 6.1 | ||
| (40.5% as NH4NO3) | − | 30.3 | ||
| (18.0% as (NH4)2SO4) | − | 13.4 | ||
| (33.4% as KAS N25+S3) | − | 25.0 | 19.5 kg of urea ammonium nitrate with N content 32% * | |
| Plant protection product application | ||||
| Acetamide-anillide-compound | kg/t | 0.24 | 0.33 | |
| Pesticides, unspecific | kg/t | 0.094 | 0.13 | |
| Diphenylether compounds | kg/t | 0.029 | − | Winter rape only |
| Pyrethroid compound | kg/t | 0.0043 | 0.0060 | |
| Cyclic N-compound (triazole) | kg/t | 0.032 | 0.044 | |
| Bipyridylium compounds | kg/t | − | 0.15 | Spring rape only |
| Grain drying | MJ/t | 189.2 | 189.2 | Provided with natural gas |
| Diesel for agricultural operations | ||||
| Tilling—turn over the soil | L/t | − | 10.8 | |
| Disc cultivation | L/t | 2.1 | 3.0 | |
| Drag harrowing | L/t | − | 3.4 | |
| Sowing | L/t | 4.6 | 3.8 | |
| Application of fertilizer | L/t | 0.8 | 0.9 | |
| Application of plant protection products | L/t | 1.3 | 1.8 | |
| Combine harvesting | L/t | 5.7 | 8.0 | |
| Transport | ||||
| Lorry 7.5–16 t | tkm | 0.1 | 0.2 | |
| Lorry 16–32 t | tkm | 146.7 | 183.7 | |
| Transoceanic freight ship | tkm | 1.1 | 3.0 | |
| Lorry 3.5–7.5 t | tkm | 0.1 | 0.1 | |
| Tractor | tkm | 4.8 | 6.1 | |
| Emissions to Water | ||||
| Phosphorus | kg P/t | 0.04 | 0.13 | |
| Nitrate | kgNO3/t | 83.97 | 99.38 | |
| Plant protection products | ||||
| Metazachlor | kg/t | 0.0012 | 0.0017 | |
| Quinmerac | kg/t | 0.00030 | 0.00042 | |
| Metconazole | kg/t | 0.000090 | 0.00013 | Metconazole-Triazole class fungicide. No data. Replaced by Epoxiconazole [16] |
| λ-Cyhalothrin | kg/t | 0.000014 | 0.000020 | |
| Cyproconazo | kg/t | 0.000069 | 0.00096 | |
| Azoxystrobin | kg/t | 0.00017 | 0.00024 | |
| Deltametrin | kg/t | 0.0000071 | 0.000010 | |
| Propaquizafop | kg/t | 0.00014 | − | Winter rape only |
| Diquat dibromide | kg/t | − | 0.00075 | Spring rape only |
| Emissions to Air | ||||
| Nitrous oxide in total | kg N2O/t | 1.73 | 1.88 | |
| Direct N2O emissions from fertilizer application | kg N2O/t | 0.97 | 1.07 | |
| Indirect N2O emissions produced from leaching and runoff from fertilizer application | kg N2O/t | 0.22 | 0.26 | |
| Indirect N2O emissions produced from atmospheric deposition of N volatilised | kg N2O/t | 0.10 | 0.12 | |
| Direct N2O emissions from N in crop residues | kg N2O/t | 0.036 | 0.34 | |
| Indirect N2O emissions produced from leaching and runoff from N in crop residues | kg N2O/t | 0.08 | 0.08 | |
| Plant protection products | ||||
| Metazachlor | kg/t | 0.012 | 0.017 | |
| Quinmerac | kg/t | 0.00059 | 0.00083 | |
| Metconazole | kg/t | 0.00018 | 0.00025 | Proxy-Epoxicanozole |
| λ-Cyhalothrin | kg/t | 0.000029 | 0.000040 | |
| Cyproconazo | kg/t | 0.00069 | 0.00096 | |
| Azoxystrobin | kg/t | 0.00034 | 0.00048 | |
| Deltametrin | kg/t | 0.000014 | 0.000020 | |
| Propaquizafop | kg/t | 0.00029 | − | Winter rape only |
| Diquat dibromide | kg/t | − | 0.23 | Spring rape only |
| Carbon dioxide, fossil | kgCO2/t | 7.97 | 10.73 | |
| Nitrogen oxides | kg NOx/t | 0.36 | 0.40 | |
| Ammonia | kg NH3/t | 2.69 | 3.35 | Emission factor |
| (6.9% as NPKS 4-16-32-2S) | kg NH3/ t | 0.17 | − | 4% |
| (46.7% as NH4NO3) | kg NH3/ t | 0.59 | − | 2% |
| (17.1% as (NH4)2SO4 | kg NH3/ t | 0.86 | − | 8% |
| (29.4% as KAS N25+S3) | kg NH3/ t | 1.06 | − | 5.7% |
| (6.9% as NPKS 4-16-32-2S) | kg NH3/ t | − | 0.24 | 4% |
| (46.7% as NH4NO3) | kg NH3/ t | − | 0.61 | 2% |
| (17.1% as (NH4)2SO4) | kg NH3/ t | − | 1.08 | 8% |
| (29.4% as KAS N25+S3) | kg NH3/ t | − | 1.43 | 5.7% |
| Water | kg H2O/t | 45.45 | 45.45 | From seed drying |
| Emissions to Soil | ||||
| Plant protection products | ||||
| Metazachlor | kg/t | 0.12 | 0.017 | |
| Quinmerac | kg/t | 0.030 | 0.042 | |
| Metconazole | kg/t | 0.0090 | 0.013 | Proxy-Epoxicanozole |
| λ-Cyhalothrin | kg/t | 0.0014 | 0.0020 | |
| Cyproconazo | kg/t | 0.0069 | 0.010 | |
| Azoxystrobin | kg/t | 0.017 | 0.024 | |
| Deltametrin | kg/t | 0.00071 | 0.001 | |
| Propaquizafop | kg/t | 0.014 | − | Winter rape only |
| Diquat dibromide | kg/t | − | 0.075 | Spring rape only |
| Input Flow | Unit | Value | |
|---|---|---|---|
| Winter | Spring | ||
| Rapeseeds | kg | 2778 | 3125 |
| Electricity for pressing oil | kWh | 125 | 141 |
| Electricity for pumping oil from pressing tanks to storage | kWh | 0.65 | 0.65 |
| Transport, tractor | tkm | 97.2 | 109.4 |
| Output Flow | |||
| Oil | kg | 1000 | 1000 |
| Cake | kg | 1722 | 2063 |
| Loss 2% | kg | 56 | 63 |
| Allocation Type | Mass (%) | Market Value 1 (%) for 2016 | Energy 2 (%) | |||
|---|---|---|---|---|---|---|
| Flow | Winter | Spring | Winter | Spring | Winter | Spring |
| Oil | 36.7 | 32.6 | 63.9 | 59.6 | 53.7 | 49.2 |
| Cake | 63.3 | 67.4 | 36.1 | 40.4 | 46.3 | 50.8 |
| Midpoint Impact Category | |||||||||
|---|---|---|---|---|---|---|---|---|---|
| GWP | ODP | IRP | HOFP | PMFP | EOFP | TAP | FEP | MEP | |
| Change in % | ± 8.7 | ± 9.9 | ± 3.4 | ± 5.7 | ± 7.8 | ± 5.7 | ± 9.1 | ± 7.5 | ± 10.0 |
| TETP | FETP | METP | HTPc | HTPnc | LOP | SOP | FFP | WCP | |
| Change in % | ± 6.3 | ± 6.3 | ± 6.6 | ± 5.2 | ± 6.2 | 0.0 | ± 7.3 | ± 6.6 | ± 8.3 |
© 2020 by the authors. Licensee MDPI, Basel, Switzerland. This article is an open access article distributed under the terms and conditions of the Creative Commons Attribution (CC BY) license (http://creativecommons.org/licenses/by/4.0/).
Share and Cite
Fridrihsone, A.; Romagnoli, F.; Cabulis, U. Environmental Life Cycle Assessment of Rapeseed and Rapeseed Oil Produced in Northern Europe: A Latvian Case Study. Sustainability 2020, 12, 5699. https://doi.org/10.3390/su12145699
Fridrihsone A, Romagnoli F, Cabulis U. Environmental Life Cycle Assessment of Rapeseed and Rapeseed Oil Produced in Northern Europe: A Latvian Case Study. Sustainability. 2020; 12(14):5699. https://doi.org/10.3390/su12145699
Chicago/Turabian StyleFridrihsone, Anda, Francesco Romagnoli, and Ugis Cabulis. 2020. "Environmental Life Cycle Assessment of Rapeseed and Rapeseed Oil Produced in Northern Europe: A Latvian Case Study" Sustainability 12, no. 14: 5699. https://doi.org/10.3390/su12145699
APA StyleFridrihsone, A., Romagnoli, F., & Cabulis, U. (2020). Environmental Life Cycle Assessment of Rapeseed and Rapeseed Oil Produced in Northern Europe: A Latvian Case Study. Sustainability, 12(14), 5699. https://doi.org/10.3390/su12145699