Article

Automated Sustainability Assessment System for Small and Medium Enterprises Reporting

Department of Informatics, Mendel University, 61300 Brno, Czech Republic
*
Author to whom correspondence should be addressed.
Sustainability 2020, 12(14), 5687; https://doi.org/10.3390/su12145687
Submission received: 29 June 2020 / Revised: 8 July 2020 / Accepted: 13 July 2020 / Published: 15 July 2020
(This article belongs to the Special Issue CSR and Business Ethics for Sustainable Development)

Abstract

:
Sustainability assessment is a mainstream business activity that demonstrates the link between the organization’s strategy for and commitment to a sustainable global economy, and the prevention of economic crises. Small- and medium-sized businesses/enterprises (SMBs/SMEs) have significant effects on the European economy. However, because of a lot of restriction factors, like business risk, the high expenses of data collection and management, and the lack of resources, sustainability reporting is considered a superfluous and burdensome activity for them. The aim of this research is to propose an automated, comprehensive and simplified system for the sustainability assessment of SMEs. This system is achieved by implementing three main phases. The first phase includes key performance indicators design, which starts with the identification of various key performance indicators for comprehensive sustainability assessment, and ends with proposing an optimal set of KPIs (Key Performance Indicators) that can encompass long-term issues and be applicable to SMEs in the EU. The second phase involves a new comprehensive method of sustainability assessment for all KPIs designed in the first phase. Therefore, a multi-criteria model, which involves four main pillars of sustainability assessment (economic, environmental, social and governance), is proposed. It gives different enterprises the ability to verify and compare their efficiency and sustainability with other companies within the same sector in an almost automated manner. In the final phase, a simple and an automated information system (WEBRIS), which provides a suitable environment for SME sustainability reporting, is developed. Finally, this system is verified in a case study of the Czech breweries sector.

1. Introduction

Sustainability reporting (SR) is a global trend that engages companies in the disclosure of their overall economic, environmental, social and governance impacts and efforts [1,2]. At the current stage, it is primarily only the large companies who are involved in sustainability reporting practices. Corporate sustainability reporting has been the subject of extensive researches in recent decades. One widely used definition of corporate sustainability reports identifies them as a public report made by companies to provide internal and external stakeholders with a picture of the corporate position, as well as and activities in the economic, environmental and social domains [3]. The principle of sustainability, as introduced in many visions and approaches, aims at the support of sustainable development and the prevention of economic crises [4].
SR is also a voluntary organization’s activity, with two general purposes [5,6]: an assessment of the current state of an organization’s economic, environmental and social dimensions, and the communication of the organization’s efforts and sustainability progress to their stakeholders. It can be used for assessing corporate sustainability performance over time [7], benchmarking against other organizations [8], and demonstrating how the organization is influenced by expectations about sustainable development [9]. In additional, in the last few years, investors have been more and more interested in those investments wherein the rules of socially responsible investments (SRI) [10] are being applied, which are in agreement with the company’s social responsibility (CSR) [11]. In order to assess those investments, environmental, social responsibility and corporate governance (ESG) evaluation criteria are very often applied [12]. Corporate social responsibility (CSR) is a concept which was coined in the latter half of the 20th century, in the context of the growing expectations that corporations would assume their share of responsibility for the improvement of life-quality in the sphere of their business [13]. The first pillar of socially responsible conduct is the environment (single-pillar conception), which was later supplemented with the social element (two-pillar conception), and today’s variant also includes economy as the third pillar (3P concept—People, Planet, Profit) [14].
Small- and medium-sized enterprises (SMEs) [15,16,17,18,19], despite their significant impacts on the European economy, employment and environment, show low levels of engagement due to several barriers, which include technical issues related to expensive data collecting and processing, the difficulty of monitoring and measuring appropriate sets of sustainability indicators, business risks due to disclosures that competitors and regulators may take advantage of, the difficulty in determining the sphere of the organization’s influence, and the lack of resources allocated to this activity. Because of the important effects of SMEs that impact the European economy, small and medium enterprises need a method or procedure for measuring, controlling and improving their performance. Such a procedure of effective and efficient management should be simple and efficient, and should integrate various viewpoints on the performance in environmental, economic, social and governance terms [20].
A good sustainability assessment system depends not only on the quantity and the quality of reported information, but also on its flexibility and its ability to adapt to future changes and improvements in the sustainability reporting field. To achieve the desired features, the reporter should pay attention to the following points:
  • The sustainability report should reflect not only the positive but also the negative aspects of the organization under scrutiny.
  • The reports should be accurate and prepared in a way that allows stakeholders to analyze changes in the organization’s performance over time.
  • A regular time schedule should be assigned for each report.
  • The information included in the sustainability report should be understandable, reliable, transparent, and accessible.
  • The report should be able to adapt to future improvements in its content.
In order to accomplish all the above-mentioned features, this research focused on providing a comprehensive, simple and accurate sustainability assessment report for SMEs. Our main aim was the developing and applying of an automated hybrid weighting model for the sustainability assessment of small- and medium-sized enterprises. In order to achieve this goal, several steps are considered. This research starts with a conceptual understanding and assessing of the current state (state of art) of different key performance indicators (KPIs), the methods of efficiency assessment and the information and communication technologies that are involved in measuring a complex enterprise’s performance and sustainability. The next step is determining a more appropriate set of KPIs for different enterprise sectors (brewery, agriculture, etc.), especially for SMB/SMEs. The concept and steps of complex enterprise performance measurement were mentioned in [21]. However, our research also concentrates on proposing a model of sustainability assessment. This model reflects all four dimensions of sustainability assessment (economic, environment, social and corporate governance). After that, the model is adapted to the particular requirements of the country and the industry in which the company operates. The proposed multi-criteria model for sustainability assessment is tested and verified using data collected from various sources and companies (agriculture, brewery, farms with biogas plants). Finally, for the simplicity and applicability of the model, a web information system Web Environmental Benchmarking and Reporting Information System (WEBRIS) is designed. It can help different SMB/SMEs to communicate with each other more easily and efficiently, to establish and maintain business relationships, and facilitate active participation in their decision-making. It is also able to automatically fill out the required information by communicating with different databases. It provides flexibility in the reporting process by offering different improvements to a set of reporting indicators, and determining the weight of each indicator on the calculated sustainability value. All small and medium companies will be able to easily calculate their sustainability and compare it with others, as well as specifying their weak points and determine the ways to solve them. This research will not only evaluate the companies via the traditional approach to sustainability assessment, by reporting a set of predefined indicators, but it will also provide a way of scoring their sustainability. However, at the current stage, sector dependency (brewery sector) is the most important limitation with regards to the proposed system, and so the final method, with an accurate indicator, can only be achieved after an initial market study and the setting of an appropriate set of indicators.

2. Materials and Methods

2.1. Sustainability Assessment Indicators

There are many frameworks for measuring corporate performance and its sustainability. The most widely used frameworks and international standards for sustainability reporting are summarized in Table 1. A number of studies [20,21,22,23,24,25,26] were also conducted.

2.2. Efficiency and Sustainability Assessment Models

In this section, the methods of environmental, social, governance and economic indicator assessment are outlined. The main objective of these models is improving the benchmark between the enterprises and facilitating active participation in their decision-making. These models vary according to their complexity and effectivity. The most basic models propose that all indicators and dimensions have a similar weight in assessing the enterprises performance [35], whereas more complicated ones require several statistical or mathematical analyses to be performed [8,36,37], or even artificial neural networks engagement [38]. For the construction of the evaluation model, economic value added (EVA), data envelopment analysis (DEA) and sustainability value added (SVA) are used.

2.2.1. Economic Value Added (EVA)

The EVA indicator from the perspective of financial management combines all the basic components required to describe the economic situation of the company [39]. EVA is used to determine the company’s value. It designs compensation structures for interconnecting the strategic and the operations management of the companies. It can be used not only for large corporations, but also for small business and entrepreneurial endeavors [39,40]. It is calculated according to the companies’ annual economic reports, by applying Equation (1).
EVA = ( ROE r e ) E
where E describes the market value of the firm’s equity, ROE is Net Income/E, and re is the Return of Entity which is computed according to Equation (2).
r e = WACC C A ( 1 T ) I D ( C A E A ) E A
where A, C, T, I, D and WACC are assets, invested capital, corporate tax rate, interest expenses, market value of the company’s debt, and weighted average cost of capital, respectively. Note that, a positive EVA value tells us that the studied company more than covered its cost of capital. A negative value indicates that the project did not make enough profit to cover the cost of doing a business.

2.2.2. Data Envelopment Analysis (DEA)

Data envelopment analysis (DEA) is a relatively new “data oriented” approach to evaluating the efficiency of a number of producers. In DEA, the producers are usually referred to as decision-making units (DMUs), which convert multiple inputs into multiple outputs. Relative efficiency is defined as a ratio of total weighted output to total weighted input. DEA can be used as a very powerful service management and benchmarking technique to evaluating nonprofit and public sector organizations [41]. The cross-efficiency evaluation has also been deeply studied. For example, [41] provided variety ways of assessing the efficiency of DMUs. It was concerned with developing measures of decision-making efficiency, with special reference to possible use in evaluating public programs (schools, non-profit firms and industries). The outputs and the inputs are usually multiple, and may also assume a variety forms that admit of only the ordinal measurements. The paper in [42] suggested mathematical formulations and intuitive meanings for three possible implementations of aggressive and benevolent cross-efficiency. It developed aggressive model formulations in order to identify optimal weights that not only maximize the efficiency of a particular DMU under evaluation, but also minimize (maximize) the average efficiency of other DMUs. The study in [43] presented an aggressive formulation for cross-efficiency evaluation, which aims at minimizing total deviation from the ideal point. A way of minimizing the maximum and the mean absolute deviations was also suggested by [43]. All these models were established on the basis of an unrealistic ideal point, which defines the best relative efficiency of one as the target efficiency of each DMU. This target efficiency, however, is only realizable for DEA-efficient DMUs, but not realizable for non-DEA-efficient units. Papers [44,45] applied DEA methodology to evaluate the performance of different organizations among the supply chain. The study in [46] developed a DEA model with rough parameters. This model can be used to evaluate the performance of a supply chain network. It proposes an approach to ranking the efficiency interval and the DMU with the smallest maximum loss of efficiency. The authors of [47] suggested a dual-role factors DEA model. In the case of evaluating n number of DMUsj (j = 1, …, n), each DMU consists of m inputs and s outputs, with xij (i = 1, …, m) and yrj (r = 1, …, s) values, respectively. Assume that a particular factor is held by each DMU of the amount wj, and this serves as input and output weights; the model can then be presented in Equations (3)–(5).
Max   θ k = r = 1 S u r y kr + γ w k β w k
Subject to
i = 1 m υ i x ik = 1
r = 1 S u r y rj + γ w j β w j i = 1 m υ i x ij   0 ,   j = 1 ,   2 ,   , n ,   u r ,   υ i ,   γ ,   β 0 ,   r , i
where u r   and   υ i are the weights given to the output r and the input i, respectively, and γ and β are the weights given to the dual-role factor. DMUk consumes xik (i = 1, …, m), the amount of input i, to produce yrk (r = 1, …, s), the amount of output r. Let us consider the cross-efficiency evaluation, wherein each DMU determines a set of input and output weights individually, leading to n sets of weights for n DMUs. The n sets of weights are used to assess the efficiencies of n DMUs, resulting in n efficiency values. Then, the efficiency values for each DMU are finally averaged as an overall efficiency value of the DMUs [48], denoted by u r * ( r = 1 ,     , s ) and u r * ( r = 1 ,     , s ) , as the optimal solution of Equation (3). Therefore, the dual-role efficiency of DMUk is computed according to Equation (6).
θ k * = r = 1 s u r * y kr + γ * w k β * w k
This value is the best relative efficiency that DMUk can achieve. Therefore, a cross-efficiency value of DMUj, which reflects the peer evaluation of DMUk to DMUj (j = 1, …, n; j ≠ k), is calculated according to Equation (7).
θ j = r = 1 s u r * y rj i = 1 m υ r * x ij

2.2.3. Sustainability Value Added (SVA)

Sustainability value added (SVA) is an effective method of sustainability assessment. It plays a strategic role in decision-making. It encourages the companies to deal with resources more effectively and efficiently. It represents the extra value created as a result of using economic, environmental, social and governance resources, compared to a benchmark. It can be expressed in absolute monetary terms [49].
There are a lot of studies involved in sustainability calculations for different sectors, using different approaches. A comprehensive effort to develop a methodology of Sustainable Value Stream Mapping (Sus-VSM), in order to evaluate economic, environmental and social sustainability performances in the manufacturing sector, was presented in [50]. The existing metrics for sustainable manufacturing performance assessment are examined in order to identify the essential criteria and metrics to be included in Sus-VSM. The effectiveness of the method is validated through its application in an industry case example. The ecosystem input–output model was combined with the economy input–output model to calculate the ecosystem costs of excessive fossil fuel energy [51]. The model enables one to calculate costs and prices in relation to the ecosystem resulting from anthropogenic fossil fuel energy use. The authors of the publication in [52] presented their sustainability assessment research, using the IDEA method applied to French agricultural organizations. This method, as described by the authors, is capable of observing differences in sustainability between production systems, as well as within the same production system. The development of a new high-temperature aero-engine component, which illustrates how sustainability assessment identifies hotspots and clarifies the potential sustainability consequences of a new product technology, as well as how Net Present Value is used to assess alternative solution strategies based on the hotspot to facilitate early-stage decision-making in the design stage, was studied [53]. Another method of sustainability assessment was published by [49]. The environmental or social value added (EnVA, SoVA) was calculated by the following several steps. It starts with the calculation of the gross value added of the company (in Euros). After that, the amount of each environment or social resource is determined (e.g., tons, m3, etc.). Then, the efficiency is computed by dividing the gross value added by the amount of resources (unit Euro/tons, Euro/m3). The same steps should be done for the benchmark. Finally, the achieved values for both the company and the benchmark are subtracted from each other, and the result is multiplied by the amount of the considered indicator. Therefore, the environmental or social value added is expressed as a product of the value spread and the level of the used resources.

2.3. Information Systems for Sustainability Assessment

One of the problems faced by sustainability reporting is the processing of massive corporate data that refers to not only the volume, but also the variety, veracity and velocity, of change. The quick and effective management of this data becomes the main challenge for the implementation of the architecture. For this purpose, two technologies, business intelligence (BI) and eXtensible Business Reporting Language (XBRL), are used. This Information and communications technology (ICT) has the advantage of a quick and easy optimization feature in its process of data extraction from the central database.
There are a lot of tools that have been created as a part of sustainability assessment. The Sustainable Development Analytical Grid (SDAG) tool, to support decision-making that allows assessment of sustainability performance based on six dimensions (ecological, social, economic, ethical, cultural and governance), was presented in [54]. It explores the strengths and weaknesses of the company, and suggests improvements to increase the performance through the time. The SDAG fits into a complete and integrated range of tools, called Systemic Sustainability Assessment, which ensures structural consistency in assessing sustainability, by taking into account various dimensions, prioritizing multilevel actions, integrating inputs from different stakeholders, evaluating and continuing improvement in an iterative approach, and ensuring accountability at all levels.
Life cycle assessment tool (LCA) [55]: LCA evaluates the environmental burdens associated with the life cycle of a product, process or activity, by identifying and quantifying the flows of materials and required energy and their emissions into the environment, and therefore their sustainability environmental impacts.
Social life cycle assessment tool (S-LCA) [56]: A main characteristic of S-LCA, compared to other techniques, is that it covers the whole supply chain. It also helps to improve the social conditions of the involved stakeholders across the life cycle of a product, and has implications for the process, systems and services beyond the product-bound impact. The objective of S-LCA is to promote the social conditions of the stakeholders and the provision of the socio-economic benefits of the product based on its entire life cycle.
Public goods tool (PG): The PG tool was suggested by [57] as part of a project funded by the United Kingdom government and Natural England project. It was developed to provide a simple, measurable and accessible way of showing public goods that come from different farming systems. It identifies a variety of agriculture-related “public goods” in England, against which the tool would assess each individual farm: soil management, biodiversity, landscape and heritage, water management, manure management and nutrients, energy and carbon, food security, agricultural systems diversity, social capital, farm business resilience, and animal health and welfare.
Ecological footprint: This idea concentrates on determining a foundation for sustainably embedding a process into the ecosphere, also called the Sustainable Process Index (SPI), which evaluates processes according to environmental capacity [58]. The results of ecological footprint calculations can be interpreted on a per-unit-of-product basis (kg), or equivalent area (ha) [59]. It points to important environmental aspects and provides useful decision support. One of the various ecological footprint evaluation methods is the Sustainable Process Index (SPI), which was developed by [58].
Carbon footprint calculators: Carbon footprint calculators are one way of measuring the amount of carbon generated by agricultural businesses and sequestered by the soil and biomass on the land. There are several free online examples of carbon calculators available to farmers and growers. For example, the Farm Carbon Calculator, which was implemented by [60]. It was initiated by organic horticultural growers in the UK, and hence provides a better understanding of organic horticulture. The calculator is comprehensive and takes into account carbon sequestration, backed up by scientific studies.
Multi-Criteria Decision Analysis Tools (MCDT): Multi-Criteria Analysis (MCA) [61] is used for assessments in situations where there are competing evaluation criteria. MCA identifies, in general, goals or objectives, and then seeks to spot the trade-offs between them; the ultimate goal is to identify the optimal policy. A lot of multi-criteria tools were implemented. The typical example of these tools is the SAFA tool, which reports on economic, environmental, social and governance dimensions. It consists of four phases of SAFA assessment (Mapping, Contextualization, Indicators and Reporting). These phases define the resources needed, and the responsibilities of the assessment team. It is important to follow them consequently, because each phase is the basis of the following one. The final output of SAFA assessment is the performance report, which contains both a descriptive and an analytical review of the assessed entities, based on all the information that is filled out during the previous steps.

3. Results

In this section, our proposed three-phase system for sustainability assessment is presented. These phases can be summarized as follow:
  • Phase 1 is indicators collection and selection. It includes determining the available, suitable and efficient set of the KPIs for small and medium enterprises (SMEs) that can be used in sustainability assessment. This process starts after performing a deep study of the barriers that make the sustainability reporting for SMB/SME a challenging process.
  • Phase 2 is an improved sustainability assessment model. The suggested model should reflect all the dimensions of sustainability assessment (economic, environmental, social and governance), and be able to determine the sustainability level of the studied enterprises. This model is verified on a selected market segment.
  • Phase 3 is a web-based portal for corporate sustainability evaluation. This phase is considered to automate the assessment process, and encourage SMEs to perform sustainability reporting. It will be deployed for free use and data collection.
The first two phases are captured in Figure 1, which depicts in detail the followed steps for both enterprise efficiency and sustainability value added calculation. It starts with a huge set of different economic, environmental, social and governance indicators, which are filtered and combined in the processing stage. The output of the first phase is a set of KPIs which are involved in the enterprises benchmark. The second phase consists of DEA analysis and the sustainability assessment model. The outputs of this phase are presented as enterprises efficiency (EE) and sustainability value added (SVA) parameters. Finally, the third phase is devised to automate all the possible processes involved in the first two phases. This includes, but is not limited to, EVA, DEA, efficiency and sustainability value added calculation. It can be useful in modifying the used set of KPIs according to business needs, or automating data extraction processes from different databases. The blue block illustrates the covered operations in the current automation system.

3.1. Phase 1: Indicators Collection and Selection

The objective of this phase is to identify the sustainability KPIs that reflect the current practices of different company sectors. Two main criteria are met in the KPIs selection. The first one is the credible source. The second one is the usability of the selected KPIs by the majority of studied companies. Therefore, all the above-mentioned frameworks and sets of indicator for sustainability assessment are considered. These frameworks, and most of the studies with the suggested sets of different indicators, have a lot of drawbacks with regards to SMB/SME reporting. These drawbacks appear because of the huge number of indicators in each dimension that should be reported. Our research will focus on the availability and eligibility of these indicators.
Drawing upon the different frameworks, such as the GRI database and SAFA, as well as several papers [22,23,24,25,26,35], a basic set of KPIs related to the economic, social and environmental dimensions can be gathered. After that, a survey of specific companies should be performed. Then the most widely used indicators can been chosen, based on several statistical analyses. Chi-square can be used to determine whether the sample data are consistent with a hypothesized distribution [62]. Exponential Factor Analysis (EFA) can be applied to reduce the number of attributes and determinate the most significant factors. The correlation analysis is also important in determining the correlation between the indicators. The collinearity of the chosen KPIs should be studied. Finally, the set should be analyzed by a group of experts, in order to verify which indicators of each dimension can be combined to provide more valuable benchmark information (for example, in our model we suggest the EVA indicator to reflect the economic state of the company, which consists of various above-mentioned economic indicators). Drawing on the above suggested analysis, the most available, suitable and efficient KPIs can be selected.

3.2. Phase 2: Improved Sustainability Assessment Model

As mentioned above, the main objective of this model is the improving of the benchmark between the enterprises, and the facilitation of active participation in decision-making. This phase aims to propose an improved method of sustainability value calculation. It employs important and widely used financial aspects (e.g., EVA), and new data-oriented analysis (e.g., data envelopment analysis), for evaluating the efficiency and the sustainability of a number of companies. This model reflects the specific requirements of the country and the industry in which the company operates. The environmental value added (EnVA) can be calculated by applying Equation (8).
EnVA = EVA c 1 N i = 1 N ( EI i , c EI i , b EVA b )
Since the research supposes that a comprehensive sustainability value is a combination of four dimensions (economic, environmental, social and governance), and the EVA indicator combines all the required components to describe the economic situation of the company, the sustainability value added can be presented using Equation (9).
SVA = EnVA + SocVA + GovVA
where EnVA, SocVA and GovVA represent environmental, social and governance value added concepts, respectively. By formulating EnVA, SocVA and GovVA equations, and combining them in Equation (9), the comprehensive sustainability value added can be calculated according to Equation (10).
SVA = 3 EVA c 1 N i = 1 N ( EI i , c EI i , b EVA b ) 1 M j = 1 M ( SI j , c SI j , b EVA b ) 1 K k = 1 K ( GI k , c GI k , b EVA b )
where EI, SI and GI are the values of environmental, social and governance indicators, respectively. Symbol b refers to the benchmark, while symbol c refers to the studied company. According to Equation (10), increasing the value of the environmental indicator, “for example the amount of hazardous waste”, will negatively affect SVA. Increasing the economic value added of the company in turn increases the SVA value. In order to add more improvements to the proposed model, we supposed that different indicators do not equally affect the company score. Therefore, each indicator should have a different weight in the sustainability calculation. This weight differs according to the country, size, sector and indicator usability. The implementation of this improvement can be done by applying Equation (11), where wi,avg, wj,avg and wk,avg are the weights of i’s environmental, j’s social and k’s governance indicators.
SVA = 3 EVA c 1 N i = 1 N ( w i , avg EI i , c EI i , b EVA b ) 1 M j = 1 M ( w j , avg SI j , c SI j , b EVA b ) 1 K k = 1 K ( w k , avg GI k , c GI k , b EVA b )
In this model, the benchmark company (the most efficient) and the weight of each indicator are extracted using the DEA model. More information about these calculations can be found in [63]. Finally, the model can be more improved by adding the effects of positive and negative indicators.
SVA = 3 EVA c 1 N i = 1 N [ ( 1 ) χ ( w i , avg EI i , c EI i , b EVA b ) ] 1 M j = 1 M [ ( 1 ) χ ( w j , avg SI j , c SI j , b EVA b ) ] 1 K k = 1 K [ ( 1 ) χ ( w k , avg GI k , c GI k , b EVA b ) ]
In the case of hazardous waste, which should be treated as a negative environmental indicator, the effect on the sustainability value added should be negative, whereas increasing the number of employees should have a positive effect on the comprehensive sustainability value of the studied company. For this reason, Equation (12) describes the final version of the proposed sustainability assessment model. X = 1 when the indicator has positive effects, whereas X = 2 when there are negative indicator effects.

3.3. Phase 3: Web Portal for Corporate Sustainability Evaluation

The aim of this phase is to present the achieved web portal Web Information System for Corporate Performance Evaluation and Sustainability Reporting (WEBRIS). This portal can be adapted to various segments of the market by adding further sectors. It meets the following requirements:
  • It stores the data of all registered companies.
  • It provides all required calculations according to the selected sector with its assigned model.
  • It generates all kinds of economic, environmental, social, governance and sustainability reports.
  • It provides selected information in the form of reports accessible online to all registered accounts.
  • It provides selected information in different formats, like PDF, EXCEL, and the standardized XBRL format, to be interchanged with other systems. It is able to dynamically generate the XBRL taxonomies for a given report.
  • It provides the possibility of evaluating the company EP anonymously, and compare reports among the companies of the same sector.
Regarding the requirements of availability, the system was implemented as a web application. Hypertext Preprocessor (PHP) was selected as the language for the application implementation. Model View Controller (MVC) [64] (framework Nette), which allows us to divide the application into particular modules and thereby ensure the sustainability of future development, is also considered. The framework also allows the use of the Access Control List (ACL) model, which has already been implemented. The ACL model allows the definition of the roles, and their subsequent assignment to particular users. Due to the requirements of authentication and authorization, the user roles (Administrator, Company and Public user) are treated. Since the WEBRIS application is also focused on collecting questionnaires and generating reports, it is necessary to use databases where all information can be saved, and the report calculations can be done. Because of the complexity of the calculations, MySQL was involved.

WEBRIS Architecture

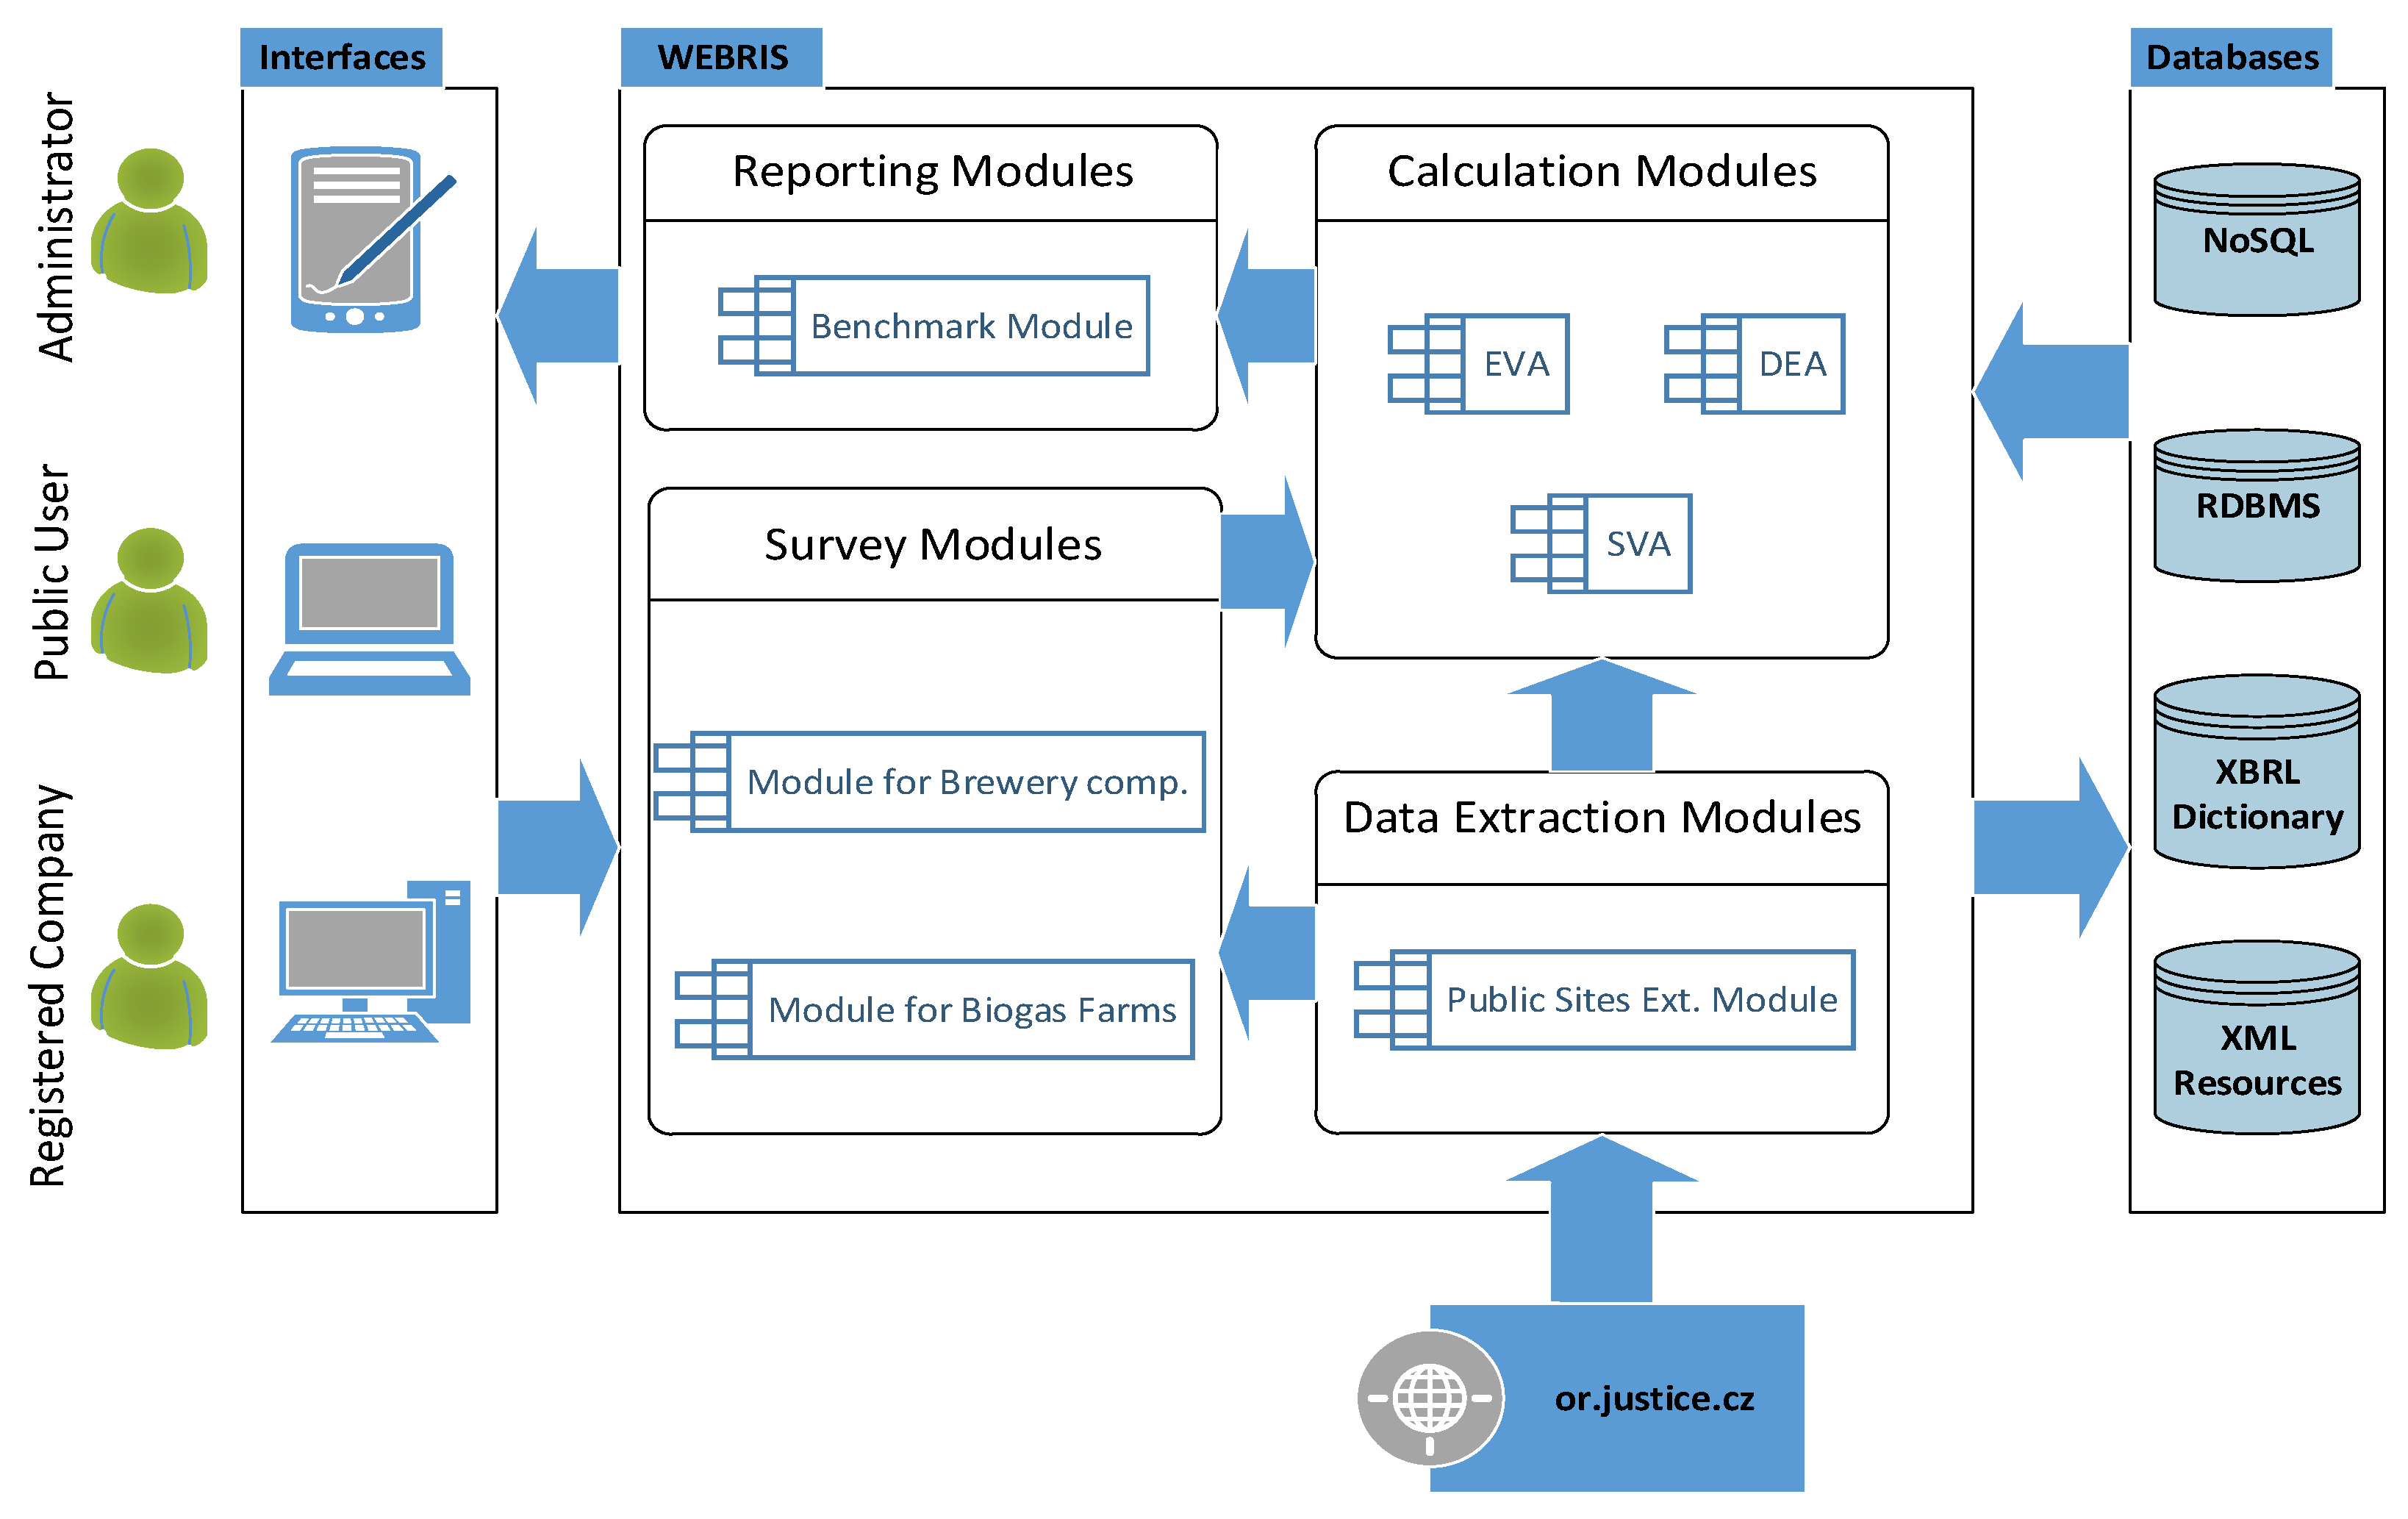
The portal WEBRIS is defined as a set of modules. It includes modules with a clearly defined contract, i.e., a list of provided and required services. Therefore, WEBRIS architecture is combined with the MVC architecture. The reason for interconnecting it with the MVC architecture is that within a module which contains business logic, the necessary overhead logic can occur. This is intended to render the output from its application (web site). Therefore, the logic of the system is divided into three layers (presentation layer, application layer and data layer). All these layers and included modules are depicted in Figure 2.
Presentation Layer: The presentation layer is provided by Latte templates, which allow a better adaptation of the HTML code. Common visual elements of the information system are allocated to a separate file, and included in each partial template. At the level of view, twitter Boot-strap is also used. It provides a responsive image even in mobile devices. Data Layer: The data layer includes all the available data storage of the built system. The data storage is carried out by a group of databases, divided into four main databases. The NoSQL database is used for storing intermediate data calculations required for sustainability assessment. In our system, the required calculations are EVA, DEA (both efficiency and weights of KPIs) and SVA. A relational database system (RDBMS) is used in order to store information about companies, questionnaires and KPIs values. The system is also complemented with databases for the XBRL Dictionary and XML Resource. It is possible to query via both SQL and XQuery languages, because the data layer exposes their interfaces. Application Layer: The application layer provides the high interoperability of the WEBRIS. This happens because of the wide range of available APIs that are required to connect the database to various sources. This layer can be divided into four main groups of modules. The first group, “Survey”, collects questionnaires for different companies. In the case of an achieved system, this group is divided into two modules. One is related to the Czech brewery sector, and another to the biogas farms. In each of these modules there is a template with a pre-defined questionnaire, designed to detect the specific information needed for KPI calculation. It is possible to easily add additional modules in the future. Each of these modules can be responsible for a new set of indicators to be implemented for additional company sectors. This module can also communicate with other modules so as to obtain information from linked open data from public sources [65].
The Data Extraction group performs the automatic acquisition of values needed for KPI calculation. At the moment, this group contains only one module (the public site extraction module). This module is created to automatically obtain the necessary information from other sources. It is used to prefill or supplement the questionnaire automatically, so the company will be able to complete only the missing data. This can help SMEs save time, or ensure more accuracy and transparency. This module performs a connection to the linked open data of the Czech eGovernment website (or.justice.cz) [65], from which it draws the maximum information required by the questionnaire form. Unfortunately, due to the fact that linked open data websites do not have a defined Application Programming Interface (API), this module must parse the website at the level of the Document Object Model (DOM). Subsequently, the required document with the necessary information can be downloaded; moreover, this document is subjected to optical character recognition (OCR), i.e., optical character reader. It is necessary to transform data from the PDF format, using OCR (scanned document), to a plain text format, which is then parsed and automatically added to the questionnaire form. The whole procedure of data acquisition can take several minutes because data cannot be acquired while filling in the questionnaire. The information is implemented via a specific method of the module interface. The Calculation group contains several predefined models that are responsible for all system calculations. It consists of the EVA, DEA and SVA modules. The Reporting group consists of the benchmark module. This module performs the evaluation of the companies, and displays all the achieved results, like EVA value, efficiency, and sustainability assessment of SMEs. It is also able to depict companies’ weak points, and find out which indicator is responsible for sustainability deterioration. This module allows us to export the final report in both XBRL and PDF formats.

3.4. Case Study: Czech Brewery Companies

The brewery sector is one of the most important markets in the foodstuff industry of the Czech Republic [66]. Since Czech brewing has a long history and tradition, beer has always been one of the most significant parts of Czech culture, holding a special position among other commodities. Moreover, the Czech Republic has the highest beer consumption per capita in the world. Czech beer is also the country’s second most important attraction for foreigner people, after the historic places [67,68]. Accordingly, Czech breweries play a major role in the economic and social dimensions of the country, being one of its most significant contributors to economic values and employment rates.
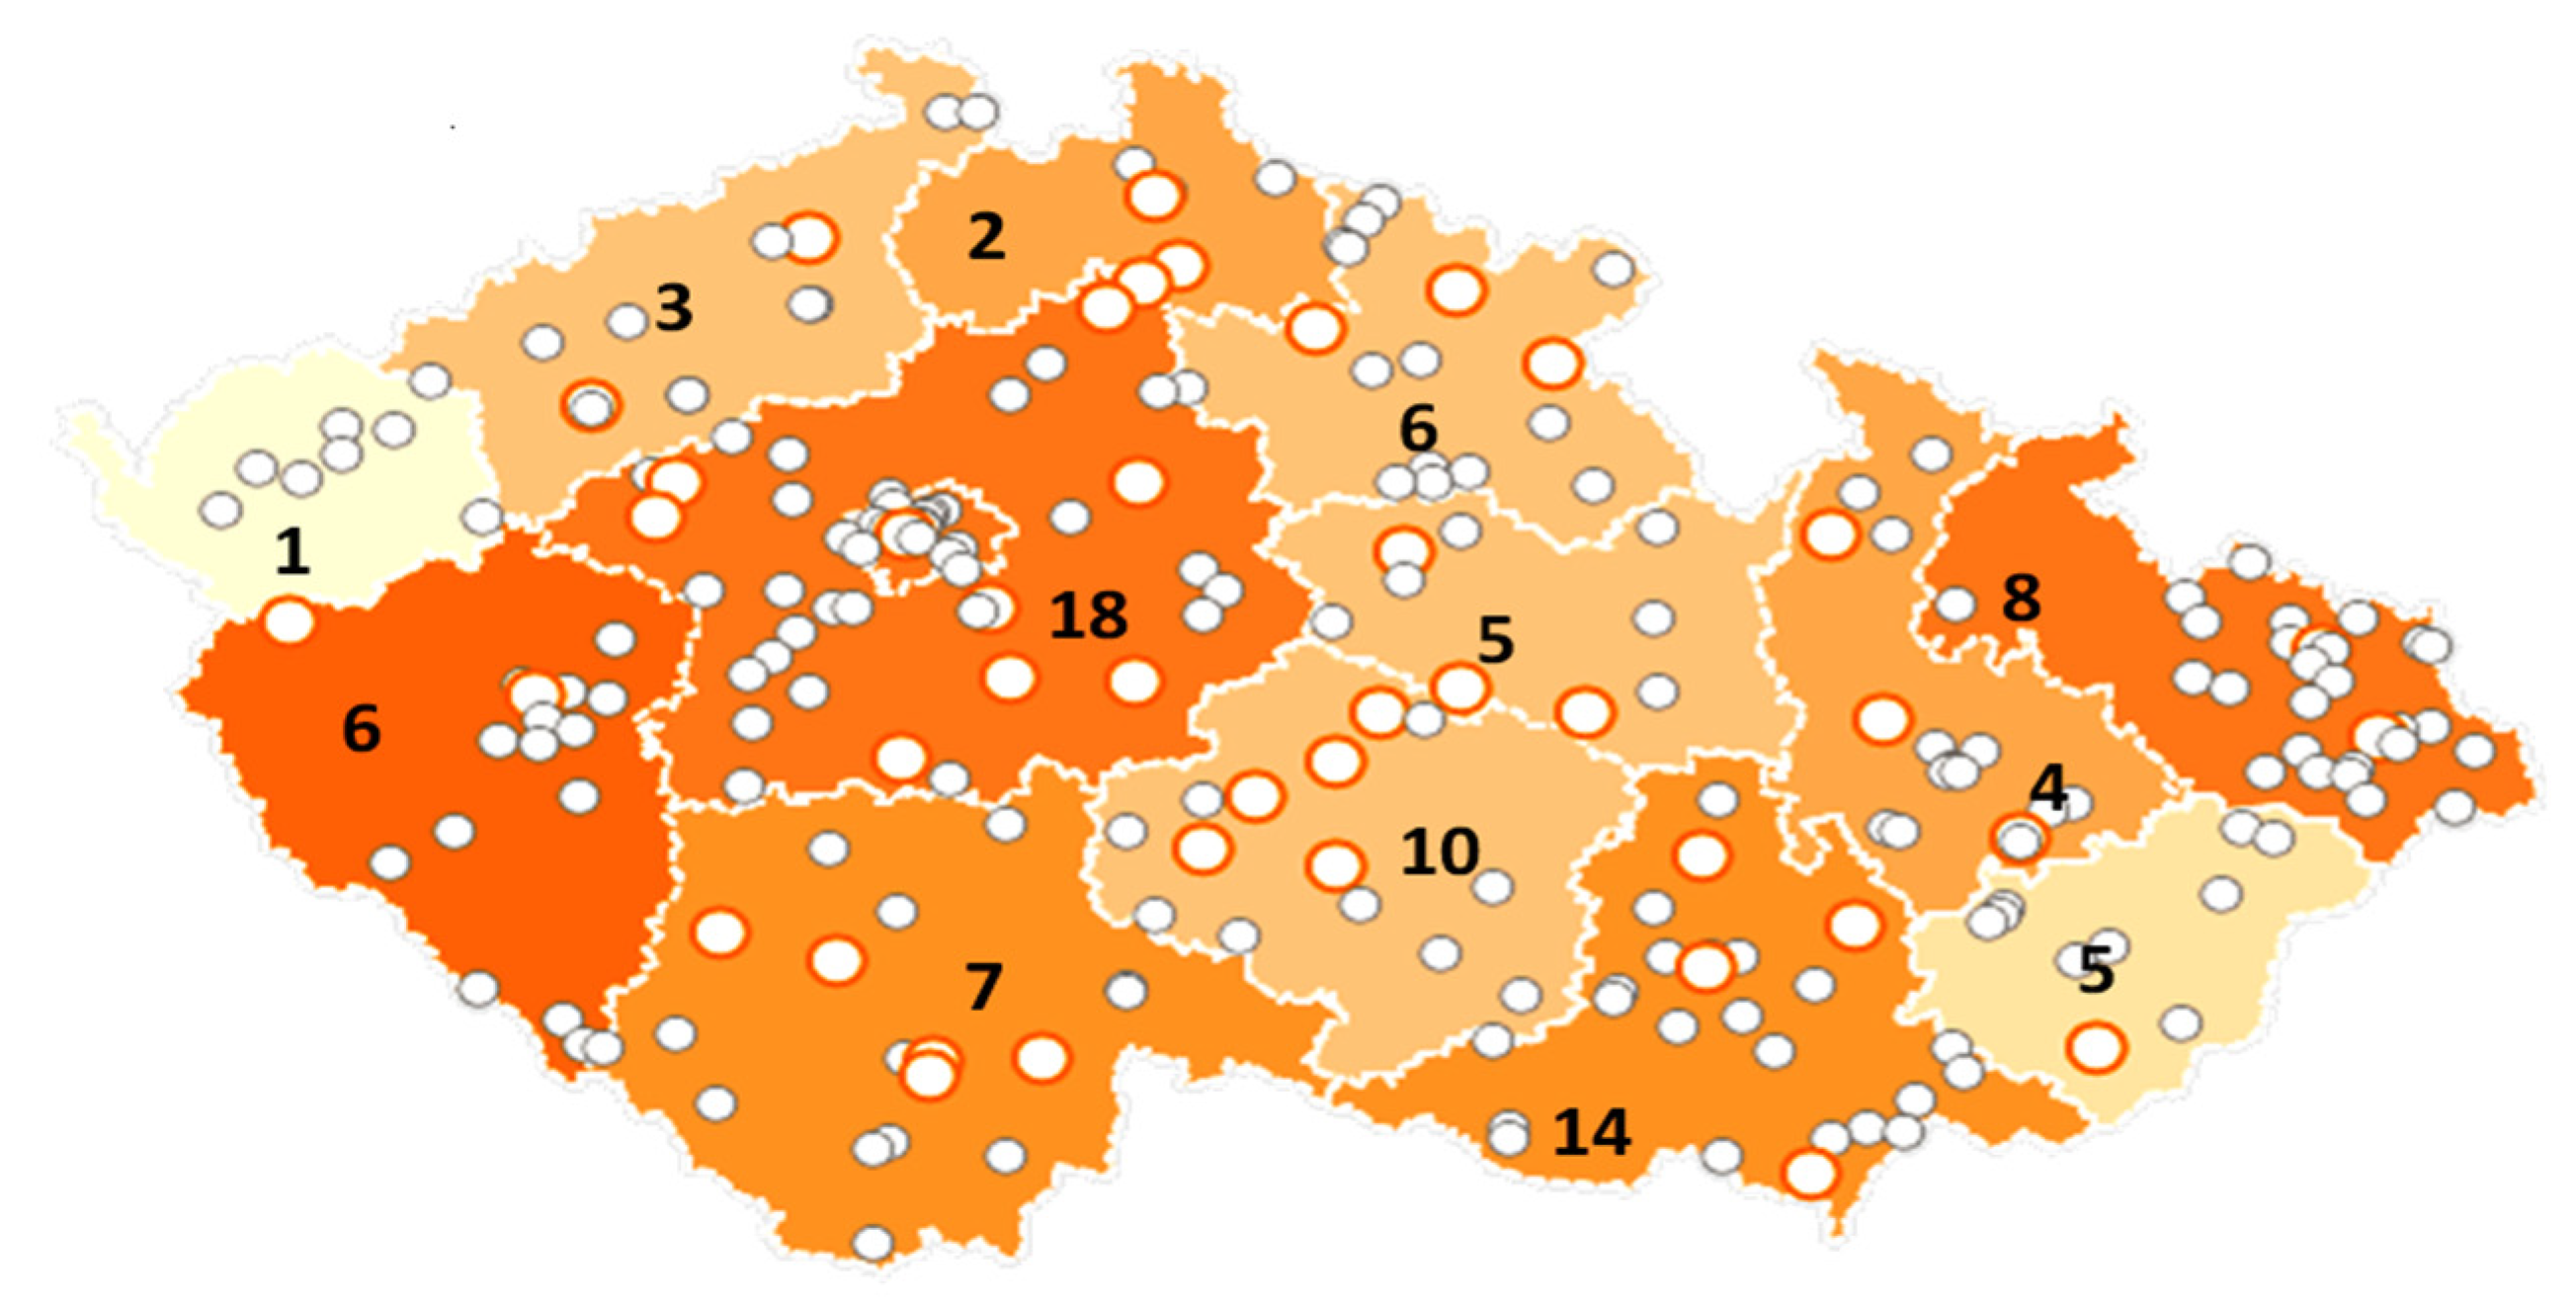
Therefore, the aim of this section is to apply the proposed method of sustainability assessment to the data set of Czech breweries, in order to demonstrate its output. We started with determining the suitable KPIs. Consequently, over 230 brewery companies in the Czech Republic have been tested in a survey using pre-defined questionnaires. This represents approximately 68% of Czech breweries in 2014 [69]. The collected responses involved approximately 89 companies (39% response rate). Figure 3 presents the numbers of assessed breweries in the individual regions of the Czech Republic; 15.73% were from the South Moravian (SM) Region, 4.49% from the Olomouc Region, 5.62% from the Zlin Region, 8.99% from the Moravian Silesian Region, 11.24% from the Vysocina Region, 5.62% from the Pardubice Region, 6.74% from the Hradec Kralove Region, 20.22% from the Central Bohemia Region, 7.87% from the South Bohemia Region, 6.74% from the Plzen Region, 3.37% from the Usti Nad Labem Region, 1.12% from the Karlovy Vary Region and 2.25% from the Liberec Region.
In order to help the breweries understand, measure and communicate their comprehensive sustainability, the main four performance pillars (economic, environmental, social and governance) should be included. Two previously described frameworks, i.e., GRI [27] and DVFA [29], present a lot of indicators related to the economic, environmental, social and governance pillars. Reporting on all these indicators is a big challenge, because collecting and managing data is a very difficult and expensive processes. Therefore, the optimal set of indicators is determined. This was done by applying quantitative research concerning the most frequently used indicators from each pillar (dimension). For this reason, a chi-square test with df = 1 degree of freedom is applied to the achieved data from 89 Czech breweries. The responses were tested against a significance value p < 0.05. The output set of indicators that do not violate the condition of the p value is presented in Table 2. Exponential Factor Analysis (EFA) is frequently used to reduce the number of attributes to a more manageable number of underlying constructs, and to determinate the most significant factors. In this research, EFA was performed using the principal component and the Varimax rotation methods. The purpose of using it in this context is to reject the collinearity between the chosen KPIs, and present their significance levels. After applying the factor analysis of 13 studied indicators to 89 Czech breweries, the correlations between the indicators are depicted in Table 3. Notice that EC, EN, SO, and GO represent economic, environmental, social, and governance indicators.
The cross-correlations are less than 0.8 [70], therefore no collinearity is considered. Table 4 presents the effect of each added indicator on the whole model. Therefore, EC1 is the most powerful indicator, with 20.295% of the total data variance. EN4 has 14.033%, EN1 11.155%, EN2 9.103%, EN3 9.030%, SO2 7.604%, SO3 6.815%, SO1 5.984%, SO4 4.936%, GO1 3.816%, GO2 3.530%, GO3 2.454% and GO4 1.245%. It is observed that all indicators have a reasonable percentage of data variance; therefore, all KPIs will be considered as a part of the sustainability assessment.

3.4.1. KPIs Weights and Efficiency Calculation

The research was conducted on 151 reports submitted by 89 Czech breweries, which contain the responses to our questionnaires. It can be observed that the number of responses (reports) (Nr = 151) is greater than the number of companies (Nc = 89); this happens because some companies submitted the required information for several years. All information extracted from the survey outputs and different financial reports are analyzed and processed in order to achieve the required KPIs. The efficiency assessment is realized by applying the DEA model [presented in Equation (3)] to the whole set of available indicators. It computes the efficiency score of selected organizations (DMUs) using the linear programing in Maple. KPIs EN4, SO1, SO2, SO3, GO1, GO2, GO3 and GO4 are considered as the organizations’ inputs. The organizations’ outputs are the EC1, EN1, EN2 and EN3 indicators. In addition, the SO4 indicator is considered as a dual-role factor.
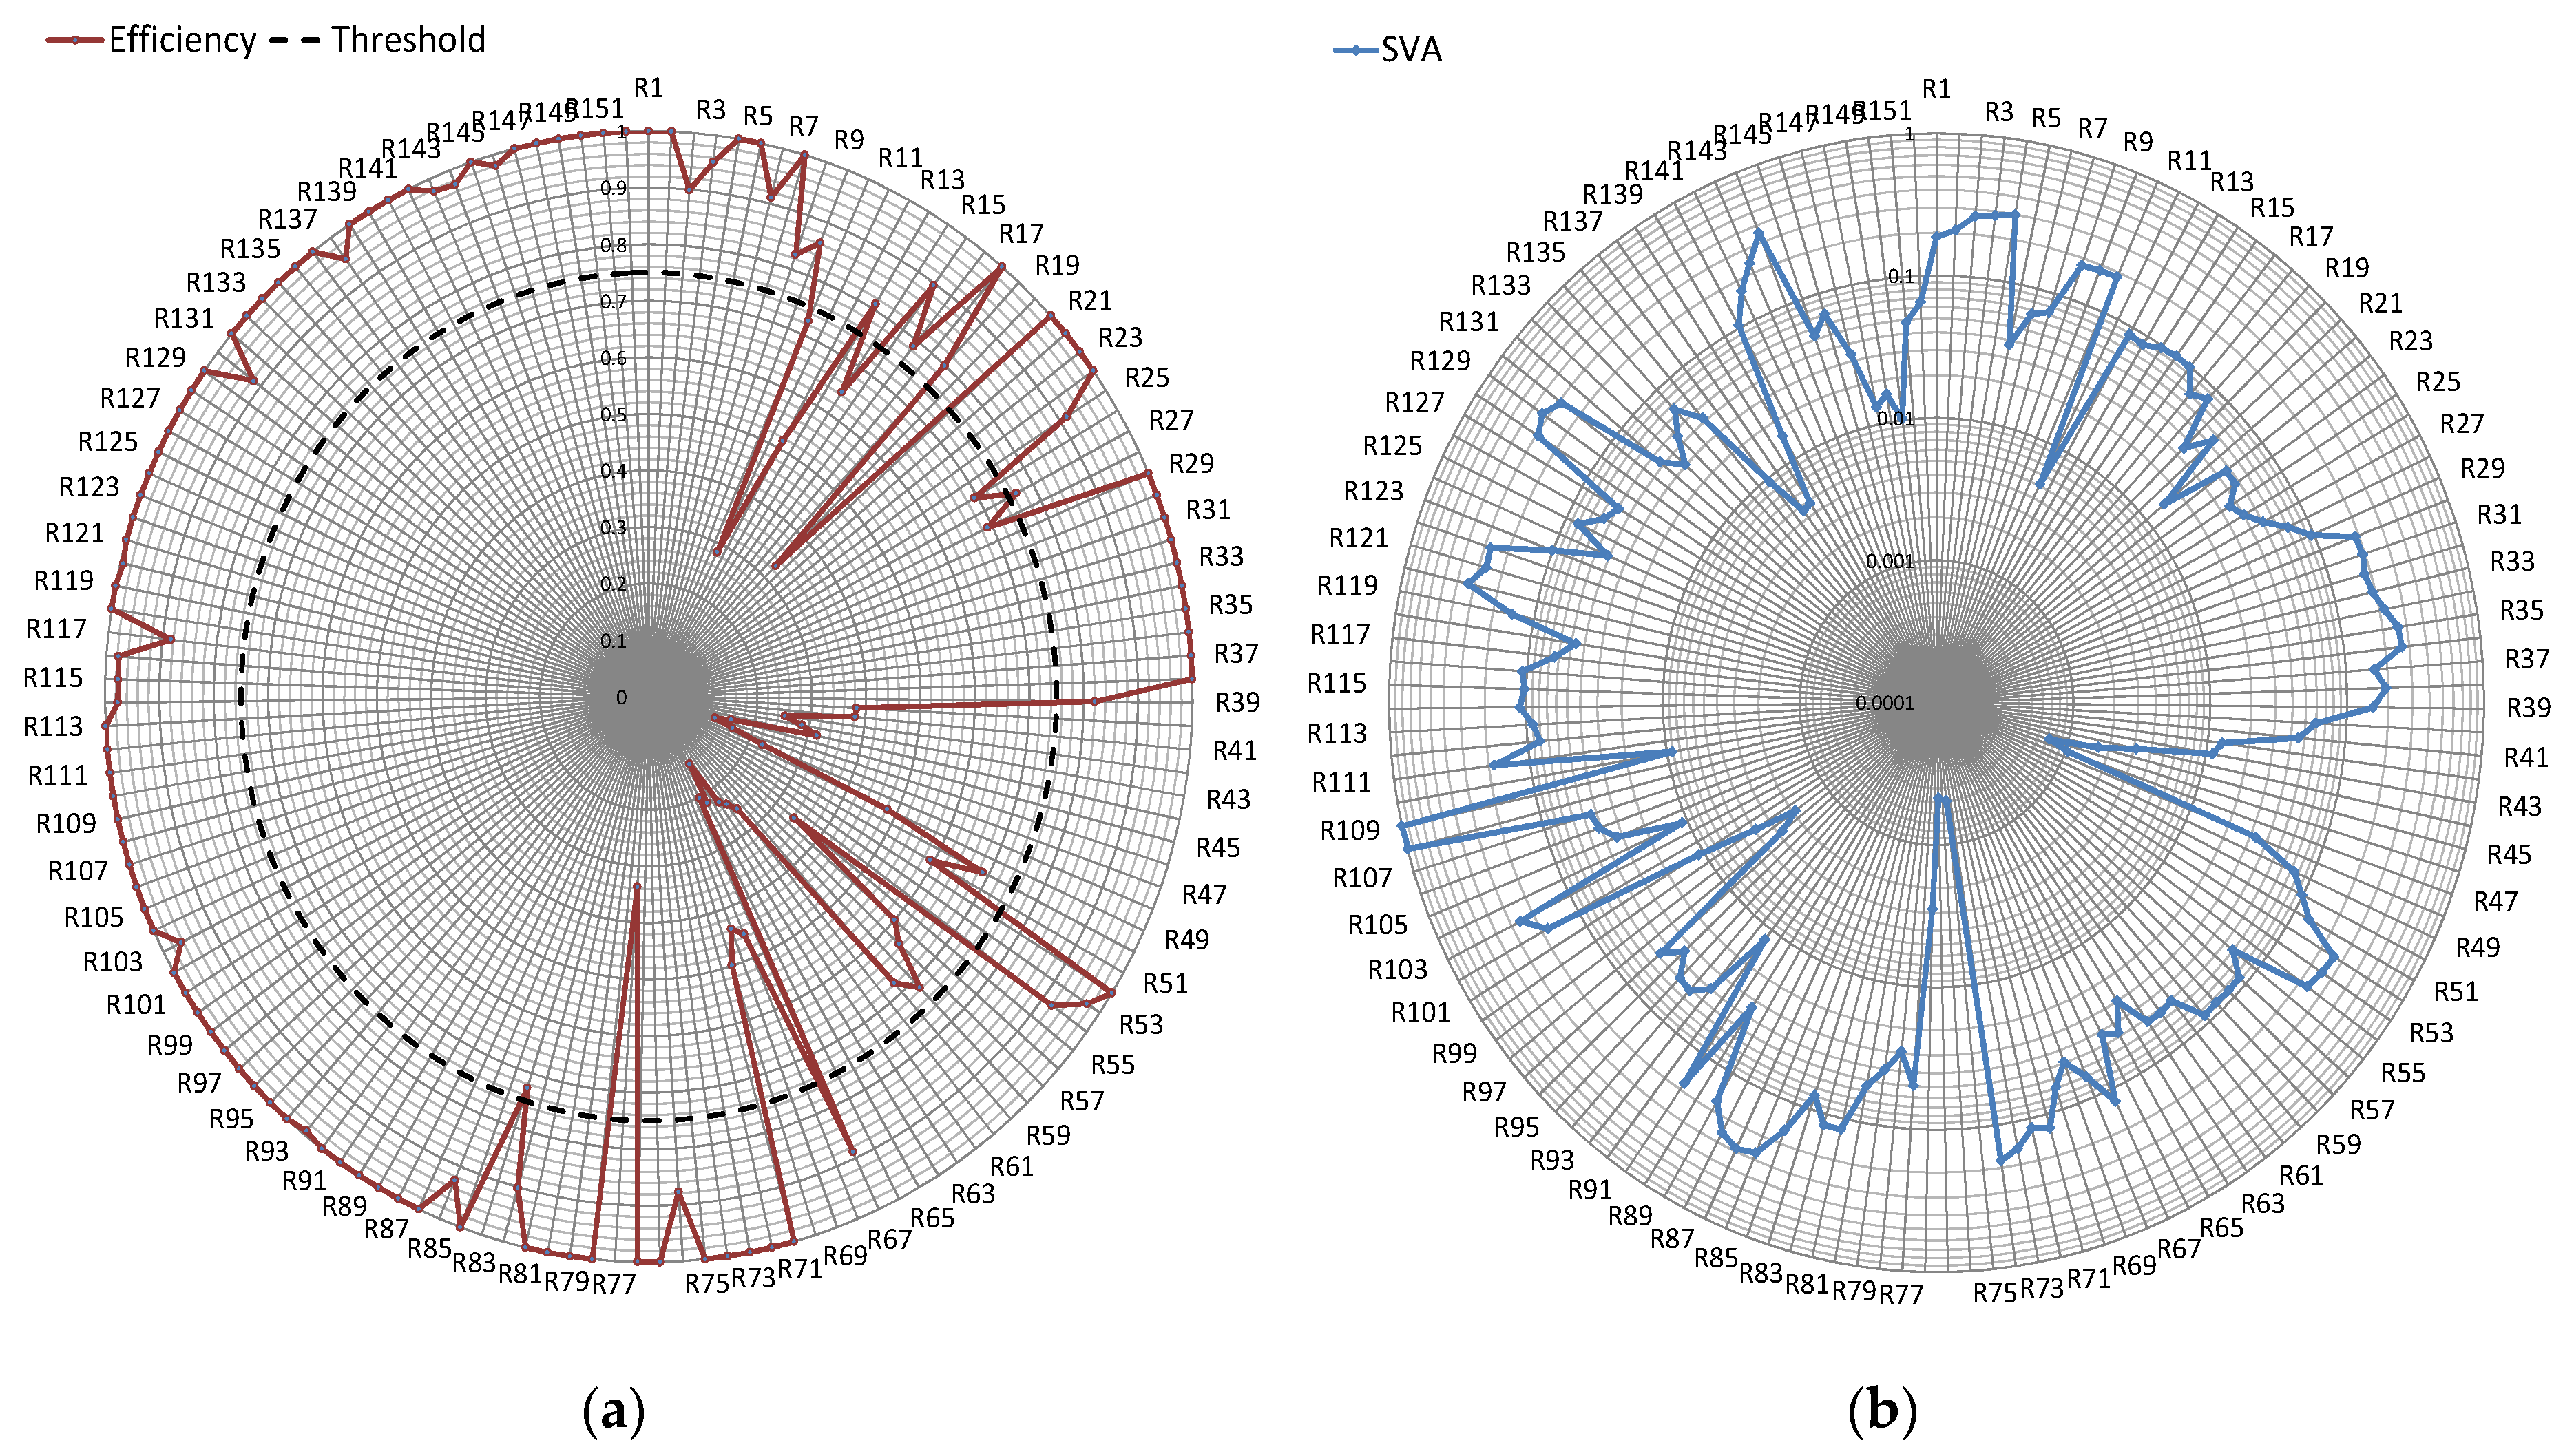
The result of this assessment (efficiency value) is presented in Table 5. In order to solve the visualization problem, two types of curves are depicted in Figure 4a. The dashed one represents the threshold of efficiency performance with a value of 0.75 [35], whereas the continued red curve represents the efficiency scores of studied breweries reports R1, R2, …, R151. The most efficient breweries had relative efficiency scores equal to 1. However, the least efficient report is R46, with a 0.127 efficiency factor. Basically, all the reports with efficiency factors less than 0.75 are considered to be inefficient. By applying the DEA model, the weights of the indicators are also calculated for each case of 151 reports (see Table 5). The average weight of each indicator will be used in the sustainability assessment. Therefore, different indicators do not equally affect the SVA score. These weights differ according to the region, size and sector, as well as the appearance of indicators in the assessed reports. More information about these calculations can be found in [63].

3.4.2. Sustainable Value Added Calculation

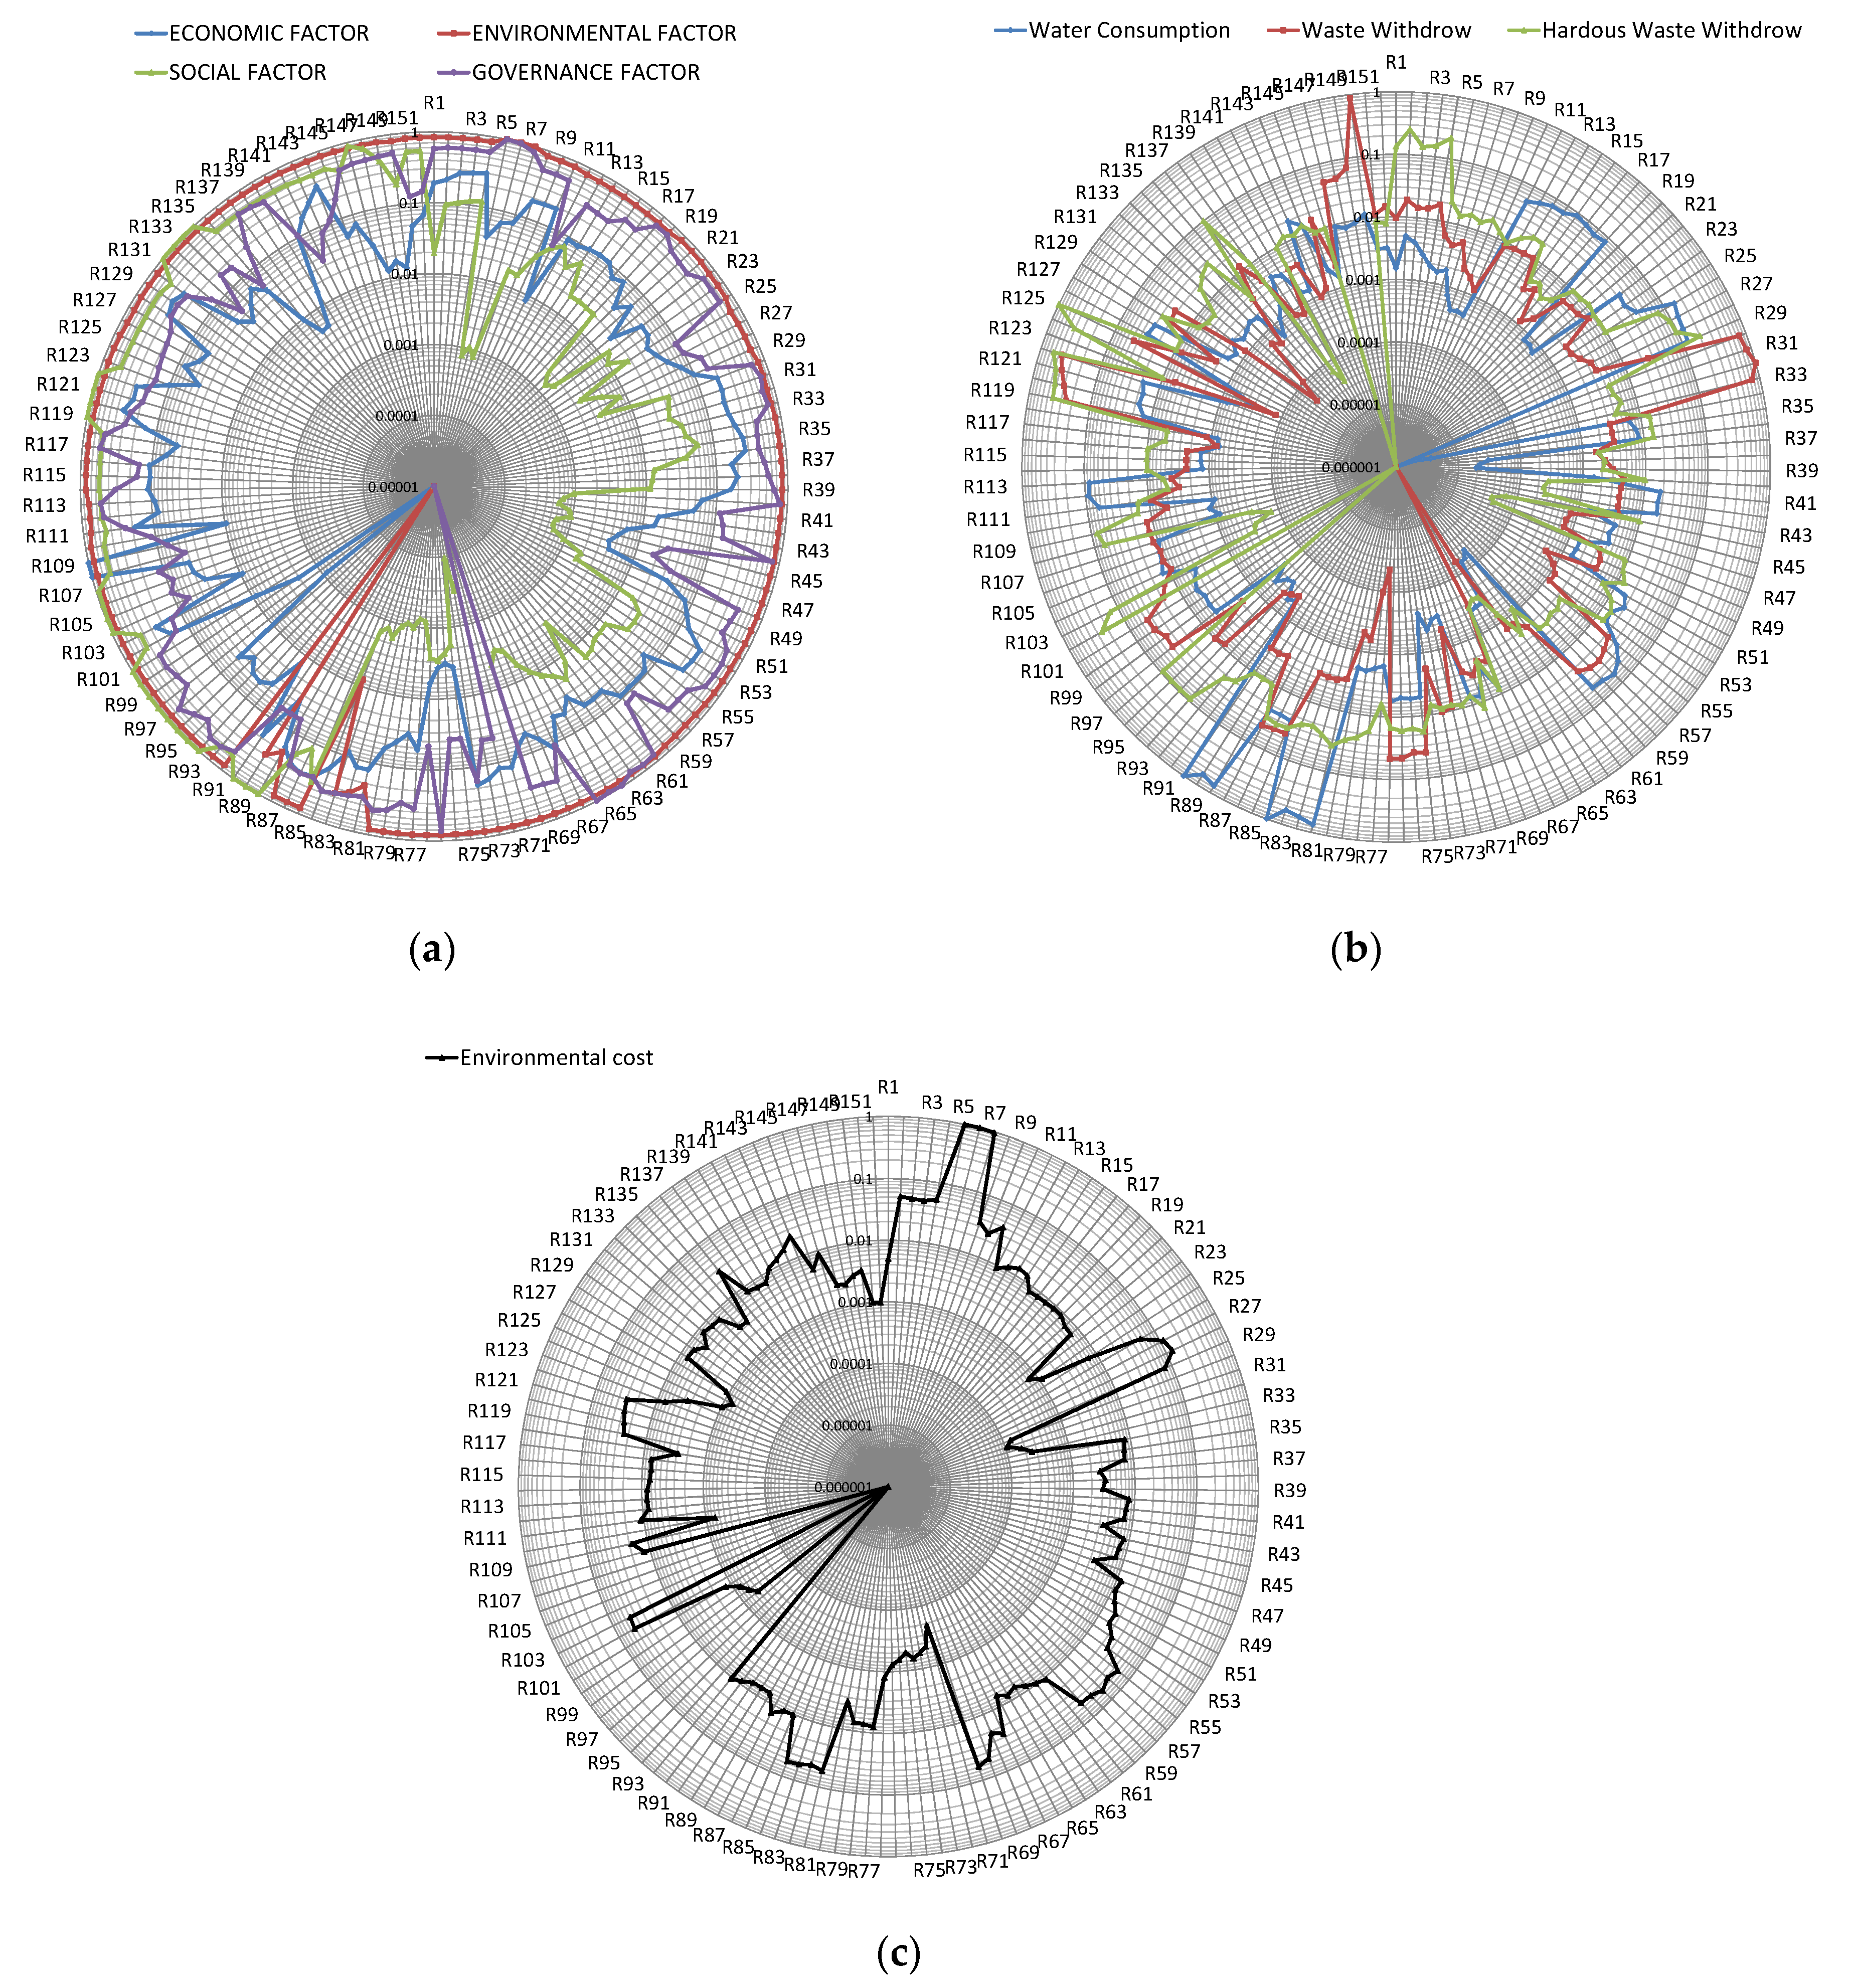
After gathering all the important information for SVA value calculation, Equation (12) is applied. Figure 4b presents a comparison of the sustainability assessment values for the 151 reports from Czech breweries (blue curve). By presenting this output, the breweries are able to compare all their own reports with the anonymous reports of all the registered breweries in the WEBRIS system. As was mentioned before, the company will not only be able to determine their sustainability performance and compare it with other organizations, but they will also be able to catch the weak points of their organizations. In order to do that, they must also be able to identify all the economic, environmental, social and governance factors that affect their sustainability. Figure 5a depicts another level of report comparison, wherein the breweries are able to compare between all the four sustainability pillars. By comparing all these values and determining the major cause of low sustainability (for example, the environmental factor), the company is able to go farther with their research, and even determine which indicator causes the degradation of this factor. Therefore, the brewery is able to plot all the indicators that contribute to the studied factor (dimension), and compare each of them with the indicators of other registered companies.
Figure 5b depicts the negative environmental indicators. By increasing their value, the overall sustainability will be decreased. Alternatively, Figure 5c describes the positive indicator. By increasing its value, the overall sustainability will be increased. All the curves plotted in Figure 4 and Figure 5 compare each report with all registered reports of Czech breweries, anonymously.
As is mentioned above, the previous sustainability assessments are conducted on 151 reports from 89 Czech breweries, where some of breweries have more than one submitted report (different years). However, for more accurate research, we tried to do the assessment on only the reports which belong to the same year. For this reason, two possible propositions were formulated:
  • Proposition 0: Sustainability assessment depends on the report itself. More than one report for one company can be involved in sustainability assessment.
  • Proposition 1: Sustainability assessment depends on the company. More than one report for one company cannot be involved in sustainability assessment. In addition, all the reports should have the same reporting period.
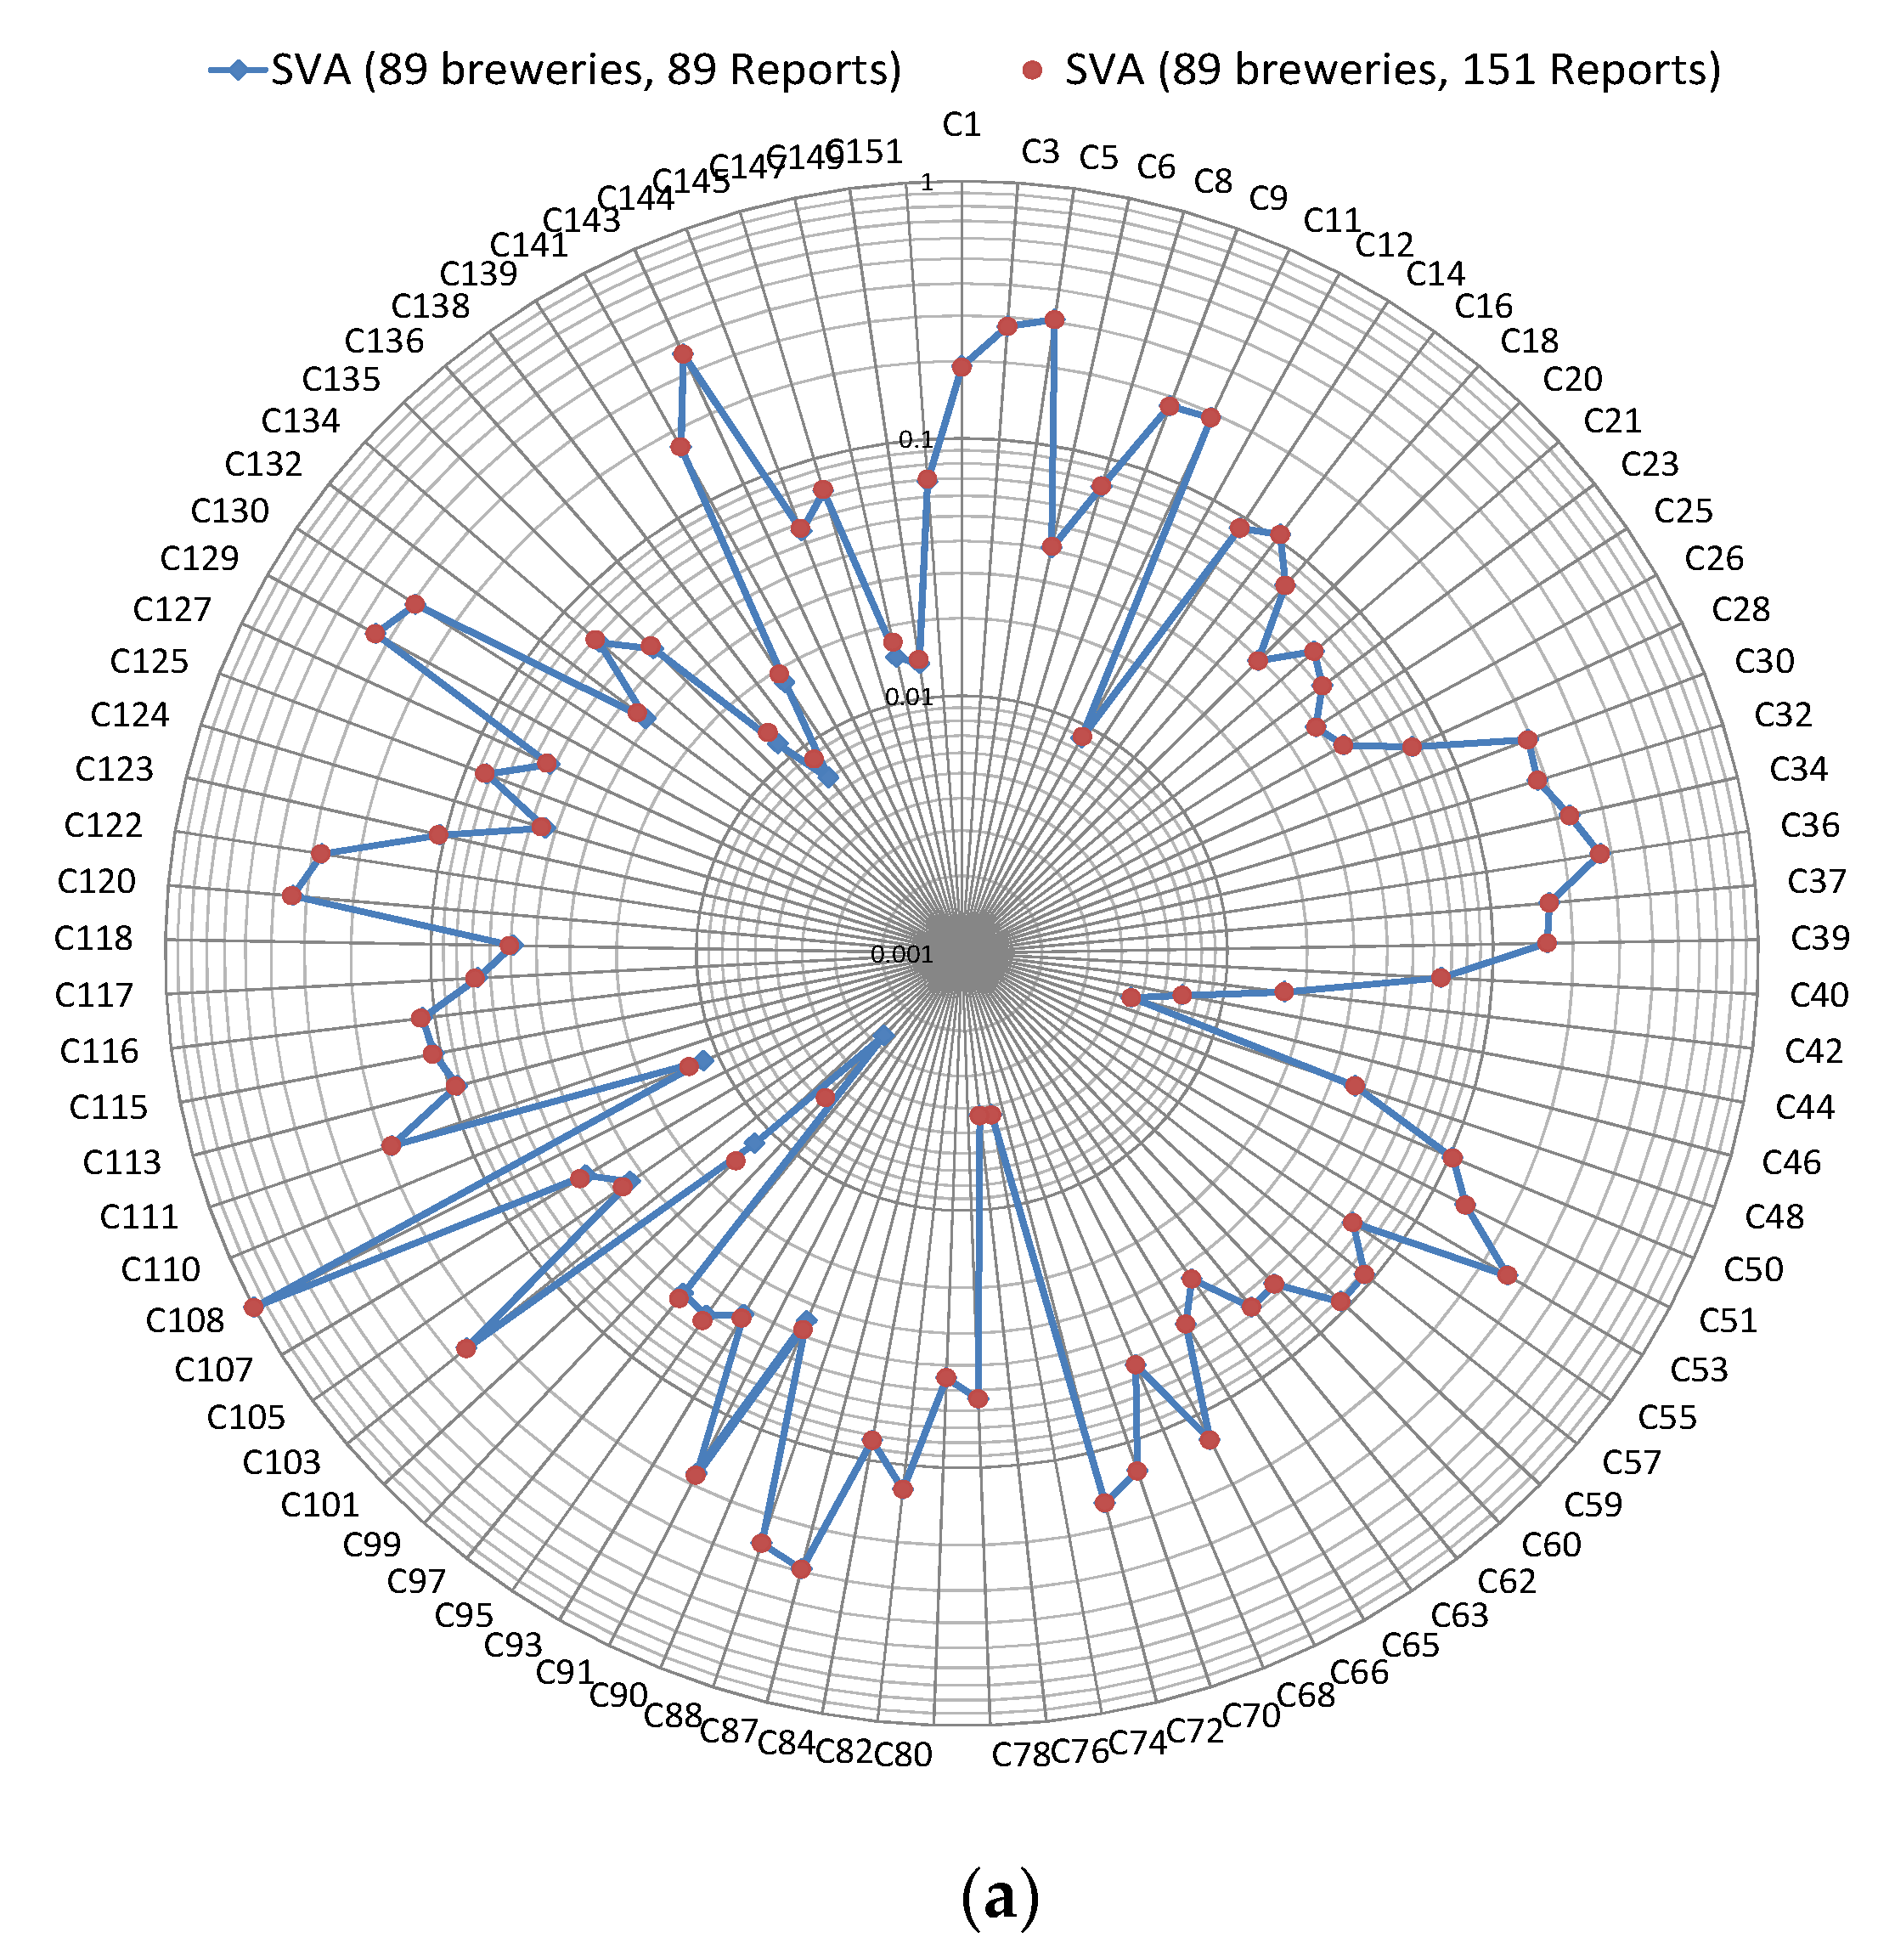
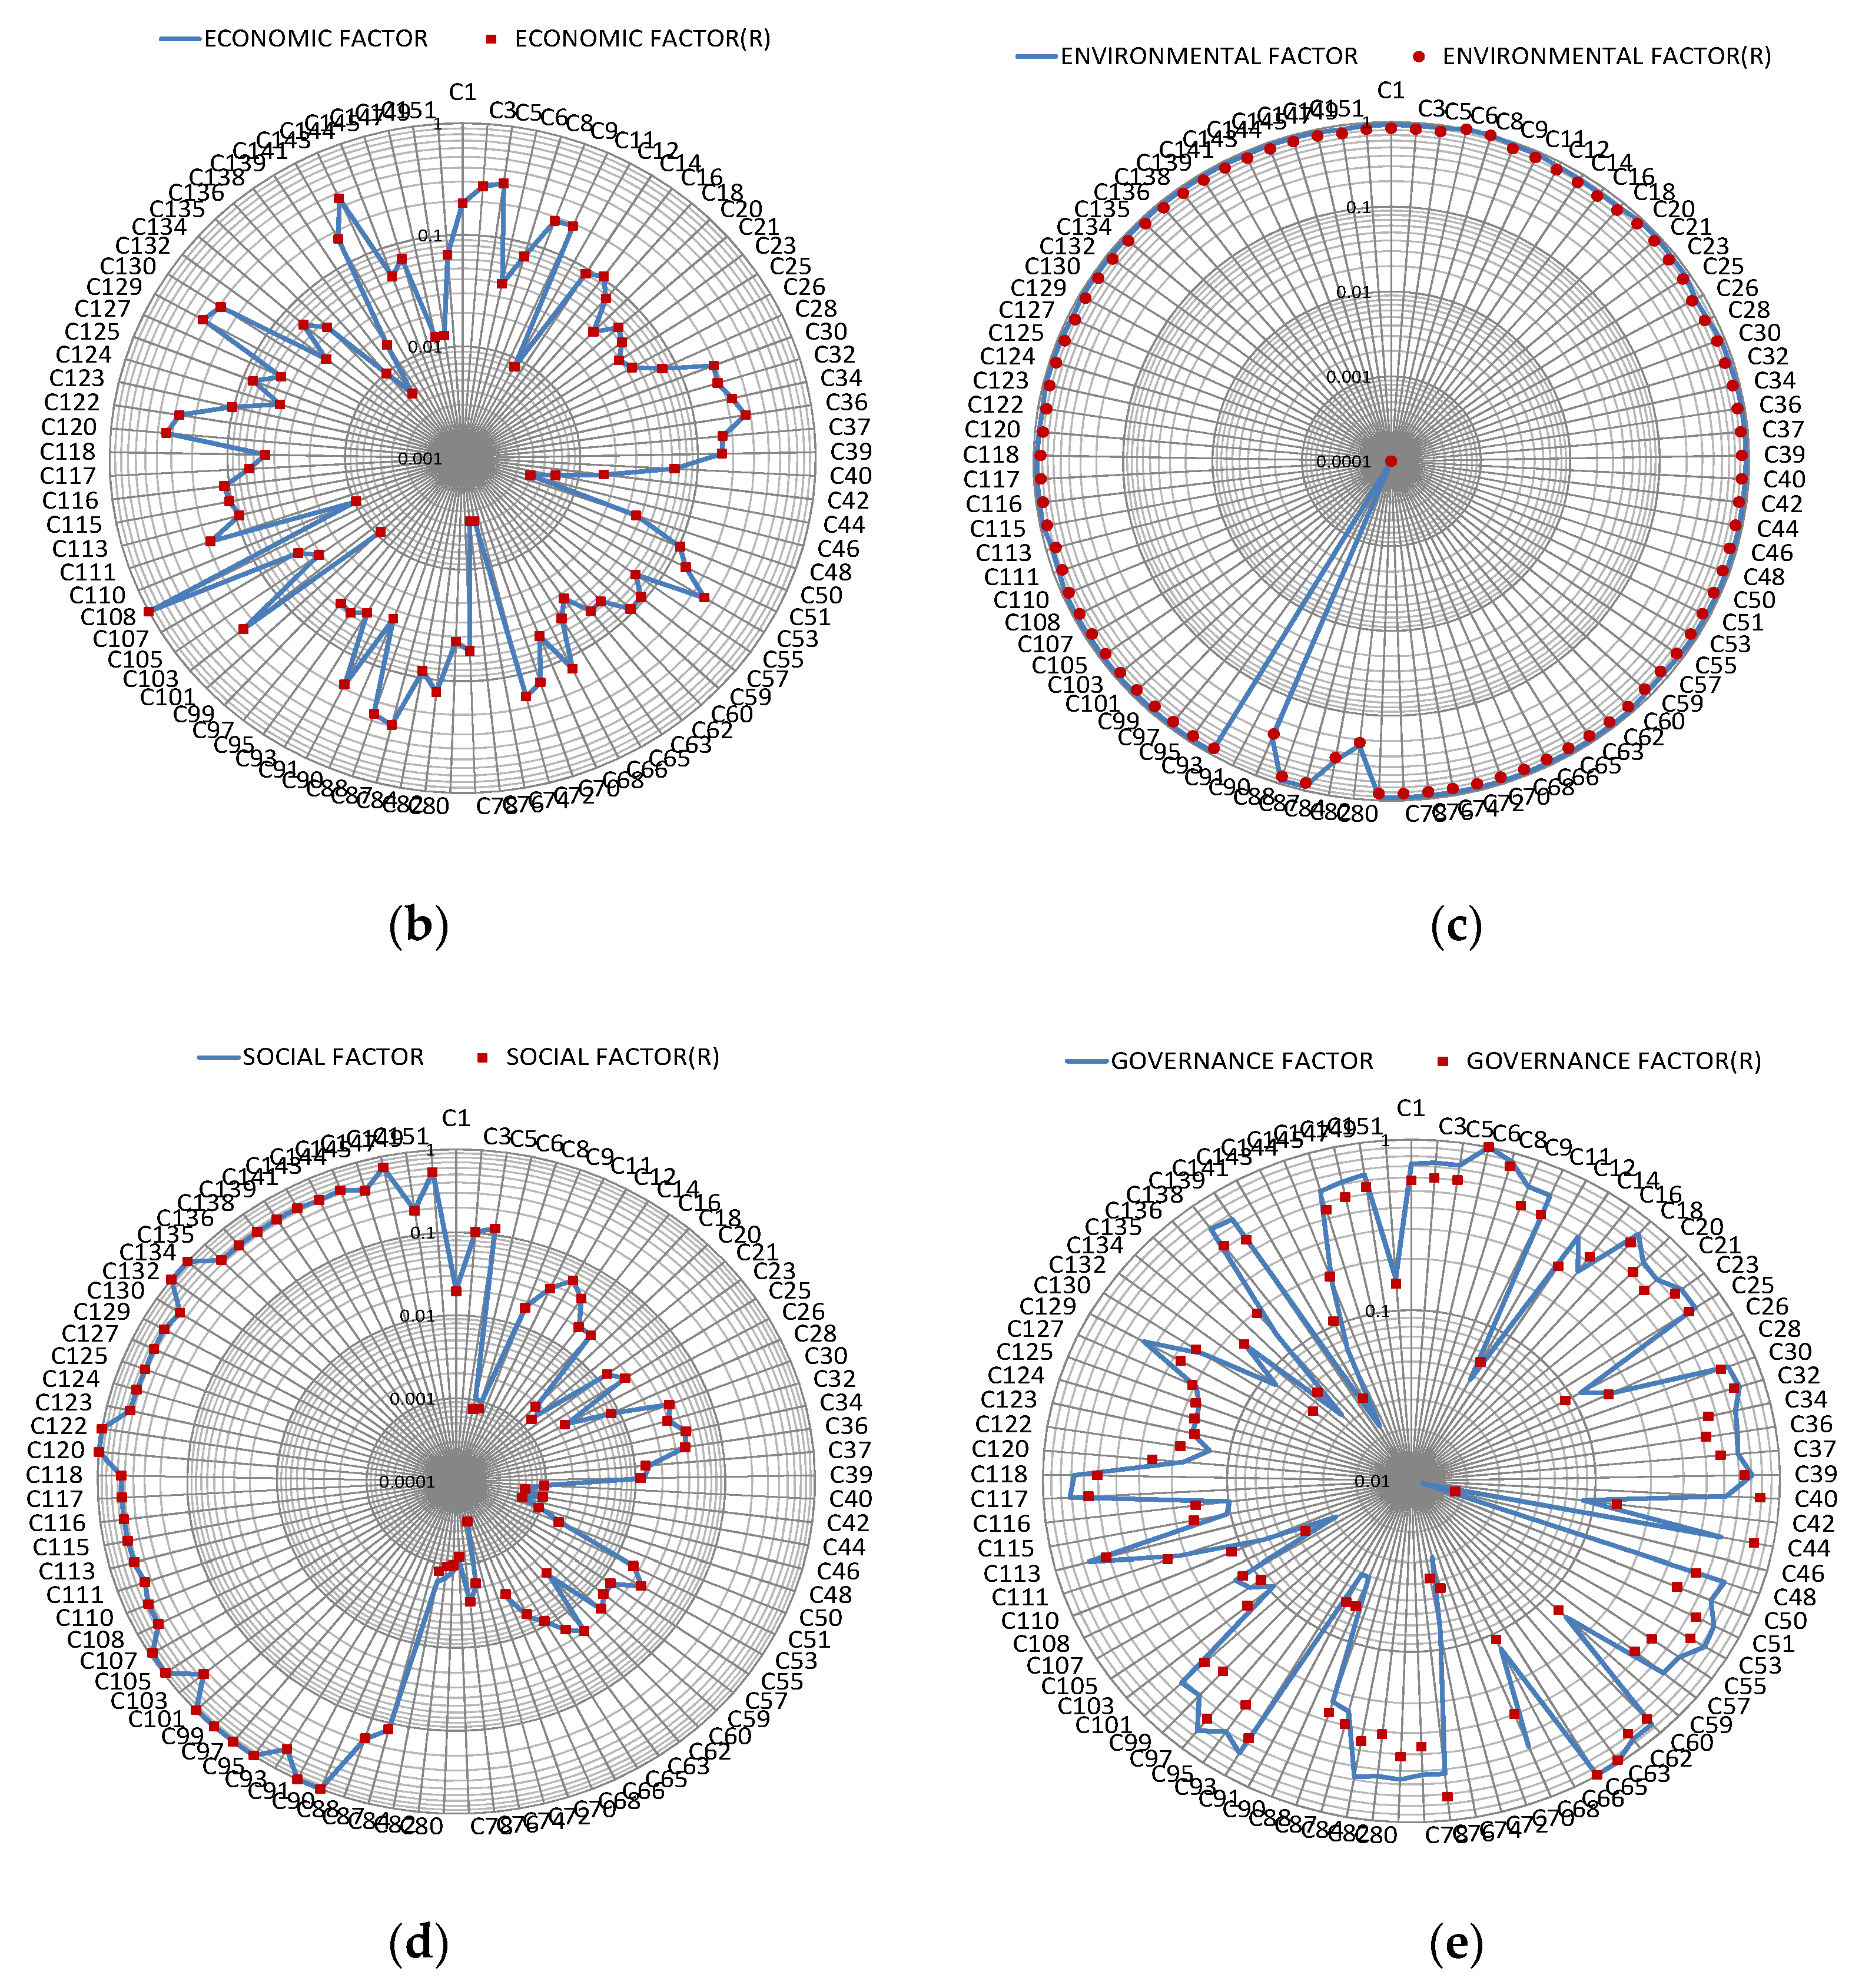
In order to confirm one of these propositions, each Czech brewery is allowed to have one report. Each report reflects the status of a company in a specific year. Therefore, 89 breweries, with 89 reports, are involved in the next assessment. After applying the same previous steps of sustainability assessment, which include calculating the efficiency and KPIs weights, the SVA value is calculated. The sustainability status of each brewery is depicted in Figure 6a (blue line). The red points represent the sustainability values derived from the 151-report assessment of the same 89 breweries (previous assessment). It can be observed from Figure 6a that the breweries will not have the same SVA values. This can be explained by the following: applying more or less reports can increase or decrease the weights of the indicators. In other words, each added case affects the whole sustainability assessment. Therefore, the proposed model is considered as an adaptive model. However, it can also be observed that the relations between different sustainability values will remain similar. That means that, if the company C3 is less sustainable than C5 when 151 reports are involved in the assessment, C3 will maintain a lower SVA value when specific-year reports for all breweries are used. The same characteristics are observed in the case of plotting the economic, environmental, social and governance factors. Figure 6b–e describe the differences between the values achieved when using one report for each brewery (blue line) and more than one report for each brewery (red dots) in the sustainability assessment process.
In conclusion, Proposition 0 is proven. Therefore, no matter how many reports each company has, they can be used together for the sustainability assessment. Subsequently, the company is able to compare its sustainability over ny number of years, as well as comparing it with other companies.

4. Discussion

Most of the presented tools, which are mentioned in Section 2.3, cover a maximum of one or two aspects of the overall sustainability dimensions. Carbon footprint calculators [60], ecological footprint [59] and the life cycle assessment tool (LCA) [55] are more oriented towards environmental indicators. The social life cycle assessment tool (S-LCA) [56] is socially oriented. The public goods tool (PG) [57] was invented for agriculture-related companies. On the other hand, there are several tools which are more comprehensive, called multi-criteria tools, like SAFA (environmental, social, governance and economic) and GRI (environmental, social and economic). SAFA was also created as an agriculture companies-oriented framework. The main restriction for SMEs is the high expense of data collection and managing. That is a result of the high number of KPIs which should be reported. It also uses a basic model, which dictates that all indicators and dimensions have similar effects in assessing the enterprise’s sustainability. The Global Reporting Initiative (GRI) is another comprehensive sustainability reporting framework, which provides a set of tools for different companies in different sectors. It consists of a massive number of indicators in the economic, environmental and social pillars. Processing massive corporate data, which refers to the volume, variety, veracity and velocity of change on the one hand, and a lack of the SME’s resources being allocated to this activity on the other hand, makes sustainability reporting for SMEs according to GRI a hard and time-consuming process. Therefore, SMEs need a method or procedure for measuring, controlling and improving their performance. Such a procedure of effective and efficient management should be simple and efficient, and should integrate various pillars of the performance, in environmental, economic, governance and social terms.
In this research, multi-criteria sustainability assessment is adopted. A new flexible model of sustainability performance assessment is proposed. This research captures all aspects of sustainability assessment. It evaluates sustainability in a comprehensive manner, by considering all its pillars (environmental, social, governance and economic). The proposed model includes the advantages of the most-used international frameworks. However, the KPIs are filtered to minimize their quantity and propose only the ones that contribute significantly to SMEs reports (sector-related). Therefore, a survey for a specific sector was conducted. Changing the number of involved enterprises influences the suggested indicators, which in turn affects the whole module. This part, though, is already fixed by the proposed automation system. In additional, this model uses weighted indicators for calculating an enterprise’s sustainability. These weights differ according to the region, size and sector, and the appearance of indicators in the assessed reports. The system makes sustainability reporting an available option for small and medium enterprises by combining comprehensiveness and simplicity in providing the required information. It contains the Data Extraction module, which allows the automatic acquisition of the values needed for KPI calculation in the reporting. At this moment, this group contains only one module (the public site extraction module). The module is created to automatically obtain the necessary information from other sources. It is used to pre-fill or supplement the questionnaire automatically, so the company will be able to check it and complete only the missing data. This can help the company in saving time and providing more accurate data. This module performs the connection to the linked open data of the Czech eGovernment website (or.justice.cz), which contains the economic indicators of the enterprise. There are other modules that help in DEA, EVA, EE and SVA calculations, which are mentioned in phase 3 and the proposed tool section.
The results of the proposed model need to be interpreted while taking into consideration the limitations of this type of analysis. These limitations arise mainly from the difficulty of capturing reliable data, the fact that sensitive information generates business risks that competitors take advantage of, companies’ policies and regulations, and the selection of the sample (here constrained to the brewery sector in the Czech Republic). Therefore, the achieved results are segment (breweries)- based, and cannot be extended to other segments unless a guided survey of the specific sector is performed. The above limitations will be mitigated in future studies, which will allow the proposed model to be both improved and adapted to different sectors.

5. Conclusions

The principle of sustainability assessment reflects enterprise management. According to this assessment, several important steps should be taken. This process can begin once the weak points of each enterprise are determined, and it ends when the best solution to achieving sustainable performance has been found. SMB/SMEs [16,19], despite their significant impacts on the European economy, employment and environment, show a fairly low level of engagement. This is happening due to the many barriers that the SMB/SMEs come across, which makes sustainability assessment a very challenging process. Because of the important effects that SMB/SMEs have on the European economy, there is a need for a simple, efficient method or procedure that can measure, control and improve their performance.
The brewery sector is one of the most important markets in the foodstuff industry of the Czech Republic [66]. Moreover, beer is the country’s second most important attraction to foreigners, the first being historical sites [67,68]. It follows that Czech breweries play a major role in the economic and social dimensions of the country, generating a very significant economic value and contributing considerably to the country’s employment rate.
This paper aims to provide an automated, comprehensive and simple sustainability reporting system for SMEs, by following three main steps. The first step is recognized as identifying and implementing a set of various key performance indicators, which can be involved in comprehensive sustainability assessment. In order to achieve a comprehensive sustainability assessment, four main dimensions (economic, environmental, social and governance) [27,36] were identified. Several statistical analyses were applied in order to encompass long-term issues and implement suitable KPIs for SMEs. Exploratory factor analysis (EFA) was performed using the principal component and the Varimax rotation methods. The purpose of using it in this context was to reject collinearity (factor loading is greater than 0.8) [70] between the suggested KPIs. A chi-square test [62] was used to calculate the significance (p value) of each indicator. The second step is the proposal of a new comprehensive method of sustainability assessment, which includes all chosen KPIs, in order to come up with a final sustainability level for the studied companies. As an example, a study was conducted on 151 reports from 89 Czech brewery companies. Both efficiency and sustainability values were depicted for 151 reports. The possibility of determining the weak point of each organization was also mentioned. The final step aims to simplify and automate the reporting process by implementing an information and communication system WEBRIS. This system is based on the currently used technology (HTML, PHP), with the support of XBRL as a native format. It is used for quick and efficient data aggregation, in order to calculate EVA, DEA and SVA. It is also able to extract data from public resources. Finally, according to all the above-mentioned outcomes and available functionalities, it can be concluded that, starting from now, sustainability reporting is more available, and SMEs can easily engage with it. All these results were part of the GACR P403/11/2085 project [71].
The authors believe that the provided study can help SMEs to improve their economic, social, environmental and governance performance by providing a simple means of sustainability reporting. The proposed model will have positive impacts on competitiveness between the enterprises. It identified KPIs for the selected segment of use (breweries) in the Czech Republic, with some adjustments that can be performed to ensure compatibility with other segments of EU enterprises. These adjustments can include revising the groups of indicators used in each sustainability dimension, and performing DEA analysis to discern a suitable weight for each used indicator. Our proposed system (WEBRIS) can make this modification an effortless and less time-consuming activity.

Author Contributions

Both E.K. and O.T. conducted the survey. E.K. was also involved in analyzing and processing the measured data, deriving the results, and writing the manuscript. O.T. was also responsible for proofreading this work and providing meaningful feedback and corrections. All authors have read and agreed to the published version of the manuscript.

Funding

This paper is supported by the Czech Science Foundation. Project: Measuring corporate sustainability performance in selected sectors [Nr. 14-23079S] and Project: Modelling and simulation of sustainable investment decision-making, CEP ID GA17-23448S.

Acknowledgments

We would like to thank all breweries representatives for providing valuable information for our research.

Conflicts of Interest

The authors declare no conflict of interest.

References

  1. Ferrero-Ferrero, I.; Fernández-Izquierdo, M.; Muñoz-Torres, M. The effect of environmental, social and governance consistency on economic results. Sustainability 2016, 8, 1005. [Google Scholar] [CrossRef] [Green Version]
  2. Hřebiček, J.; Faldik, O.; Chvatalova, Z.; Kasem, E.; Trenz, O. Sustainability assessment of biogas plants. In Proceedings of the 6th International Symposium on Energy from Biomass and Waste (Venice 2016), Venice, Italy, 14–17 November 2016; ISBN 978-88-6265-007-6. [Google Scholar]
  3. Heemskerk, B.; Pistorio, P.; Scicluna, M. Sustainable Development Reporting: Striking the Balance; World Business Council for Sustainable Development: Geneva, Switzerland, 2002; ISBN 2-940240-45-0. [Google Scholar]
  4. The Green New Deal. 2017. Available online: https://gpus.org/organizing-tools/the-green-new-deal/ (accessed on 17 December 2019).
  5. Hahn, R.; Kühnen, M. Determinants of sustainability reporting: A review of results, trends, theory, and opportunities in an expanding field of research. J. Clean. Prod. 2013, 59, 5–21. [Google Scholar] [CrossRef]
  6. Lozano, R. Sustainability inter-linkages in reporting vindicated: A study of European companies. J. Clean. Prod. 2013, 51, 57–65. [Google Scholar] [CrossRef]
  7. Engida, T.G.; Rao, X.; Berentsen, P.B.; Lansink, A.G.O. Measuring corporate sustainability performance–the case of European food and beverage companies. J. Clean. Prod. 2018, 195, 734–743. [Google Scholar] [CrossRef]
  8. Kwatra, S.; Kumar, A.; Sharma, P.; Sharma, S.; Singhal, S. Benchmarking sustainability using indicators: An Indian case study. Ecol. Indic. 2016, 61, 928–940. [Google Scholar] [CrossRef]
  9. Ocetkiewicz, I.; Tomaszewska, B.; Mróz, A. Renewable energy in education for sustainable development. The Polish experience. Renew. Sustain. Energy Rev. 2017, 80, 92–97. [Google Scholar] [CrossRef]
  10. Forbes. Socially-Responsible Investing: Earn Better Returns from Good Companies. 2017. Available online: https://www.forbes.com/sites/moneyshow/2017/08/16/socially-responsible-investing-earn-better-returns-from-good-companies/#5542a29623d0 (accessed on 17 December 2019).
  11. Song, Y.; Wang, H.; Zhu, M. Sustainable strategy for corporate governance based on the sentiment analysis of financial reports with CSR. Financ. Innov. 2018, 4, 2. [Google Scholar] [CrossRef]
  12. Duuren, E.; Plantinga, A.; Scholtens, B. ESG Integration and the Investment Management Process: Fundamental Investing Reinvented. J. Bus. Ethic 2016, 138, 525–533. [Google Scholar] [CrossRef] [Green Version]
  13. Kunz, V. Corporate Social Responsibility; Grada Publishing: Prague, Czech Republic, 2012; p. 201. ISBN 978-80-247-3983-0. [Google Scholar]
  14. Pícha, K. Social Responsibolity of the Company in the Present Trends and in Contexts (Czech); Alfa Nakladatelství: Prague, Czech Republic, 2012; p. 103. ISBN 978-80-87197-55-4. [Google Scholar]
  15. Darcy, C.; Hill, J.; McCabe, T.J.; McGovern, P. A consideration of organisational sustainability in the SME context: A resource-based view and composite model. Eur. J. Train. Dev. 2014, 38, 398–414. [Google Scholar] [CrossRef] [Green Version]
  16. Hsu, C.H.; Chang, A.Y.; Luo, W. Identifying key performance factors for sustainability development of SMEs–integrating QFD and fuzzy MADM methods. J. Clean. Prod. 2017, 161, 629–645. [Google Scholar] [CrossRef]
  17. Kubíčková, L.; Tuzová, M.; Toulová, M. The Internationalisation of Small and Medium-Sized Enterprises as a Path to Competitiveness. In Competitiveness, Social Inclusion and Sustainability in a Diverse European Union; Springer: Cham, Switzerland, 2016; pp. 99–120. ISBN 978-3-319-17298-9. [Google Scholar]
  18. Lu, J.W.; Beamish, P.W. The internationalization and performance of SMEs. Strateg. Manag. J. 2001, 22, 565–586. [Google Scholar] [CrossRef]
  19. Pechmann, A.; Shrouf, F.; Chonin, M.; Steenhusen, N. Load-shifting potential at SMEs manufacturing sites: A methodology and case study. Renew. Sustain. Energy Rev. 2017, 78, 431–438. [Google Scholar] [CrossRef]
  20. Hřebíček, J.; Soukopová, J.; Štencl, M.; Trenz, O. Integration of economic, environmental, social and corporate governance performance and reporting in enterprises. Acta Univ. Agric. Silvic. Mendel. Brun. 2014, 59, 157–166. [Google Scholar] [CrossRef] [Green Version]
  21. Gallego-Álvarez, I.; Galindo-Villardón, M.P.; Rodríguez-Rosa, M. Evolution of sustainability indicator worldwide: A study from the economic perspective based on the X-STATICO method. Ecol. Indic. 2015, 58, 139–151. [Google Scholar] [CrossRef]
  22. Kocmanová, A.; Hřebíček, J.; Dočekalová, M.; Hodinka, M.; Hornungová, J.; Chvátalová, Z.; Trenz, O. Measuring Business Performance (Měření Podnikové Výkonnosti); Littera: Brno, Czech Republic, 2013. [Google Scholar]
  23. Hřebíček, J.; Trenz, O.; Vernerová, E. Optimal set of agri-environmental indicators for the agricultural sector of Czech Republic. Acta Univ. Agric. Silvic. Mendel. Brun. 2013, 61, 2171–2181. [Google Scholar] [CrossRef] [Green Version]
  24. Holden, M. Sustainability indicator systems within urban governance: Usability analysis of sustainability indicator systems as boundary objects. Ecol. Indic. 2013, 32, 89–96. [Google Scholar] [CrossRef]
  25. Karnauskaite, D.; Schernewski, G.; Støttrup, J.G.; Kataržytė, M. Indicator-Based Sustainability Assessment Tool to Support Coastal and Marine Management. Sustainability 2019, 11, 3175. [Google Scholar] [CrossRef] [Green Version]
  26. Shakya, B.; Shrestha, A.; Sharma, G.; Gurung, T.; Mihin, D.; Yang, S.; Choudhury, D. Visualizing Sustainability of Selective Mountain Farming Systems from Far-eastern Himalayas to Support Decision Making. Sustainability 2019, 11, 1714. [Google Scholar] [CrossRef] [Green Version]
  27. Global Reporting Initiative. G4 Guidelines–Reporting Principles and Standard Disclosures/Implementation Manual; GRI: Amsterdam, The Netherlands, 2013. [Google Scholar]
  28. Scialabba, N. SAFA Guidelines: Sustainability Assessment of Food and Agriculture Systems. Food and Agriculture Organization of the United Nations. 2014. Available online: http://www.fao.org/nr/sustainability/sustainability-assessments-safa/en/ (accessed on 15 December 2019).
  29. DVFA. DVFA Key Performance Indicators for Environment, Social and Governance Issues: (ESG 3.0), Society of Investment Professionals in Germany in Conjunction with EFFAS European Federation of Financial Analysts Societies; DVFA: Frankfurt am Main, Germany, 2010. [Google Scholar]
  30. ISO. ISO 14031: 2013. Environmental Management, Environmental Performance Evaluation, Guidelines. 2013. Available online: https://www.iso.org/standard/52297.html (accessed on 15 December 2019).
  31. ISO. ISO 9000, ISO 14000, ISO 18000 Documentation. 2015. Available online: http://integrated-standards.com/compare-managementsystem-structure/compare-iso-9001-ohsas18001-iso-14001/ (accessed on 15 December 2019).
  32. ISO. ISO 26000:2010. Social Responsibility. 2010. Available online: http://www.iso.org/iso/iso26000 (accessed on 15 December 2019).
  33. EMAS. EU Eco-Management and Audit Scheme (EMAS). 2011. Available online: http://ec.europa.eu/environment/emas/pdf/leaflets/emasleaflet_en.pdf (accessed on 15 December 2019).
  34. Jesover, F.; Kirkpatrick, G. The revised OECD principles of corporate governance and their relevance to non-OECD countries. Corp. Gov. Int. Rev. 2005, 13, 127–136. [Google Scholar] [CrossRef]
  35. Křen, J. Methodology for Assessing the Sustainability of Crop Production Systems for CR Conditions; Mendel University in Brno: Brno, Czech Republic, 2011. [Google Scholar]
  36. Dočekalová, M.P.; Kocmanová, A. Composite indicator for measuring corporate sustainability. Ecol. Indic. 2016, 61, 612–623. [Google Scholar] [CrossRef]
  37. Pask, F.; Lake, P.; Yang, A.; Tokos, H.; Sadhukhan, J. Sustainability indicators for industrial ovens and assessment using Fuzzy set theory and Monte Carlo simulation. J. Clean. Prod. 2017, 140, 1217–1225. [Google Scholar] [CrossRef] [Green Version]
  38. Skorpil, V.; Stastny, J. Back-Propagation and K-Means Algorithms Comparison. In Proceedings of the 8th International Conference on Signal Processing, Beijing, China, 16–20 November 2006; pp. 1871–1874, ISBN 0-7803-9736-3. [Google Scholar]
  39. Dodd, J.L.; Chen, S. Economic value added (EVA). Ark. Bus. Econ. Rev. 1997, 30, 1–8. [Google Scholar]
  40. Jin, S.; Jeong, S.; Kim, K. A linkage model of supply chain operation and financial performance for economic sustainability of firm. Sustainability 2017, 9, 139. [Google Scholar] [CrossRef] [Green Version]
  41. Charnes, A.; Cooper, W.W.; Rhodes, E. Measuring the efficiency of decision making units. Eur. J. Oper. Res. 1978, 2, 429–444. [Google Scholar] [CrossRef]
  42. Doyle, J.; Green, R. Efficiency and cross-efficiency in DEA: Derivations, meanings and uses. J. Oper. Res. Soc. 1994, 45, 567–578. [Google Scholar] [CrossRef]
  43. Liang, L.; Wu, J.; Cook, W.D.; Zhu, J. The DEA game cross-efficiency model and its Nash equilibrium. Oper. Res. 2008, 56, 1278–1288. [Google Scholar] [CrossRef] [Green Version]
  44. Azoulay-Schwartz, R.; Kraus, S.; Wilkenfeld, J. Exploitation vs. exploration: Choosing a supplier in an environment of incomplete information. Decis. Support Syst. 2004, 38, 1–18. [Google Scholar] [CrossRef]
  45. Kumar, M.; Vrat, P.; Shankar, R. A fuzzy goal programming approach for vendor selection problem in a supply chain. Comput. Ind. Eng. 2004, 46, 69–85. [Google Scholar] [CrossRef]
  46. Xu, J.; Li, B.; Wu, D. Rough data envelopment analysis and its application to supply chain performance evaluation. Int. J. Prod. Econ. 2009, 122, 628–638. [Google Scholar] [CrossRef]
  47. Cisneros, J.M.; Grau, J.B.; Antón, J.M.; De Prada, J.D.; Cantero, A.; Degioanni, A.J. Assessing multi-criteria approaches with environmental, economic and social attributes, weights and procedures: A case study in the Pampas, Argentina. Agric. Water Manag. 2011, 98, 1545–1556. [Google Scholar] [CrossRef]
  48. Adler, N.; Friedman, L.; Sinuany-Stern, Z. Review of ranking methods in the data envelopment analysis context. Eur. J. Oper. Res. 2002, 140, 249–265. [Google Scholar] [CrossRef]
  49. Figge, F.; Hahn, T. Sustainable value added measuring corporate contributions to sustainability beyond eco-efficiency. Ecol. Econ. 2004, 48, 173–187. [Google Scholar] [CrossRef]
  50. Faulkner, W.; Templeton, W.; Gullett, D.; Badurdeen, F. Visualizing sustainability performance of manufacturing systems using sustainable value stream mapping (Sus-VSM). In Proceedings of the 2012 International Conference on Industrial Engineering and Operations Management, Istanbul, Turkey, 3 July 2012; pp. 815–824. [Google Scholar]
  51. Kratena, K. Ecological value added’in an integrated ecosystem–economy model—an indicator for sustainability. Ecol. Econ. 2004, 48, 189–200. [Google Scholar] [CrossRef] [Green Version]
  52. Zahm, F.; Viaux, P.; Girardin, P.; Vilain, L.; Mouchet, C.; Environnement, F. Farm Sustainability Assessment using the IDEA Method From the concept of farm sustainability to case studies on French farms. Common Princ. Common Pract. 2007, 77, 77–110. [Google Scholar]
  53. Hallstedt, S.I.; Bertoni, M.; Isaksson, O. Assessing sustainability and value of manufacturing processes: A case in the aerospace industry. J. Clean. Prod. 2015, 108, 169–182. [Google Scholar] [CrossRef] [Green Version]
  54. Villeneuve, C.; Tremblay, D.; Riffon, O.; Lanmafankpotin, G.Y.; Bouchard, S. A systemic tool and process for sustainability assessment. Sustainability 2017, 9, 1909. [Google Scholar] [CrossRef] [Green Version]
  55. Finnveden, G. On the limitations of life cycle assessment and environmental systems analysis tools in general. Int. J. Life Cycle Assess. 2000, 5, 229–238. [Google Scholar] [CrossRef]
  56. Norris, C.B. Social life cycle assessment: A technique providing a new wealth of information to inform sustainability-related decision making. In Life Cycle Assessment Handbook: A Guide for Environmentally Sustainable Products; Scrivener Publishing LLC: Cincinnati, OH, USA, 2012; pp. 433–451. [Google Scholar]
  57. Gerrard, C.L.; Smith, L.; Padel, S.; Pearce, B.; Hitchings, R.; Cooper, N. Ocis Public Goods Tool Development. 2011. Available online: https://orgprints.org/18518/2/OCIS_PG_report_April_ORC_2011V1.0.pdf (accessed on 15 December 2019).
  58. Narodoslawsky, M.; Krotscheck, C. The sustainable process index (SPI): Evaluating processes according to environmental compatibility. J. Hazard. Mater. 1995, 41, 383–397. [Google Scholar] [CrossRef]
  59. Van der Werf, H.M.; Tzilivakis, J.; Lewis, K.; Basset-Mens, C. Environmental impacts of farm scenarios according to five assessment methods. Agric. Ecosyst. Environ. 2007, 118, 327–338. [Google Scholar] [CrossRef]
  60. Toensmeier, E. The Carbon Farming Solution: A Global Toolkit of Perennial Crops and Regenerative Agriculture Practices for Climate Change Mitigation and Food Security; Chelsea Green Publishing: Hartford, VT, USA, 2016; ISBN 978-1603585712. [Google Scholar]
  61. Huang, I.B.; Keisler, J.; Linkov, I. Multi-criteria decision analysis in environmental sciences: Ten years of applications and trends. Sci. Total Environ. 2011, 409, 3578–3594. [Google Scholar] [CrossRef]
  62. Black, K. Business Statistics: For Contemporary Decision Making: For Contemporary Decision Making; Wiley Global Education: Hoboken, NJ, USA, 2010; ISBN 978-1-119-32089-0. [Google Scholar]
  63. Kassem, E.; Trenz, O.; Hřebíček, J.; Faldík, O. Sustainability Assessment Using Sustainable Value Added. Procedia-Soc. Behav. Sci. 2016, 220, 177–183. [Google Scholar] [CrossRef] [Green Version]
  64. Qureshi, M.; Sabir, F. A comparison of model view controller and model view presenter. Sci. Int. 2014, 25, 7–9. [Google Scholar]
  65. BR. Public Business Register of Documents in the Czech Republic. Available online: https://or.justice.cz/ias/ui/rejstrik (accessed on 17 December 2019).
  66. Balach, V. Czech Beer and Malt Association (CBMA). Available online: http://www.cspas.cz (accessed on 17 December 2019).
  67. Mavlikaeva, L.; Ryglova, K. Using exploratory factor analysis for determination of tourist satisfaction factors in the Czech Republic. In Proceedings of the Conference Proceedings Mathematical Methods in Economics, Cheb, Czech Republic, 9–11 September 2015; pp. 513–518. [Google Scholar]
  68. Vacl, J. Microbreweries as attractive tourist destinations in the Czech Republic. In Proceedings of the International Conference on Business Strategy and Organizational Behaviour (BizStrategy); Global Science and Technology Forum, Fort Canning Downtown Core, Singapore, 21–22 July 2014; p. 51. [Google Scholar]
  69. Economics, Europe The Contribution Made by Beer to the European Economy. 2013. Available online: https://brewersofeurope.org/uploads/mycms-files/documents/publications/2016/EU_economic_report_2016_web.pdf (accessed on 17 December 2019).
  70. Elith, J.; HGraham, C.; PAnderson, R.; Dudík, M.; Ferrier, S.; Guisan, A.; JHijmans, R.; Huettmann, F.; RLeathwick, J.; Lehmann, A.; et al. Novel methods improve prediction of species’ distributions from occurrence data. Ecography 2006, 29, 129–151. [Google Scholar] [CrossRef] [Green Version]
  71. GACR. Project GACR P403/11/2085: Construction of Methods for Multifactor Assessment of Company Complex Performance in Selected Sector. 2011. Available online: http://gacr.pefka.mendelu.cz/gacr403/cs/ (accessed on 15 May 2019).
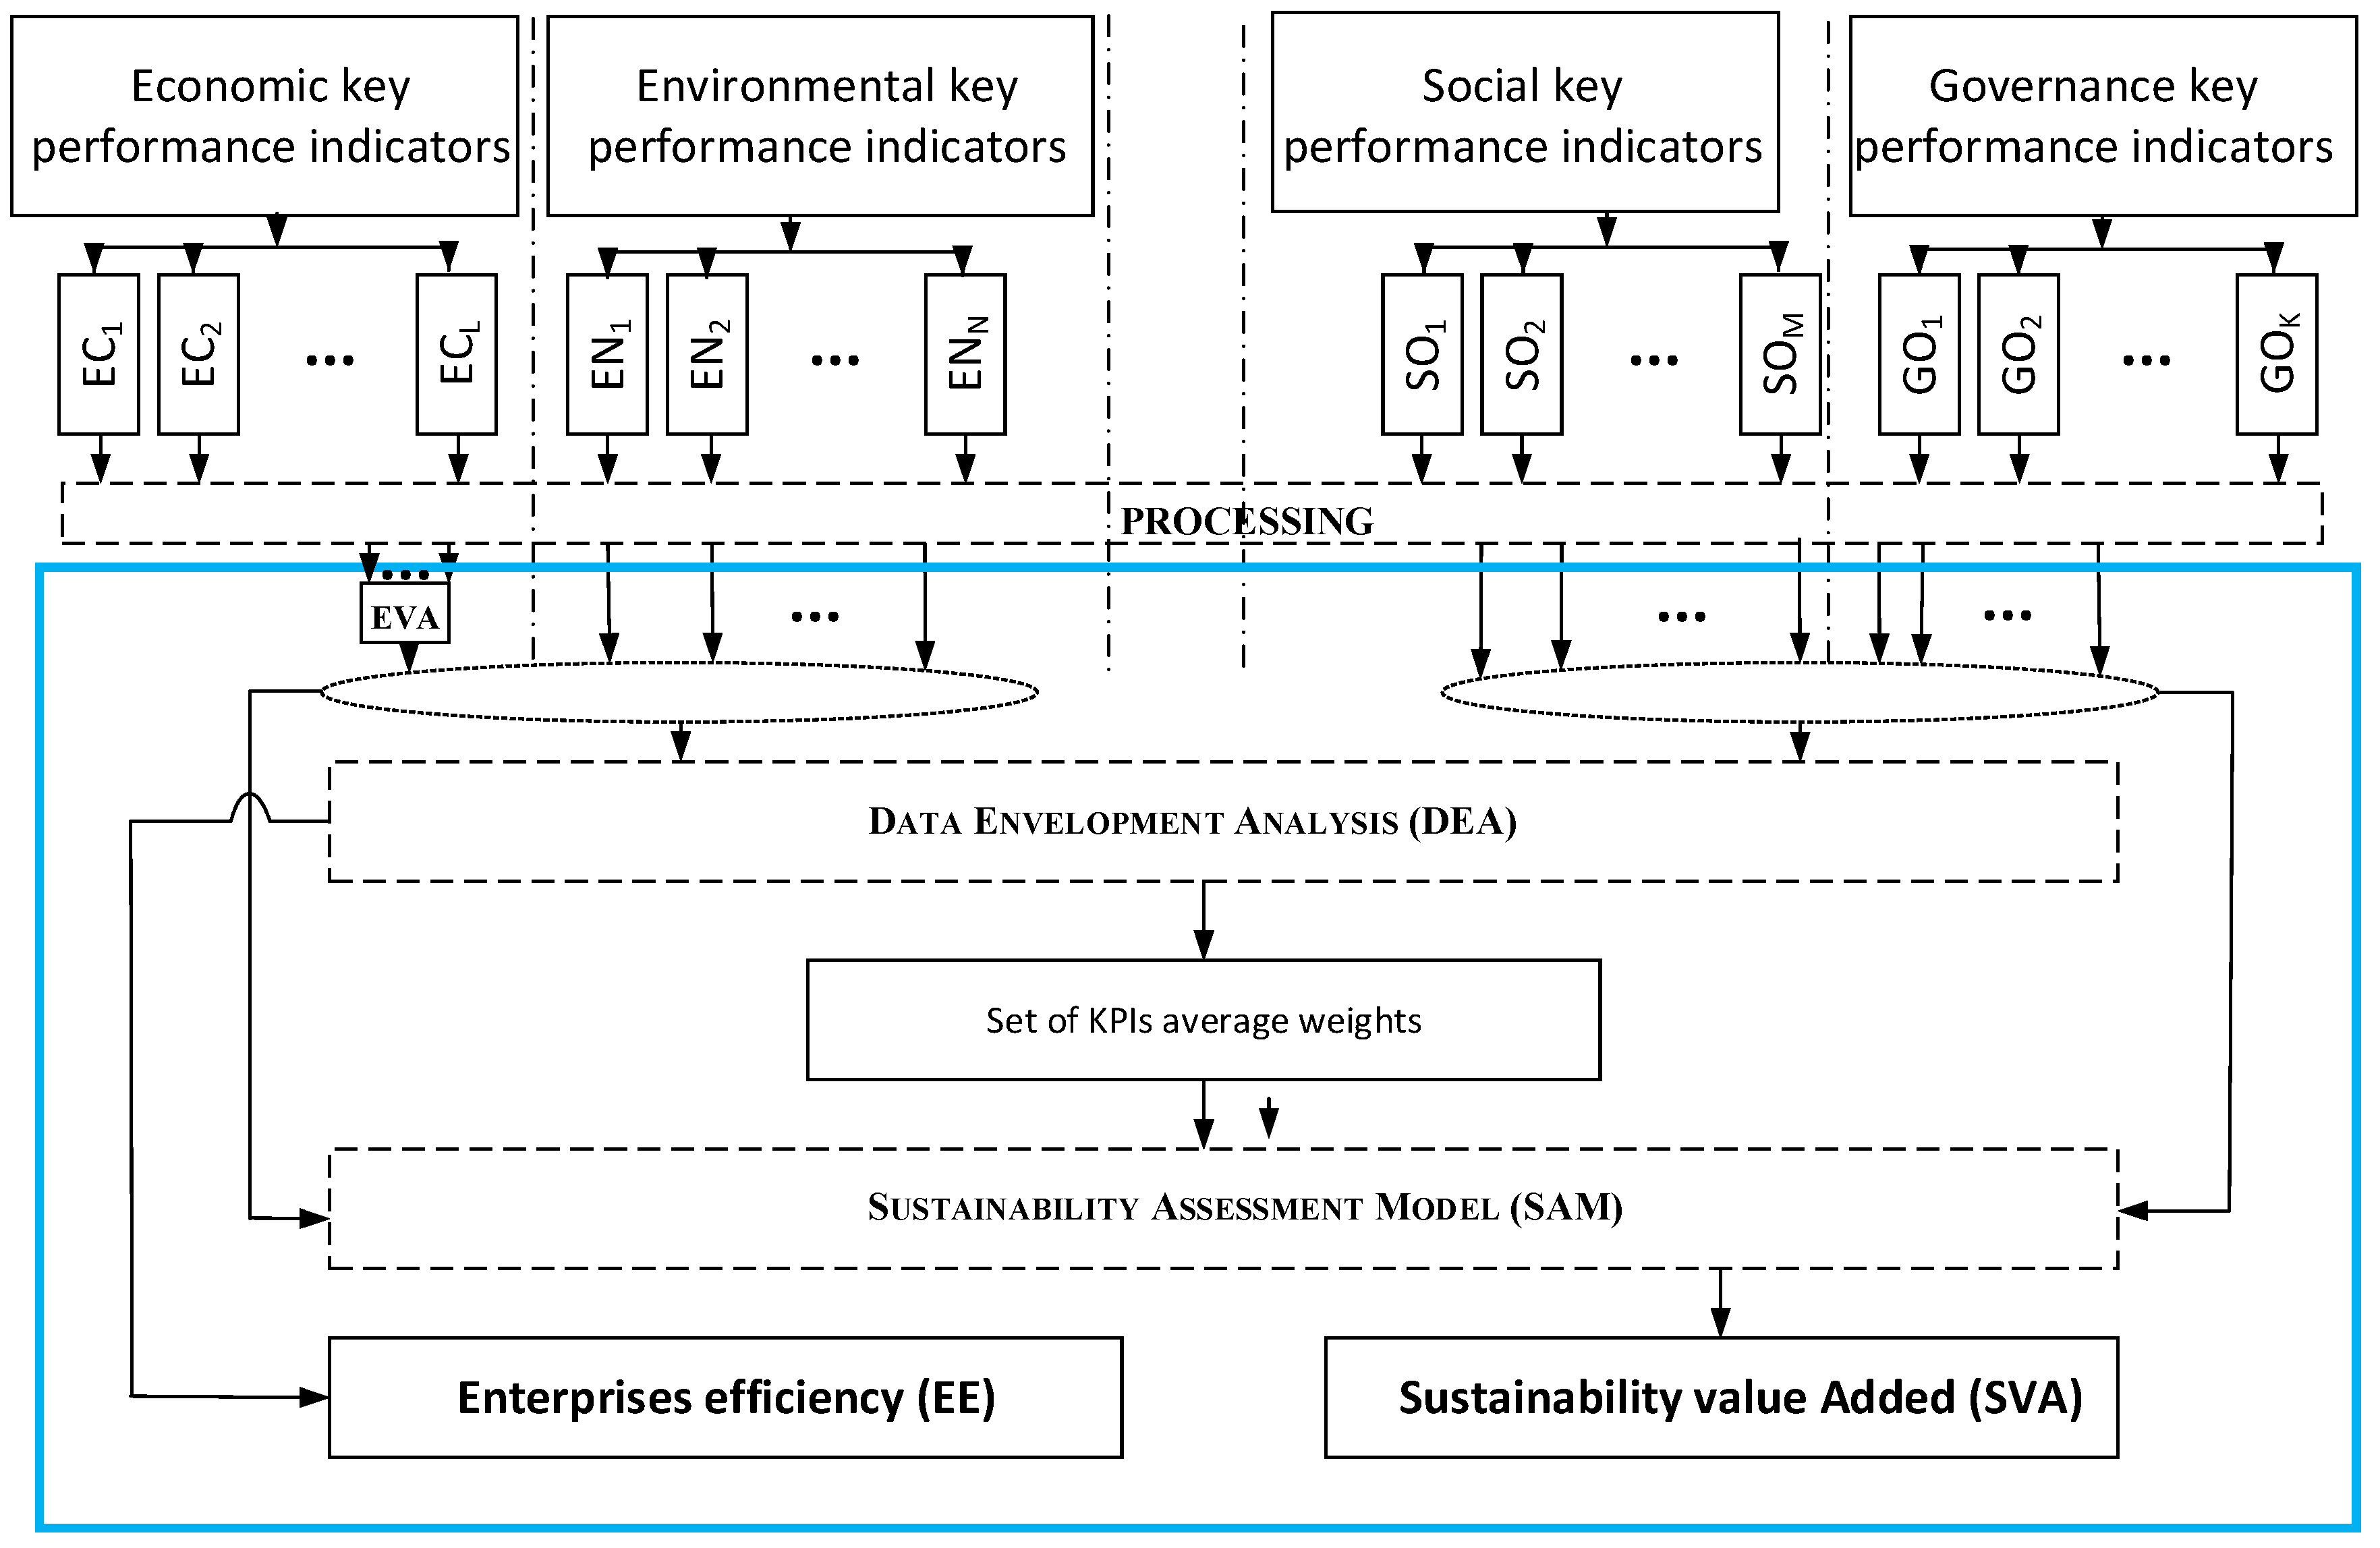
Figure 1. Structure of sustainability assessment model. Source: authors.
Sustainability 12 05687 g001
Figure 2. WEBRIS architecture. Source: authors.
Sustainability 12 05687 g002
Figure 3. The number of studied breweries in the whole Czech Republic territory. Source: authors.
Sustainability 12 05687 g003
Figure 4. (a) The level of the efficiency and (b) sustainability of the studied Czech breweries. Source: authors.
Sustainability 12 05687 g004
Figure 5. (a) The level of economic, environmental, social and governance factors; (b) the level of all negative environmental indicators; and (c) the level of the positive environmental investments indicator of the studied Czech brewery companies. Source: authors.
Sustainability 12 05687 g005
Figure 6. (a) SVA, (b) economic, (c) environmental, (d) social and (e) governance factors comparison when applying two different means of assessment. Source: authors.
Sustainability 12 05687 g006aSustainability 12 05687 g006b
Table 1. Standards and frameworks for corporate sustainability assessment.
InstitutionManualsDescription
Global Reporting Initiative (GRI)Reporting Principles, Standard Disclosures and Implementation Manual [27]The manuals contain the requirements of reporting against the framework, ’what’ must be reported, and provides further guidance on ’how’ organizations can report against G4 criteria.
Food and Agriculture Organization (FAO) of the United NationsSustainability Assessment of Food and Agriculture Systems (SAFA) guidelines, SAFA indicators, and SAFA tool [28].It is a holistic global framework for sustainability assessment along food and agriculture value chains.
European Federation of Financial Analysts Societies (EFFAS)DVFA framework Issues 3.0 [29]It proposes the basis for the integration of ESG indicators into corporate performance reporting.
International Organization for Standardization (ISO) ISO 14031:2013 [30]It contains several environmental aspects which determine the Environmental Performance (EP).
ISO 9000 [31]Standard for quality aspects implementation.
ISO 14000 [31]Environmental aspects.
ISO 18000 [31]Occupational health and safety aspects.
ISO 26000 [32]Corporate social responsibility aspects.
European CommissionEco-Management and Audit Scheme (EMAS) [33]It improves the environmental performance of the organization (reduces its environmental impacts, strengthens legal compliance and employee involvement, and saves resources and money).
Organization for Economic Cooperation and Development (OECD)OECD Greening Guidelines [34]It improves the economic and social well-being of people around the world.
Table 2. Sustainability assessment KPIs of Czech breweries. Source: authors.
IndicatorDescriptionUnitSig. (p Value)
EC1Economic value added (EVA)CZK0.004148
EN1Water consumptionm30.000007
EN2The amount of waste productionTons0.000015
EN3The amount of hazardous waste productionTons0.000410
EN4Environmental investmentsCZK0.000004
SO1Employee turnover rate%0.000410
SO2DonationsCZK0.009322
SO3Number of EmployeesNumber0.000004
SO4Education and trainingCZK0.001728
GO1Liability Corporate Governance (CG) collective reportyes/no0.000007
GO2CG report on environmental and social activitiesyes/no0.000004
GO3Ethical Behavioryes/no0.000015
GO4Women in managementyes/no0.038777
Table 3. The correlation matrix for chosen KPIs for sustainability assessment of the Czech breweries. Source: authors.
EC1EN1EN2EN3EN4SO2SO3SO1SO4GO1GO2GO3GO4
EC11
EN10.0541
EN20.0120.0571
EN30.0770.0530.1311
EN40.0160.0030.0440.0211
SO20.0350.1050.0430.2140.1641
SO30.4020.0130.3310.3130.0280.1061
SO10.1910.0130.1660.0240.1190.1620.2141
SO40.0910.0540.0410.1820.2020.7790.0790.0341
GO10.1350.0060.2440.0930.1370.0310.0980.1470.0571
GO20.1310.0290.0240.0730.1220.0520.0110.0440.0630.2411
GO30.1370.0040.1140.2470.1380.3170.1020.0850.3960.0370.4331
GO40.0900.1790.2450.0650.3000.2760.1180.1690.2910.0700.0660.4271
Table 4. The variance of KPIs chosen for sustainability assessment of the Czech breweries. Source: authors.
ComponentInitial Eigenvalues
Total% of VarianceCumulative %
12.63820.29520.295
21.82414.03334.328
31.45011.15545.483
41.1839.10354.586
51.1749.03063.617
60.9897.60471.221
70.8866.81578.035
80.7785.98484.019
90.6424.93688.955
100.4963.81692.771
110.4593.53096.301
120.3192.45498.755
130.1621.245100.000
Table 5. The efficiency and the weight of the KPIs of brewery companies. Source: authors.
ReportEfficiencywEN1wEN2wEN3wEN4wSO1wSO2wSO3wSO4wGO1wGO2wGO3wGO4
::::::::::::::
R200.4370.0000.0120.3860.3780.0322.25280.0000.0060.0030.0000.0000.000
R211.0000.0000.0000.4560.0000.21916.8510.0000.0260.0000.0000.0000.000
R221.0000.1250.0200.1450.3210.3400.0000.0720.1130.0000.0000.0000.000
R231.0000.1230.0000.2140.0000.4100.0000.0850.3090.0000.0000.0000.000
::::::::::::::
R1480.9800.0000.0000.0010.0000.0000.0010.0000.0100.0110.0000.0000.001
R1491.0000.0000.0000.0000.0000.0000.0010.0010.0100.0110.0000.0000.000
R1501.0000.0000.0070.0000.0000.0000.0030.0000.0040.0000.0000.0100.000
R1511.0000.0000.0000.0000.0000.0000.0030.0000.0100.0010.0000.0190.001