Article

The Configuration of Forest Cover in Ribeirão Preto: A Diagnosis of Brazil’s Forest Code Implementation

by
Rafael Parras
1,2,
Gislaine Costa de Mendonça
1,2,
Renata Cristina Araújo Costa
1,2,
Teresa Cristina Tarlé Pissarra
1,2,
Carlos Alberto Valera
2,3,
Luís Filipe Sanches Fernandes
2,4 and
Fernando António Leal Pacheco
2,5,*
1
Faculty of Agrarian and Veterinary Sciences, São Paulo State University (UNESP/FCAV), Jaboticabal SP 14884-900, Brazil
2
POLUS—Land Use Policy Group, Paulista State University (UNESP), Access Way Prof. Paulo Donato Castellane, s/n, Jaboticabal SP 14884–900, Brazil
3
Regional Coordination of the Prosecutor’s office for Environmental Justice in River Basins Paranaíba and Baixo Rio Grande, Colonel Antônio Rios Street, 951, Uberaba MG 38061-150, Brazil
4
CITAB—Centre for the Research and Technology of Agro-Environment and Biological Science, University of Trás-os-Montes and Alto Douro, Ap. 1013, 5001-801 Vila Real, Portugal
5
CQVR—Chemistry Center of Vila Real, University of Trás-os-Montes and Alto Douro, Ap. 1013, 5001-801 Vila Real, Portugal
*
Author to whom correspondence should be addressed.
Sustainability 2020, 12(14), 5686; https://doi.org/10.3390/su12145686
Submission received: 10 June 2020 / Revised: 29 June 2020 / Accepted: 14 July 2020 / Published: 15 July 2020
(This article belongs to the Section Environmental Sustainability and Applications)

Abstract

:
The fragmentation of forests is a consequence of human activities that intensively change the natural landscapes. In Brazil, there is a long-standing legal framework for native vegetation protection, called Forest Code. The last update is from 2012. The revisions incorporated in this restructured code (Law No. 12,651/12) encompassed new rules, rights and obligations for adequate land use management of productive systems and for environmental conservation and protection. An example of a protective measure was the creation of a Legal Reserve inside the rural properties and Areas of Permanent Protection around the watercourses. This study explored the effects of implementing the new code on the spatial and temporal evolution of forest cover fragmentation since the legal changes were set up. In that context, the area, perimeter and shape (circularity index) of forest fragments, as well as the buffer strips along watercourses, were assessed from 2010 to 2016 within the municipality of Ribeirão Preto, São Paulo state, Brazil. The assessment resorted to remote sensing techniques and visual inspection of orbital images. It was clear from the results that forest patches became more abundant but smaller, more dispersed and elongated, and that this route to fragmentation was hinged on a chaotic expansion of urban and agricultural areas. Important edge effects were anticipated from these results. The area numbers revealed that Ribeirão Preto was 7.95% covered with forest fragments in 2010, while this percentage rose to 8.03% in 2013 and reached 8.35% in 2016. Most of this increase occurred within a 30-meter wide buffer along the watercourses. This was a positive outcome. However, the numbers also revealed that forested areas smaller than 51 hectares increased from 71% in 2010 to 73% in 2016. The conclusions were that implementation of Law No. 12,651/12 is leading to an increase of forestland, but not yet promoting sustainability, namely through improved connectivity among fragments for reduction of edge effects and provision ecosystem services.

1. Introduction

The changes to natural landscapes and the loss of forest cover are important causes of environmental imbalances, oftentimes with irreversible consequences to the quality of life standards and the availability of ecosystem services [1,2,3,4,5]. The maintenance of ecosystem functions has been related to specific occupation standards in some research. The data analyses described the negative effects of forest fragmentation as well as the benefits of forest conservation to the adjustment of hydric flows, carbon supply, biodiversity and the ecologic and climatic equilibrium on Earth [6,7,8,9,10,11]. Therefore, the maintenance of environmental balance depends on the preservation of forest ecosystems. To attain the goal, however, it is mandatory to decrease the loss of forest edge structure in farming and urban landscapes, among other initiatives [12,13,14,15].
In the modern world, the utopia of balanced landscapes requires the set-up of trade-offs between maintenance of ecosystem services and socio-economic development [16,17,18,19]. Without these trade-offs, the conversion of forest cover into anthropic land is likely to cause environmental damage, with generalized disruption of ecosystem functions and services [20,21,22,23]. In the Brazilian territory, the competition between conservation of native vegetation and agro-industrial activities has caused deforestation [24,25,26]. Frequently, the competition evolves to severe land use conflicts, because the expansion of productive areas reduces the system’s capacity to conserve vital services, namely those related to water resources in river basins [27,28,29,30,31].
In a scenario of land competition and conflicts, the set-up of policies, rules, rights and obligations is extremely important to accomplish a sustainable zoning of land use in the rural areas where forest cover is ample. However, the implementation of an effective framework is challenging because the share of private properties where the breakdown of forest cover occurs is vast and the owners of these lands are seldom sensitive to environmental issues [32,33,34,35]. This is particularly evident in Brazil where the routes to keep the benefits of an ecosystem at the center of agricultural productivity or urban development diverge considerably between the economic and conservationist spheres. The elaboration of Forest Codes aimed to delineate a balance between these two interests [36,37]. The control of deforestation through Forest Code enforcement should help protecting native vegetation within the private lands.
The Brazilian Forest Code represents an assemblage of laws to regulate land uses, forest cover resources and other types of vegetation in the territory. The first code was instituted in 1934 and comprised important measures for the protection of forests, considering the enormous deforestation resulting from the ongoing countless and extensive coffee, cocoa and sugar cane plantations. Three decades later, Law No. 4771/65 revoked the previous code, imposing more strict measures to protect forests from the contemporary industrialization period. However, revisions to this new code were controversial because they allowed agricultural activities in environmentally sensitive and previously protected areas [38,39]. In 2012, following an intense discussion at the National Congress, a new forest code (Law No. 12,651/12) replaced the 1965 code. Besides the definition of rules for the protection and exploration of forests, the new law instituted a special protection for specific areas, namely for the Areas of Permanent Protection (APP) and the Legal Reserve (LR). The APPs correspond to buffers of forest cover delineated along the watercourses. The LR gathers a percentage of each rural property. This new protective measure was disruptive but also essential to the supply of ecosystem services.
The implementation of Law No. 12,651/12 produced impacts on vegetation cover that have been mentioned in several studies [38,40,41,42,43]. The law defined Areas of Permanent Protection delineated along the watercourses to work as environmental buffer, with predefined widths. The Legal Reserve was also defined as a percentage of a rural property that must be allocated to sustainable economic land uses. However, there are still information gaps concerning the composition, pattern and wood coverage in the watersheds, and about the environmental quality of forest remnants. It is therefore vital to make a comprehensive and updated diagnosis on the balance between economic activity and environmental protection, to verify how effective this vital law is. It is worth noting that presently, Brazil’s natural vegetation cover is more than half (53%), located on private lands [38]. Considering the intensive conversion of native forest cover into agriculture in these lands, Brazil’s environmental legislation should be an instrument to protect the native forest ecosystems and regulate the land use and land cover areas inside rural properties.
This study aims to analyze the forestry areas and to provide new insights about the implementation of Law No. 12,651/12, focusing on patterns, shape evolution, dimension and spatial distribution of native forest remnants. The assessment of forest fragmentation resorted to metrics of dimension and form. Satellite images from 2010 to 2016 were used to identify and monitor the areas where native forest cover occurs and to outline the forest fragments [44,45].
The research occurred in the administrative and political unit of Ribeirão Preto. This municipality encompasses an important agro-industrial center of São Paulo state (Brazil). In this region, the planting and processing of sugar cane is a dominant economic activity. The cultivation of sugar cane has replaced most areas previously occupied by other agricultural crops, such as coffee or citrus. Before that, the region was highly modified by the conversion of natural vegetation into agricultural areas. Presently, the forest remnants spread inside private rural properties account for 70% of Ribeirão Preto’s territory. The region also encompasses the phytogeographic domains of Atlantic Forest and Cerrado where the Semi-Deciduous Seasonal Forest and Savanna formations prevail, which were recognized for their high endemism and diversity [46].

2. Materials and Methods
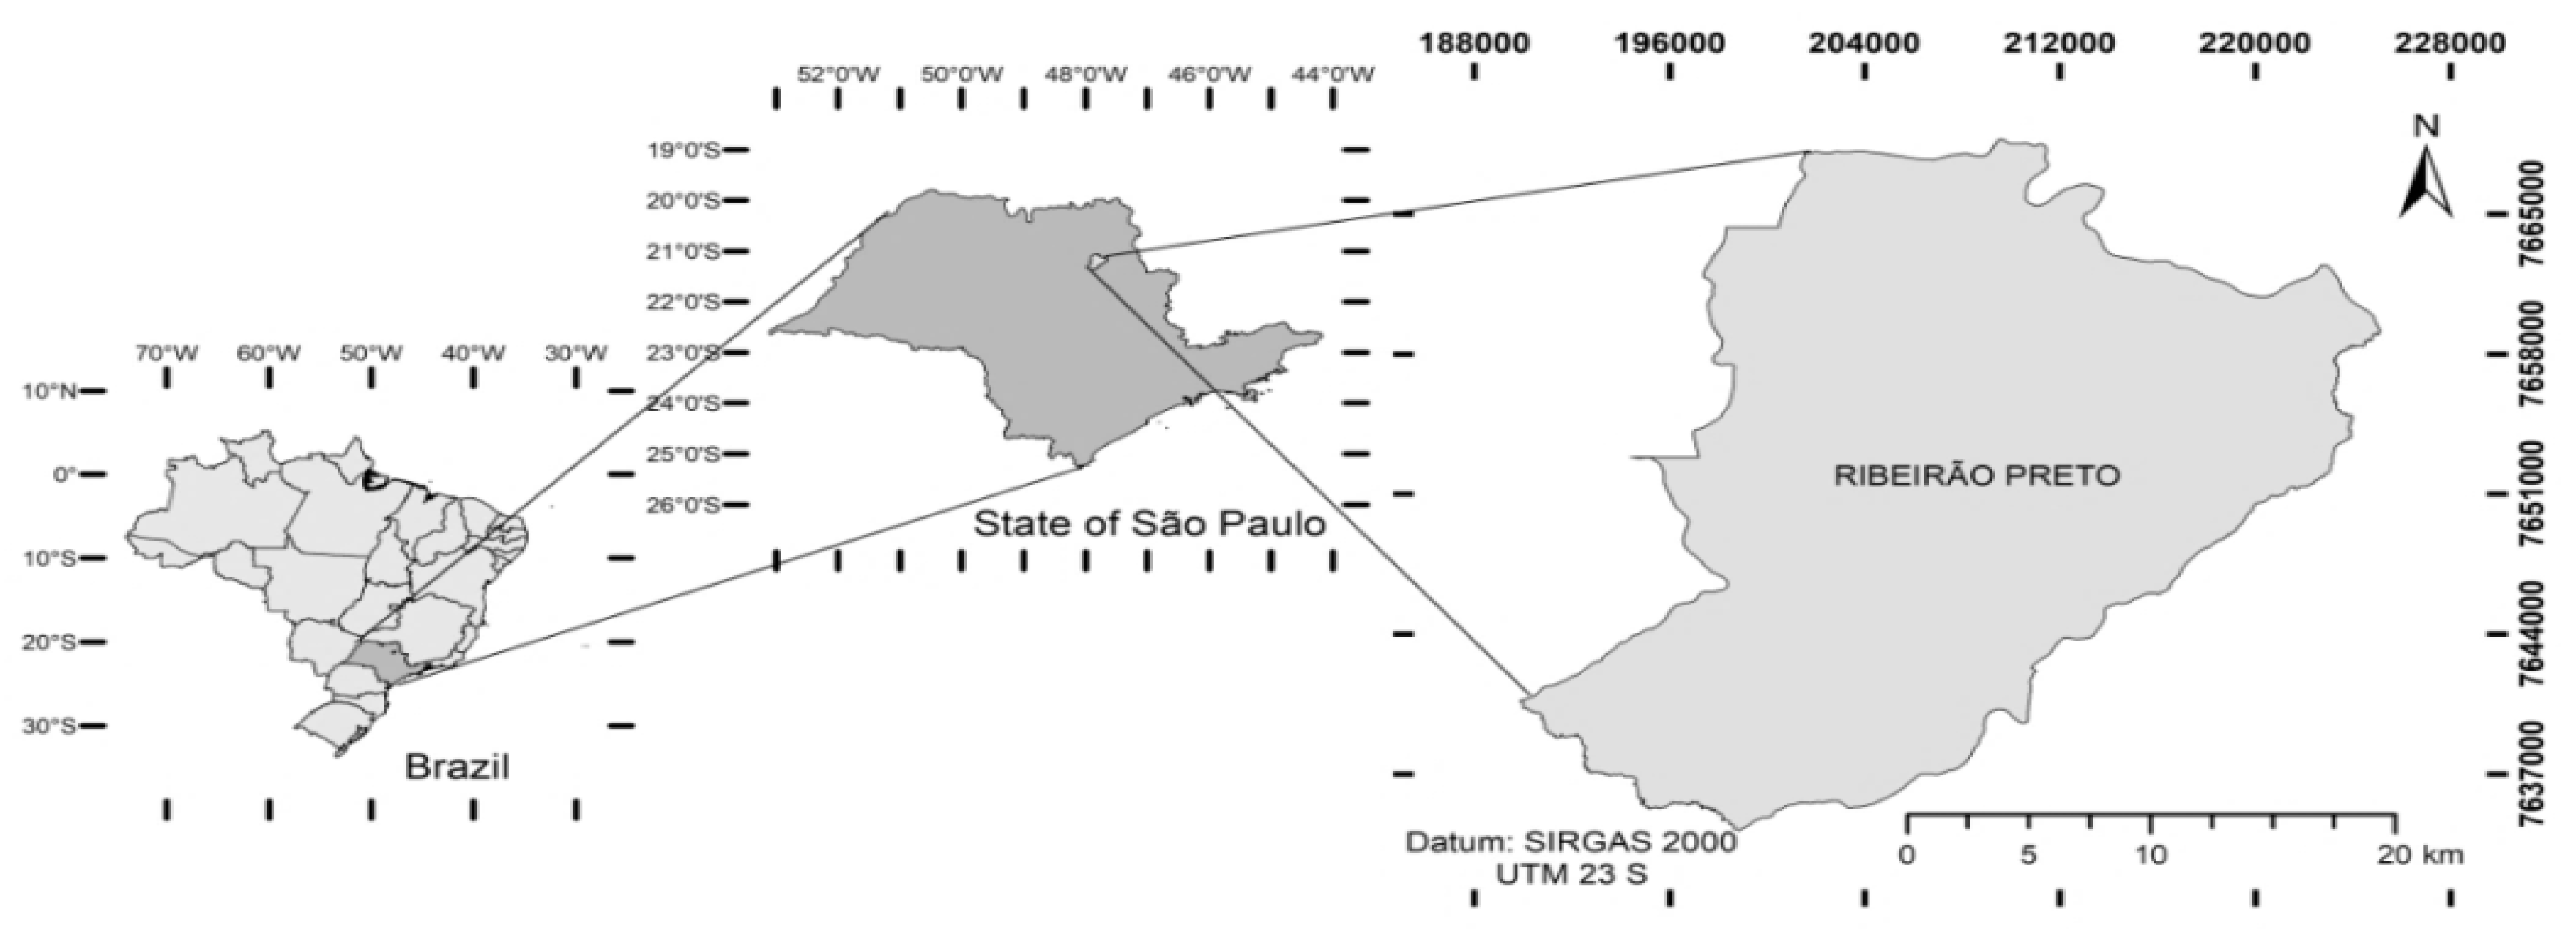
2.1. Study Area

The Ribeirão Preto municipality is located in the Northeast of São Paulo state, Southeast of Brazil, covering an area of 650,916 km2 centered on the geographic coordinates of latitude—21°10′30″ S and longitude—47°48′38″ W (Figure 1). The geological units belong to the São Bento Group, comprising the General Mountain, Botucatu and, to a smaller extent, the Pirambóia formations. The main soil units are Red Latosol, Dark-Red Latosol and Litholic. The relief is undulated to strongly undulated and rolling, while the altitudes in the region vary from 50 to 800 m. The climate is tropical semi-moist, according to the Köppen-Geiger classification. The natural vegetation cover is Atlantic Forest, composed of seasonal semi-deciduous to non-deciduous forest [47].

2.2. Data Collection and Analysis

The gathering of information and data on the spatial and temporal distribution of forest cover in the study area comprised visual interpretation of orbital images and remote sensing techniques. The images were from Google Earth Pro. This platform is progressively more used in scientific studies that require remote sensed data, as documented in a recent review paper [48], and therefore was considered adequate for the present work. Google Earth complements other sources of Earth images widely used in ecology studies [49,50,51]. The images refer to high-resolution scenes captured in 2010, 2013 and 2016. The interpretation and photogrammetry of these scenes comprehended the collection of data on color, tonality, shape, size, standard, texture, association and shadow, and accounted for phenological differences between the land uses and cover over seasons [52,53,54,55,56]. This information allowed the identification of forest fragments and their delineation through manual vectorization. Following this stage, the polygons representing the forest fragments were exported to ArcGIS Desktop software, version 10.5, of ESRI (https://www.esri.com) for quantitative assessments and production of thematic maps (e.g., Figure 2 below).
The measurements performed on ArcGIS Desktop comprehended the calculation of area, perimeter and the circularity index of each polygon representing a forest stand. The ArcGIS Desktop software includes internal functions for the calculation of area (A) and perimeter (P), while the circularity index was computed from A and P using the “Field Calculator” tool based on the equation appearing in Chaturvedi [57]:
CI = (40,000.π.A.)/P2
where:
CI = Circularity Index; A = Area (1 hm2); P = Perimeter (m).
The CI ranges from 1 (a perfect circle) to 0 (an irregular shape). Therefore, the index describes the shape of a fragment concerning its resemblance to a circular shape. The closer to the circular outline, the more regular the shape is. Regularity assures larger distances from the edges in relation to the center of the fragment. Consequently, values closer to 1 should indicate enhanced protection to nuclear areas of the fragments. The fragment’s shape together with the area determines the final consequence of a possible external disturbance to the habitat [58]. It is worth recalling, in this regard, that an association between a reduced area and an irregular shape decreases the nuclear area of forest fragments, making them more prone to edge effects.
The forestland was also analyzed along the drainage network. The purpose was to quantify the share of forests within riparian strips defined alongside the perennial and seasonal watercourses of Ribeirão Preto, and verify the impact of forest code implementation in the Areas of Permanent Protection. The extraction of water lines in shapefile format within this municipality was accomplished through automatic interpretation of a 30 × 30 m Digital Elevation Model (in raster format), using the ArcHydro extension of ArcGIS 10.5. Four buffers were drawn around the drainage network at predefined distances. The buffer widths were 30, 50, 100 and 250 m wide.

3. Results

The spatial and temporal distributions of forest cover in the Ribeirão Preto municipality are illustrated in Figure 2. The number of forest fragments increased from 393 in 2010 to 413 and 44 in 2013 and 2016 respectively. Over the study period from 2010 to 2016, the fragments increased to 13.2%. The total forested area also increased from 5185.63 ha to 5224.53 ha and subsequently to 5432.32 ha, but the percentage of increase was much smaller (just 4.8%). This implies a decrease in the mean area of forest fragments. A similar conclusion could be attained from analysis of forest stand perimeters, which increased from 888,645 m to 906,010 m and 957,358 m, i.e., solely 7.7% in the 2010–2016 period.
The distribution of forest fragments per area and perimeter classes is presented in Table 1. The fragments smaller than 5 ha dominated the landscape, as they represented 54%, 56% and 56% of all forest stands in 2010, 2013 and 2016, respectively (see also Figure 2a–c). This class showed a visible and continuous increase in the number of spots within the studied timeframe (it has raised 37 elements). The fragments larger than 5 ha and smaller than 20 ha were the second dominating group with shares of 30%, 29% and 30% in the same years. This group also showed an increase in the number of spots (12), but the increment occurred mostly from 2013 to 2016 (11). The medium (80–200 ha), large (80–200 ha) and very large (>200 ha) classes all together, represented 16%, 15% and 14% of all fragments and kept the number of elements practically unchanged throughout the studied period (61 in 2010 and 2013; 63 in 2016).
The evolutionary pattern observed for fragment area can be reproduced for perimeter as well. In 2010, the number of forest fragments in the class <1000 m was 165. In 2013, this number raised to 180 (15 more spots) and in 2016 to 192 (more 12). Thus, in total, the group of smaller fragments was 27 larger in 2016 relative to 2010. As one looks to the classes of larger perimeter (1000–1500 m, 1500–2000 m, etc.), the growth in the number of fragments became more steady, namely more 7, 10, 5, 1, 1, and 1 elements, respectively.
The distribution of forest fragments per classes of circularity index (CI) is described in Table 2 and illustrated in Figure 2d–f. In 2010, the elongated patches were dominant, namely the <0.17 (79 spots) and 0.17–0.5 (186) groups. The three intermediate classes, which span the 0.5 < CI < 0.8 range, assembled 117 of all fragments, while the most rounded patches (CI = 0.8–1.0) formed a ground of just 11 elements. In 2016, the number of fragments in the elongated classes was substantially more than in 2010, especially those included in the 0.17–0.5 class that increased to 219 patches (33 more relative to 2010). The other classes also raised the number of fragments, but modestly (between 3 and 6), except the class 0.8–1.0 that kept the initial number of patches (11). If one centers the analysis on relative increases (percentages), it is clear that class 0.17–0.5 increased, while most of the other classes became less represented in the transition from 2010 to 2016. Overall, the results point to the spreading of forest fragmentation. This process has raised the number of small and elongated fragments, with potential aggravation of edge effects related to expansion of urban areas and agriculture surrounding the forested areas of Ribeirão Preto municipality.
The spatial distribution of forested areas within buffers of predefined distance alongside the watercourses (30, 50, 100 and 250 m wide) is illustrated in Figure 3. The increase observed in the 2010–2016 period is evident for all buffers. It ranged from 2% in the smaller buffers (from 19 to 21% in the 30 m buffer; from 17 to 19% in the 50 m buffer) to 1% in the larger buffers (from 13 to 14% in the 100 m buffer; from 8 to 9% in the 250 m buffer). The figure also shows that as the buffer widens, the share of forests decreases, which means that the forest occupation becomes sparser.

4. Discussion

The fragmentation of forest cover was evident in the Ribeirão Preto municipality in 2010 and the pattern has not changed in the 2010–2016 period. Within this timeframe, the number of small and elongated patches has increased and amplified the fragmentation. However, the reforestation of riparian areas has improved. Overall, the implementation of Brazil’s new Forest Code was apparently effective in the (re)build of APPs (Areas of Permanent Protection), but relatively ineffective in the development of an ecologically sustainable Legal Reserve. The process of fragmentation hinged on the development of agricultural productive systems, the human infrastructures derived therefrom, and the urban expansion. The sugar cane culture represented 57% of Ribeirão Preto’s administrative region in 2016 [59]. The expansion of sugar cane farming in this region can explain the standard of fragmentation and the irregularity of the fragment’s shape, because the agrarian activity was set up in large areas previously occupied by native vegetation. The expansion of agriculture and urban areas is typically very damaging to forest health and habitat quality. Ultimately, it can cause permanent negative effects, endangering the ecosystem’s sustainability [60]. In the Ribeirão Preto municipality, as common practice, the farming expansion occupied the areas of low slope, because machinery can easily move across these areas. A similar spreading was observed by Adami et al. [61], who studied the farming expansion and Atlantic Rainforest patches in São Paulo state.
The traditional fragmentation in the Ribeirão Preto municipality is mostly of small areas. The process of fragmentation observed in this territory has also occurred in the Northeast region of São Paulo State [62,63], where the surface is 13.70% occupied with fragments of Atlantic Forest. The report on the growing number of patches with a small circularity index (Table 2) exposes how inefficient the enforcement of Brazil’s Forest Code was until 2016. These patches are prone to edge effects and a source of concern to public administrators [64]. The small ratios of area/perimeter that typify forest fragments with small circulation index increase the contact of natural vegetation with other anthropic environments. This is likely to trigger various negative effects on wildlife quality and biodiversity because of a potential pollution increase inside the fragment, among other disturbances. The edge effects also change the growth conditions of vegetation in the fragment centers, because of drastic changes in temperature, moisture, light and wind, which in turn decrease the biomass and change the nutrient cycles. The effects are more important in the small and more isolated patches [4,6,7,9,11]. They increase as time goes by and ultimately compromise the fragments’ sustainability [65]. Therefore, it is urgent to enforce the Forest Code more strictly in the Ribeirão Preto municipality, through implementation or imposition of restoration, protection and connectivity initiatives that could increase forest fragment circularity and improve biodiversity as well as the viability of ecosystem services in the sequel.
The implementation of harmonious productive models would help in improving circularity and the connectivity among forest patches [66]. The agroforestry systems (AFSs) are a good example of a harmonious productive model [67]. The Brazilian law allows the development of AFSs in the Legal Reserve, meaning that exploration of these areas can occur under a sustainable model where partial management and partial maintenance of vegetation coexist. Eventually, the implementation of AFSs would alleviate the pressure on deforestation that has increased, along with the pressure on sugar cane and ethanol production used for fuel supply. Besides the implementation of AFSs, other initiatives are also thought to reduce edge effects around small and irregular forest fragments. For example, the damping area around the most irregular fragments could be raised [68,69]. The recovering of patches could also occur through natural regeneration. According to Ghazoul and Chazdon [70], the processes of natural recovery can improve the landscape heterogeneousness, besides reducing the edge effects. Taken all together, these conservationist initiatives would help in building a sustainable Legal Reserve in the region.
The enforcement of Brazil’s new Forest Code has resulted in the expansion of forest cover inside the APPs [71]. The present study confirms this positive outcome in the Ribeirão Preto municipality within the studied period. For all buffers, but especially the 30 to 50 m wide, the forest fragments and their area increased around the watercourses. The legal framework about the APPs comprises an ample set of rules related to land use and cover organization in space and time. The economic activities close to these areas should attend these rules and precisely define how the landowners can manage their licenses to work. The discussion about environmental management in connection with neighboring cropping and urban communities is of paramount importance in this regard. For example, according to the set rules, forests should cover the APPs completely, but 60% of these areas do not respect the regulations. On the other hand, the patches of Legal Reserve located in the rural properties should be connected to each other and extend to the APPs, forming ecological corridors. However, many properties violate this rule. In cases where the respect for the set laws is lacking, landowners ought to repair the situation.
Despite the disrespect of many rules, the implementation of Brazil’s Forest Code has produced some good results, which are subtle so far. Eventually, a closer monitoring (e.g., through remote sensing devices such as drones) of private reforestation plans, coupled with the implementation of other practical instruments (e.g., “polluter pays principle”), would help in improving further the riverine ecosystems and their services. The approach of involving legal and administrative authorities, landowners, environmental groups and the local community in a collective decision-making experience would produce the best and enduring results, but may be a utopia. At this point, it is worth recalling Article 225º of the Brazilian Constitution that renders everyone “the right to an ecologically balanced environment, which is an asset of common use and essential to a healthy quality of life, and both the Government and the community shall have the duty to defend and preserve it for present and future generations”.
The extensive response of land use and cover to legal constraints was already observed in many regions around the globe, namely in the Benin Republic after the implementation of law 1–2013 [72]. We do consider the possibility of accomplishing this goal in Brazil. However, there are some prerequisites for success. The national policies and laws should supply the society with a coherent set of strategies and rules to manage the APPs and the LRs. In addition, they should define goals and deadlines for the recovery of damaged APPs and LRs, in keeping with the rules set out in the Brazilian Forest Code. To be successful in this enterprise, the regulations for implementing the Forest Code should become practical and intuitive for all intervenors, namely landowners. In this regard, they need to describe how, when and where the interested landowners must manage their areas for a sustainable forestland.

5. Conclusions

The new Forest Code (Brazilian Law No. 12,651/12) was established in 2012 and implemented since then. The results of a remote sensed assessment of area, perimeter and circularity index allowed the checking of forest fragmentation in Ribeirão Preto municipality from 2010 to 2016. The forests were fragmented in 2010, because the number of small and elongated patches were dominant in the landscape. In 2016, the situation improved because the forest cover increased. However, the dominance of elongated patches persisted. A promising outcome from the diagnosis was that reforestation around the watercourses (Areas of Permanent Protection) improved. Overall, the implementation of Brazil’s new Forest Code in the studied period was positive but not as active as should be, and therefore requires a more strict enforcement in the future.

Author Contributions

Conceptualization, R.P., R.C.A.C. and T.C.T.P.; methodology, R.P. and R.C.A.C.; software, G.C.d.M. and R.C.A.C.; validation, F.A.L.P., T.C.T.P., C.A.V. and L.F.S.F.; formal analysis, R.P. and R.C.A.C.; investigation, R.P. and G.C.d.M.; resources, R.P. and R.C.A.C.; data curation, F.A.L.P. and R.C.A.C.; writing—original draft preparation, R.P., R.C.A.C. and T.C.T.P.; writing—review and editing, G.C.d.M., T.C.T.P., F.A.L.P., C.A.V. and L.F.S.F.; visualization, R.C.A.C.; supervision, T.C.T.P.; project administration R.P.; funding acquisition R.P. and T.C.T.P. All authors have read and agreed to the published version of the manuscript.

Funding

The present study was carried out within the framework of the Post Graduation Research Program of Coordenação de Aperfeiçoamento de Pessoal de Nível Superior (CAPES); Conselho Nacional de Desenvolvimento Científico e Tecnológico (CNPq); São Paulo State University, UNESP—Univ Estadual Paulista, Câmpus Jaboticabal, Department of Engineering and Exact Sciences, Geomatic Laboratory; Postgraduate Program in Agronomy (Soil Science), and Land Use Policy Research Group—POLUS. For the author integrated in the CITAB Research Centre, the research was further financed by the FEDER/COMPETE/POCI—Operational Competitiveness and Internationalization Program, under project POCI-01-0145-FEDER-006958, and by the National Funds of FCT—Portuguese Foundation for Science and Technology, under the project UIDB/AGR/04033/2020. For the author integrated in the CQVR, the research was further financed by National Funds of FCT—Portuguese Foundation for Science and Technology, under the project UIDB/QUI/00616/2020.

Acknowledgments

The authors would like to thank in memoriam to the dear Valdemir Antônio Rodrigues for all the lessons and partnerships over the years.

Conflicts of Interest

The authors declare no conflict of interest. The funders had no role in the design of the study; in the collection, analyses, or interpretation of data; in the writing of the manuscript, or in the decision to publish the results.

References

  1. Foley, J.A.; Defries, R.; Asner, G.P.; Barford, C.; Bonan, G.; Carpenter, S.R.; Chapin, F.S.; Coe, M.T.; Daily, G.C.; Gibbs, H.K.; et al. Global consequences of land use. Science 2005, 309, 570–574. [Google Scholar] [CrossRef] [Green Version]
  2. da Silva, R.F.B.; Batistella, M.; Moran, E.F. Socioeconomic changes and environmental policies as dimensions of regional land transitions in the Atlantic Forest, Brazil. Environ. Sci. Policy 2017, 74, 14–22. [Google Scholar] [CrossRef]
  3. Ahammad, R.; Stacey, N.; Eddy, I.M.S.; Tomscha, S.A.; Sunderland, T.C.H. Recent trends of forest cover change and ecosystem services in eastern upland region of Bangladesh. Sci. Total Environ. 2019, 647, 379–389. [Google Scholar] [CrossRef] [PubMed]
  4. Liu, J.; Coomes, D.A.; Gibson, L.; Hu, G.; Liu, J.; Luo, Y.; Wu, C.; Yu, M. Forest fragmentation in China and its effect on biodiversity. Biol. Rev. 2019, 94, 1636–1657. [Google Scholar] [CrossRef] [PubMed]
  5. Sun, X.; Tang, H.; Yang, P.; Hu, G.; Liu, Z.; Wu, J. Spatiotemporal patterns and drivers of ecosystem service supply and demand across the conterminous United States: A multiscale analysis. Sci. Total Environ. 2020, 703, 135005. [Google Scholar] [CrossRef]
  6. Newbold, T.; Hudson, L.N.; Hill, S.L.L.; Contu, S.; Lysenko, I.; Senior, R.A.; Börger, L.; Bennett, D.J.; Choimes, A.; Collen, B.; et al. Global effects of land use on local terrestrial biodiversity. Nature 2015, 520, 45–50. [Google Scholar] [CrossRef] [Green Version]
  7. Luo, Y.; Chen, H.Y.H.; McIntire, E.J.B.; Andison, D.W. Divergent temporal trends of net biomass change in western Canadian boreal forests. J. Ecol. 2019, 107, 69–78. [Google Scholar] [CrossRef]
  8. Garg, T. Ecosystems and human health: The local benefits of forest cover in Indonesia. J. Environ. Econ. Manag. 2019, 98, 102271. [Google Scholar] [CrossRef] [Green Version]
  9. Geeraert, L.; Hulsmans, E.; Helsen, K.; Berecha, G.; Aerts, R.; Honnay, O. Rapid diversity and structure degradation over time through continued coffee cultivation in remnant Ethiopian Afromontane forests. Biol. Conserv. 2019, 236, 8–16. [Google Scholar] [CrossRef]
  10. Marcos-Martinez, R.; Bryan, B.A.; Schwabe, K.A.; Connor, J.D.; Law, E.A.; Nolan, M.; Sánchez, J.J. Projected social costs of CO2 emissions from forest losses far exceed the sequestration benefits of forest gains under global change. Ecosyst. Serv. 2019, 37, 100935. [Google Scholar] [CrossRef]
  11. Thomsen, M.S.; Godbold, J.A.; Garcia, C.; Bolam, S.G.; Parker, R.; Solan, M. Compensatory responses can alter the form of the biodiversity–function relation curve. Proc. R. Soc. B Biol. Sci. 2019, 286, 20190287. [Google Scholar] [CrossRef] [PubMed]
  12. Haddad, N.M.; Brudvig, L.A.; Clobert, J.; Davies, K.F.; Gonzalez, A.; Holt, R.D.; Lovejoy, T.E.; Sexton, J.O.; Austin, M.P.; Collins, C.D.; et al. Habitat fragmentation and its lasting impact on Earth’s ecosystems. Sci. Adv. 2015, 1, e1500052. [Google Scholar] [CrossRef] [PubMed] [Green Version]
  13. Lewis, S.L.; Edwards, D.P.; Galbraith, D. Increasing human dominance of tropical forests. Science (80-.) 2015, 349, 827–832. [Google Scholar] [CrossRef] [PubMed]
  14. Kim, J.H.; Hwang, T.; Yang, Y.; Schaaf, C.L.; Boose, E.; Munger, J.W. Warming-Induced Earlier Greenup Leads to Reduced Stream Discharge in a Temperate Mixed Forest Catchment. J. Geophys. Res. Biogeosci. 2018, 123, 1960–1975. [Google Scholar] [CrossRef]
  15. Milheiras, S.G.; Mace, G.M. Assessing ecosystem service provision in a tropical region with high forest cover: Spatial overlap and the impact of land use change in Amapá, Brazil. Ecol. Indic. 2019, 99, 12–18. [Google Scholar] [CrossRef]
  16. Stoorvogel, J.J.; Antle, J.M.; Crissman, C.C.; Bowen, W. The tradeoff analysis model: Integrated bio-physical and economic modeling of agricultural production systems. Agric. Syst. 2004, 80, 43–66. [Google Scholar] [CrossRef]
  17. Vidal-Legaz, B.; Martínez-Fernández, J.; Picón, A.S.; Pugnaire, F.I. Trade-offs between maintenance of ecosystem services and socio-economic development in rural mountainous communities in southern Spain: A dynamic simulation approach. J. Environ. Manag. 2013, 131, 280–297. [Google Scholar] [CrossRef]
  18. Liu, Y.; Feng, Y.; Zhao, Z.; Zhang, Q.; Su, S. Socioeconomic drivers of forest loss and fragmentation: A comparison between different land use planning schemes and policy implications. Land Use Policy 2016, 54, 58–68. [Google Scholar] [CrossRef]
  19. Chen, W.; Zhao, H.; Li, J.; Zhu, L.; Wang, Z.; Zeng, J. Land use transitions and the associated impacts on ecosystem services in the Middle Reaches of the Yangtze River Economic Belt in China based on the geo-informatic Tupu method. Sci. Total Environ. 2020, 701, 134690. [Google Scholar] [CrossRef] [PubMed]
  20. Taubert, F.; Fischer, R.; Groeneveld, J.; Lehmann, S.; Müller, M.S.; Rödig, E.; Wiegand, T.; Huth, A. Global patterns of tropical forest fragmentation. Nature 2018, 554, 519–522. [Google Scholar] [CrossRef]
  21. Keenan, R.J.; Reams, G.A.; Achard, F.; de Freitas, J.V.; Grainger, A.; Lindquist, E. Dynamics of global forest area: Results from the FAO Global Forest Resources Assessment 2015. For. Ecol. Manag. 2015, 352, 9–20. [Google Scholar] [CrossRef]
  22. Kröger, M. Deforestation, cattle capitalism and neodevelopmentalism in the Chico Mendes Extractive Reserve, Brazil. J. Peasant Stud. 2020, 47, 464–482. [Google Scholar] [CrossRef]
  23. Mikoláš, M.; Svitok, M.; Teodosiu, M.; Nagel, T.A.; Svoboda, M. Land use planning based on the connectivity of tree species does not ensure the conservation of forest biodiversity. Land Use Policy 2019, 83, 63–65. [Google Scholar] [CrossRef]
  24. Soterroni, A.C.; Mosnier, A.; Carvalho, A.X.Y.; Câmara, G.; Obersteiner, M.; Andrade, P.R.; Souza, R.C.; Brock, R.; Pirker, J.; Kraxner, F.; et al. Future environmental and agricultural impacts of Brazil’s Forest Code. Environ. Res. Lett. 2018, 13, 074021. [Google Scholar] [CrossRef] [Green Version]
  25. Ferreira, I.J.M.; Bragion, G.d.R.; Ferreira, J.H.D.; Benedito, E.; Couto, E.V.d. Landscape pattern changes over 25 years across a hotspot zone in southern Brazil. South. For. 2019, 81, 175–184. [Google Scholar] [CrossRef]
  26. Chazdon, R.L. Towards more effective integration of tropical forest restoration and conservation. Biotropica 2019, 51, 463–472. [Google Scholar] [CrossRef]
  27. Pacheco, F.A.L.; Varandas, S.G.P.; Sanches Fernandes, L.F.; Valle Junior, R.F. Soil losses in rural watersheds with environmental land use conflicts. Sci. Total Environ. 2014, 485–486, 110–120. [Google Scholar] [CrossRef]
  28. Valle Junior, R.F.; Varandas, S.G.P.; Pacheco, F.A.L.; Pereira, V.R.; Santos, C.F.; Cortes, R.M.V.; Sanches Fernandes, L.F. Impacts of land use conflicts on riverine ecosystems. Land Use Policy 2015, 43, 48–62. [Google Scholar] [CrossRef] [Green Version]
  29. Pacheco, F.A.L.; Sanches Fernandes, L.F. Environmental land use conflicts in catchments: A major cause of amplified nitrate in river water. Sci. Total Environ. 2016, 548–549, 173–188. [Google Scholar] [CrossRef]
  30. Brancalion, P.H.S.; Niamir, A.; Broadbent, E.; Crouzeilles, R.; Barros, F.S.M.; Almeyda Zambrano, A.M.; Baccini, A.; Aronson, J.; Goetz, S.; Reid, J.L.; et al. Global restoration opportunities in tropical rainforest landscapes. Sci. Adv. 2019, 5, eaav3223. [Google Scholar] [CrossRef] [Green Version]
  31. Pissarra, T.C.T.; Valera, C.A.; Costa, R.C.A.; Siqueira, H.E.; Martins Filho, M.V.; Valle Júnior, R.F.d.; Sanches Fernandes, L.F.; Pacheco, F.A.L. A regression model of stream water quality based on interactions between landscape composition and riparian buffer width in small catchments. Water 2019, 11, 1757. [Google Scholar] [CrossRef] [Green Version]
  32. Tomppo, E. RESOURCE ASSESSMENT|Forest Resources. In Encyclopedia of Forest Sciences; Elsevier: Amsterdam, The Netherlands, 2004; pp. 965–973. ISBN 9789251305614. [Google Scholar]
  33. Grab, H.; Poveda, K.; Danforth, B.; Loeb, G. Landscape context shifts the balance of costs and benefits from wildflower borders on multiple ecosystem services. Proc. R. Soc. B Biol. Sci. 2018, 285, 20181102. [Google Scholar] [CrossRef] [PubMed]
  34. Costa, R.C.A.; Pereira, G.T.; Tarlé Pissarra, T.C.; Silva Siqueira, D.; Sanches Fernandes, L.F.; Vasconcelos, V.; Fernandes, L.A.; Pacheco, F.A.L. Land capability of multiple-landform watersheds with environmental land use conflicts. Land Use Policy 2019, 81, 689–704. [Google Scholar] [CrossRef]
  35. Niemeyer, J.; Barros, F.S.M.; Silva, D.S.; Crouzeilles, R.; Vale, M.M. Planning forest restoration within private land holdings with conservation co-benefits at the landscape scale. Sci. Total Environ. 2020, 717, 135262. [Google Scholar] [CrossRef] [PubMed]
  36. Fearnside, P.M. Brazilian politics threaten environmental policies. Science (80-.) 2016, 353, 746–748. [Google Scholar] [CrossRef] [PubMed]
  37. Lahsen, M.; Bustamante, M.M.C.; Dalla-Nora, E.L. Undervaluing and overexploiting the Brazilian Cerrado at our peril. Environ. Sci. Policy Sustain. Dev. 2016, 58, 4–15. [Google Scholar] [CrossRef] [Green Version]
  38. Soares-Filho, B.; Rajao, R.; Macedo, M.; Carneiro, A.; Costa, W.; Coe, M.; Rodrigues, H.; Alencar, A. Cracking Brazil’s Forest Code. Science (80-.) 2014, 344, 363–364. [Google Scholar] [CrossRef] [PubMed]
  39. Brancalion, P.H.S.; Garcia, L.C.; Loyola, R.; Rodrigues, R.R.; Pillar, V.D.; Lewinsohn, T.M. Análise crítica da Lei de Proteção da Vegetação Nativa (2012), que substituiu o antigo Código Florestal: Atualizações e ações em curso. Nat. Conserv. 2016, 14, e1–e16. [Google Scholar] [CrossRef] [Green Version]
  40. Strassburg, B.B.N.; Brooks, T.; Feltran-Barbieri, R.; Iribarrem, A.; Crouzeilles, R.; Loyola, R.; Latawiec, A.E.; Oliveira Filho, F.J.B.; Scaramuzza, C.A.d.M.; Scarano, F.R.; et al. Moment of truth for the Cerrado hotspot. Nat. Ecol. Evol. 2017, 1, 0099. [Google Scholar] [CrossRef]
  41. Roitman, I.; Cardoso Galli Vieira, L.; Baiocchi Jacobson, T.K.; da Cunha Bustamante, M.M.; Silva Marcondes, N.J.; Cury, K.; Silva Estevam, L.; da Costa Ribeiro, R.J.; Ribeiro, V.; Stabile, M.C.C.; et al. Rural environmental registry: An innovative model for land-use and environmental policies. Land Use Policy 2018, 76, 95–102. [Google Scholar] [CrossRef]
  42. Valera, C.A.; Pissarra, T.C.T.; Martins Filho, M.V.; Valle Junior, R.F.; Sanches Fernandes, L.F.; Pacheco, F.A.L. A legal framework with scientific basis for applying the ‘polluter pays principle’ to soil conservation in rural watersheds in Brazil. Land Use Policy 2017, 66, 61–71. [Google Scholar] [CrossRef] [Green Version]
  43. Valera, C.; Pissarra, T.; Filho, M.; Valle Júnior, R.; Oliveira, C.; Moura, J.; Sanches Fernandes, L.; Pacheco, F. The buffer capacity of riparian vegetation to control water quality in anthropogenic catchments from a legally protected area: A critical view over the Brazilian New Forest Code. Water 2019, 11, 549. [Google Scholar] [CrossRef] [Green Version]
  44. Nagendra, H.; Lucas, R.; Honrado, J.P.; Jongman, R.H.G.; Tarantino, C.; Adamo, M.; Mairota, P. Remote sensing for conservation monitoring: Assessing protected areas, habitat extent, habitat condition, species diversity, and threats. Ecol. Indic. 2013, 33, 45–59. [Google Scholar] [CrossRef]
  45. Almeida, D.R.A.; Stark, S.C.; Chazdon, R.; Nelson, B.W.; Cesar, R.G.; Meli, P.; Gorgens, E.B.; Duarte, M.M.; Valbuena, R.; Moreno, V.S.; et al. The effectiveness of lidar remote sensing for monitoring forest cover attributes and landscape restoration. For. Ecol. Manag. 2019, 438, 34–43. [Google Scholar] [CrossRef]
  46. Kotchetkoff-Henriques, O.; Joly, C.A.; Bernacci, L.C. Relação entre o solo e a composição florística de remanescentes de vegetação natural no Município de Ribeirão Preto, SP. Rev. Bras. Botânica 2005, 28, 541–562. [Google Scholar] [CrossRef]
  47. Henriques, O.K. Caracterização da Vegetação Natural em RIBEIRÃO PRETO, SP: Bases Para Conservação; Universidade de São Paulo: Ribeirão Preto, Brazil, 2003. [Google Scholar]
  48. Liang, J.; Gong, J.; Li, W. Applications and impacts of Google Earth: A decadal review (2006–2016). ISPRS J. Photogramm. Remote Sens. 2018, 146, 91–107. [Google Scholar] [CrossRef]
  49. Potapov, P.; Yaroshenko, A.; Turubanova, S.; Dubinin, M.; Laestadius, L.; Thies, C.; Aksenov, D.; Egorov, A.; Yesipova, Y.; Glushkov, I.; et al. Mapping the world’s intact forest landscapes by remote sensing. Ecol. Soc. 2008, 13, art51. [Google Scholar] [CrossRef] [Green Version]
  50. Rocchini, D.; Petras, V.; Petrasova, A.; Horning, N.; Furtkevicova, L.; Neteler, M.; Leutner, B.; Wegmann, M. Open data and open source for remote sensing training in ecology. Ecol. Inform. 2017. [Google Scholar] [CrossRef]
  51. Yu, H.; Liu, X.; Kong, B.; Li, R.; Wang, G. Landscape ecology development supported by geospatial technologies: A review. Ecol. Inform. 2019, 51, 185–192. [Google Scholar] [CrossRef]
  52. Panizza, A.D.C.; Fonseca, F.P. Técnicas de interpretação visual de imagens. GEOUSP Espaço e Tempo 2011, 30. [Google Scholar] [CrossRef]
  53. Pissarra, T.C.T.; Marcussi, A.B.; Leão, G.d.R.; Galbiatti, J.A.; Borges, M.J.; Campos, S. Environmental adaptation of the source of the subbasin of Rico Stream, Monte Alto-SP, Brazil. Eng. Agrícola 2013, 33, 303–311. [Google Scholar] [CrossRef] [Green Version]
  54. Carranza, M.L.; Hoyos, L.; Frate, L.; Acosta, A.T.R.; Cabido, M. Measuring forest fragmentation using multitemporal forest cover maps: Forest loss and spatial pattern analysis in the Gran Chaco, central Argentina. Landsc. Urban Plan. 2015. [Google Scholar] [CrossRef]
  55. Chapungu, L.; Takuba, N.; Zinhiva, H. A multi-method analysis of forest fragmentation and loss: The case of ward 11, Chiredzi District of Zimbabwe. Afr. J. Environ. Sci. Technol. 2014. [Google Scholar] [CrossRef] [Green Version]
  56. Rahman, F.M.; Jashimuddin, M.; Kamrul, I.; Kumar Nath, T. Land use change and forest fragmentation analysis: A geoinformatics approach on chunati wildlife sanctuary, bangladesh. J. Civ. Eng. Environ. Sci. 2016. [Google Scholar] [CrossRef] [Green Version]
  57. Chaturvedi, M.D. Measurements of Forest Crops; Oxford University Press: London, UK, 1926. [Google Scholar]
  58. Perry, D.A.; Oren, R.; Hart, S.C. Forest Ecosytems; Johns Hopkins University Press: Baltimore, MD, USA, 2008. [Google Scholar]
  59. IBGE. Produção Agrícola; Instituto Brasileiro de Geografia e Estatística: Ribeirão Preto, Brazil, 2018. [Google Scholar]
  60. Appolinário, V.; Oliveira Filho, A.T.; Guilherme, F.A.G. Tree population and community dynamics in a Brazilian tropical semideciduous forest. Rev. Bras. Botânica 2005, 28, 347–360. [Google Scholar] [CrossRef] [Green Version]
  61. Adami, M.; Rudorff, B.F.T.; Freitas, R.M.; Aguiar, D.A.; Sugawara, L.M.; Mello, M.P. Remote sensing time series to evaluate direct land use change of recent expanded sugarcane crop in Brazil. Sustainability 2012, 4, 574–585. [Google Scholar] [CrossRef] [Green Version]
  62. Casanova, D.C.; Pereira, L.C.G.; Campos, S.; Pissarra, T.C.T. Levantamento dos fragmentos florestais situados dentro da Área de Preservação Permanente ao longo da rede de drenagem da microbacia do córrego do Jaboticabal. Periódico Eletrônico Fórum Ambient. da Alta Paul. 2010, 6. [Google Scholar] [CrossRef]
  63. Greggio, T.C.; Pissarra, T.C.T.; Rodrigues, F.M. Avaliação dos fragmentos florestais do município de Jaboticabal-SP. Rev. Árvore 2009, 33, 117–124. [Google Scholar] [CrossRef]
  64. Etto, T.L.; Longo, R.M.; Arruda, D.d.R.; Invenioni, R. Ecologia da paisagem de remanescentes florestais na bacia hidrográfica do Ribeirão das Pedras-Campinas-SP. Rev. Árvore 2013, 37, 1063–1071. [Google Scholar] [CrossRef] [Green Version]
  65. Penido, G.; Ribeiro, V.; Fortunato, D. Edge effect on post-dispersal artificial seed predation in the southeastern Amazonia, Brazil. Braz. J. Biol. 2015, 75, 347–351. [Google Scholar] [CrossRef] [Green Version]
  66. Santos, R.C.d.; Lima, M.; Silva Junior, C.A.d.; Battirola, L.D. Disordered conversion of vegetation committees connectivity between forest fragments in the Brazilian Legal Amazon. Appl. Geogr. 2019, 111, 102082. [Google Scholar] [CrossRef]
  67. Metzger, J.P.; Bustamante, M.M.C.; Ferreira, J.; Fernandes, G.W.; Librán-Embid, F.; Pillar, V.D.; Prist, P.R.; Rodrigues, R.R.; Vieira, I.C.G.; Overbeck, G.E. Why Brazil needs its Legal Reserves. Perspect. Ecol. Conserv. 2019, 17, 91–103. [Google Scholar] [CrossRef]
  68. Rodrigues, R.R.; Bononi, V.L.R. (Eds.) Diretrizes Para a Conservação e Restauração da Biodiversidade no Estado de São Paulo; Programa Biota/FAPESP, Instituto de Botânica, Fundação de Amparo a Pesquisa do Estado de São Paulo (FAPESP), Secretaria do Meio Ambiente: São Paulo, Brazil, 2008. [Google Scholar]
  69. Calegari, L.; Martins, S.V.; Gleriani, J.M.; Silva, E.; Busato, L.C. Análise da dinâmica de fragmentos florestais no município de Carandaí, MG, para fins de restauração florestal. Rev. Árvore 2010, 34, 871–880. [Google Scholar] [CrossRef] [Green Version]
  70. Ghazoul, J.; Chazdon, R. Degradation and Recovery in Changing Forest Landscapes: A Multiscale Conceptual Framework. Annu. Rev. Environ. Resour. 2017, 42, 161–188. [Google Scholar] [CrossRef] [Green Version]
  71. Gass, S.L.B.; Verdum, R.; Corbonnois, J.; Laurent, F. Áreas de preservação permanente (APPs) no Brasil e na França: um comparativo. Confins 2016, 27, 1–19. [Google Scholar] [CrossRef]
  72. Ekpodessi, S.G.N.; Nakamura, H. Land use and management in Benin Republic: An evaluation of the effectiveness of Land Law 2013-01. Land Use Policy 2018, 78, 61–69. [Google Scholar] [CrossRef]
Figure 1. Geographic location of the political and administrative unit of Ribeirão Preto (São Paulo state, Brazil).
Sustainability 12 05686 g001
Figure 2. Spatial distribution of forest fragments in the political and administrative unit of Ribeirão Preto in 2010, 2013 and 2016. The upper panels (ac) are graduated according to area, the lower (df) according to circularity index.
Sustainability 12 05686 g002
Figure 3. Distribution of forest fragments within buffers of predefined width defined along the watercourses of Ribeirão Preto in 2010, 2013 and 2016.
Sustainability 12 05686 g003
Table 1. Distribution of forest fragments per area (ha) and perimeter (m) classes in the political and administrative unit of Ribeirão Preto in the years of 2010, 2013 and 2016. Symbols: Count—number of forest fragments; A—Total area of forest fragments, FA—Average area of forest fragments.
Forest Fragments201020132016
Count%A (hm2)%FA (ha)Count%A (hm2)%FA (ha)Count%A (hm2)%FA (ha)
Classes of area (hm2)
<521454462.692.223356494.792.125156539.5102.1
5–106617476.197.26716482.997.27517542.7107.2
10–205213712.11413.75213712.11413.75613761.21413.6
20–8049121691.73334.549121691.73234.551111745.93234.2
80–2001131254.624114.11131254.624114.11121254.623114.1
>20010588.411588.410588.411588.410588.411588.4
Total3931005185.610014.214131005224.510013.44451005432.310012.2
Classes of perimeter (m)
<100016542105,7046638.818044114,5626636.519243123,5146643.3
1000–1500631677,71261233.5651680,18161233.6701686,14061230.57
1500–200031854,31751752.233857,84051752.741971,60761746.95
2000–250025656,84652273.826659,06152271.630768,44052281.33
2500–3500359103,447132955.6358103,447132955.6368106,123122947.86
3500–55005013215,740254314.85012215,740244314.85111220,279284319.2
5500–50,000246275,1794111,465.8246275,1794111,465.8256281,2553811,250.2
Total393100888,9451002262413100906,0101002193445100957,3581002151
Table 2. Distribution of forest fragments per class of circularity index (CI) in the political and administrative unit of Ribeirão Preto in the years of 2010, 2013 and 2016.
CI Classes201020132016
Count%Count%Count%
<0.177920.18219.98519.1
0.17–0.518647.319547.221949.2
0.5–0.64110.44210.2449.9
0.6–0.74010.24510.94710.6
0.7–0.8369.2389.2398.8
0.8–1.0112.8112.7112.5
Total393100413100445100

