Article

The Sustainability of Living in a “Green” Urban District: An Emergy Perspective

1
Division of Landscape Architecture, Department of Urban and Rural Development, Swedish University of Agricultural Sciences (SLU), 75007 Uppsala, Sweden
2
Division of Environmental Communication, Department of Urban and Rural Development, Swedish University of Agricultural Sciences (SLU), 75007 Uppsala, Sweden
3
Research Program Natural Resources and Sustainable Development, Department of Earth Sciences, Uppsala University, 75236 Uppsala, Sweden
4
Company Ethos and Lelou Konsult, 75231 Uppsala, Sweden
*
Author to whom correspondence should be addressed.
Sustainability 2020, 12(14), 5661; https://doi.org/10.3390/su12145661
Submission received: 24 June 2020 / Revised: 7 July 2020 / Accepted: 9 July 2020 / Published: 14 July 2020

Abstract

:
While urban areas hold great potential for contributing to sustainable development, there is a critical need to better understand and verify what measures improve urban sustainability. To achieve this, this project implements emergy synthesis to evaluate the environmental support to a building—called Smaragden—located in a certified “green” urban district in Uppsala, Sweden. Inputs to the building’s construction and maintenance phases are accounted for, as are flows supporting the residents’ everyday practices (i.e., urban life), on a yearly per capita basis. In this way, the relative importance of lifestyle issues versus the built environment is quantified and compared. Key focus areas are identified where efficiency and sustainability gains are most likely. The emergy synthesis detailed the top contributors to urban resource consumption and revealed that both the lifestyle and built environment in Smaragden are highly unsustainable, ranking poorly in terms of the emergy indices calculated, and, when considered from a global emergy perspective, overshooting resource consumption by more than 70 times. The paper therefore concludes that interdependencies of urban districts on systems at larger scales of society and environment need to be explicitly addressed and actively incorporated in urban policy and planning, and that design interventions are hence grounded in a systems perspective on urban sustainability.

1. Introduction

Urban areas require large quantities of land and natural resources to continuously provide food, water, shelter and energy for their inhabitants [1]. In an increasingly tele-coupled world, the impacts of urban resource consumption and development are widely externalized to other landscapes [2]. When assessing urban sustainability, internalizing impacts of distant interactions is therefore key, requiring approaches that simultaneously consider local and externalized resource use. Numerous studies taking such inclusive approaches detail the poor sustainability of urban systems (e.g., [3,4,5,6,7,8]), and, since 68% of populations are forecasted to live in cities by 2050 [9], the unsustainable nature of urban areas and lifestyles presents a substantial and critical problem for future development.
Cities can be considered heterogeneous, complex, adaptive, coevolving human–environment systems; while their development is not fully predictable, they should be influenced and guided towards more desirable and sustainable directions [10]. However, while urban sustainability is pivotal to sustainable development, its conceptualization in public discourse has its share of critics: similar to green-washed sustainable consumerism, urban sustainability could be simplified to a willingness and ability to pay for “green” products and services [11]. Consequently, there is a need in urban planning for deeper and more comprehensive notions of sustainability and its complexity, as well as approaches to identify what measures do improve urban sustainability (cf. [12]).
Planners and policymakers have sought to increase urban sustainability through policies and initiatives targeting efficient energy-use and optimization of urban functions through technological innovations [13]. However, the expectation that large-scale development of “technologically advanced, knowledge-intense buildings, infrastructure and services” will result in decreased environmental impacts is unsupported [13]: few studies have documented an overall reduction in resource consumption resulting from innovative technological solutions. While this can be partly explained by inconsistent or even paradoxical conceptualizations of urban efficiency and sustainability (e.g., [5]), the continuous disregard of such phenomena is an important and disconcerting observation, especially when other critical issues, such as rebound effects and increased volumes of consumption, overrun technological efficiency gains [14,15] but also remain overlooked. Thus, smart technologies alone are not able to address the complex unsustainable nature of cities.
For a more comprehensive understanding of urban sustainability, the broader environmental support (i.e., the externalized and indirect resource consumption) that underpins and sustains urban life is of high relevance to explore. Consequently, this paper uses the concept of emergy, which synthesizes all direct and indirect resource use required to sustain any system [16]. From an emergy systems perspective, the emphasis is placed on whether specific technologies, or human consumer behavior, result in lower total aggregate resource use, as well as larger relative shares of renewable resources. The emergy perspective on urban sustainability applied in this paper also explains the absence of climate change related aspects of urban development; while CO2 emissions are considered important environmental impacts originating in urban areas, emergy focuses exclusively on environmental support, representing the cause, or upstream system drivers, of the urban sustainability predicament, which constitutes the main focus in this paper.

Aim and Principal Conclusions

The aim of this study was to evaluate the environmental support to a building and its residents’ everyday practices (i.e., urban life) observed in Rosendal, an urban district in Uppsala, Sweden. As one of the first urban districts in Sweden to be “green” certified, or certified sustainable, according to the Sweden Green Building Council’s (SGBC) Miljöbyggnad certification [17,18], Rosendal was selected as a case representing formal efforts by Uppsala municipality to achieve sustainable urban development. According to SGBC, certification schemes provide clear quality assurance to assessed projects, and their Miljöbyggnad certification, a Swedish environmental certification focusing on “good environments to live, work and play in”, carefully assesses projects with sixteen different indicators for energy use, indoor environment, and materials with the objective of ensuring social and environmental wellbeing [19]. The study was delimited by selecting one of the first completed buildings, Smaragden, in Rosendal to represent the built environment and urban life in this district. Smaragden is an apartment complex comprising 115 micro dwellings, between 23 and 48 m2, initially marketed emphasizing sustainable and space-efficient living [20].
The study evaluated the emergy support to construction and maintenance of the building, as well as to maintain the lifestyles of its residents. Specific input categories dominating total resource use were identified and accounted for, in order to compare and contrast the relative importance of lifestyle issues versus the built environment (i.e., which resource use categories are the largest), and consequently have a greater potential to enable overall progression towards resource-efficiency at local and aggregate levels of society and the environment.

2. Materials and Methods

This study is a part of a larger interdisciplinary research project evaluating urban sustainability from environmental, social, and policy perspectives. This paper exclusively focuses on biophysical and environmental support aspects, whereas policy and resident perspectives are examined in other papers originating from this project. Emergy accounting data and calculations are presented in full in the emergy tables and accompanying notes (Appendix A).

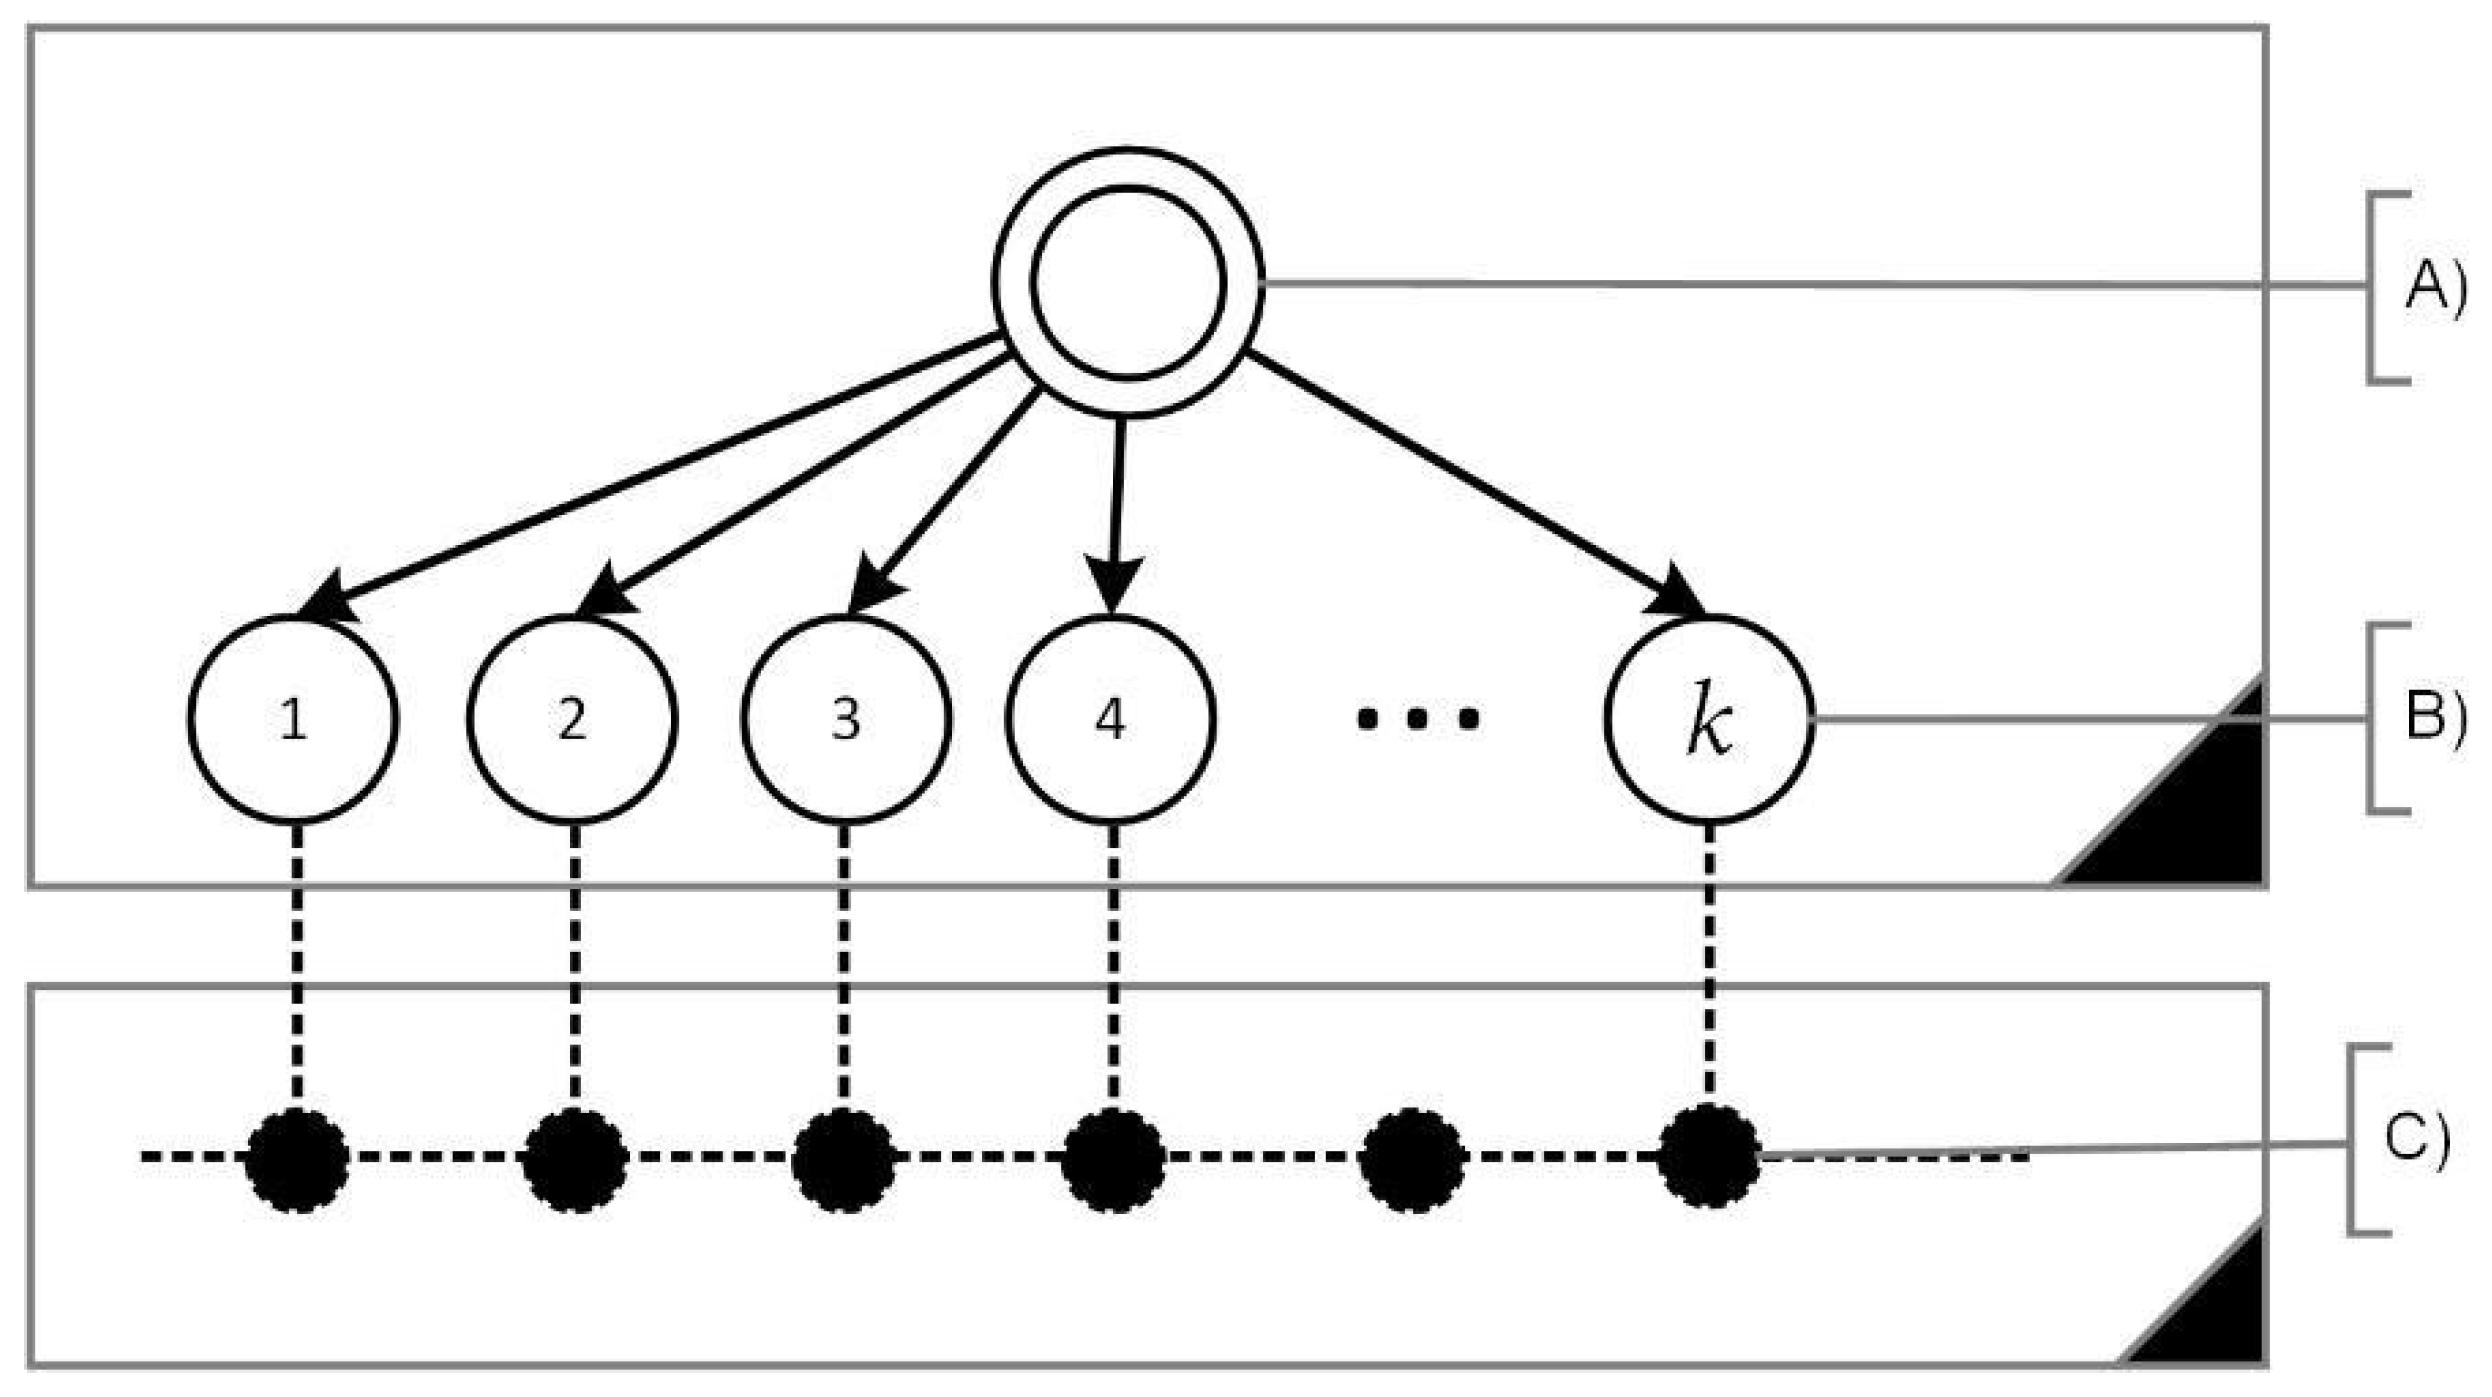
2.1. Emergy Synthesis

Due to the wide range of primarily imported resources that urban districts depend on, the case study was evaluated using emergy synthesis [21]. This method was selected due to its ability to account for energy and material flows and the indirect environmental work behind such system inputs, in addition to human processes such as labor and services [16]. Primary global environmental sources of energy (i.e., solar radiation, tidal momentum and geothermal sources) drive all other earth processes; once in the geobiosphere, their availability is used up and assigned as emergy to secondary and tertiary renewable flows [22]. The estimated sum of these primary resource flows on a global and yearly basis results in the Global Emergy Baselines (GEB) (i.e., 1.21 × 1025 Sej) [22]. The GEB can also be construed as the Global Renewable Emergy Constant (GREC) (⍬) [23], which serves as the basis for the productivity of environmental systems and all subsequent economic and human systems. Additionally, the series of transformation processes behind specific input resources, how each resource is created, is expressed in one unit: solar emergy joules (sej). Depending on how resources are produced and supplied to a system, each input is associated with its own unique Unit Emergy Value (UEV). In this study, and to the extent possible, UEVs from the literature were sourced from other emergy studies in as similar a context as possible, and double checked for accuracy. All UEVs were adjusted to the GEB proposed by Brown et. al. [24], 12 × 1024 seJ/year, and are given in emergy per unit of input (e.g., sej/J, sej/g, and sej/SEK).

2.1.1. Emergy Indices and Ratios

Emergy indices and ratios are calculated and used to evaluate the behavior of systems [25] to detect points for improvement and facilitate exploration of alternative routes for development that could execute the same functions in more efficient and sustainable ways. The indices and ratios used in this study are listed in Table 1.

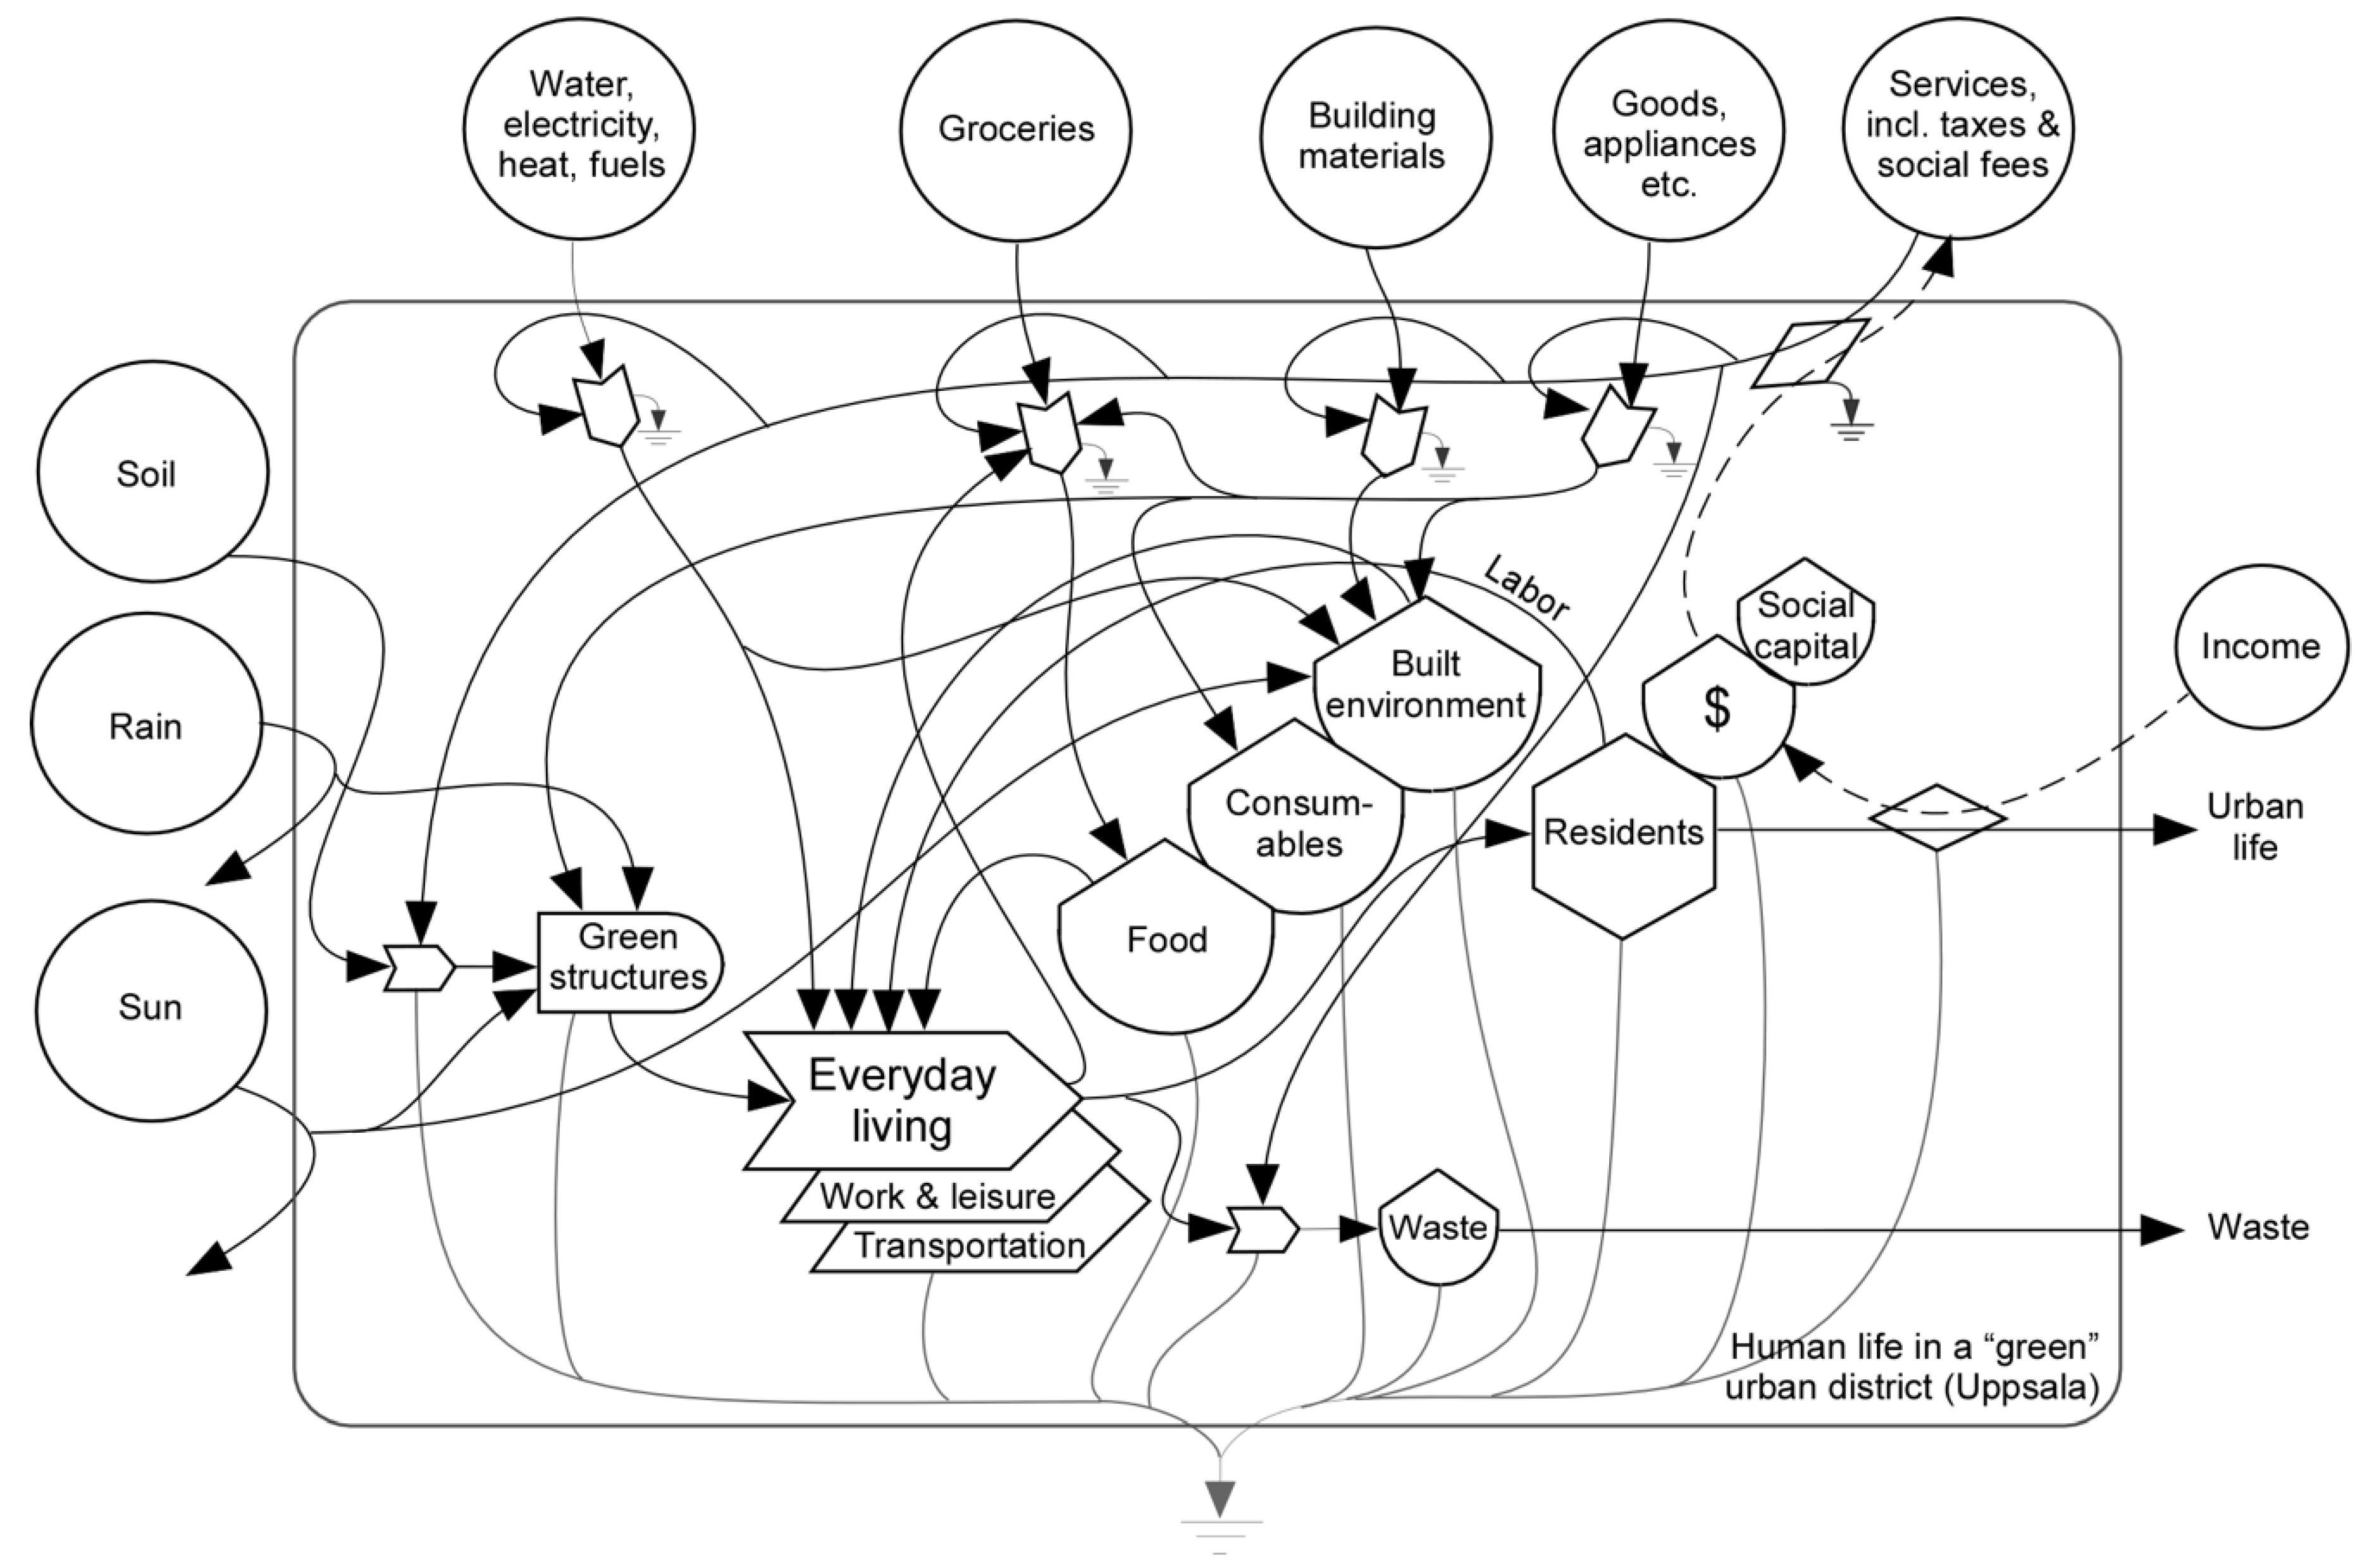
2.1.2. Emergy Systems Diagramming

To describe the processes required for construction and maintenance of the building Smaragden, Participatory Emergy Synthesis (P-ES) was used. Drawing on Bergquist et al. [26], P-ES in this study was operationalized as a stakeholder workshop with key informants involved in the planning, design and construction phase: an architect from the real estate developer [20] and foremen and builders from the construction company (PEAB). In this exercise, the informants were asked to reflect on and discuss the required components for completing this particular building project. Post-it notes and a large white board were used as aids to label, list and organize all individual components used in the construction phase. Additionally, estimates were made of additional inputs required in the maintenance phase.
The P-ES workshop was facilitated by a member from the research team, with the task of supporting the discussion by reminding participants to consider inputs from a broad systems perspective. The result was an initial sketch—a flow chart—of energy, material, and other resource flows required to construct and maintain the physical building, anchored in the stakeholders’ expertise and perceptions. This empirical material was then converted into an emergy systems diagram, in accordance with emergy diagram conventions [21], by the research team.

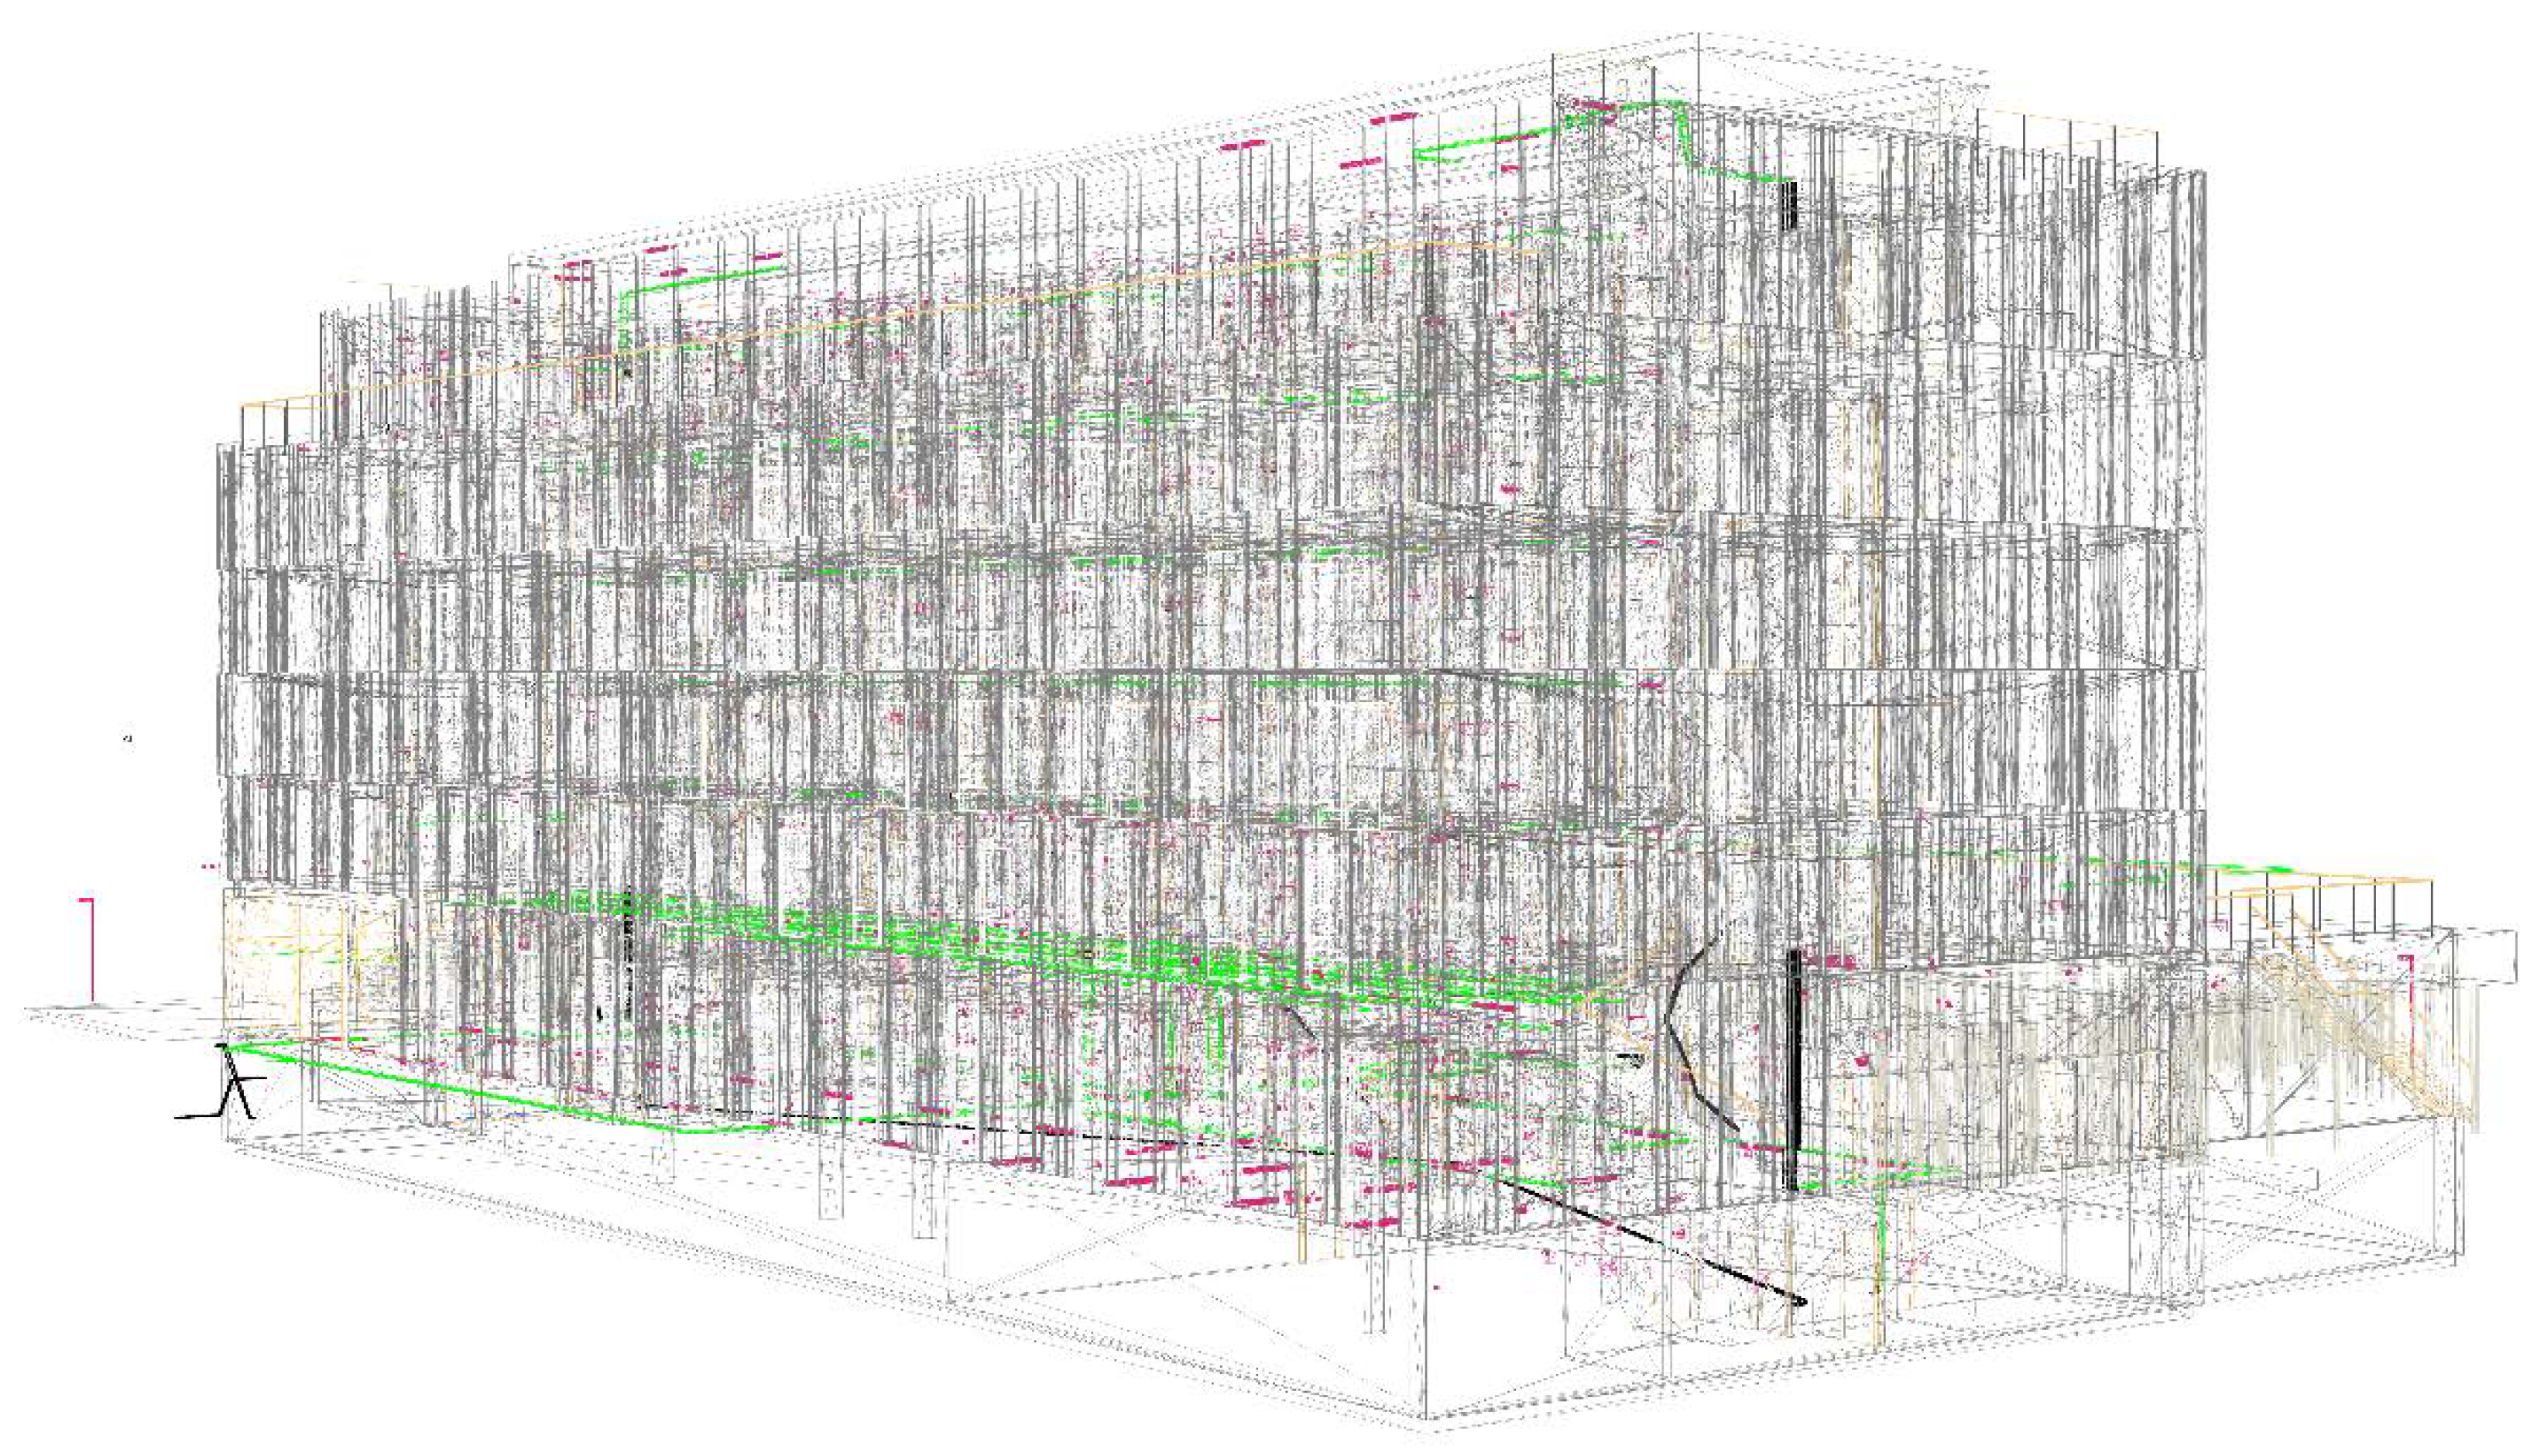
2.2. Raw Data Acquisition

Drawing on the input categories identified using P-ES, quantitative data for the built environment was obtained from Computer Aided Design (CAD) files and plan documents produced by the real estate developer and construction company. The processing and analysis of these data consisted of an industry standard practice of model-based estimation [27,28,29]. Specifically, processing notes from design descriptions by the building architect, third-party technical reports used for building permits, and CAD structural, CAD architectural, CAD electrical, CAD plumbing, and CAD ventilation models, as illustrated in Figure 1.
The model-based estimation however was hampered due to inconsistencies in the CAD files that were developed around 2010–2013 by different actors, software, and standards (i.e., not in BIM, ISO, LEED, or SB 2030 standards). For example, the CAD models data lacked volume, weights, and items with multiple resources and dimensions. Therefore, item specific controls and estimates had to be done for all data (e.g., 564 windows, 2793 m of cables, 1895 electrical fixtures, etc.). Specifically, solving for each item’s resource weight required: (1) estimating each item’s volume in cubic millimeters; and (2) estimating specific resource weight percentage (wt%) or fractional mass density (e.g., 90% copper and 10% plastic). The equation for this model-based estimation is shown below, and the process is visually explained in Figure 2.
x1 = Vol1 × wt%1 × µDx
  • A database of specific items was needed to complete the construction: ~352 Structural columns, 4182 walls, 354 masonry blocks, 652 paint areas, 1026 doors, 546 windows, 8870 m of cables, 5037 ventilation ducts/fittings, 153 radiators, 2 KONE elevators, 1895 electrical fixtures, 4438 plumbing items, etc.
  • A classification of items by resource use (copper, steel, glass, etc.) was used for the determination of X element µD from formal standards (e.g., copper = 8.96 g/cm³).
  • If not specified (e.g., no volume or weight), secondary sources from the literature were used to determine the item specific weight per unit (e.g., 200 kg per 100 m of cable) and the fractional mass density (e.g., USA EPA/ NEMA: wt% of 3LEAD cable is 7% plastic and 93% copper).
Since calculations were made on a per item and millimeter basis, this approach produced a high level of detail regarding the minimum amount of resources. Where the item-specific product sheet was missing or incomplete, proxy estimation by mass fractional densities was based on for example Life Cycle Analysis (LCA) studies. In such cases, the amount of error was reduced given the borders of analysis, which excluded the more uncertain parts of LCA analysis (e.g., the LCI for manufacturing, transport, maintenance and end-life) which are inherently highly sensitive to location (regulation, performance, etc.). Therefore, it should be emphasized that the actual amount of used resources to build Smaragden is larger than this estimate, given for instance the degree of waste or recycling during construction or post-construction installations and repairs. In addition, throughout the entire emergy evaluation procedure, when estimates had to be made from uncertain data ranges, the lowest numerical alternative was consistently selected, which implies that the total emergy per input category is likely to be underestimated.
Data for food consumption were sourced from an emergy study of the specific diets in Rosendal, published separately by Maassen et al. [30]. Data on resident’s everyday practices (i.e., their lifestyles, behaviors, and consumption patterns) were collected through a qualitative interview study with 15 inhabitants, enriched with a number of visual and participatory methods that included a mapping exercise of the routes and routines of the respondent’s everyday life, performed on a weekday. For more on this methodology, see [31]. Data for electricity use and district heating were modeled using IDA ICE and published separately in Hussein [32]. Raw data not gathered using the above-mentioned approaches were estimated from national averages from published statistics, as referenced in the emergy table notes in Appendix A.

2.3. Assumptions and raw Data Calculations Made for the Study

Several assumptions were made to account for inputs, and for converting them to an average, yearly per capita basis. The expected service life of the building was estimated to be 50 years; any additional material resources required to maintain the building beyond that time are not included in this study. Were the lifetime of the building increased to over 50 years, it would result in lower annual emergy flows given that initial resource investments (e.g., in the construction phase) are divided by the 50-year building life estimate. To obtain annual mean values in the emergy table, solar emergy for material inputs (e.g., concrete, steel, and glass) were therefore divided by 50 (years), whereas constant emergy flows (e.g., food, water, and electricity) were not divided but originally accounted for as yearly averages.
The building contains 115 households: 89 studios assumed to be occupied by one resident, 4 room-and-a-half flats following the same assumption, and 21 two-room apartments, each assumed to be occupied by two residents. This totals at 135 assumed residents, i.e., 1.2 residents/household.
Electronics and appliances were accounted for based on empirical accounts from the qualitative interview study in which Smaragden residents were asked to list all electronic equipment present in their homes. Following the type and quantity specified by the informants, these values were converted to kilograms by using product specifications attained from Elgiganten, one of Sweden’s most used stores for electronics and appliances. Detailed calculations for these conversions are provided in Note 13, Appendix A. Since all respondents in this study did not own the same items, the average per capita was obtained by dividing the specific appliance totals with the number of active respondents. For all appliances, a 10-year service life was assumed, accounted for by dividing the total quantity per capita by 10.
Hygiene products were accounted for using the UEV for soap to represent a generic value for said products, including cleaning supplies.
Furniture and kitchen utensils were estimated by assuming an average household’s standard setup by visiting a comparable apartment in the same urban district. When this average was established, quantities expressed in kg of furniture were estimated based on product specifications from IKEA [33]. Details for these calculations and conversions are specified in Note 14, Appendix A. For all furniture and kitchen utensils, a 10-year service life was assumed, accounted for by dividing the total quantity per capita by 10.
Clothing was based on an assumption from Svenska MiljöEmissionsData (SMED) [34] that includes imports and domestic production on a yearly basis for 2000–2009. This input is considered a yearly flow and as such has no assumed service life. Sporting goods and tools were accounted for based on empirical accounts from the qualitative interview study in which Smaragden residents were asked to list all goods present in their homes, given in SEK and divided by a 10-year assumed service life to attain yearly flows.
District heating and electricity were modeled and published separately by Hussein [32]; these values were utilized in this study without modification. Similarly, data for food consumption were used directly from the study by Maassen et al. [30]. Assumptions from that study include food imports primarily from conventional European food systems; implications from sourcing food from local or other alternative food systems are not considered in this study.
The plants and soil categories refer to the designed gardens in Smaragden and include perennial fruit bushes and green cover plants. The expected service life for soil was set to 20 years [35] and 10 years for plants. However, this excludes additional inputs for maintenance and thus these inputs were accounted for based on their assumed depreciation rate.
The long-distance travel category includes all transportation for recreational purposes. However, UEVs for the specific modes of transport used for this purpose were not found in the emergy literature. Therefore, railway electric UEV was used consistently for long distance travel, hence under the assumption that all long-distance travel took place by train. Consequently, the emergy estimated for long distance travel is likely underestimated in this study.
Walking and biking were not accounted for in the transportation sub-category in order to avoid double counting; these modes of transport are enabled through access to sporting goods (i.e., bicycles) and as such were previously accounted for under that heading. Additionally, since the human metabolic energy expended in the process of walking or biking is a system co-product that feeds back internally as labor, it was also excluded to avoid double counting (see the emergy diagram in Figure 3).
Services were estimated using the emergy to dollar ratio for Sweden (3.42 × 10¹¹), updated by Maassen et al. [30], and the 2016 average gross per capita income in Sweden (333,634 SEK), obtained from Ekonomifakta [36]. This number was then broken down and accounted for separately for each input subcategory based on the share of total expenditures: food 12.03%, consumables 24.30%, built environment 16.31%, transportation 8.00%, and taxes and social fees 39.37% [37]. Wherever UEVs were absent, estimates were made using the Swedish emergy to dollar ratio. Lastly, it should be stated that underestimation of collected and reported data is likely.

3. Results

3.1. Emergy Systems Diagram

The P-ES workshop and qualitative interview study with the residents [31] identified the energy and material flows, storages, and internal processes that support human life in this “green” district. The systems boundary and inputs are defined and depicted in the emergy systems diagram (Figure 3).
Local renewable (R) and imported (F) resources are shown on the left and top of the diagram, respectively; there are no local, nonrenewable (N) inputs. Inputs in this system defined as R include the sun and rain; however, sun is excluded from emergy calculations to avoid double counting. Inputs into the system defined as F include all other inputs to the system, from water to services. Outputs generated by the system are represented as outflows on the right side of the diagram. It is important to note that the majority of inputs into the system lie outside of the system boundary, meaning that the majority of inputs to Smaragden are imported, whereas they are stored and consumed locally.

3.2. Emergy Table

Guided by the processes mapped in the emergy diagram in Figure 3, the inputs were listed in the emergy table (Table 2), in ascending order of Unit Emergy Value (UEV), and grouped into the subcategories Food, Consumables, Built Environment, Transportation, and Services. All inputs were converted to solar emjoules (sej), and calculated as per capita flows on a yearly basis, and summed to obtain the total emergy support to the building and the residents’ lifestyles. Resource inputs shared by all residents (e.g., shared spaces in the building, surrounding gardens, and terraces) were divided by the estimated building population of 135 residents. While flows are yearly inputs, material resource inputs that have a longer lifetime are divided by their respective assumed service life in order to account for emergy on a yearly basis. This emergy synthesis is presented in Table 2 (see Appendix A for detailed calculations and notes).
As shown by the calculations in Table 2, the total emergy support to building Smaragden and its residents’ lifestyle is 1.26 × 10¹⁷ (with services), which at 17 orders of magnitude represents a high position in the global emergy hierarchy. The top 5 input sub-categories, in descending order, were: (1) Long distance travel (2.19 × 10¹⁵); (2) Hygiene products (1.67 × 10¹⁵); (3) Automobile, commute (1.30 × 10¹⁵); (4) Meat (1.24 × 10¹⁵); and (5) Sporting goods and tools (6.59 × 10¹⁴). Whereas it is important to note that the difference between these input categories is only marginal and may not be statistically significant, their overall contribution to the total is both significant and very high at 14–15 orders of magnitude. The results of this study, therefore, identify these resources as main contributors to the total environmental support to this building and its resident’s lifestyles; as such, these specific input categories merit further scrutiny when considering potential planning and policy measures to facilitate more sustainable urban life. However, since emergy support in absolute terms says little about overall system sustainability, there is a need for other ways to interpret the data, such as emergy signatures and indices.

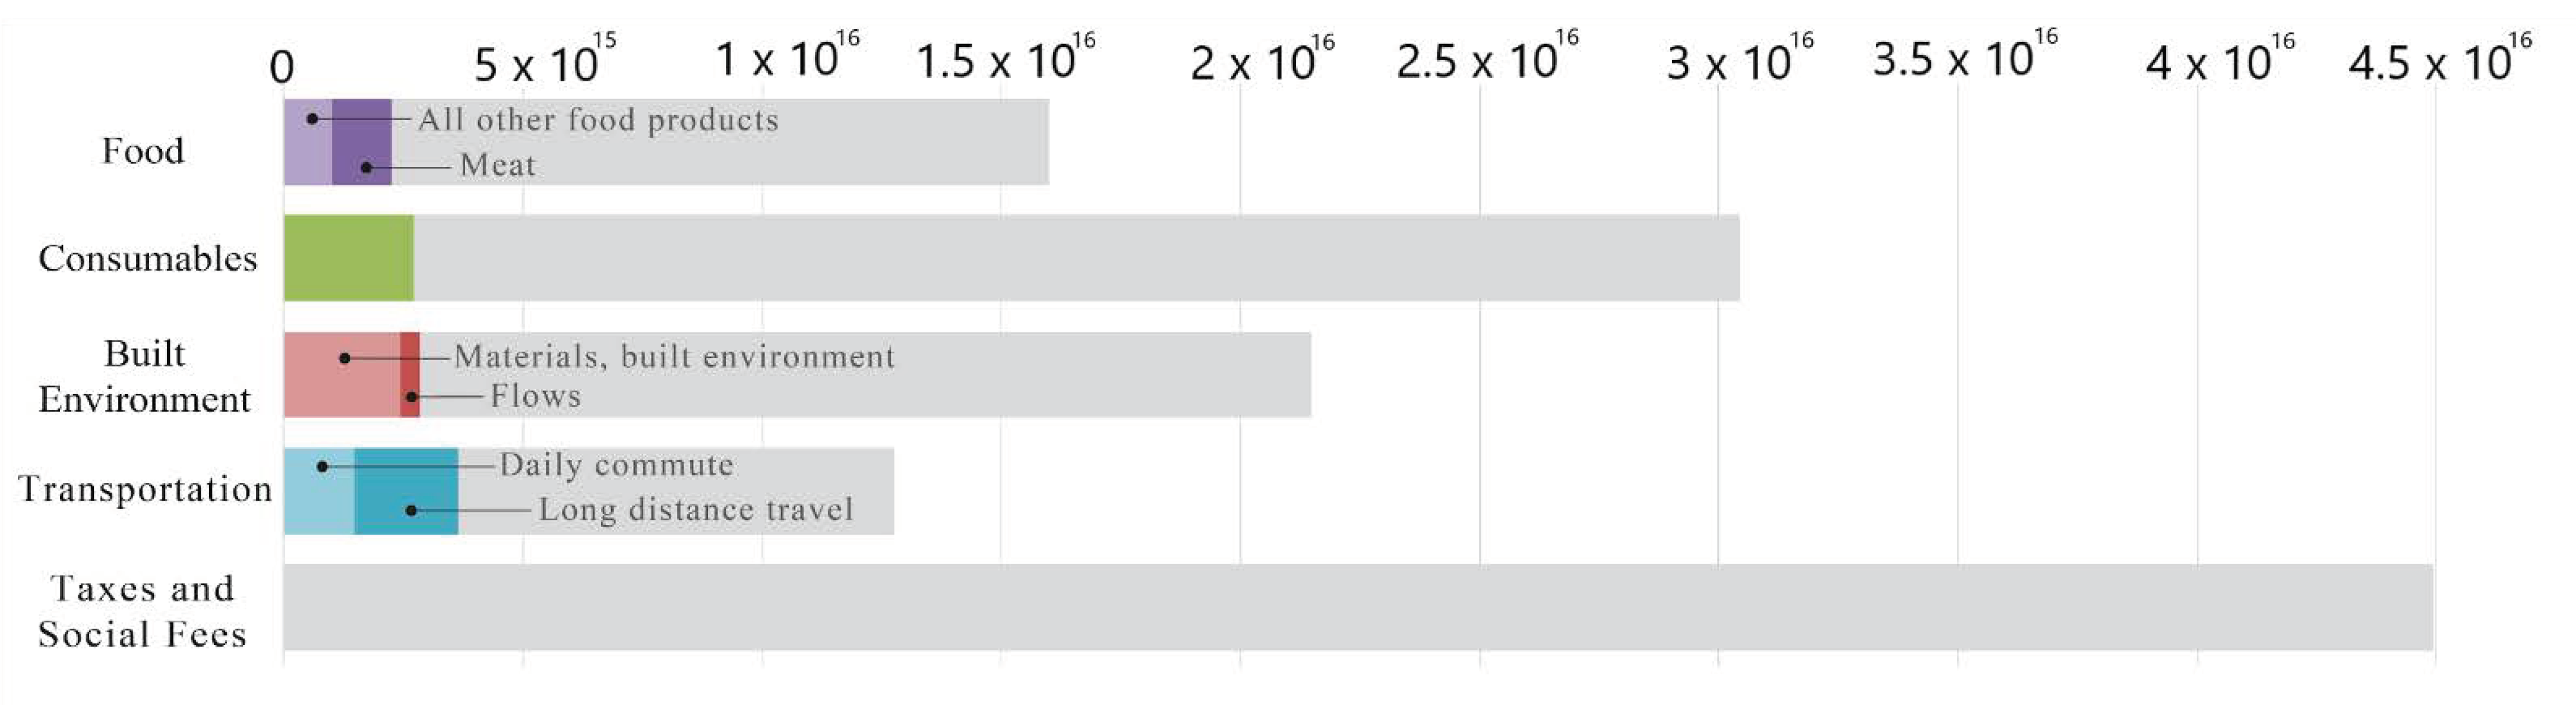
3.3. Emergy Signature

Emergy signatures illustrate the relative dependence of a system on resources of different kinds, expressed in a bar chart where inputs are organized according to their position in the emergy hierarchy. As such, emergy signatures show both the quantity and quality of resources used by a system, visualizing relative shares and environmental support behind each specific subcategory. The emergy signature of the building Smaragden and its residents’ lifestyles is presented in Figure 4.
The contribution by R is minimal, and N inputs are entirely absent in this system. Since the majority of inputs are imported (F), only these were accounted for in the emergy signature. Furthermore, due to the substantial number of individual F inputs, they were aggregated into umbrella subcategories, organized from top to bottom in ascending order, where the bars towards the bottom of the chart indicate a dependency on high quality (UEV) inputs. The grey color indicates additional contribution from services to the specific input subcategories. Taxes and Social Fees are considered additional service inputs without physical resource contributions, since they are accounted for using the Emergy to Dollar Ratio.
The Food subcategory is an aggregate of the food consumed by the residents per capita. The average UEV for food in comparison to the rest of the input categories is lower, most likely attributed to the relative proximity of food production to natural ecosystem processes. Meat is still a highly visible input within this subcategory, due to the amount residents consume and meat’s higher UEV in comparison to other food products. The Consumables subcategory is an aggregate of various physical items (e.g., clothes, hygiene products, electronics, and sporting goods) residents make use of for daily living that exclude the built environment. The Built Environment subcategory aggregates all inputs required for the physical living space, including all materials for the building and flows of electricity, district heating, and water. The Transportation subcategory aggregates the resident’s long-distance travel and daily commutes to reflect the yearly transportation of individuals residing in Smaragden. While air and other forms of long-distance travel is often the main focus in policy and public discourse, resident’s daily commutes, which include pedestrian, bicycle, and public modes of transport, also represent a significant share in terms of total emergy support to transportation.
Food, consumables, the built environment, and transportation are categories of resources with potential. Without additional transformative processes, neither food nor people would ever move from one place to another and the built environment would not be maintained. As a result, additional transformation processes provided by the encompassing societal system are required to activate the potential of those resources to enable and support urban life at local levels. Money serves as payment for this type of work, which, within the context of this case study, is embodied by the delivery of goods and services to Smaragden and its residents. In emergy evaluations, this societal function is called “service”, and is accounted for using the emergy that money purchases, or the emergy to money ratio, which differs between nations; services were therefore estimated by multiplying the Swedish emergy to money ratio (3.42 × 10¹¹, as updated by Maassen et al. [30]) with the money available to the residents for the payment of goods and services. This included the gross average income in this urban district based on national statistics from 2016 [36]. As a result, the additional service subcategory expresses emergy support to purchased goods in addition to tax funded societal functions such as healthcare, education, pensions, and other public infrastructure in Sweden.

3.4. Emergy Indices

Whereas emergy signatures convey relative shares and total emergy, assessment of the overall system performance in terms of sustainability and efficiency was evaluated by using the following indices and ratios: emergy yield ratio (EYR), %renewable (%Ren), environmental loading ratio (ELR), and emergy sustainability index (ESI). The calculations of these indices are presented in Table 3.
Similar to other developed human systems, this particular system depends almost entirely on consumption of imported inputs. As a result, other than emphasizing the system’s innate lack of sustainability, conventional emergy indices experience significant limitations is suggesting how a system can improve. For example, the higher the %Ren of a system is, the more sustainable the system is considered to be. With a %Ren at 0.0000022%, due to Smaragden making use of a minimal fraction of locally renewable inputs, the system is cannot be considered sustainable from an emergy perspective. However, other than suggesting an increasing utilization of locally renewable inputs to improve the system sustainability, this index has little else to contribute.
The rest of the indices provided similar results, indicating poor sustainability performance overall. EYR, with a value equal to 1, describes a system that is incapable of efficiently using available local resources and defines the system as a consumer process: it consumes, or transforms, more resources than it contributes back to the environment. Moreover, any system’s value for ELR above 10 is considered high and inefficient; large EYR and ELR values indicate that the system has high environmental impacts, neglecting to use its encompassing environment and local inputs efficiently [16]. To provide a global contextualization of these results, Table 4 includes a selection of more recently developed emergy indices, which are arguably more appropriate for discussing overall system performance, and improvement potential, from a global aggregate perspective.
When the Global Renewable Emergy Constant (GREC), or the basis for the productivity of environmental systems and all subsequent economic and human systems, is divided by the human population, it results in the theoretical amount of renewable emergy available per person per year, or a SolarShare [23]. Since the results of this study provided an amount of emergy consumed per person per year, comparisons can be made between the system’s urban lifestyle and the SolarShare. The SolarShare’s theoretical value (1.63 × 10¹⁵ sej/capita) for available emergy per person results two orders of magnitude smaller than the amount of emergy that residents in Smaragden use per capita per year (1.26 × 10¹⁷ sej/capita), emphasizing the drastic gap between the fair share emergy available to the residents, versus the actual emergy support. This comparison can also be seen in the Solar Cost Index (SCI), which compares the emergy of a good or service (here, urban life in Smaragden) to the SolarShare [23]. Similar to existing discussions on planetary overshoot, the SCI, or what can be termed the SolarShare “overshoot”, was framed for the consideration of sustainability implications related to particular lifestyles and their ability to operate within resource/planetary boundaries. An SCI greater than 1 indicates a lifestyle that utilizes more emergy per capita per year than is theoretically available; an SCI less than 1 indicates a lifestyle that operates within the available emergy per capita per year (i.e., within resource/planetary boundaries). At 77.29, the SCI for Smaragden’s urban life indicates that the average Smaragden resident utilizes over seventy times more emergy than is theoretically available for them to use on a yearly basis.

4. Discussion

Sustainable and space-efficient living was the key messaging in Smaragden’s marketing to the public. However, the emergy synthesis carried out in this study presents a different vision for the building’s, and its residents’, actual impact. While trends for sustainable urbanization among planners and policymakers focus on trendy, high-tech, efficiency-oriented solutions, such as Smaragden, the results from this study indicate that such approaches barely scratch the surface into improving the sustainability of urban living. Unless proposed solutions make a greater effort to facilitate contributions from local renewable sources, as the indices calculated in this study propose, the contributions to sustainable urbanization will be negligible.
While conventional emergy indices can reveal relatively little besides the drastic unsustainability exhibited by Smaragden’s urban life, the SolarShare and SCI indices enable broader discussions regarding sustainable living in Sweden. An important and noteworthy observation is that the SolarShare is only a maximum theoretical potential, a conceptual number indicating a hypothetical fair share of the GREC, and not the actual emergy available per capita per year. Because it overlooks or fails to discount the emergy that non-human systems and ecosystems require to sustain their processes, the SolarShare drastically overestimates the amount of emergy available per capita; this amount would thus be much smaller if emergy was also shared with all other processes, indicating that any person, good or service using up an entire SolarShare per year (i.e., 1.63 × 10¹⁵ sej) is considerably overshooting their yearly emergy use.
Furthermore, taking into account SolarShare’s drastic, foundational overestimation, the overshoot by urban life in Smaragden is in reality even more excessive than what this theoretical number portrays, broaching interesting population considerations. For example, Doherty et al. [39] estimated the theoretical maximum population that could be sustained exclusively on Swedish national renewable resources (R), which they defined as the Renewable Carrying Capacity at Present Living Standard index = [(R/U)*Population]. This study’s results enabled calculation of this sustainable theoretical maximum population, based on the specific standard of living in Smaragden, all else remaining unchanged (shown in Table 4). To calculate this, the global population was divided by the overshoot ratio to give a maximum global population sustained by this lifestyle, which resulted in a theoretical maximum of 96,308,650 people. This implies that, for urban life as in Smaragden to be sustainable, society can choose between two fundamentally different development trajectories: (1) reduce global population to make room for the lifestyle currently enjoyed by a minority, prioritizing Smaragden’s lifestyle; or (2) reduce the emergy support to urban life by a factor of 77.29 to enable fair share of available resources for the current population of 7.44 billion.
Outside of this study, however, this way of relating per capita emergy to the emergy available on national or global scales is scarce in emergy literature. This study hence signals to delicate yet important and underexplored ethical considerations regarding a person’s ability to consume more than their fair share of resources depending on their lifestyle or where they live, setting up an interesting direction for future research.

4.1. Methodological Implications

Conventional indices such as EYR and EIR were developed primarily to assess efficiency of systems where the distribution among R, N, and F inputs is relatively balanced. In the case of Smaragden, the low R, and non-existent N, meant that these ratios were inefficient in terms of evaluating the nuances those indices were created for. The limited contribution by the emergy indices in this study demonstrates a need for methodological development of indices better suited for evaluating systems operating at high positions in the global emergy hierarchy, and depending primarily on imported (F) inputs. This need is further justified as services become a larger part of systems of higher order. Methodologically, when services dominate a system’s total emergy, it dictates that all other input categories will be overshadowed by their contribution. In systems such as Smaragden, where the relative contribution by local, renewable resource flows is low, especially compared to the contribution by services at 91%, these inputs are hence virtually negligible when considering the system holistically. On the other hand, this distortion of data would be irrelevant if human processes depended on systems with stronger foundations in local renewable resources and processes, as opposed to imported and non-renewable inputs. As pointed out earlier by Maassen et al. [30], this calls for new emergy accounting practices and indices better suited for capturing and distinguishing also between direct and indirect renewability, i.e., the fraction renewables imported in F inputs, which represents a potentially significant contribution from renewable sources that are currently underestimated in emergy accounting.

4.2. Policy Implications

To suggest impactful action that encourages sustainable urban processes, it is necessary to focus on the processes of urban life that are supported by the largest overall share of emergy. The single largest contributor in this study, long distance travel (and automobile commuting at third place), corroborates the common argument in current sustainability discourse: that greater efforts are warranted that reduce travel on a per capita basis and, more importantly, on the aggregate level of society. This implies exploring ways to reduce the emergy per km per capita (i.e., sej/p-km), such as emphasizing more efficient (high capacity) public transit systems rather than different modes of transport, facilitating remote work, or locating workplaces closer to where people live. This would include policy focus on the creation of work opportunities in rural and peri urban areas, which could not only decrease the distances people travel but also alleviate urban densification processes.
While the importance of reducing long-distance travel is already well known, the high relative contribution by hygiene products to urban life in Smaragden is a more surprising result. This finding indicates that significant efficiency gains may in fact be found in changing the consumption pattern of products such as soap, detergents, and cosmetics. It also emphasizes the importance of reviewing and improving the industrial and transportation processes required for producing and delivering these goods to consumers; the main reason hygiene products rank so high from an emergy perspective.
Moreover, this study highlights the importance held by the construction materials such as windows, steel beams, and concrete walls that are utilized in construction of urban areas. However, the lack of standardized reporting for construction companies, which made it difficult to estimate resource use in construction, justifies interventions to incentivize more transparency and consistency in how construction projects are documented, for the purpose of tracing materials used and thus verifying progression towards more efficiency. Greater focus is also needed on design interventions for space efficient living, which minimizes the material requirements per capita. While in the case of Smaragden, space efficient living was marketed as sustainable, the small residential units translated to large per capita consumption of concrete and household appliances. Since the individual housing units were all equipped with the same base components (i.e., washing machines, dishwashers and other domestic appliances), there resulted a high per capita consumption of these inputs. As a result, the concept of lower square meter living space per capita results in greater construction material than might be considered usual, emphasizing the need to explore more appropriate layouts, floor plans, and other design solutions that simultaneously enable more resource sharing and decrease material use per capita.
Overall, the results also underscore a need for transitioning to renewable inputs in general, both in terms of how vehicles are powered, and the sourcing of energy and materials used in the construction, maintenance and decommission of transit systems and buildings alike. These results highlight the relative importance of both lifestyle and infrastructural issues, which need to be tackled simultaneously in order to achieve true resource-efficiency at local and aggregate levels of society and the environment.

5. Conclusions

This research has identified which specific inputs are relatively greatest in terms of environmental support, as well as those with marginal importance. For example, it may be concluded that among the largest individual inputs to the system were long-distance travel, hygiene products, and commuting. This conclusion is contradictory to common trends in urban policy and public discourse that target, for example, the everyday consumption of electricity, heat, and water (constant input flows) on the basis that they are of significant importance to the sustainability of urban districts. While this study demonstrates that consumption of these types of resources far exceeds what could be deemed sustainable, this conclusion is accurate only in absolute terms. In relative terms, however, this study found that the highest emergy support is associated with lifestyle issues such as consumer goods and mobility, which are the biggest contributors to the unsustainability of urban life.
The findings also corroborate that resource use or flows associated with building maintenance and everyday life of residents (e.g., water use, heating, and electricity) are in fact marginal when compared to one-time material investments, such as feedbacks from energy and material storages during the construction phase. One central conclusion, therefore, is that, while reducing resource flows over the course of the building’s lifetime is important, there is an even greater potential to improving urban sustainability by reducing the need for materials from nonrenewable storages, such as concrete, steel, and glass. This implies that significant efficiency gains can be achieved for example by exploring alternative construction materials, recycling materials to a larger extent, more efficient floor plans, new ways to share material resources and physical living space, and other design interventions that reduce total material use on a per capita basis.
Additionally, from a broader societal perspective, the results of this study indicate that current planning and urban design trends fall short on directing urban development towards improved sustainability from an emergy perspective. This study, despite being case specific, is indicative of the general tendency of urban systems to depend primarily on non-renewable and imported resources. While the emergy values alone cannot explain the sustainability of systems (i.e., high or low emergy values), the composition and relative shares of renewable versus nonrenewable inputs is more useful. Rather than decreasing total emergy in absolute terms, what is important is to increase the relative share of emergy contributed from local renewable sources.
Lastly, more studies are required to determine how this type of “green” urban development performs in comparison to conventional housing development, and other urban districts developed in the past, present, and future. However, departing from a solar share overshoot of 77.29 indicates a major challenge for urban policy and planning to achieve sustainable urban development. The fact that this particular building is one of only a few that are certified, and thus officially recognized as sustainable, further underscores the gravity of this challenge.

Author Contributions

Conceptualization, D.B., M.G., and S.J. Methodology, D.B. and D.G.-C.; software, F.P.; validation, D.B. and D.G.-C.; formal analysis, D.B., D.G.-C., and F.P.; investigation, D.B., D.G.-C., and S.J.; resources, D.B. and S.J.; data curation, D.B., D.G.-C., and F.P.; writing—original draft preparation, D.B. and D.G.-C.; writing—review and editing, D.B., D.G.-C., M.G., S.J., and F.P.; visualization, D.B., D.G.-C., and F.P.; supervision, D.B., S.J., and M.G.; project administration, D.B.; and funding acquisition, D.B., M.G., and S.J. All authors have read and agreed to the published version of the manuscript.

Funding

This research was funded by Swedish Research Council Formas, grant number 2015-1574. Additional support was provided by the Department of Urban and Rural Development, Swedish University of Agricultural Sciences (SLU).

Acknowledgments

The authors would like to acknowledge Rosendal Fastigheter and PEAB for collaborating with the research team, granting access to their internal databases, and participating in discussions throughout the research process.

Conflicts of Interest

The authors declare no conflict of interest. The funders had no role in the design of the study; in the collection, analyses, or interpretation of data; in the writing of the manuscript, or in the decision to publish the results.

Appendix A. Emergy Notes: Smaragden Emergy Evaluation

  • Sun received in Smaragden. ((Avg. total annual insolation J/year)(Area)(1-albedo))/(residents)(UEV) = ((3.63 × 10⁹ J/m2/year ([40]; data for 2016)) × ((2.31 × 10³ m2 [41]) × (1-0.7 [42])/(135) × (1 sej/J [22]) = 1.87 × 10¹⁰ sej.
  • Rain received directly on the Smaragden area, runoff omitted. (((area m2)((yearly precipitation mm/year)/1000 m/year)(1E6 g/m3)(4.94 J/g))/residents)(UEV) = (((2312 m2 [41]) × (470 mm/year /(2.1240 ([40];data for 2016))/1000 m/year) × (1E6 g/m3) × (4.94 J/g))/135) × (7 × 103 sej/J [22]) = 2.78 × 10¹¹ sej.
  • Cereals and derivatives. (Annual energy per capita (J/capita))(UEV) = (1.48 × 10⁹ J/capita/year [30]) × (3.88 × 10⁴ sej/J [30])= 5.75 × 10¹³ sej.
  • Non-alcoholic beverages. (Annual energy per capita (J/capita))(UEV) = (1.49 × 10⁸ J/capita/year [30]) × (1.26 × 10⁵ sej/J [30]) = 1.87 × 10¹³.
  • Beverages, stimulants. (Annual energy per capita (g/capita))(UEV) = (4.89 × 10³ g/capita/year [30]) × (7.19 × 10⁵ sej/g [30]) = 3.52 × 10⁹ sej.
  • Fruits and vegetables. (Annual energy per capita (g/capita))(UEV) = (1.56 × 10⁵ g/capita/year [30]) × (4.67 × 10⁸ sej/g [30]) = 7.29 × 10¹³ sej.
  • Dairy and eggs. (Annual energy per capita (g/capita))(UEV) = (9.52 × 10⁴ g/capita/year [30]) × (1.01 × 10⁹ sej/g [30]) = 9.62 × 10¹³ sej.
  • Alcoholic beverages. (Annual energy per capita (g/capita))(UEV) = (4.73 × 10⁴ g/capita/year [30]) × (3.57 × 10⁹ sej/g [30]) = 1.69 × 10¹⁴ sej.
  • Fats. (Annual energy per capita (g/capita))(UEV) = (1.30 × 10⁴ g/capita/year [30]) × (1.85 × 10⁹ sej/g [30]) = 2.41 × 10¹⁴ sej.
  • Fish from assumed sustainable coastal fisheries. (Annual energy per capita (g/capita))(UEV) = (1.52 × 10⁴ g/capita/year [30]) × (2.37 × 10¹⁰ sej/g [30]) = 3.62 × 10¹⁴ sej.
  • Meat. (Annual energy per capita (g/capita))(UEV) = (4.12 × 10⁴ g/capita/year [30]) × (3.02 × 10¹⁰ sej/g [30])= 1.624 × 10¹⁵ sej.
  • Hygiene products. (quantity(g))(8816 kcal/g)(4186 J/kcal)(UEV) = (((620 kr/month/capita [43]; estimated expenditure on personal hygiene products and cleaning supplies) × 12 (months/year))/(150 kr/kg ([44]; generic soap weight:kr ratio)) × 1000g/kg) × (8.816kcal/g) × (4186J/kcal) × (9.14 × 10⁵ sej/J ([45]; corrected by a factor of 1.27 to update to the emergy baseline for 2016 [24]) = 3.59 × 10¹⁵ sej.
  • Electronics and appliances. (quantity(kg)/capita)(1000g/kg))/lifetime)(UEV) = (((27 TVs (this study) × 11.4 kg (Assuming 43 inches [46])/31 respondents) + (4 digital tv boxes (this study) × 0.24 kg [46] /31 respondents) + (22 laptops (this study) × 1.5 kg [46] /31 respondents) + (24 PCs (this study) × 8.0 kg [46] /31 respondents) + (20 tablets (this study) × 0.57 kg [46] /31 respondents) + (31 combo washer dryer (this study) × 70 kg [46] /31 respondents) + (31 cellphone (this study) × 0.172 kg [46] /31 respondents) + (2 Playstation (this study) × 2.1 kg [46] /31 respondents) + (2 xbox (this study) × 3.8 kg [46] /31 respondents) + (3 wii (this study) × 1.3 kg [47] /31 respondents) + (2 cordless keyboards (this study) × 0.55 kg [46] /31 respondents) + (hair straightener (this study) × 0.433 kg [46] /31 respondents) + (2 vacuum (this study) × 0.447 kg [46] /31 respondents) + (1 electric massage pillow (this study) × 1.6 kg [46] /31 respondents) + (2 electric screwdrivers (this study) × 1.5 kg [48] /31 respondents) + (11 lamps (this study) × 1.63 kg [33] /31 respondents) + (1 tall lamp (this study) × 6.65 kg [33] /31 respondents) + (2 irons (this study) × 1.2 kg [48] /31 respondents) + (1 amplifier (this study) × 2.1 kg [46] /31 respondents) + (2 DVD player (this study) × 0.8 kg [46] /31 respondents) + (1 sewing machine (this study) × 5.1 kg [46] /31 respondents) + (4 modem (this study) × 0.3 kg [46] /31 respondents) + (1 vertical fan (this study) × 5.6 kg [46] /31 respondents) + (2 round fans (this study) × 2.2 kg [46] /31 respondents) + (2 entertainment system (this study) × 6.3 kg [46] /31 respondents) + (1 radio (this study) × 0.43 kg [46] /31 respondents) + (6 speakers (this study) × 3.5 kg [46] /31 respondents) + (1 stereo (this study) × 3.0 kg [46] /31 respondents) + (3 monitor (this study) × 3.0 kg [46] /31 respondents) + (1 record player (this study) × 5.7 kg [46] /31 respondents) + (1 guitar (this study) × 2.0 kg [46] /31 respondents) + (2 microphones (this study) × 1.0 kg [46] /31 respondents) + (1 electric toothbrush (this study) × 0.316 kg [46] /31 respondents) + (1 beard trimmer (this study) × 0.172 kg [46] /31 respondents) + (1 music audio adjuster/recorder (this study) × 1.8 kg [46] /31 respondents) + (3 hard drive (this study) × 0.37 kg [46] /31 respondents) + (1 camera (this study) × 1.1 kg [46] /31 respondents) + (1 video camera (this study) × 0.305 kg [46] /31 respondents) + (1 CD player (this study) × 0.34 kg [46] /31 respondents) + (1 giant roof flat screen 174 kg [49] /135 residents)) × (1000 g/kg))/10 years × (5.09 × 10⁹ sej/g [30] = 4.76 × 10¹³ sej.
  • Furniture and kitchen utensils, assumed quantities converted to kilograms based on Ikea [33]. ((quantity(kg))(1000 g/kg)/(avg.residents/household))/assumed lifetime)(UEV) = ((1 Malm series bed, including mattress × 73.5 kg) + (1 table, 120 cm × 15.7 kg +2 chairs × 8.9 kg) + (1 sofa × 60.58 kg) + (1 coffee table × 18.05) + (1 set of drawers × 35.2 kg) + (1 armchair × 13.98 kg) + (2 side table × 9.58 kg) + (1 set, utensils × 1.44 kg) + (1 set, plates × 10.01 kg ) + (1 set, pots and pans × 4.98 kg) + (1 set (6), glasses × 2.17 kg) + (1 set (6), cups × 1.92 kg ) + (1 set, knives × 0.61 kg) + (1 cutting board × 1.55 kg) × (1000 g/kg))/1.2)/10 yrs) × (8.51 × 10⁹ sej/g ([50]; corrected by a factor of 1.27 to update to the emergy baseline for 2016 [24]) = 1.96 × 10¹⁴ sej.
  • Clothing and other textiles. (Quantity(kg))(1000 g/kg)(UEV) = 15 kg/capita/year [34] × (1000 g/kg) × (8.51 × 10⁹ sej/g ([50]; corrected by a factor of 1.27 to update to the emergy baseline for 2016 [24]) = 1.28 × 10¹⁴ sej.
  • Sporting goods and tools. ((Value (SEK) sporting goods (this study) + value (SEK) tools (this study))/assumed lifetime)/capita)(UEV) = ((16,100 sek in tools (this study)) + (126,900 sek in sports equipment (this study))/10 yrs) + 30,000 sek/year; stable rent)/23 respondents (this study)) × (3.42 × 10¹¹ sej/sek [30] (Maassen et al., 2020) = 6.59 × 10¹⁴ sej.
  • District heating, yearly flow. ((KWh)(energy content)(J/KWh))/capita)(UEV) = ((3.14 × 10⁵ KWh [32] × (3.60 × 106 J/KWh))/135 residents)) × (2.95 × 10⁴ sej/J ([51]; corrected by a factor of 0.76 to update to the emergy baseline for 2016 [24]) = 2.47 × 10¹⁴ sej.
  • Electricity, yearly flow. (Area)(KWH/m2)(J/KWh)(UEV) = (6588 m2 [32] × (13.1 KWh/m2 [32]) × (3.60 × 10⁶ J/KWh))/135 residents) × (5.90 × 10⁴ sej/J ([51]; corrected by a factor of 0.76 to update to the emergy baseline for 2016 [24]) = 1.36 × 10¹⁴ sej.
  • Water consumption, yearly flow. (Volume/capita)(4990 J/kg)(UEV) = ((160 L/capita/year [52]) × (1 kg H20/1 L H20) × (4990 J/kg))/135 residents) × (5.98 × 10⁴ sej/J ([53]; corrected by a factor of 1.27 to update to the emergy baseline for 2016 [24]) = 1.74 × 10¹³ sej.
  • Soil. ((quantity (kg))(1000 g/kg)(5.4 kcal/g)(4186 J/kcal))per capita)/assumed lifetime)(UEV) = ((2.88 × 10⁴ kg (this study)) × (1000 g/kg) × (5.4 kcal/g) × (4186 J/kcal))/135 residents)/20 yrs [35] × (9.40 × 105 sej/J ([21]; corrected by a factor of 1.27 to update to the emergy baseline for 2016 [24]) = 1.81 × 10¹² sej.
  • Wood. ((quantity (kg))(1000 g/kg)/capita)/lifetime)(UEV) = ((4.93 × 10⁴ kg (this study)) × (1000 g/kg)/135 residents)/50 yrs) × (1.06 × 10⁹ sej/g ([54]; corrected by a factor of 1.27 to update to the emergy baseline for 2016 [24]) = 7.73 × 10¹² sej.
  • Concrete and mortar. ((quantity(kg))(1000 g/kg)/capita)/lifetime)(UEV) = ((7.61 × 10⁶ kg (this study)) × (1000 g/kg)/135 residents)/50 yrs) × (1.83 × 10⁹ sej/g ([54]; corrected by a factor of 1.27 to update to the emergy baseline for 2016 [24]) = 2.06 × 10¹⁵ sej.
  • Steel. ((quantity (kg))(1000 g/kg)/capita)/lifetime)(UEV) = (((1.43 × 10⁴ kg (this study)) × (1000 g/kg)/135 residents)/50 yrs) × (6.74 × 10⁹ sej/g ([54]; corrected by a factor of 1.27 to update to the emergy baseline for 2016 [24]) = 1.43 × 10¹³ sej.
  • Plastics. ((quantity (kg))(1000 g/kg)/capita)/lifetime)(UEV) = ((3.62 × 10⁴ kg (this study)) × (1000 g/kg)/135 residents)/50 yrs) × (7.45 × 10⁹ sej/g ([54]; corrected by a factor of 1.27 to update to the emergy baseline for 2016 [24]) = 4.00 × 10¹³ sej.
  • Glass. ((quantity (kg))(1000 g/kg)/capita)/lifetime)(UEV) = ((1.68 × 10⁴ kg (this study)) × (1000 g/kg)/135 residents)/50 yrs) × (9.75 × 10⁹ sej/g ([54]; corrected by a factor of 1.27 to update to the emergy baseline for 2016 [24]) = 2.42 × 10¹³ sej.
  • Aluminum. ((quantity (kg))(1000 g/kg)/capita)/lifetime)(UEV) = ((2.46 × 10³ kg (this study)) × (1000 g/kg)/135 residents)/50yrs) × (1.61 × 10¹⁰ sej/g ([54]; corrected by a factor of 1.27 to update to the emergy baseline for 2016 [24]) = 5.89 × 10¹² sej.
  • Paint. ((quantity (kg))(1000 g/kg)/capita)/lifetime)(UEV) = ((6.60 × 10³ kg (this study)) × (1000 g/kg)/135 residents)/50 yrs) × (1.92 × 10¹⁰ sej/g ([54]; corrected by a factor of 1.27 to update to the emergy baseline for 2016 [24]) = 1.88 × 10¹³ sej.
  • Copper. ((quantity (kg))(1000 g/kg)/capita)/lifetime)(UEV) = ((2.44 × 10¹³ kg (this study)) × (1000 g/kg)/135 residents)/50 yrs) × (1.02 × 10¹¹ sej/g ([55]; corrected by a factor of 1.5 to update to the emergy baseline for 2016 [24]) = 3.69 × 10¹³ sej.
  • Plants, excluding the green roof. ((quantity (kg))(1000 g/kg)/capita)/lifetime)(UEV) = ((1.24 × 10³ kg (this study))/135 residents)/10 yrs) × (1.72 × 10¹² sej/kg ([56]; corrected by a factor of 1.3 to update to the emergy baseline for 2016 [24] /(1000 g/kg)) = 1.58 × 10¹² sej.
  • Paper. ((quantity (kg))(1000 g/kg)/capita)/lifetime)(UEV) = ((4.21 × 10³
  • kg (this study)) × (1000 g/kg)/135 residents)/50 yrs) × (1.81 × 10¹² sej/g ([57]; corrected by a factor of 0.76 to update to the emergy baseline for 2016 [24]) = 1.13 × 10¹⁵ sej.
  • Iron, electrical. ((quantity (kg))(1000 g/kg)/capita)/lifetime)(UEV) = ((9232.57 km/capita/year (this study))/135 residents)/50 yrs) × (9.10 × 10¹¹ sej/g ([57]; corrected by a factor of 0.76 to update to the emergy baseline for 2016 [24] /(1000g/kg)) = 1.00 × 10¹⁶ sej.
  • Glass wool, for insulation. ((quantity (kg))(1000 g/kg)/capita)/lifetime)(UEV/1000g/kg) = ((2.34 × 10³ kg (this study)) × (1000 g/kg)/135 residents)/50 yrs) × (1.22 × 10¹³ sej/g [57]; corrected by a factor of 0.76 to update to the emergy baseline for 2016 [24]) = 4.22 × 10¹² sej.
  • Green roof. ((1/3 area of roof(m2))/(capita))/lifetime)(UEV) = ((824 m 2/3 (this study))/(135 residents)/50 yrs) × (2.12 × 10¹³ sej/g ([35]; corrected by a factor of 0.76 to update to the emergy baseline for 2016 [24]) = 8.64 × 10¹¹ sej.
  • Long distance travel. (Distance/capita/year)(UEV) = (9232.57km/capita/year)(this study) × (2.37 × 10¹¹ sej/p-km ([58]; Electric Railway UEV used and corrected by a factor of 1.27 to update to the emergy baseline for 2016 [24]) = 2.19 × 10¹⁵ sej.
  • Public transportation, as part of daily commute. (Distance/capita/year)(UEV) = (3388.67 km/capita/year)(this study) × (4.70 × 10¹⁰ sej/p-km ([58]; Bus UEV used and corrected by a factor of 1.27 to update to the emergy baseline for 2016 [24]) = 1.59 × 10¹⁴ sej.
  • Automobile use, as part of daily commute. (Distance/capita/year)(UEV) = (4143.83 km/capita/year)(this study) × (3.15 × 10¹¹ sej/g [58]; Bus UEV used and corrected by a factor of 1.27 to update to the emergy baseline for 2016 [24]) = 1.30 × 10¹⁵ sej.
  • Services, food. (% Gross income/capita/year)(UEV) = (12.03% × 333.634 sek) [36] × (3.42 × 1011 sej/g [30]) = 1.37 × 10¹⁶ sej.
  • Services, consumables. (% Gross income/capita/year)(UEV) = (24.30% × 333.634 sek) [36] × (3.42 × 1011 sej/g [30]) = 2.77 × 10¹⁶ sej.
  • Services, built environment. (% Gross income/capita/year)(UEV) = (16.31% × 333.634 sek) [36] × (3.42 × 1011 sej/g [30]) = 1.86 × 10¹⁶ sej.
  • Services, transportation. (% Gross income/capita/year)(UEV) = (8.00% × 333.634 sek/year/capita) [36] × (3.42 × 1011 sej/g [30]) = 9.13 × 10¹⁵ sej.
  • Services, taxes and Social fees. (% Gross income/capita/year)(UEV) = (39.37% × 333.634 sek/year/capita) [36] × (3.42 × 1011 sej/g [30]) = 4.49 × 10¹⁶ sej.
  • Output, Urban Life; excluding services. (h/year) (Total emergy (Sej/h), excluding services) = (8765 h/year)(1.15 × 1016 Sej) = 1.31 × 10¹² (Sej/h), calculated UEV 1.
  • Output, Urban Life; including services. (h/year) (Total emergy (Sej/h), including services) = (8765 h/year)(1.26 × 1017 Sej)= 1.43 × 10¹³ (Sej/h), calculated UEV 2.

References

  1. Zucaro, A.; Ripa, M.; Mellino, S.; Ascione, M.; Ulgiati, S. Urban resource use and environmental performance indicators. An application of decomposition analysis. Ecol. Indic. 2014, 47, 16–25. [Google Scholar] [CrossRef]
  2. Liu, J.; Hull, V.; Batistella, M.; Defries, R.; Dietz, T.; Fu, F.; Hertel, T.; Izaurralde, R.; Lambin, E.; Li, S.; et al. Framing Sustainability in a Telecoupled World. Ecol. Soc. 2013, 18, 26. [Google Scholar] [CrossRef]
  3. Ascione, M.; Campanella, L.; Cherubini, F.; Ulgiati, S. Environmental driving forces of urban growth and development. An emergy-based assessment of the city of Rome, Italy. Landsc. Urban Plan. 2009, 93, 238–249. [Google Scholar] [CrossRef]
  4. Ascione, M.; Bargigli, S.; Campanella, L.; Ulgiati, S. Exploring an urban system’s dependence on the environment as a source and a sink: The city of Rome (Italy) across space and time scales. ChemSusChem 2011, 4, 613–627. [Google Scholar] [CrossRef]
  5. Lee, J.M.; Braham, W. Right-sizing cities for maximum power: Urban form parameters for New York City and the Greater Philadelphia Region. Sustainability 2019, 11, 2352. [Google Scholar] [CrossRef] [Green Version]
  6. Liu, G.; Yang, Z.; Chen, B.; Ulgiati, S. Emergy-based dynamic mechanisms of urban development, resource consumption and environmental impacts. Ecol. Model. 2014, 271, 90–102. [Google Scholar] [CrossRef]
  7. Rees, W.; Wackernagel, M. Urban ecological footprints: Why cities cannot be sustainable and why they are a key to sustainability. Environ. Impact Assess. Rev. 1996, 16, 223–248. [Google Scholar] [CrossRef]
  8. Vega-Azamar, R.E.; Glaus, M.; Hausler, R.; Oropeza-García, N.A.; Romero-López, R. An emergy analysis for urban environmental sustainability assessment, the Island of Montreal, Canada. Landsc. Urban Plan. 2013, 118, 18–28. [Google Scholar] [CrossRef]
  9. United Nations Department of Economic and Social Affairs, Population Division. World Urbanization Prospects: The 2018 Revision (ST/ESA/SER.A/420); United Nations: New York, NY, USA, 2019. [Google Scholar]
  10. Wu, J. Urban ecology and sustainability: The state-of-the-science and future directions. Landsc. Urban Plan. 2014, 125, 209–221. [Google Scholar] [CrossRef]
  11. Hagbert, P. A Sustainable Home? Reconceptualizing home in a low-impact society. Ph.D. Thesis, Chalmers University of Technology, Gothenburg, Sweden, 26 August 2016. [Google Scholar]
  12. Granvik, M.; Hedfors, P. Evergreen issues of planning? Learning from history for sustainable urban-rural systems landscapes. Eur. J. Spat. Dev. 2015, 5, 1–21. [Google Scholar]
  13. De Jong, M.; Joss, S.; Schraven, D.; Zhan, C.; Weijnen, M. Sustainable-smart-resilient-low carbon-eco-knowledge cities; Making sense of a multitude of concepts promoting sustainable urbanization. J. Clean. Prod. 2015, 109, 25–38. [Google Scholar] [CrossRef] [Green Version]
  14. Gram-Hanssen, K. Efficient technologies or user behaviour, which is the more important when reducing households’ energy consumption? Energy Effic. 2013, 6, 447–457. [Google Scholar] [CrossRef]
  15. Tukker, A.; Emmert, S.; Charter, M.; Vezzoli, C.; Sto, E.; Munch Andersen, M.; Geerken, T.; Tischner, U.; Lahlou, S. Fostering change to sustainable consumption and production: An evidence-based view. J. Clean. Prod. 2008, 16, 1218–1225. [Google Scholar] [CrossRef]
  16. Brown, M.T.; Ulgiati, S. Energy quality, emergy, and transformity: H.T. Odum’s contributions to quantifying and understanding systems. Ecol. Model. 2004, 178, 201–213. [Google Scholar] [CrossRef]
  17. Swedish Green Building Council Tio Projekt Utvecklar Hållbara Stadsdelar Enligt Svensk Guide. Available online: https://www.sgbc.se/nyheter/1008-tio-projekt-utvecklar-hallbara-stadsdelar-enligt-svensk-guide (accessed on 13 April 2019).
  18. Swedish Green Building Council Statistik. Available online: https://www.sgbc.se/statistik/ (accessed on 7 July 2020).
  19. Swedish Green Building Council Miljöbyggnad—Svensk Miljöcertifiering för Svenska Förhållanden. Available online: https://www.sgbc.se/certifiering/miljobyggnad/ (accessed on 7 July 2020).
  20. Rosendal Fastigheter Smaragden. Available online: https://rosendalfastigheter.se/en/smaragden/ (accessed on 13 April 2019).
  21. Odum, H.T. Environmental Accounting. Emergy and Environmental Decision Making; Wiley: New York, NY, USA, 1996; pp. 1–370. [Google Scholar]
  22. Brown, M.T.; Ulgiati, S. Emergy assessment of global renewable sources. Ecol. Model. 2016, 339, 148–156. [Google Scholar] [CrossRef] [Green Version]
  23. Brown, M.T. SolarShare: An Emergy Derived Index of Human Demand on Environment. Proc. from Bienn. Emergy Conf. 2011, 6, 87–92. [Google Scholar]
  24. Brown, M.T.; Campbell, D.E.; De Vilbiss, C.; Ulgiati, S. The geobiosphere emergy baseline: A synthesis. Ecol. Model. 2016, 339, 92–95. [Google Scholar] [CrossRef]
  25. Ulgiati, S.; Brown, M.T.; Bastianoni, S.; Marchettini, N. Emergy-based indices and ratios to evaluate the sustainable use of resources. Ecol. Eng. 1995, 5, 519–531. [Google Scholar] [CrossRef]
  26. Bergquist, D.A.; Cavalett, O.; Rydberg, T. Participatory emergy synthesis of integrated food and biofuel production: A case study from Brazil. Environ. Dev. Sustain. 2012, 14, 167–182. [Google Scholar] [CrossRef]
  27. Connor, L. Scheduling Weights via Volumes in Revit. Calculating the Weight of any Material by a Volume parameter Autodesk; White Paper Cadline: Middlesex, UK, 2014; pp. 1–9. [Google Scholar]
  28. Hardin, B.; McCool, D. BIM and Construction Management: Proven Tools, Methods, and Workflows, 2nd ed.; Wiley: Indianapolis, IN, USA, 2015. [Google Scholar]
  29. MT Højgaard. CAD-BIM Manual—General Part; MT Højgaard: Søborg, Denmark, 2016; pp. 1–58. [Google Scholar]
  30. Maassen, J.J.; Rydberg, T.; Bergquist, D. Emergy synthesis of food preparation and diets in the “Green” Urban District Rosendal, in Uppsala, Sweden. J. Environ. Account. Manag. 2020, 8, 55–71. [Google Scholar] [CrossRef]
  31. Joosse, S.; Marshall, M. Fridge stories and other tales from the kitchen—A methodological toolbox for getting closer to everyday food practices. Food Cult. Soc. 2020. [Google Scholar] [CrossRef]
  32. Hussein, W. Assessment and Analytical Framework for Sustainable Urban Planning and Development: A Comparative Study of the City Development Projects in Knivsta, Norrtälje and Uppsala. Master’s Thesis, Uppsala University, Uppsala, Sweden, 25 February 2016. [Google Scholar]
  33. IKEA Website. Available online: https://www.ikea.com/se/sv/ (accessed on 13 April 2019).
  34. Carlsson, A.; Hemström, K.; Edborg, P.; Stenmarck, Å.; Sörme, L. Kartläggning av Mängder Och Flöden av Textilavfall; SMED Rapport Nr. 46: Norrkping, Sweden, 2011; pp. 1–75. [Google Scholar]
  35. Rustagi, N.; Tilley, D.; Schramski, J. Total Energy Requirements of a Living Extensive Green Roof. In Proceedings of the Energy Synthesis 5, Gainesville, FL, USA, December 2009; Brown, M., Sweeney, S., Eds.; pp. 223–234. [Google Scholar]
  36. Ekonomifakta Disponibel Inkomst Per Capita. Available online: https://www.ekonomifakta.se/Fakta/Ekonomi/Hushallens-ekonomi/Hushallens-inkomster/?graph=/15979/1,2/-2016/ (accessed on 13 April 2018).
  37. Carlgren, F. Hushållens Konsumtionsutgifter Efter Ändamål. Available online: https://www.ekonomifakta.se/Fakta/Ekonomi/Hushallens-ekonomi/Hushallens-konsumtionsutgifter-efter-andamal/ (accessed on 13 April 2019).
  38. The World Bank Group Population, Total. Available online: https://data.worldbank.org/indicator/SP.POP.TOTL?end=2016&start=1960 (accessed on 13 April 2019).
  39. Doherty, S.J.; Nilsson, P.O.; Odum, H.T. Emergy Evaluation of Forest Production and Industries in Sweden; Department of Bioenergy, Swedish University of Agricultural Sciences: Uppsala, Sweden, 2002. [Google Scholar]
  40. SMHI Års-Och Månadsstatistik. Available online: https://www.smhi.se/klimat/klimatet-da-och-nu/manadens-vader-och-vatten-sverige/manadens-vader-i-sverige/ars-och-manadsstatistik (accessed on 13 April 2019).
  41. Karavan Smaragden. Available online: http://karavanlandskap.se/kvarteret-smaragden (accessed on 13 April 2019).
  42. Li, H.; Harvey, J.; Kendall, A. Field measurement of albedo for different land cover materials and effects on thermal performance. Build. Environ. 2013, 59, 536–546. [Google Scholar] [CrossRef]
  43. Hallå Konsument Kostnader för Eget Boende. Available online: https://www.hallakonsument.se/pengar-och-ekonomi/livssituationer/flytta-hemifran/kostnader-for-eget-boende/ (accessed on 13 April 2019).
  44. ICA Website. Available online: https://www.ica.se/ (accessed on 13 April 2019).
  45. Lagerberg, C.; Brown, M.T. Improving agricultural sustainability: The case of Swedish greenhouse tomatoes. J. Clean. Prod. 1999, 7, 421–434. [Google Scholar] [CrossRef]
  46. Elgigangten Elgiganten. Available online: https://www.elgiganten.se/ (accessed on 13 April 2019).
  47. Tech-FAQ Nintendo Wii Specifications. Available online: https://www.tech-faq.com/nintendo-wii-specifications.html (accessed on 13 April 2018).
  48. Biltema Website. Available online: https://www.biltema.se/ (accessed on 13 April 2019).
  49. Storbildsskärm P6e. Available online: https://www.adapt.se/produkt/led-skarm-storbildsskarm-p6/ (accessed on 13 April 2019).
  50. Hagtröm, P.; Nilsson, P.O. Emergy Evaluation of the Swedish Economy Since the 1950’s. In Proceedings of the Emergy Synthesis 3, Gainesville, FL, USA, 29–31 January 2004; Brown, M., Bardi, E., Eds.; pp. 417–434. [Google Scholar]
  51. Buonocore, E.; Ulgiati, S. Assessing the environmental performance and sustainability of bioenergy production in Sweden: A life cycle assessment perspective. Fuel Energy Abstr. 2012, 37, 69–78. [Google Scholar] [CrossRef]
  52. Svenskt Vatten Utbildning & Information. Available online: https://www.svensktvatten.se/rapporter/svu-rapporter/utbildning-och-information/ (accessed on 13 April 2016).
  53. Buenfil, A.A. Emergy Evaluation of Water. Ph.D. Thesis, University of Florida, Gainesville, FL, USA, 2001. [Google Scholar]
  54. Buranakarn, V. Evaluation of Recycling and Reuse of Building Materials Using the Emergy Analysis Method. Ph.D. Thesis, University of Florida, Gainesville, FL, USA, 1998. [Google Scholar]
  55. Brown, M.T.; Green, P.; Gonzalez, A.; Venegas, J. Emergy Analysis Perspectives, Public Policy Options, and Development Guidelines for the Coastal Zone of Nayarit, Mexico; Report to the Cousteau Society: Gainesville, FL, USA, 1992; pp. 1–220. [Google Scholar]
  56. Pulselli, R.M.; Pulselli, F.M.; Mazzali, U.; Peron, F.; Bastianoni, S. Emergy based evaluation of environmental performances of Living Wall and Grass Wall systems. Energy Build. 2014, 73, 200–211. [Google Scholar] [CrossRef]
  57. Meillaud, F.; Gay, J.B.; Brown, M.T. Evaluation of a building using the emergy method. Sol. Energy 2005, 79, 204–212. [Google Scholar] [CrossRef]
  58. Federici, M.; Ruzzenenti, F.; Ulgiati, S.; Basosi, R. Emergy Analysis of Selected Local and National Transport Systems in Italy. In Proceedings of the Emergy Synthesis 3, Gainesville, FL, USA, November 2005; Brown, M., Bardi, E., Eds.; pp. 449–464. [Google Scholar]
Figure 1. The building Smaragden’s architectural, electrical, mechanical, and structural models (perspective, wireframe view, SE to NW). Produced with Autodesk NAVISWORKS 2019. © Felix Peniche.
Sustainability 12 05661 g001
Figure 2. Visual explanation of the equation and data modelling process used in this study.
Sustainability 12 05661 g002
Figure 3. Emergy systems diagram of human life in the urban district Rosendal in Smaragden.
Sustainability 12 05661 g003
Figure 4. Emergy signature of the building and residents’ life in Smaragden.
Sustainability 12 05661 g004
Table 1. Emergy indices and ratios calculated in this study.
IndicesExpressionUse
Emergy yield ratio (EYR)Y/FThe ratio of the total emergy driving a process or system to all imported emergy; measures the potential of the system to contribute to the encompassing system.
Percent Renewable (%Ren)R/(R+N+F)The ratio of renewable emergy to total emergy use. In the long run, only processes with high %Ren are sustainable.
Environmental Loading Ratio (ELR)(F+N)/RThe ratio of nonrenewable and imported emergy use to renewable emergy use; is considered a measure of ecosystem stress due to a system’s activities.
Emergy Sustainability Index (ESI)EYR/ELRCalculates the emergy yield ratio to the environmental loading ratio and measures the potential contribution of a resource or process to the economy per unit of environmental loading.
Solar Cost Index (SCI)Y/SolarShareCalculates the emergy of a good or service to the average share of renewable global emergy.
Table 2. Emergy flows per year Smaragden, Rosendal, Uppsala.
Unit Emergy
DataValueSolar
NoteItemUnit(units/y)(sej/unit)Emergy
Local renewable inputs (R)
1SunJ1.87 × 101011.87 × 1010
2RainJ3.98 × 1077.00 × 1032.78 × 1011
Imported inputs (F)
Food
3Cereals and derivedJ1.48 × 1093.88 × 1045.75 × 1013
4Beverages, non-alcoholicJ1.49 × 1081.26 × 1051.87 × 1013
5Beverages, stimulantsg4.89 × 1037.19 × 1053.52 × 109
6Fruits and vegetablesg1.56 × 1054.67 × 1087.29 × 1013
7Dairy and eggsg9.52 × 1041.01 × 1099.62 × 1013
8Beverages, alcoholic g4.73 × 1043.57 × 1091.69 × 1014
9Fatsg1.30 × 1041.85 × 10102.41 × 1014
10Fish, sustainable coastal fisheryg1.52 × 1042.37 × 10103.62 × 1014
11Meatg4.12 × 1043.02 × 10101.24 × 1015
Consumables
12Hygiene productsJ1.83 × 1099.14 × 1051.67 × 1015
13Electronics and appliancesg9.35 × 1035.09 × 1094.76 × 1013
14Furniture and kitchen utensilsg2.31 × 1048.51 × 1091.96 × 1014
15Clothing (and other textiles)g1.50 × 1048.51 × 1091.28 × 1014
16Sporting goods and toolssek1.93 × 1033.42 × 10116.59 × 1014
Built environment
17District heatingJ8.37 × 1092.95 × 1042.47 × 1014
18ElectricityJ2.30 × 1095.90 × 1041.36 × 1014
19WaterJ2.91 × 1085.98 × 1041.74 × 1013
20SoilJ2.41 × 1089.40 × 1052.27 × 1014
21Woodg7.30 × 1031.06 × 1097.73 × 1012
22Concrete and mortarg1.13 × 1061.83 × 1092.06 × 1015
23Steelg2.12 × 1036.74 × 1091.43 × 1013
24Plasticsg5.37 × 1037.45 × 1094.00 × 1013
25Glassg2.48 × 1039.75 × 1092.42 × 1013
26Aluminumg3.65 × 1021.61 × 10105.89 × 1012
27Paintg9.78 × 1021.92 × 10101.88 × 1013
28Copperg3.62 × 1021.02 × 10113.69 × 1013
29Plants (green roof excluded)g9.21 × 1021.72 × 1091.58 × 1012
30Paperg6.23 × 1021.81 × 1091.13 × 1012
31Iron (electrical)g2.81 × 1025.27 × 1091.48 × 1012
32Glass wool (insulation)g3.46 × 1021.22 × 10104.22 × 1012
33Green roofm24.07 × 1022.12 × 10138.64 × 1011
Transportation
34Long distance travelkm9.23 × 1032.37 × 10112.19 × 1015
35Public transportation, commutekm3.39 × 1034.70 × 10101.59 × 1014
36Automobile, commutekm4.14 × 1033.14 × 10111.30 × 1015
Services, monetary expenditures
37Foodsek4.01 × 1043.42 × 10111.37 × 1016
38Consumablessek8.11 × 1043.42 × 10112.77 × 1016
39Built environmentsek5.44 × 1043.42 × 10111.86 × 1016
40Transportationsek2.67 × 1043.42 × 10119.13 × 1015
41Taxes and social feessek1.31 × 1053.42 × 10114.49 × 1016
Total emergy, excluding servicesseJ 1.15 × 10¹⁶
Total emergy, including servicesseJ 1.26 × 10¹⁷
OutputsUnit emergy values (UEVs), calculated
42Urban life, excl. serviceshr/yr8.77 × 1031.31 × 1012seJ/hr
43Urban life, incl. serviceshr/yr8.77 × 1031.43 × 1013seJ/hr
Table 3. Emergy Indices for Smaragden, Rosendal, Uppsala.
IndexExpressionUnitsSmaragden
Total emergy, incl. servicesYsej1.26 × 1017
Local renewable inputsRsej2.78 × 1011
Local non-renewable inputsNsej0.00 × 100
Imported inputsFsej1.26 × 1017
Emergy Yield Ratio (EYR)Y/Fn/a1.0000022
%renewable (%Ren)R/Y%0.0000022
Environmental Loading Ratio (ELR)(F+N)/Rn/a451,379.89
Emergy Sustainability Index (ESI)EYR/ELRn/a0.0000022
Table 4. Emergy Indices for Smaragden, global contextualization.
IndexExpressionUnitsSmaragden
Global Renewable Emergy ConstantSej1.21 × 1025
Global Population, 2016Global Populationn/a7.44 × 109
SolarShare⍬/Global Population (1)sej1.63 × 1015
sej/capita, Smaragden Global comparisonsej/capita (Y)sej1.26 × 1017
Solar Cost Index (SCI)Y/SolarShare (2)n/a77.29
Theoretical max populationGlobal Population/SCIpeople96,308,650
(1) Global population (7.44 × 10⁹ people) in 2016 [38]; (2) Y (i.e., emergy per product or service) represents Smaragden’s human metabolic flows per capita, expressed as sej/capita-year.

