Article

Interregional Diversity of Social Capital in the Context of Sustainable Development—A Case Study of Polish Voivodeships

by
Katarzyna Pawlewicz
1 and
Adam Pawlewicz
2,*
1
Department of Socio-Economic Geography, University of Warmia and Mazury in Olsztyn, 10-720 Olsztyn, Poland
2
Department of Agrotechnology, Agricultural Production Management and Agribusiness, University of Warmia and Mazury in Olsztyn, 10-719 Olsztyn, Poland
*
Author to whom correspondence should be addressed.
Sustainability 2020, 12(14), 5583; https://doi.org/10.3390/su12145583
Submission received: 7 May 2020 / Revised: 6 July 2020 / Accepted: 8 July 2020 / Published: 10 July 2020

Abstract

:
The relationship between social capital and sustainable development challenges is of special importance. However, social capital is a complex phenomenon that is analyzed in different contexts and cannot be investigated with the use of a single variable. Social capital is difficult to define, which is why the selection of variables for measuring social capital can be problematic. The aim of this study was to analyze variations in social capital at the regional level. The study was conducted in Poland, and it covered all 16 Polish voivodeships (regions) where social capital was evaluated based on five measures: civic engagement in political and social life, degree of selfless behavior, sense of security and social confidence, formation of social structures, and the observance of social norms (external factors), and attitudes (internal factors) that foster desirable social interactions. The correlations between the above measures were also determined. Composite indicators of the analyzed measures were developed with the use of the Technique for Order Preference by Similarity to Ideal Solution (TOPSIS) method. The results were used to rank Polish voivodeships and group them into three classes based on the corresponding values of the adopted measures. Pearson’s correlation coefficient was used in the correlation analysis. The analysis involved a total of 26 indicators based on the data provided by Statistics Poland, the National Election Committee, Social Diagnosis project, and Moja Polis website. Polish voivodeships not only differ considerably in terms of the evaluated measures of social capital, but are also characterized by significant internal variation within each measure. The majority of Polish voivodeships were grouped in class II denoting average values of the evaluated measures, which could suggest that Poland is deficient in social capital. The Pomeranian voivodeship scored highest and the Łódź voivodeship scored lowest in the analyzed measures of social capital. A significant correlation was observed only between civic engagement in political and social life versus the formation of social structures and the observance of norms and attitudes that foster desirable social interactions.

1. Introduction

The social character of human nature and man’s adaptive capabilities are the key factors that shape society and economy. Humans have the need and propensity to live in groups, they are capable of social interactions and, consequently, of pursuing shared goals and solving common problems. These factors drive socioeconomic development, and sustainable development is one of the most desirable modes of development because it can lead to an improvement in the quality of life and welfare at a level that is permitted by the current level of civilization [1,2,3]. Multidimensionality is an important feature of the sustainable development concept. Multidimensionality has been investigated in the context of sustainable development in research conducted in social, natural, and economic sciences. Multidimensionality also has an integrative character, which is why its definition underscores the importance of combining social, economic, and environmental objectives in development [4,5]. Therefore, the main goal of multidimensionality is to promote a holistic approach to the future development of mankind that equally accounts for social, environmental, and economic factors and ensures that one element does not pose a threat to the others [6]. This is a necessary approach to improve and maintain a high quality of life and social welfare. Social capital is the main element of development, and the development of social capital represents the social dimension of sustainable development. Social capital denotes social relations, and it has a social dimension because social interactions take place in space. The spatial dimension of social capital has to be taken into account even in a world which relies heavily on virtual communication. This is because human beings exist in real, rather than virtual space [7,8]. However, the spatial dimension of social capital has not been researched extensively to date [7,8,9].
Sustainable development exists as a concept and a paradigm in both global and regional development, and its objective is to guarantee a high standard of living. Sustainable development requires public participation and cooperation in the process of making decisions and implementing the adopted solutions. The most widely recognized definition of sustainability was coined by the Brundtland Commission (World Commission on Environment and Development) in 1987 [3,10,11,12]. It states that sustainable development is “development that meets the needs of the present without compromising the ability of future generations to meet their own needs” [13,14]. This definition is highly generalized, which adds to its interdisciplinary character. Sustainable development is a popular concept in various areas of science. There are three pillars of sustainability: economic viability, environmental protection, and social equity. However, the main emphasis is usually placed on environmental issues [15] due to the adverse effects of human activity on the natural environment [16,17]. The third pillar, namely the social impact of sustainability, is frequently mentioned, but is least well described. Social networks are an important social aspect of sustainability [15]; they contribute to the achievement of sustainable goals and drive economic growth [18].
There is no single and universally acknowledged definition of social capital, and various interpretations of this concept have been proposed in the literature [19]. The term “social capital” has been used to explain a wide range of social phenomena. The important role of social capital in the development of human capital has been long emphasized in research studies [20,21]. Social capital has also been linked with business performance [22,23] as well as the development of geographic regions [24,25,26]. An interesting argument postulating that social capital significantly influences entire nations has been also formulated in the literature [27]. For this reason, social capital is analyzed with the use of various theoretical approaches that address both groups and individuals and explore different aspects (social relations, norms, values, and behaviors). Social capital can be analyzed in a positive (based on facts, not normative) or a normative (based on value judgments, subjective) approach. It can be defined as an individual good, a common good, or a public good [28]. Social capital, i.e., trust, social norms, and networks, is sometimes regarded as a by-product of social engagement [29]. Due to the variety of analytical approaches and theoretical frameworks, many different and even contradicting definitions of social capital can be found in the literature [30,31]. In most cases, the adopted definition of social capital is determined by the scientific discipline and the type and scope of research [32].
Two main approaches to analyzing social capital can be identified in the literature. The first approach makes a reference to Bourdieu’s theory of social justice. The second approach is integrative, and it relies on Coleman’s concept of social capital which was developed and popularized by Putnam [33,34].
According to Bourdieu [35], social capital and the conceptual tools that are required for understanding, creating, and maintaining social inequality occur together with other forms of capital. Bourdieu argued that social capital is a resource that can be deployed by members of social networks. Social capital is available to all network members, but according to Bourdieu, it is a behavioral trait which is used by individuals to maintain their social status [36]. Bourdieu also posited that the size of the network connections that can be effectively mobilized by an individual and the volume of the capital that can be utilized by that individual to raise his or her competencies influence the amount of social capital. Social capital is an exclusive resource that can generate benefits for group members, but it can also compromise the interests of individuals outside the group [35]. Bourdieu defines social capital as a set of real or potential resources which are linked to the possession of a durable network of more or less institutionalized relationships of mutual acquaintance and recognition or, in other words, to membership in a group which provides each member with support in the form of collectively owned capital, as well as credentials that entitle them to credit in various senses of the word.
Unlike Bourdieu, Coleman regarded social capital as a socially desirable phenomenon [20]. He argued that social capital exists in the relationships between entities and enables them to pursue individual and often shared goals that would not have been otherwise achieved. Social relations are useful obligations which are likely to be met by entities who trust one another. As a result, social relationships convey information, which supports the creation of social norms and eliminates undesirable behaviors. However, social norms are effective only if group members trust one another, which leads to the creation of a closed network. A closed network is better prepared for imposing collective sanctions. Therefore, social capital can generate benefits for individuals by enforcing norms and sanctions. According to Coleman, “social capital is defined by its function. It is not a single entity, but a variety of different entities having two characteristics in common. They all consist of some aspect of social structure, and they facilitate certain actions of individuals who are within the structure” [37].
The best known definition of social capital was proposed by Putnam [31], who popularized this concept. In a study exploring civic traditions in modern Italy [26], Putnam defined social capital as “features of social organization such as trust, norms and networks that can improve the efficiency of society by facilitating coordinating actions […] Like other forms of capital, social capital is productive, making possible the achievement of certain ends that would not be attainable in its absence […] Social capital fosters spontaneous, voluntary cooperation.” Putnam’s most widely cited definition states that “social capital refers to features of social organization such as networks, norms and social trust that facilitate coordination and cooperation for mutual benefit” [24]. According to Putnam, social capital is a positive force that arises from social networks and the resulting norms of reciprocity and trustworthiness [25].
Putnam [25] emphasized the positive aspects of social capital. In his judgment, a highly connected society with high levels of social capital is more effective than a society made up of isolated individuals, and he also warned that social atomization erodes social capital. This process is associated with the development of civilization—changes in the structure of employment (increase in services, decrease in production), urban growth, and the introduction of digital entertainment in the mid-20th century have led to generational changes. People spend less time with other members of the community, which leads to a decline in social capital. These problems could be resolved through volunteering, namely, informal and unpaid efforts that are consciously undertaken on behalf of other people or the entire community and extend beyond the immediate circle of family and friends [38,39].
Fukuyama extended Coleman’s definition of social capital by focusing on the correlations between social capital and economic, social, and political activity [23]. In Trust. Social Virtues and Creation of Property, Fukuyama modified the existing paradigm by arguing that cultures and traditions cannot be completely separated from economics [27]. He defined social capital as informal values and ethical norms that are shared by members of a group that enable cooperation. The effectiveness of a group increases with trust which is built gradually between group members. Fukuyama argued that the evolution of social capital begins in the family and is extended to social groups and institutions through traditions, culture, history, religion, customs, and entrepreneurship. Social capital is a multidimensional phenomenon that is manifested at numerous mutually interrelated levels [40]. For this reason, social capital has to be analyzed from a multidimensional and multifaceted perspective. Therefore, the spatial dimension of social capital can only be conceptualized in the light of these different perspectives, which necessitates an explorative approach [7].
The goal of this study was to determine variations in social capital at the regional level in Poland. An attempt was made to answer the following questions: (1) do Polish regions differ significantly in terms of the identified measures of social capital?; (2) are the identified measures of social capital characterized by significant internal variations?; and (3) are the identified measures of social capital bound by significant correlations—in other words, do any of the identified measures co-exist? The study was conducted in Poland, and it covered all 16 Polish voivodeships (regions) where social capital was evaluated based on five measures: civic engagement in political and social life, degree of selfless behavior, sense of security and social confidence, formation of social structures, and the observance of norms and attitudes that foster desirable social interactions. The correlations between the above measures were also assessed.

2. Materials and Methods

As mentioned before, social capital is a multidimensional concept [41,42,43] that cannot be measured and expressed with a single variable. However, it can be characterized with the use of composite indicators. In this study, the Technique for Order Preference by Similarity to an Ideal Solution (TOPSIS) method was applied to determine the composite indicators of different measures describing social capital. This method is widely used in analyses of complex phenomena [44,45,46]. In this approach, a composite (synthetic) variable is computed to replace a set of several variables.
The analysis relied on statistical data for 2014–2016 developed by Statistics Poland [47,48,49], the Social Diagnosis project [50], Moja Polis website [51], and the National Election Committee [52].
TOPSIS is a multidecision criteria analysis method where Euclidean distances between every evaluated object (voivodeship) and positive and negative ideal solutions are calculated. The evaluated objects are ranked based on a composite indicator. Objects with the highest level of social capital are characterized by the shortest distance from the positive ideal solution and the longest distance from the negative ideal solution [53,54,55,56].
The analysis was performed based on the following procedure:
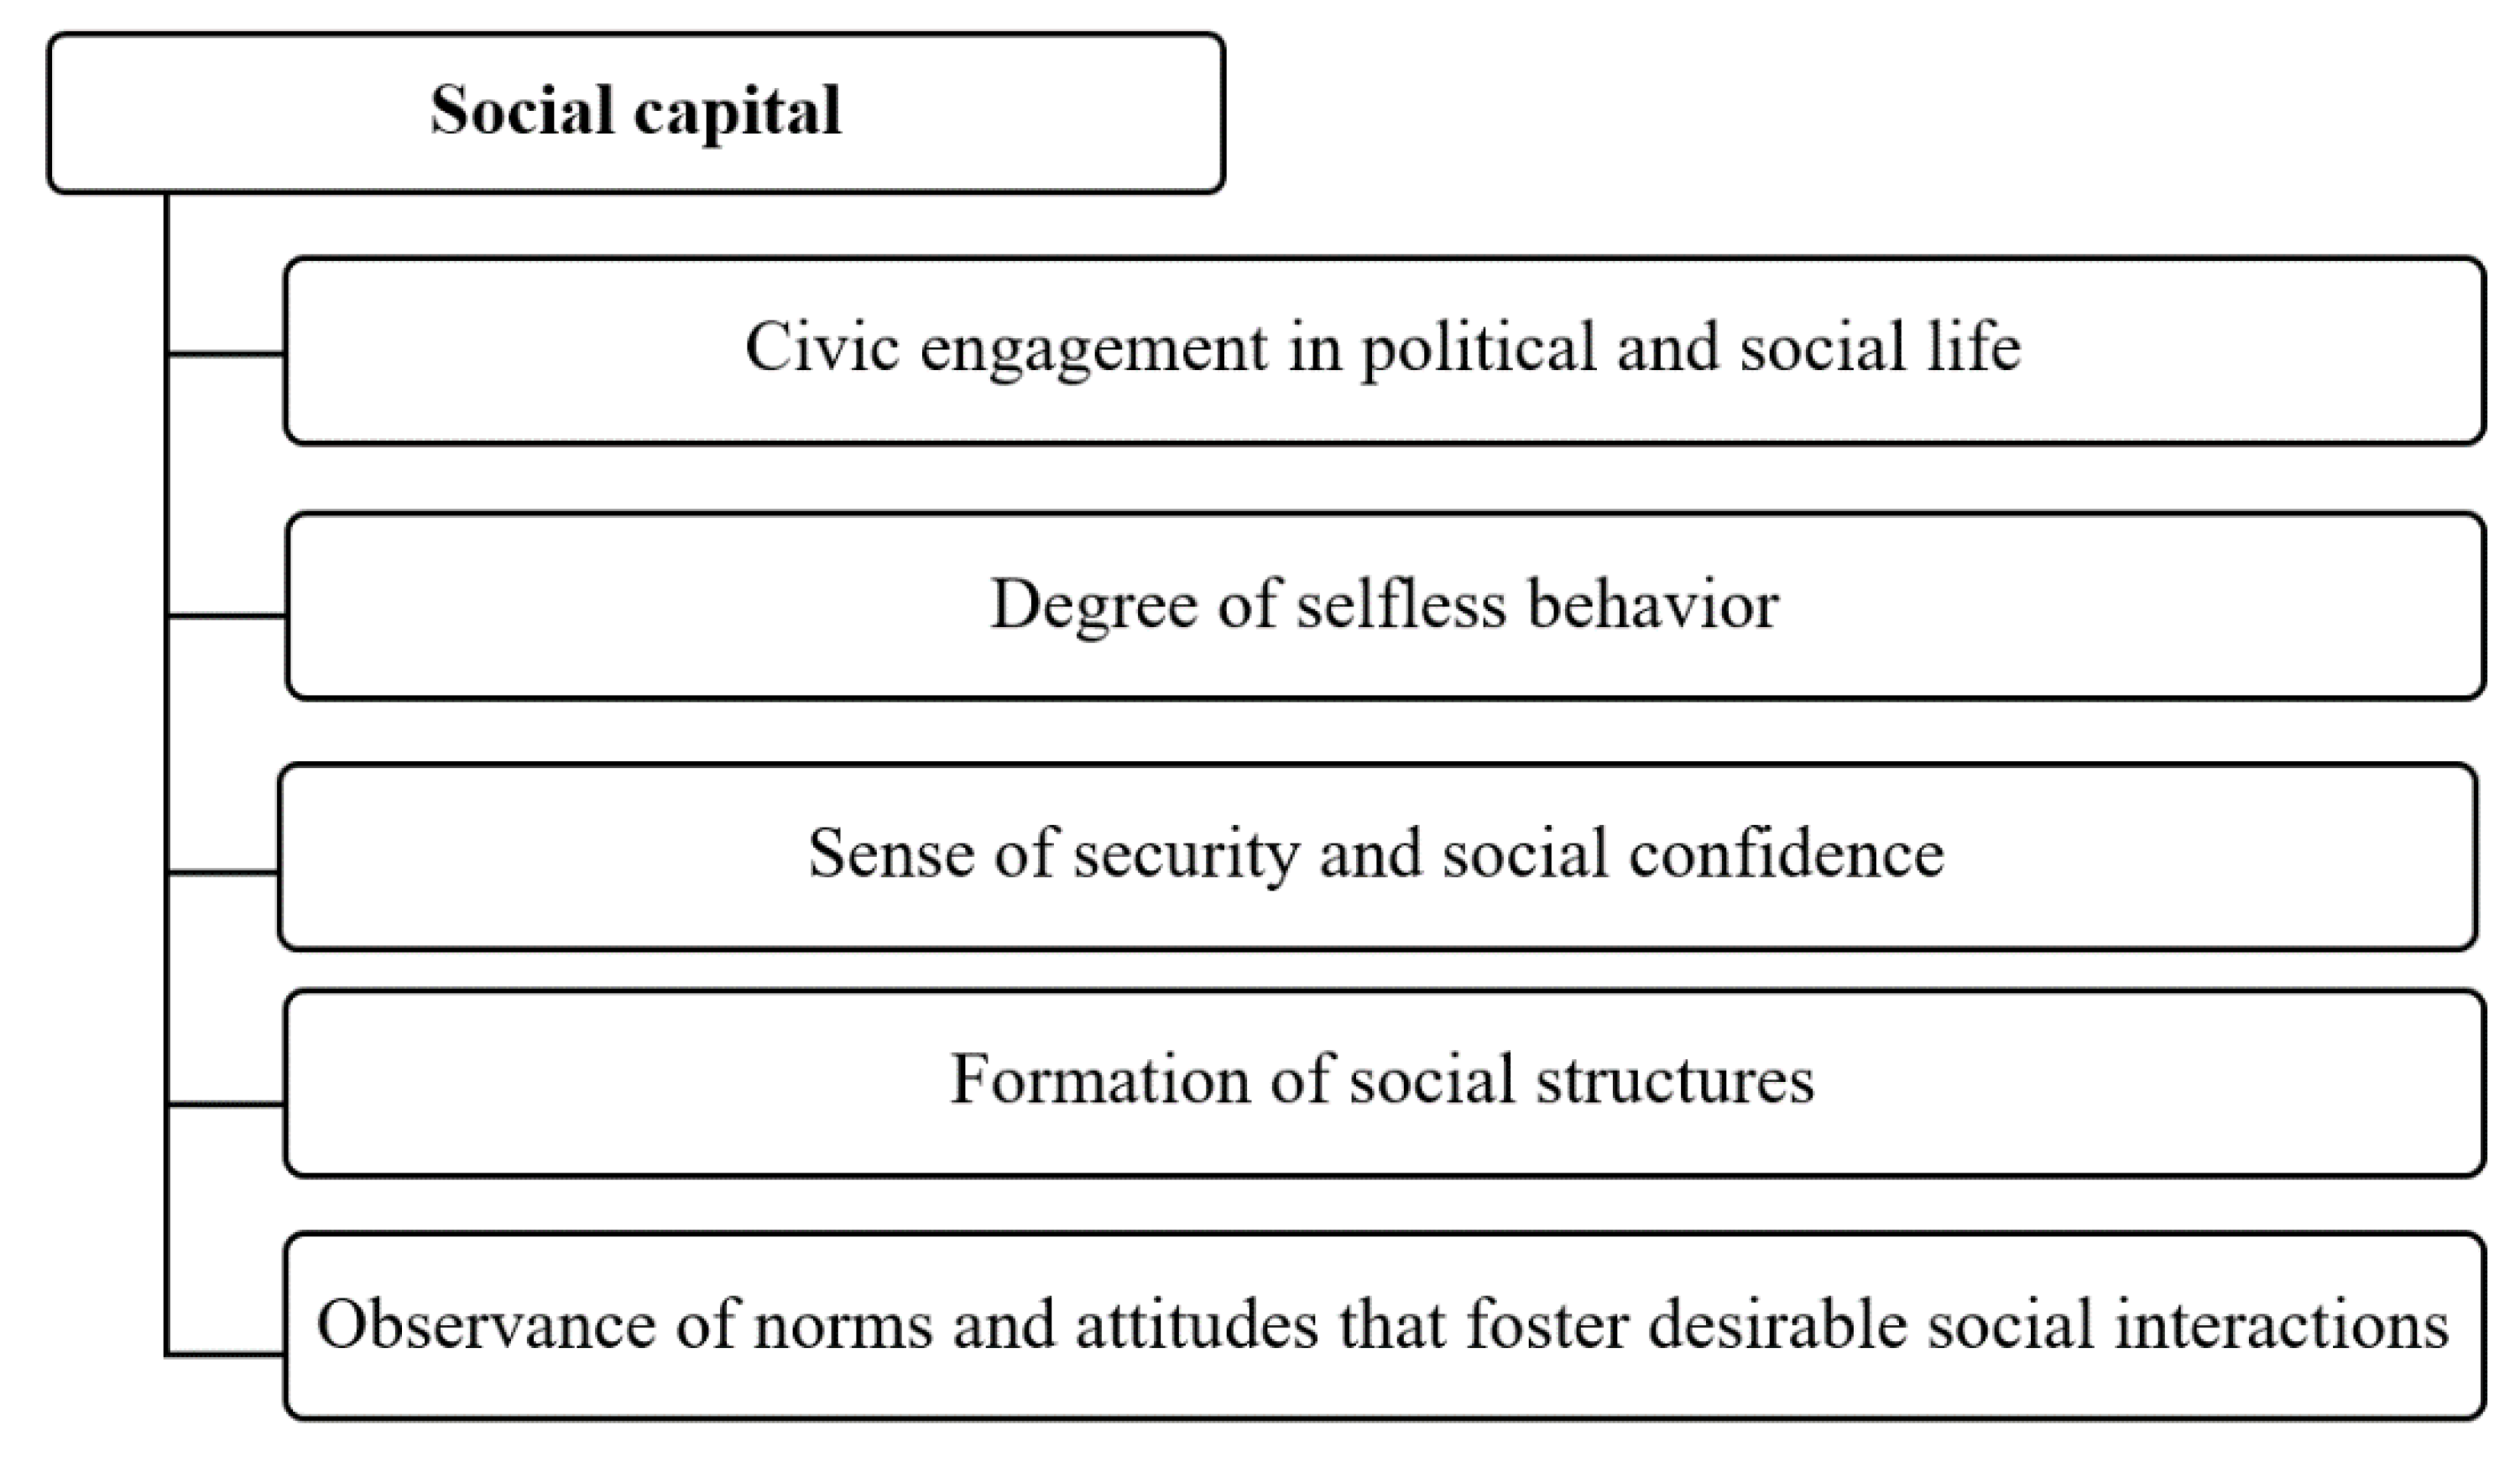
  • The measures (Figure 1) and indicators (Table 1) of social capital were determined based on a review of the literature. The study relied on the indicators described by Coleman [20], Putnam [25], Grootaert and van Bastelar [57], Narayan and Cassidy [58], Będzik [59], Janc [60], Foxton and Jones [61], Sierocińska [62], Siegler [63], Inglot-Brzęk [64], and Witczak-Roszkowska [65].
  • Excessively correlated variables (indicators) were eliminated from each measure by analyzing diagonal elements in the inverse correlation matrix. Various tools can be used to eliminate diagnostic variables, including the inverse correlation matrix. The elimination procedure involves the creation of a matrix of coefficients of correlation [R] between variables, followed by the creation of an inverse matrix [R−1]. The diagonal elements of the inverse matrix are then analyzed. A variable whose value on the main diagonal exceeds 10, i.e., a variable that is excessively correlated with the remaining variables, should be eliminated [54,66,67]. As a result, a total of 26 indicators were selected for further analysis (Table 1).
The selected indicators were used to build decision matrix xmxn whose rows denote the evaluated objects (voivodeships) and columns denote diagnostic variables (indicators of social capital measures). Therefore, xij is the value of the jth variable (j = 1, …, n) in the ith object. The variables (indicators) adopted for the study are listed in Table 1, Table 2, Table 3, Table 4 and Table 5.
3.
The composite indicators representing every measure of social capital were developed with the use of the TOPSIS method based on the following procedure:
  • indicator values were normalized with Formula (1) and the eigenvector was derived with Formula (2):
    r i j   = x i j i = 1 m x i j 2 ,   for   i = 1 ,   2 ,   ,   m   and   j = 1 ,   2 ,     n
    W = [ w 1 ,   w 2 ,   ,   w n ] ,   where   j = 1 n w j = 1
    where identical weights were used for all indicators:
  • normalized indicator values were weighted with the following formula:
    v i j = r i j w j   for   i = 1 ,   2 ,   ,   m   and   j = 1 ,   2 ,   ,   n
  • the coordinates of ideal units—positive ideal solution (A+) and negative ideal solution (A-)—were determined based on the below formulas:
    A + = ( v 1 + ,   v 2 + ,   ,   v n + )
    where v j + = max v i j ,     when j ϵ S and v j + = min v i j ,     when j ϵ D for j = 1, 2, …, n
    A = ( v 1 ,   v 2 ,   ,   v n )
    where v j = min v i j ,     when j ϵ S and v j = max v i j ,     when j ϵ D for j = 1, 2, …, n, where S—is a set of stimulating variables (stimulants), D—is a set of destimulating variables (destimulants).
Euclidean distances were calculated between every evaluated object (voivodeship) and the ideal positive solution d+ and the ideal negative solution d-:
d i + = j = 1 n ( v i j v j + ) 2   , d i = j = 1 n ( v i j v j ) 2 , i = 1 ,   2 , ,   m
  • composite indicators were calculated for each measure of social capital:
    S i = d i d i + + d i ,   where   0     S i     1 ,   ( i = 1 ,   2 ,   ,   m )
According to the TOPSIS method, the closer the value of the composite indicator is to 1, the higher the level of the analyzed phenomenon—in this case, the analyzed measure of social capital.
4.
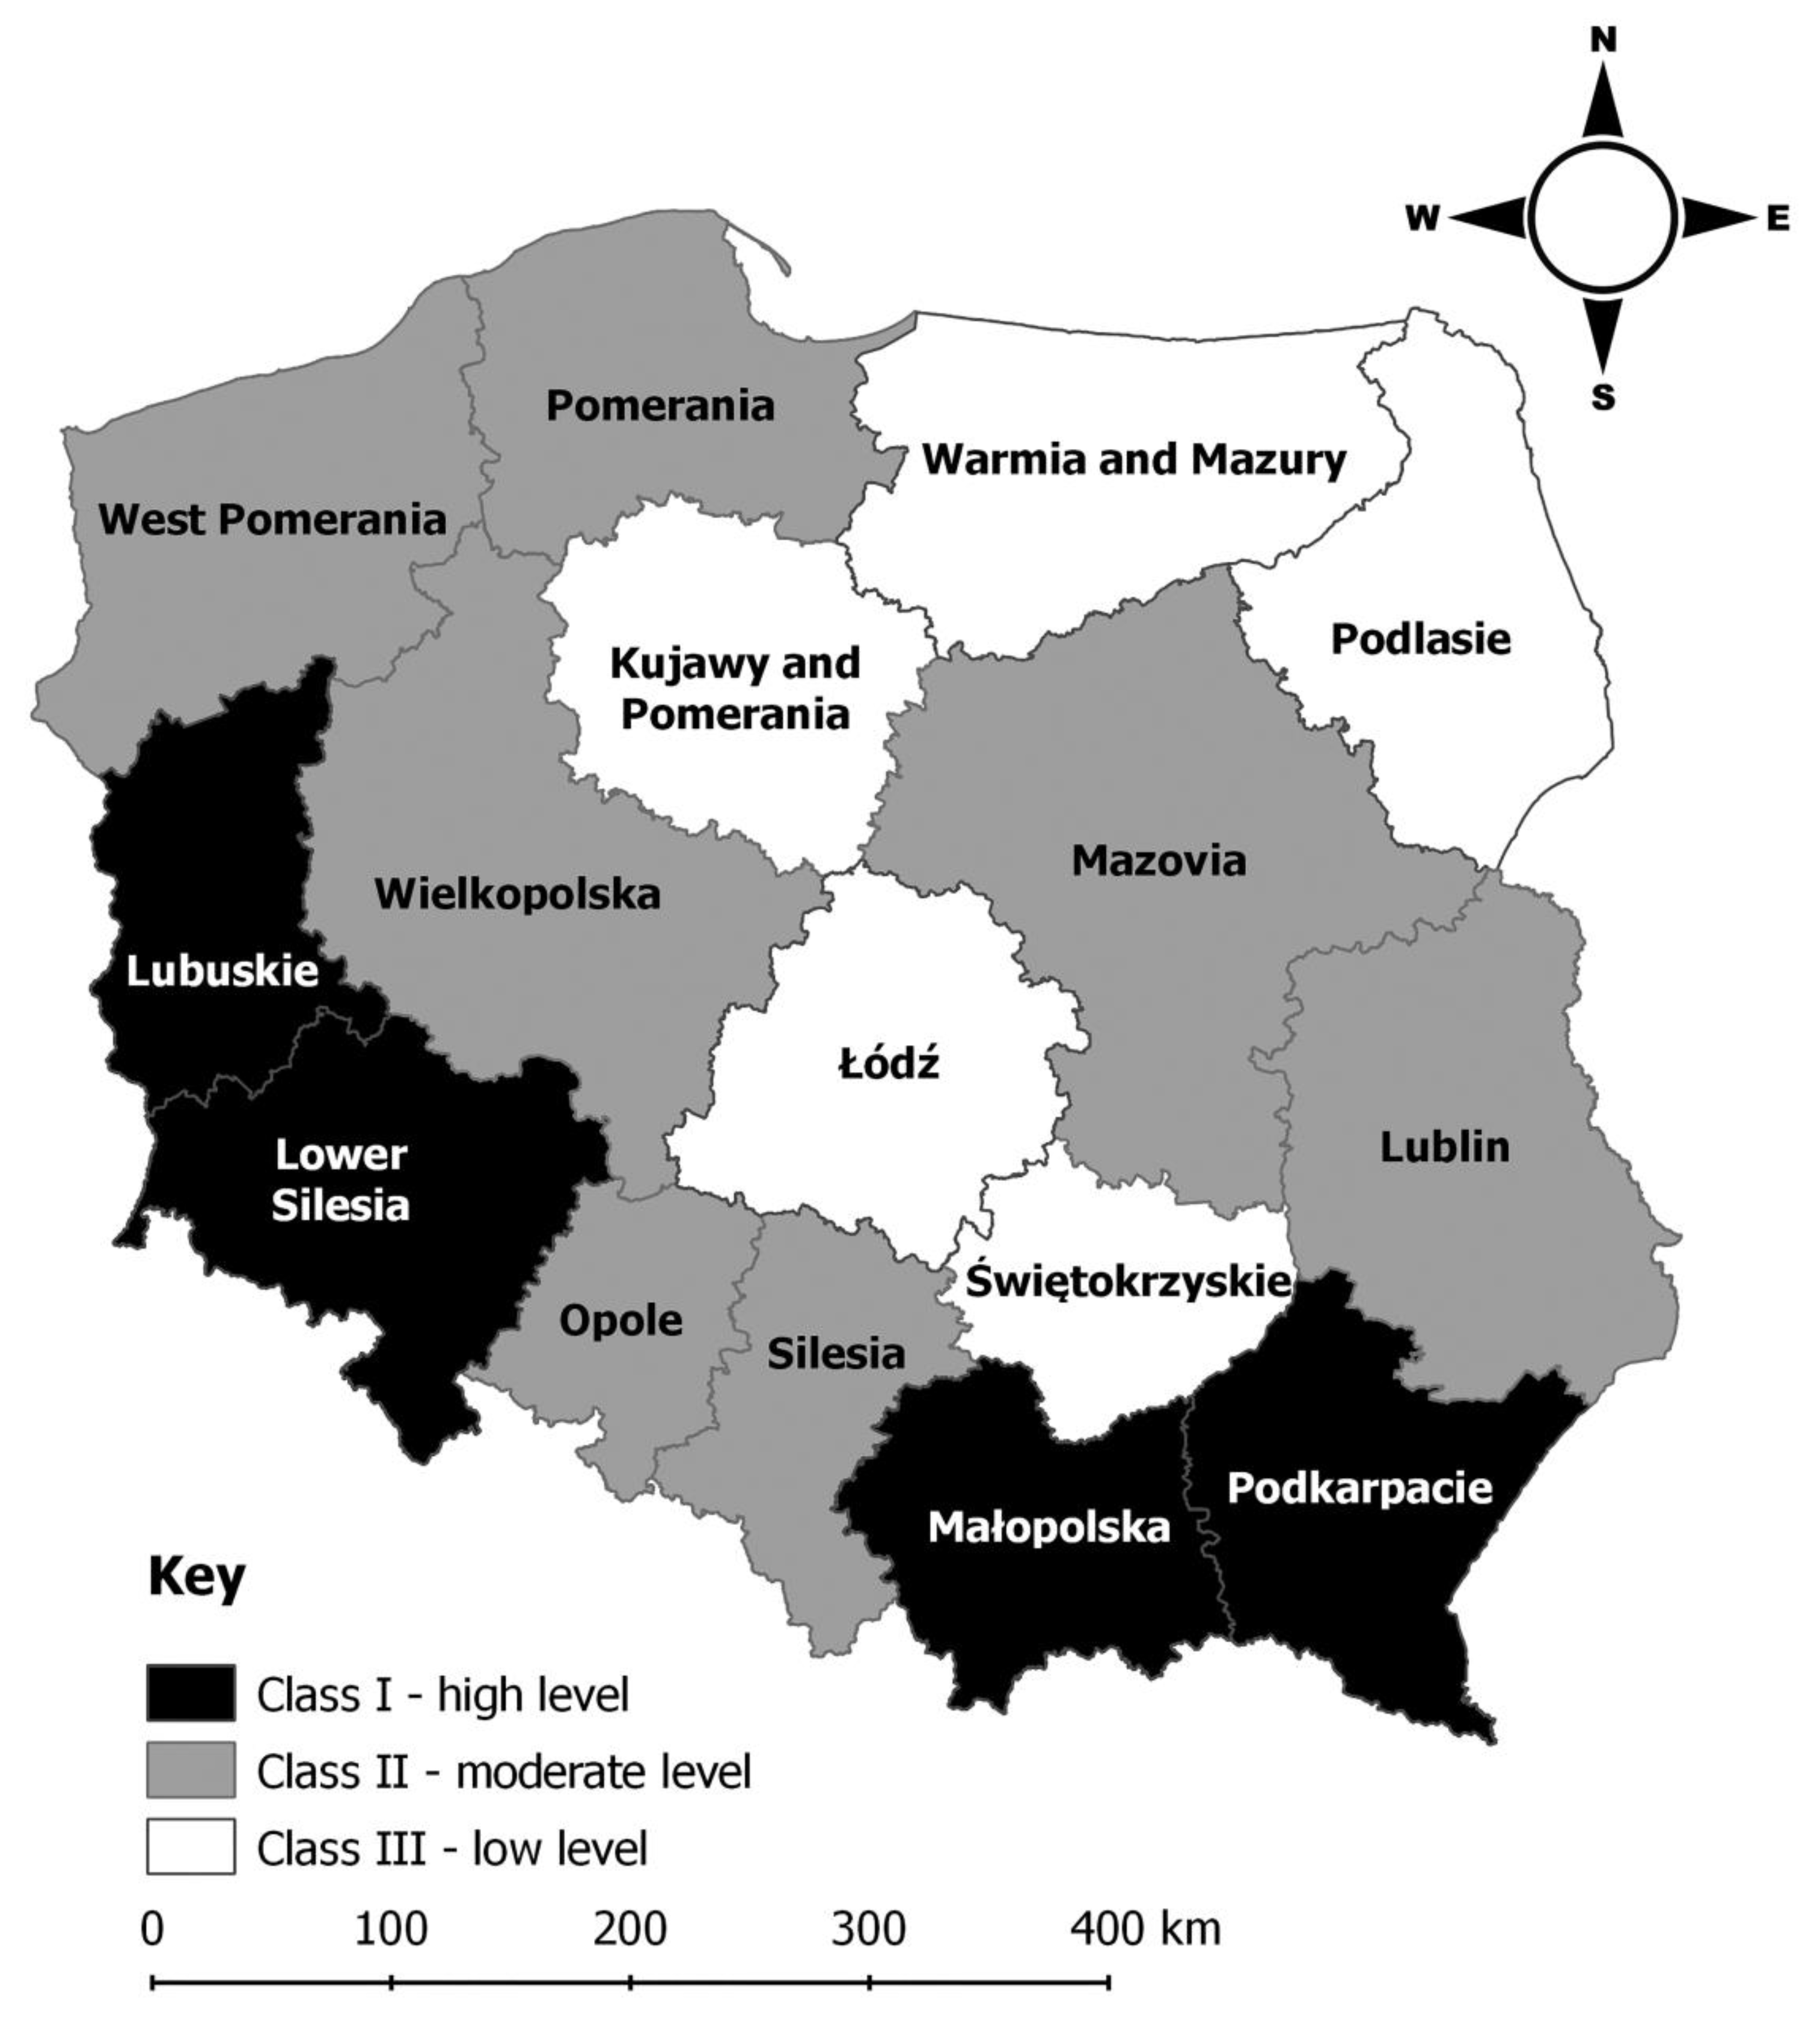
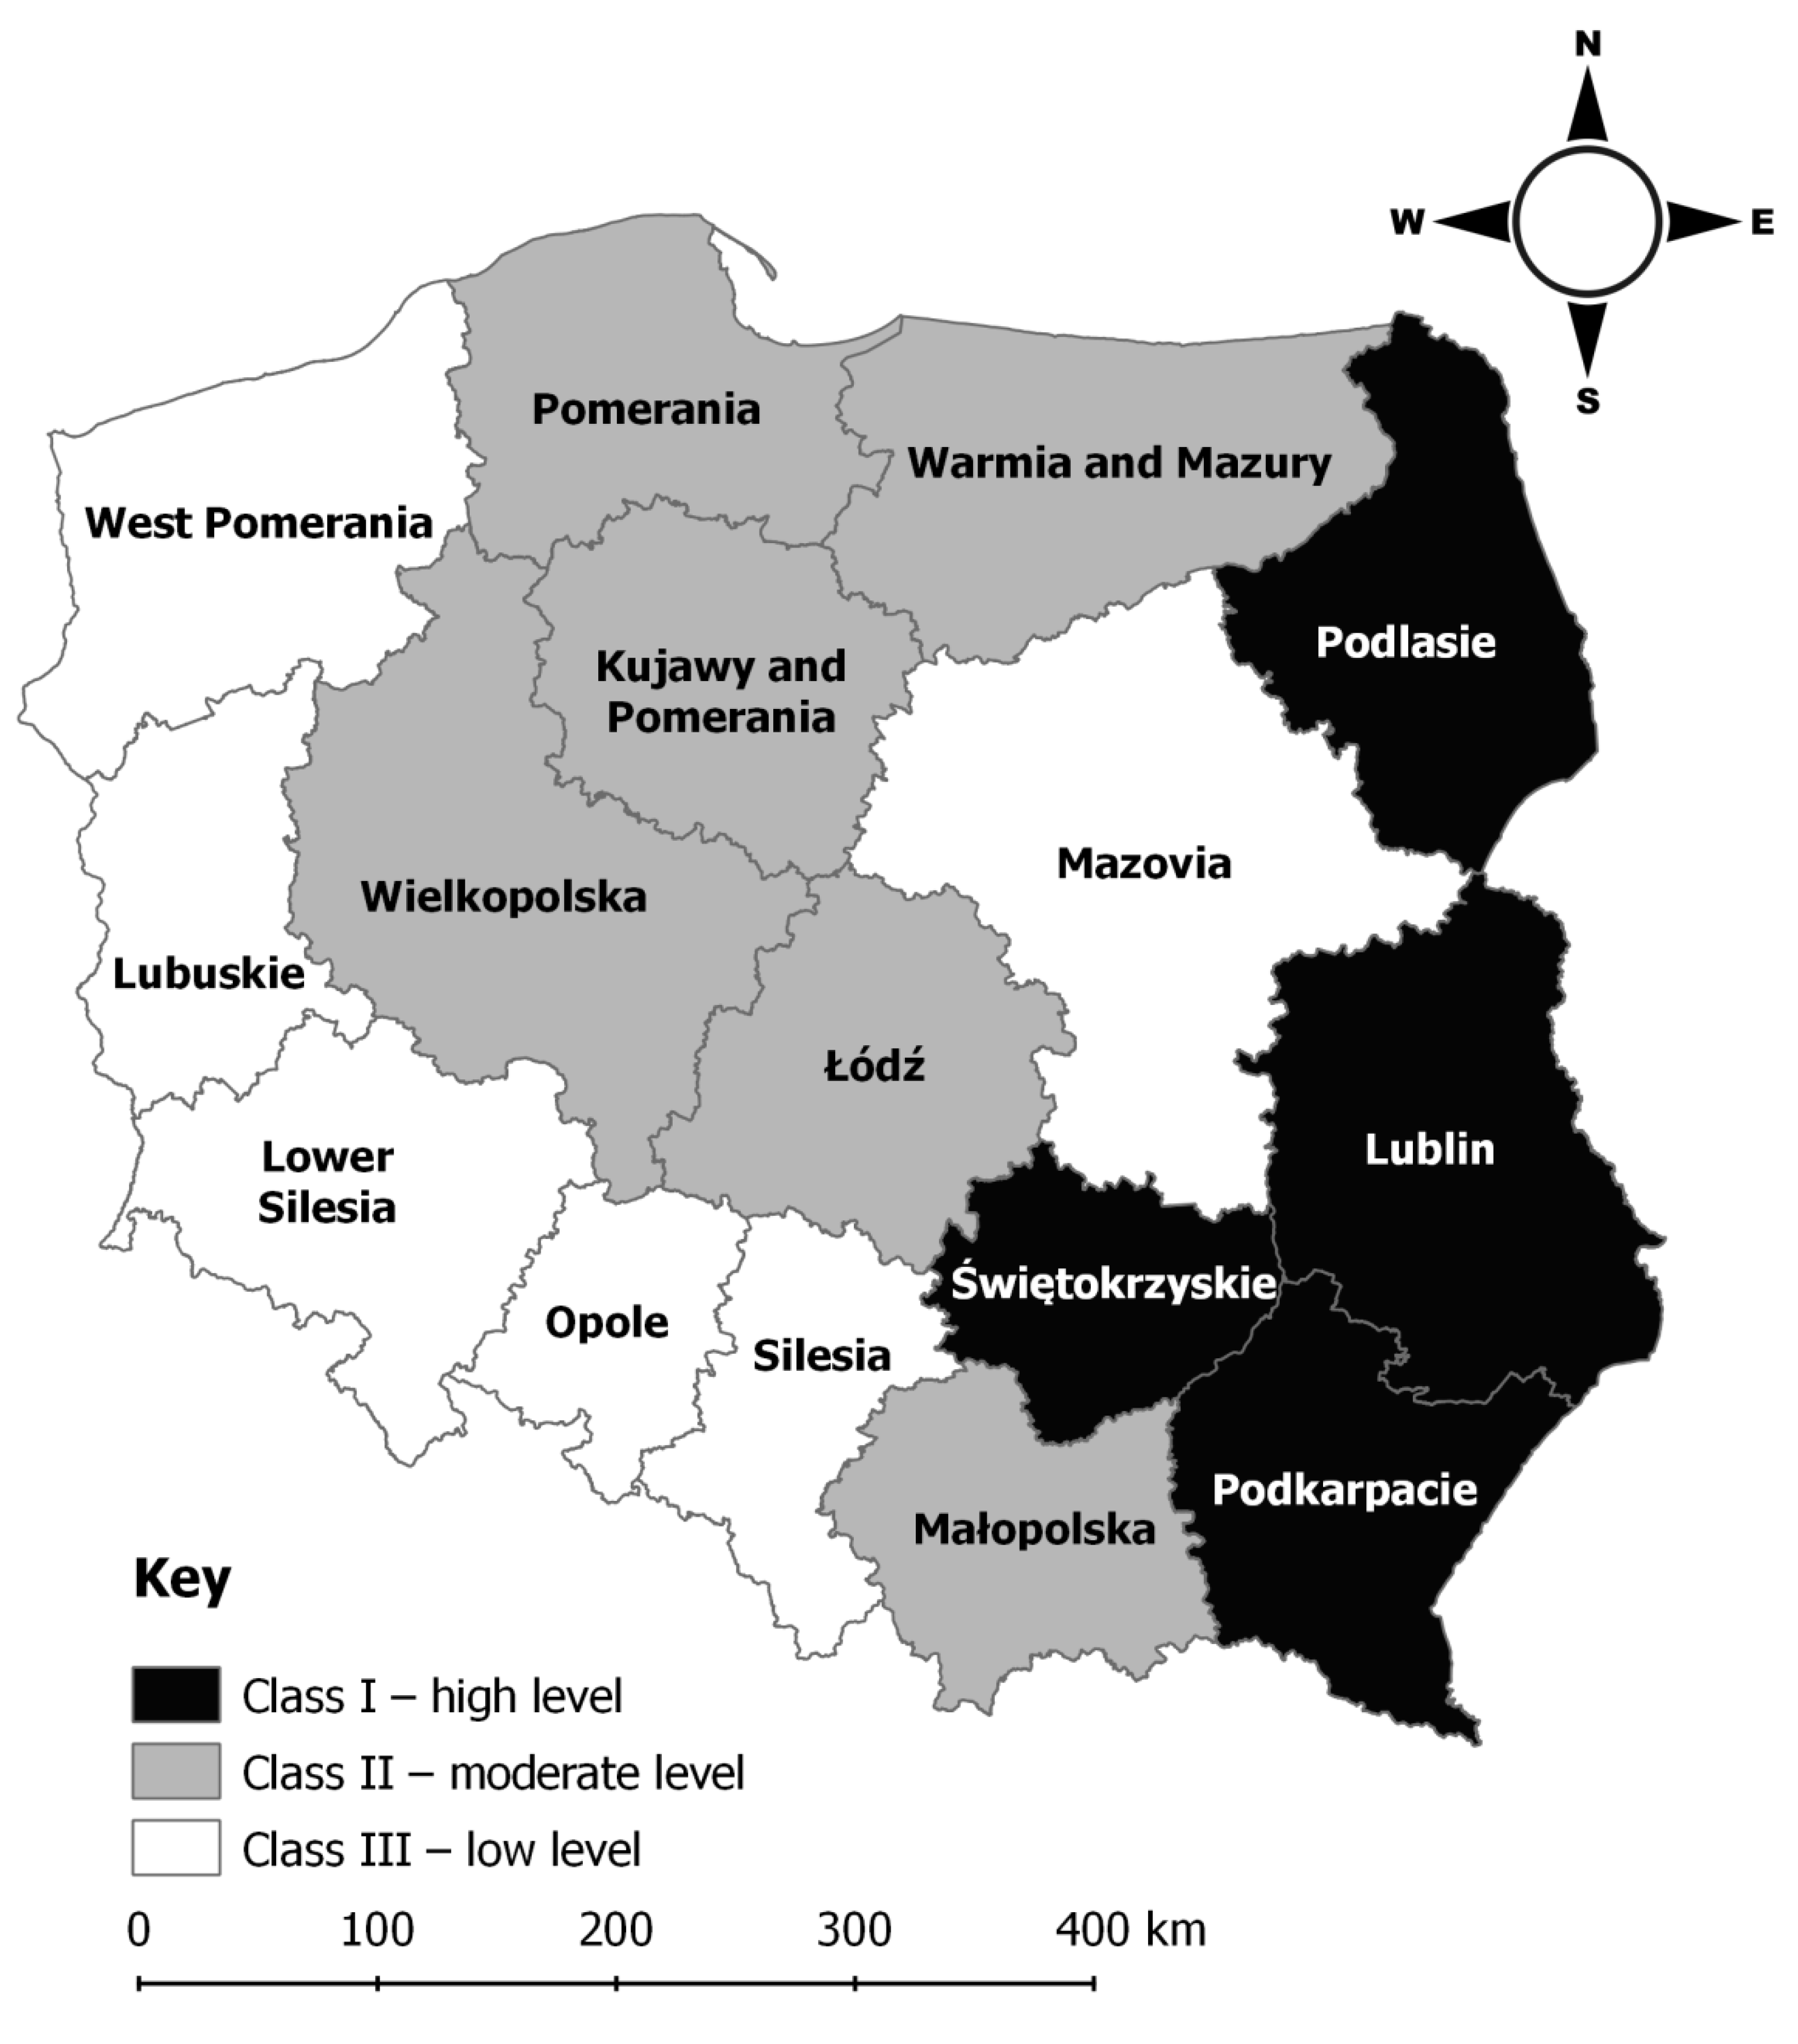
The evaluated objects (voivodeships) were arranged in a linear order and three typological classes were determined for every measure of social capital with the use of the arithmetic mean ( S i ¯ ) and standard deviation ( s S i ) of the composite indicator (Si):
  • S i S i ¯ + 0.5 s S i —class I—high level of the analyzed measures of social capital;
  • S i ¯ 0.5 s S i S i < S i ¯ + 0.5 s S i —class II—moderate level of the analyzed measures of social capital;
  • S i < S i ¯ 0.5 s S i —class III—low level of the analyzed measures of social capital.
5.
Significant correlations between composite indicators of the analyzed measures of social capital in Polish voivodeships were determined based on the value of Pearson’s correlation coefficient. Data were processed using STATISTICA software.

3. Results

3.1. Civic Engagement in Political and Social Life (Measure 1)

Civic engagement is defined as collective and premeditated action undertaken by members of a social group who participate in public (political) life and carry out local initiatives [68,69]. Therefore, it can be postulated that civic engagement extends beyond the traditional concept of citizenship and civic rights, which is limited to voting rights, freedom of expression, and public consultations, and that it also involves initiatives on behalf of the local community or participation in social events (festivals, fairs, etc.) [63].
In this study, civic engagement in political and social life varied considerably across the evaluated voivodeships (Table 2, Figure 2). The composite indicator ranged from 0.246 (Łódź) to 0.728 (Lower Silesia). Class I denoting high levels of civic engagement was composed of four voivodeships: Lower Silesia, Lubuskie, Małopolska, and Podkarpacie. The highest levels of civic engagement were noted in Lower Silesia, where four out of the five indicators exceeded the national average. Lower Silesia was also characterized by the highest number of municipalities with a village fund on the national scale. Voter turnout in local elections was the only indicator that scored below the national average (by approximately 3 percentage points). According to Kowalski [70], voter turnout in Poland is clearly correlated with the history of Polish regions that had been annexed by different foreign powers. Voter turnout is generally high in Galicia, which covers the present-day territory of the voivodeships of Małopolska and Podkarpacie, as well as in Wielkopolska and Pomerania. Voter turnout is somewhat below the national average in the Recovered Territories (including the Voivodeship of Lower Silesia). All indicators exceeded the national average in Podkarpacie, whereas in Małopolska, participation in various cultural events was significantly above the national average. The above can be attributed to the fact that Małopolska, in particular its capital city of Kraków, is a renowned cultural hub.
The highest number of voivodeships were assigned to class II, characterized by moderate levels of civic engagement in political and social life. Class II was composed of the voivodeships of Opole, Silesia, Pomerania, Lublin, Wielkopolska, Western Pomerania, and Mazovia. Voter turnout in general elections was highest in Mazovia (58.7% versus the national average of 49%). Opole was characterized by the highest percentage of citizens aged 16 and older who are involved in community work (21.66% versus the national average of 15.25%; this indicator is very low in Poland) as well as the lowest voter turnout in local elections (42.69% versus the national average of 47.33%), which is regarded as the key indicator of social engagement in local affairs.
Class III of voivodeships with low levels of civic engagement in political and social life was represented by 5 voivodeships: Kujawy and Pomerania, Świętokrzyskie, Podlasie, Warmia and Mazury, and Łódź. Łódź was the least socially involved Polish voivodeship due to low, mostly below-average values of the analyzed indicators, excluding voter turnout, which was around 1 percentage point higher than the national average. On the national scale, the lowest voter turnout in general elections (42.32% versus the national average of 49.04%) and the lowest percentage of citizens aged 16 years and older who were involved in community work (only 7.91% versus the national average of 15.25%) were noted in Warmia and Mazury.

3.2. Degree of Selfless Behavior (Measure 2)

Volunteer work, also referred to as community work, charity work or philanthropy, denotes organized activities that promote the welfare of others [71]. Community work is the main pillar of a civic society [72], and it manifests the most noble aspirations of humanity. Volunteer work delivers tangible benefits for the entire society by improving the quality of life (in the local community or the environment) and helping volunteers to build self-esteem [63]. Selfless attitudes promote social integration because volunteerism creates new opportunities for social contact [73], builds social links and contributes to social cohesion.
The degree of selfless behavior also varied considerably across Polish voivodeships (Table 3, Figure 3). The composite indicator of this measure ranged from 0.052 in Świętokrzyskie to 0.720 in Mazovia. Class I was composed of 3 voivodeships: Mazovia, Podlasie, and Lower Silesia. However, the value of the composite indicator was significantly higher in Mazovia than in the remaining class I voivodeships, which can be attributed to a very high number of charitable organizations entitled to receive 1% of income tax from individuals per 100,000 population and the highest total donations in virtue of 1% of income tax. Mazovia is the most economically developed region in Poland [74]; therefore, the number of persons who donated 1% of their income tax to charity per 100 population would probably be a more reliable measure of selfless behavior.
High values of the analyzed indicators were also noted in Lower Silesia, where the number of charitable organizations entitled to 1% of income tax from individuals and the number of blood donors per 10,000 population were higher than in Mazovia and exceeded the national average.
Podlasie deserves a special mention as a voivodeship with the highest number of blood donors per 10,000 population (297.62 versus the national average of less than 160) and the highest number of volunteers per 100,000 population (36.24 versus the national average of 23.05).
Class II was represented by 7 voivodeships, most of which are situated in western Poland: Wielkopolska, Silesia, Małopolska, Opole, Pomerania, Lubuskie, and Western Pomerania. Opole was characterized by the highest number of charitable organizations eligible to receive 1% of income tax, but also relatively low total donations in virtue of 1% of income tax. Six voivodeships were grouped in class III: Lublin, Podkarpacie, Kujawy and Pomerania, Warmia and Mazury, Łódź, and Świętokrzyskie. In Świętokrzyskie, all analyzed indicators were significantly below the national average, and the voivodeship ranked last in the country in terms of the number of charitable organizations entitled to receive 1% of income tax from individuals and total donations in virtue of 1% of income tax from individuals.

3.3. Sense of Security and Social Confidence (Measure 3)

Social confidence is regarded as one of the most important measures and the key component of social capital [75]. Social confidence promotes social stability, democracy, and economic growth [63]. Neighbors who trust one another are more likely to work in accord to pursue common goals and resolve shared problems. Trust also builds bonds between the local authorities and community members, and it can encourage residents to become more involved in local affairs, which is the goal of the Polish Strategy for Social Capital Development. The adoption of modern policy solutions aimed at good governance increases confidence in public institutions such as the local authorities or the police, and it builds bonds between engaged citizens [76].
A sense of security in the place of residence, which is partially linked with the local crime rate, is an important element of social confidence. A higher crime rate represents negative social capital, and it can decrease social trust and, consequently, slow down economic growth [77,78,79]. People who feel safe are more likely to trust their neighbors and social institutions.
The composite indicator for the sense of security and social confidence (Table 4, Figure 4) ranged from 0.185 in Lower Silesia to 0.943 in Podkarpacie. Class I was represented by 4 voivodeships: Podkarpacie, Podlasie, Lublin, and Świętokrzyskie. It should be noted that all class I voivodeships are situated in eastern Poland, which is the least economically developed Polish region and one of the least developed regions in the European Union [80]. Eastern Poland has been receiving support from a dedicated program [81,82] promoting competition and innovation in the region.
Perceptions of security and social confidence were highest in Podkarpacie. This voivodeship was characterized by the highest levels of trust vested in the local authorities and neighbors. Podkarpacie was also characterized by the highest perceived security in the place of residence and the lowest crime rate in the country. The latter could be partially attributed to a low crime detection rate, which explains the moderate trust vested in the police (approximating the national average). Confidence in the police was highest in the neighboring voivodeship of Lublin.
Six voivodeships belonged to class II of moderate values: Wielkopolska, Kujawy and Pomerania, Warmia and Mazury, Pomerania, Łódź, and Małopolska. In Warmia and Mazury, the values of stimulants were above the national average, whereas the values of destimulants were below the national average. Similarly to class I voivodeships, Warmia and Mazury has been receiving support from the Eastern Poland Operational Program. Class II also included Łódź, which was characterized by the lowest level of confidence in the local authorities on the national scale.
Class III was also represented by 6 regions, including 5 regions in western Poland as well as Mazovia, which is a centrally located region with the highest level of economic development in the country. Despite relatively low values of the analyzed indicators, Western Pomerania was characterized by a high level of trust in neighbors, which was similar to that noted in the Podkarpacie (class I). Class III also encompassed Mazovia with the lowest sense of security in the place of residence on the national scale, Opole with the lowest confidence in the police on the national scale, Lubuskie with the lowest level of trust in neighbors, Silesia, and Lower Silesia with the lowest sense of security and social confidence in Poland. Lower Silesia was also characterized by the highest crime rate in the country.

3.4. Formation of Social Structures (Measure 4)

Civic organizations contribute to the effectiveness and stability of democracy by exerting an “internal” influence on local community members as well as an “external” influence on the society as a whole. As part of their internal influence, civic organizations create a culture of cooperation, solidarity, and participation in social affairs. A dense network of external organizations enhances processes known as interest articulation and interest aggregation [26]. Membership in local organizations, clubs, and associations strengthens interpersonal relationships and builds mutual trust. Voluntary activities can drive social change and are also regarded as the cornerstone of a civic society [64].
The composite indicator relating to the formation of social structures (Table 5, Figure 5) ranged from 0.287 in Western Pomerania to 0.846 in Podkarpacie. Class I encompassed 5 voivodeships situated in southeastern Poland: Podkarpacie, Małopolska, Lublin, Opole, and Podlasie. It should be noted that Podkarpacie, Lublin, and Podlasie were characterized by the lowest indicators of social isolation in Poland. At the same time, the sense of security and social confidence was relatively high in these voivodeships. Podkarpacie was characterized by the highest membership in artistic organizations in the country, which could be attributed to the region’s multinational and multicultural heritage, which contributed to its diverse sociocultural environment. Opole, the smallest and least-populated Polish voivodeship, emerged as a region with the highest membership in sports clubs and hobby clubs. This result can be ascribed to the strong links between sports and historical traditions in Upper Silesia [83,84].
Class II was also represented by 5 voivodeships: Wielkopolska, Lower Silesia, Silesia (with the lowest number of foundations, associations, and social organizations in the country), Warmia and Mazury, and Lubuskie. Interestingly, Silesia is the only Polish voivodeship where the number of urban counties exceeds the number of rural counties, and the number of social organizations is generally much higher in urban counties [85].
Class III voivodeships were situated mainly in central Poland and the historical region of Pomerania. Class III was composed of 6 voivodeships: Pomerania, Mazovia, Łódź, Kujawy and Pomerania, Świętokrzyskie, and Western Pomerania. Pomerania was characterized by the lowest membership in hobby clubs in the country. Mazovia had the lowest membership in artistic organizations and the highest number of foundations, associations, and social organizations in the country, which can be directly attributed to the fact that Warsaw, the Polish capital and the seat of government institutions, attracts not only businesses but also social organizations [84]. Membership in sports clubs was lowest in Świętokrzyskie, probably due to the highest percentage of senior citizens in the local population. The highest value of the social isolation index was determined in Western Pomerania (14% versus the national average of 8.56%). At the same time, Western Pomerania was characterized by the highest trust in neighbors, a factor that fosters the development of human relationships.

3.5. Observance of Norms and Attitudes That Foster Desirable Social Interactions (Measure 5)

Social norms are a set of guidelines that define an individual’s functions in a group or a community [86,87,88]. Social norms express acceptable rules of conduct and shared values that shape social relations and harmonious interactions between members of the local community [40,89]. Similarly to trust, social networks provide the platform for the evolution of civic virtues and, consequently, a civic society [26]. They facilitate the coordination of social activities and increase their effectiveness.
The composite indicator for the observance of norms and attitudes that foster desirable social interactions (Table 6, Figure 6) ranged from 0.288 in Świętokrzyskie to 0.791 in Opole. Class I was represented by 5 voivodeships: Opole, Silesia, Podkarpacie (with the highest indicator of good neighborly relations and the highest unconditional disapproval of fare evasion in public transport in the country), Małopolska (with the highest unconditional disapproval of tax evasion in the country), and Lubuskie. Opole was characterized by the highest adherence to social norms and attitudes in the country. However, Opole had emerged as one of the poorest Polish regions in a 2014 ranking. With a GDP per capita of PLN 36,299 (Polish average: PLN 44,705) and an average disposable income of PLN 1245 (Polish average: PLN 1340), Opole ranked 11th on the list of Polish voivodeships in 2014. Opole was also regarded as a region with a high risk of social exclusion [90], a factor that is chiefly responsible for the violation of social norms [91]. However, the results of this study did not confirm the above correlation in the Opole voivodeship. The residents of Opole were unconditionally opposed to welfare fraud, bribery, illegal employment, and fare evasion in public transport, and the relevant indicators were highest in the country. In the group of 7 evaluated indicators, only good neighborly relations scored less than 1 percentage point below the national average.
Class II was represented by 6 voivodeships: Kujawy and Pomerania (highest unconditional disapproval for bribery in the country), Wielkopolska, Pomerania, Lublin, Lower Silesia (highest unconditional disapproval for tax evasion in the country), and Warmia and Mazury (lowest percentage of citizens who are sensitive to offenses against the public good).
Class III was composed of 5 voivodeships: Western Pomerania (lowest value of the indicator of good neighborly relations), Mazovia (lowest unconditional disapproval of tax evasion and fare evasion in public transport), Podlasie (lowest unconditional disapproval of illegal employment, but the highest percentage of citizens sensitive to offenses against the public good), Łódź, and Świętokrzyskie (lowest unconditional disapproval of welfare fraud and bribery).

3.6. Analysis of Correlations between Measures of Social Capital

In the analysis of the correlations between different measures of social capital (Table 7), a significant correlation was noted only between civic engagement in political and social life versus the formation of social structures and the observance of norms and attitudes that foster desirable social interactions.
These findings indicate that individuals who participate in the region’s political and social affairs also more likely to join various organizations and observe the norms and attitudes that foster desirable social interactions. The opposite also applies: individuals who are members of social organizations and residents who observe norms and attitudes, which foster desirable social interactions, are also more likely to become involved in the region’s political and social affairs.

4. Summary and Conclusions

The ideas formulated by influential precursors such as Bourdieu, Coleman, Putnam, and Fukuyama are the tenets of the modern multidisciplinary and multidimensional theory of social capital. Many of the proposed definitions have a common denominator by recognizing that social capital is built upon interpersonal relationships and social ties [20,26,35,92] that generate tangible benefits such as economic growth [23,26,93,94,95,96]. Social relationships facilitate collaboration and the achievement of common goals [20,26,97]. Collaboration is also manifested by social (civic) engagement [62], namely, direct involvement in social, public, and political activities, such as the development of municipal documents, voting in elections, and involvement in local community affairs. Social cooperation requires mutual trust [26,97,98,99,100], which is one of the key measures of social capital [75,101]. Social relations have to be governed by certain norms [26,97,98,100] that foster desirable social attitudes [62], promote cooperation, and facilitate problem-solving for advancing the common good [26,97,98].
Social capital is an interdisciplinary concept that attracts the interest of economists (capital), sociologists (standards and norms), social psychologists (trust), mathematicians (game theory, network theory), and anthropologists (principle of reciprocity) [102]. For this reason, social capital does not have an exact and straightforward definition [28], and the variables for measuring social capital are difficult to select [64,103,104]. The key variables that characterize social capital include human interactions, trust, willingness to reach mutual understanding, a common set of values and behaviors, and social networks that are a prerequisite for collective action. Therefore, social capital encompasses all factors that underpin group actions aiming to achieve common goals in every area of life, including the economy, culture, and politics [105]. It should be noted that social capital also has a spatial dimension, even in a world where social interactions increasingly take place in virtual space. The spatial dimension of social capital has not been widely explored in the literature [7,8,9], mostly because researchers rarely make a distinction between space and location. For this reason, research into social capital often ignores the multidimensional character of a given location [7,8]. In this study, the variations in social capital levels in Poland were evaluated with the TOPSIS method, which supports analyses of multidimensional phenomena by replacing several variables with a single composite (synthetic) variable.
Social capital is a multidimensional concept [41,43] that cannot be measured or expressed with a single variable [42]. For this reason, five measures of social capital were proposed based on a review of the literature: civic engagement in political and social life, degree of selfless behavior, sense of security and social confidence, formation of social structures, and the observance of norms and attitudes that shape desirable social interactions. A total of 26 variables (indicators) were identified based on the statistical data for 2014–2016, provided by Statistics Poland, the Social Diagnosis project, Moja Polis website, and the National Election Committee. Such an extensive dataset suggests that social capital is a complex phenomenon which should be analyzed with the use of a multidimensional model that relies on numerous indicators. The identified variables were pooled to develop a composite indicator.
An analysis of the geographic distribution of social capital revealed that Polish voivodeships not only differ considerably in terms of the evaluated measures of social capital, but are also characterized by significant internal variation within each measure. The measures of social capital in Poland are presented in Table 8.
Similar results were reported by Bednarek-Szczepańska [84], who reviewed Polish studies and reports where spatial variations in the social capital of Polish regions were analyzed quantitatively. The highest quality of social capital is noted mostly in large cities and the surrounding areas, which is consistent with the findings of Janc [106]. The cited author also observed that spatial variations in social capital were largely consistent with differences in the socioeconomic development of eastern and western Poland. However, somewhat different conclusions can be drawn from the present study. For example, all measures of social capital scored high values in Podkarpacie. Four out of the five evaluated measures received high scores, and only one measure received a low score (degree of selfless behavior). Similar observations were made by Działek [107], in whose study all three components of social capital scored above the national average only in Podkarpacie and Lublin. In turn, low levels of social capital were reported by Janc [104].
The other end of the spectrum was represented by the Łódź voivodeship, where only one measure received an average score (sense of security and social confidence), and the remaining measures received low scores. These findings contradict the theory that high levels of social capital are linked with high levels of economic development. Podkarpacie belongs to a group of less economically developed voivodeships (Eastern Poland) [80], whereas Łódź is situated in central Poland, which is the most economically developed Polish region [74].
The analyzed measures were bound by only two correlations. The first indicates that citizens are more likely to become involved in political and social affairs as more social structures are developed. The second correlation also demonstrates that civic engagement in political and social life increases with the observance of norms and attitudes that foster desirable social interactions. These findings suggest that social capital is a measure of social awareness in a region and reflects on the residents’ willingness and ability to participate in the decision-making process.
The present study revealed average levels of social capital in Polish voivodeships. The majority of Polish voivodeships were grouped in class II across the evaluated measures. The most pressing problems that detracted from civic awareness in all voivodeships (problems that were diagnosed in more than 50%, i.e., at least 9 voivodeships, where the values of the corresponding indicators were below the national average) were: low voter turnout, in particular in local elections, small number of charitable organizations entitled to 1% of income tax from individuals, low total donations in virtue of 1% of income tax from individuals, low number of blood donors, low number of volunteers, low trust in neighbors, low membership in artistic organizations, and low unconditional disapproval of illegal employment.
In the context of sustainable development, the results of the study indicate that the interregional diversity of social capital should not contribute to inequality between the Polish regions. On the contrary, social capital should be helpful in eliminating inequalities. The results of this study indicate that less economically developed eastern regions possess relatively high levels of social capital, which can be used in decision-making to promote balanced regional development.
This study has certain limitations. Firstly, only publicly available data were used in the analysis. Five measures of social capital were evaluated based on different variables, but potential relations could not be exhaustively examined due to the absence of the relevant data. Composite indicators were developed based solely on the data available in public databases. However, individual preferences and opinions were not investigated, and such evaluations would require in-depth interviews with local community members. It should be stressed that analyses of secondary data were helpful in eliminating bias in this study, although in-depth interviews with community members could produce valuable insights and set new directions for future research into sustainable development. Secondly, the study focused solely on Polish regions, and the results cannot be directly extrapolated to other countries. Cultural and institutional differences can significantly influence the development of social capital. It should be noted that social capital analyses that are based on a limited number of variables can lead to the oversimplification of results, as is the case in the European Value Study (EVS) and the World Values Survey (WVS). The above particularly applies to international comparisons. In comparison with other European countries, Poland scored low in terms of general confidence levels and the number of nongovernmental organizations, which could be attributed to considerable differences in social capital between Poland and the remaining countries. According to Bednarek-Szczepańska, this is an example of unjust overinterpretation of data [84].
This study contributes to the existing knowledge of spatial variations in social capital. The developed conceptual model can stimulate discussion and research into social capital. The proposed procedure can be used at different levels of decision-making to develop social, economic, and environmental policies and build strategies that promote sustainable development.
Further research is required to elucidate the cause and effect relationship between the creation and development of social capital and effective state and local policies that aim to strengthen civic engagement in social and political affairs.

Author Contributions

Conceptualization, K.P.; methodology, K.P. and A.P.; design, K.P. and A.P.; visualization, K.P. and A.P.; analyzed the data, K.P. and A.P.; wrote the paper, K.P. and A.P. All authors have read and agreed to the published version of the manuscript.

Funding

The results presented in this paper were obtained within this scheme MINIATURA 3 financed by the National Science Centre (NCN) (grant No. 2019/03/X/HS4/01255). This paper was funded by the project financed by the University of Warmia and Mazury in Olsztyn (grants No. 20.610.006-110 and No. 29.610.014-110).

Acknowledgments

The authors wish to thank the anonymous reviewers for their valuable comments and suggestions.

Conflicts of Interest

The authors declare no conflict of interest. The funders had no role in the design of the study; in the collection, analyses, or interpretation of data; in the writing of the manuscript, or in the decision to publish the results.

References

  1. Cieslak, I.; Pawlewicz, K.; Pawlewicz, A. Sustainable Development in Polish Regions: A Shift-Share Analysis. Pol. J. Environ. Stud. 2019, 28, 565–575. [Google Scholar] [CrossRef]
  2. Ulfik, A.; Nowak, S. Determinants of Municipal Waste Management in Sustainable Development of Regions in Poland. Pol. J. Environ. Stud. 2014, 23, 1039–1044. [Google Scholar]
  3. Emas, R. The concept of sustainable development: Definition and defining principles. In Brief for GSDR; United Nations: Sustainable Development Goals Knowledge Platform: New York, NY, USA, 2015; p. 3. [Google Scholar]
  4. Bond, R.; Curran, J.; Kirkpatrick, C.; Lee, N.; Francis, P. Integrated impact assessment for sustainable development: A case study approach. World Dev. 2001, 29, 1011–1024. [Google Scholar] [CrossRef]
  5. Grzebyk, M.; Stec, M. Sustainable Development in EU Countries: Concept and Rating of Levels of Development. Sustain. Dev. 2015, 23, 110–123. [Google Scholar] [CrossRef]
  6. Giddings, B.; Hopwood, B.; O’Brien, G. Environment, economy and society: Fitting them together into sustainable development. Sustain. Dev. 2002, 10, 187–196. [Google Scholar] [CrossRef]
  7. Rutten, R.; Westlund, H.; Boekema, F. The Spatial Dimension of Social Capital. Eur. Plan. Stud. 2010, 18, 863–871. [Google Scholar] [CrossRef] [Green Version]
  8. Foster, K.A.; Pitner, R.; Freedman, D.A.; Bell, B.A.; Shaw, T.C. Spatial Dimensions of Social Capital. City Commun. 2015, 14, 392–409. [Google Scholar] [CrossRef]
  9. Jorgensen, B.S. Subjective Mapping Methodologies for Incorporating Spatial Variation in Research on Social Capital and Sense of Place. Tijdschr. Econ. Soc. Geogr. 2010, 101, 554–567. [Google Scholar] [CrossRef]
  10. Cole, M.A. Limits to growth, sustainable development kuznets curves: An examination of the environmental impact of economic development. Sustain. Dev. 1999, 7, 87–97. [Google Scholar] [CrossRef]
  11. UN. Our Common Future; World Commission on Environment and Development: Oxford, UK, 1987; p. 383. [Google Scholar]
  12. UN. World Economic and Social Survey 2013: Sustainable Development Challenges; United Nations: New York, NY, USA, 2013; p. 181. [Google Scholar]
  13. Holden, E.; Linnerud, K. The sustainable development area: Satisfying basic needs and safeguarding ecological sustainability. Sustain. Dev. 2007, 15, 174–187. [Google Scholar] [CrossRef]
  14. UN. Global Sustainable Development Report 2015; United Nations: New York, NY, USA, 2015; p. 198. [Google Scholar]
  15. Rogers, S.H.; Gardner, K.H.; Carlson, C.H. Social Capital and Walkability as Social Aspects of Sustainability. Sustainability 2013, 5, 3473–3483. [Google Scholar] [CrossRef] [Green Version]
  16. Pawlewicz, K.; Pawlewicz, A.; Cieslak, I. Evaluation of the Implementation of Sustainable Development in Rural Communes in Eastern Poland. In Proceedings of the Economic Science for Rural Development: Rural Development and Entrepreneurship, Jelgava, Latvia, 21–22 April 2016; pp. 132–139. [Google Scholar]
  17. Valiance, S.; Perkinsa, H.C.; Dixonb, J.E. What is social sustainability? A clarification of concepts. Geoforum 2011, 42, 342–348. [Google Scholar] [CrossRef]
  18. Bórawski, P.; Dunn, J.W. Evaluation of human capital in dairy farm owners according to the level of education. In Rural Development in Poland: The Role of Policy, Tourism and Human Capital; Borawski, P., Brelik, A., Czyżewski, B., Eds.; WSES Ostrołęka: Ostrołęka, Poland, 2014; pp. 115–123. [Google Scholar]
  19. Dolfsma, W.; Dannreuther, C. Subjects and boundaries: Contesting social capital-based policies. J. Econ. Issues 2003, 37, 405–413. [Google Scholar] [CrossRef]
  20. Coleman, J.S. Social Capital in the Creation of Human-Capital. Am. J. Sociol. 1988, 94, S95–S120. [Google Scholar] [CrossRef]
  21. Loury, G.C. Why Should We Care about Group Inequality? Soc. Phil. Policy 1987, 5, 249–271. [Google Scholar] [CrossRef]
  22. Baker, W.E. Market Networks and Corporate Behavior. Am. J. Sociol. 1990, 96, 589–625. [Google Scholar] [CrossRef]
  23. Fukuyama, F. Social Capital and the Global Economy. Foreign Aff. 1995, 74, 89–103. [Google Scholar] [CrossRef]
  24. Putnam, R.D. Bowling Alone: America’s Declining Social Capital. J. Democr. 1995, 6, 65–78. [Google Scholar] [CrossRef] [Green Version]
  25. Putnam, R.D. Bowling Alone: The Collapse and Revival of American Community; Simon & Schuster: New York, NY, USA, 2000; p. 746. [Google Scholar]
  26. Putnam, R.D.; Leonardi, R.; Nanetti, R.Y. Making Democracy Work: Civic Traditions in Modern Italy; Princeton University Press: Princeton, NJ, USA, 1993; p. 247. [Google Scholar]
  27. Fukuyama, F. Trust: The Social Virtues and the Creation of Prosperity; Free Press: New York, NY, USA, 1995; p. 457. [Google Scholar]
  28. Markowska-Przybyla, U.; Ramsey, D.M. Social Capital and Long-Term Regional Development within Poland in the Light of Experimental Economics and Data from a Questionnaire. Sustainability 2018, 10, 3000. [Google Scholar] [CrossRef] [Green Version]
  29. Deth, J.W.V.; Edwards, B.; Badescu, G.; Moldavanova, A.; Woolcock, M. Associations and Social Capital. In The Palgrave Handbook of Volunteering, Civic Participation, and Nonprofit Associations; Smith, D.H., Stebbins, R.A., Grotz, J., Eds.; Palgrave Macmillan UK: London, UK, 2016; Volume 1–2, pp. 178–197. [Google Scholar]
  30. Adler, P.S.; Kwon, S.-W. Social capital: Prospects for a new concept. Acad. Manag. Rev. 2002, 27, 17–40. [Google Scholar] [CrossRef]
  31. Claridge, T. Current Definitions of Social Capital. Academic Definitions in 2019. Available online: https://www.socialcapitalresearch.com/current-definitions-of-social-capital/ (accessed on 5 June 2020).
  32. Robison, L.J.; Schmid, A.A.; Siles, M.E. Is Social Capital Really Capital? Rev. Soc. Econ. 2002, 60, 1–21. [Google Scholar] [CrossRef]
  33. Adkins, L. Social capital: The anatomy of a troubled concept. Femin. Theory 2005, 6, 195–211. [Google Scholar] [CrossRef]
  34. Fine, B. Theories of Social Capital: Researchers Behaving Badly. Political Economy and Development; Pluto Press: London, UK, 2010; p. 271. [Google Scholar]
  35. Bourdieu, P. The forms of capital. In Handbook of Theory and Research for the Sociology of Education; Richardson, J.G., Ed.; Greenwood Press: New York, NY, USA, 1986; pp. 241–258. [Google Scholar]
  36. Field, J. Social Capital, 3rd ed.; Routledge: London, UK, 2016; p. 128. [Google Scholar]
  37. Coleman, J.S. Foundations of Social Theory; The Belknap Press of Harvard University Press: Cambridge, MA, USA, 1990; p. 1014. [Google Scholar]
  38. Koutrou, N.; Pappous, A.; Johnson, A. Post-Event Volunteering Legacy: Did the London 2012 Games Induce a Sustainable Volunteer Engagement? Sustainability 2016, 8, 1221. [Google Scholar] [CrossRef] [Green Version]
  39. Jardim, C.; da Silva, S.M. Young People Engaging in Volunteering: Questioning a Generational Trend in an Individualized Society. Societies 2018, 8, 8. [Google Scholar] [CrossRef] [Green Version]
  40. Jakubowski, R. Metody pomiaru kapitału społecznego jako podstawowego zasobu społeczeństwa obywatelskiego (Methods of measuring social capital as an essential resource of civil society). Rocz. Eur. 2015, 1, 93–106. [Google Scholar]
  41. Hean, S.; Cowley, S.; Forbes, A.; Griffiths, P.; Maben, J. The M-C-M’ cycle and social capital. Soc. Sci. Med. 2003, 56, 1061–1072. [Google Scholar] [CrossRef]
  42. Van Oorschot, W.; Arts, W.; Gelissen, J. Social Capital in Europe: Measurement and Social and Regional Distribution of a Multifaceted Phenomenon. Acta Sociol. 2006, 49, 149–167. [Google Scholar] [CrossRef]
  43. Secco, L.; Burlando, C. Social Capital, Network Governance and SocialInnovation: Towards a New Paradigm. In Social Capital andLocal Development. From Theory to Empirics; Pisani, E.G.F., Secco, L., Christoforou, A., Eds.; Palgrave Macmillan: London, UK, 2017; pp. 83–108. [Google Scholar]
  44. Assari, A.; Maheshand, T.M.; Assari, E. Role of public participation in sustainability of historical city: Usage of TOPSIS method. Indian J. Sci. Technol. 2012, 5, 2289–2294. [Google Scholar] [CrossRef]
  45. Wang, M.; Fang, H.; Bishwajit, G.; Xiang, Y.; Fu, H.; Feng, Z. Evaluation of rural primary health care in western China: A cross-sectional study. Int. J. Environ. Res. Public Health 2015, 12, 13843–13860. [Google Scholar] [CrossRef] [Green Version]
  46. Sarul, L.S.; Eren, Ö. The comparison of MCDM Methods including AHP, TOPSIS and MAUT with an Application on Gender Inequality Index. Eur. J. Interdiscip. Stud. 2016, 2, 183–196. [Google Scholar] [CrossRef] [Green Version]
  47. Auksztol, J. (Ed.) Human Capital in Poland in the Years 2012–2016; Central Statistical Office; Statistical Office in Gdańsk: Gdańsk, Poland, 2017; p. 275.
  48. Bieńkuńska, A.; Sobestjański, K. (Eds.) Territorial Diversity of Quality of life in Poland in 2015; Central Statistical Office; Statistical Office in Łódź: Warszawa, Poland, 2017; p. 195.
  49. Local Data Bank (Bank Danych Lokalnych). Available online: https://bdl.stat.gov.pl/BDL/start (accessed on 3 March 2018).
  50. DS2015. Diagnoza Społeczna 2015. Warunki i Jakość Życia Polaków (Social Diagnosis 2015. Conditions and Quality of Life of Poles); Rada Monitoringu Społecznego: Warszawa, Poland, 2015; p. 545. [Google Scholar]
  51. Moja Polis. Available online: www.mojapolis.pl (accessed on 24 November 2017).
  52. National Election Committee. Available online: https://pkw.gov.pl/ (accessed on 24 November 2017).
  53. Hwang, C.-L.; Yoon, K. Multiple Attribute Decision Making—Methods and Applications A State-of-the-Art Survey; Springer: Berlin/Heidelberg, Germany, 1981; p. 259. [Google Scholar]
  54. Wysocki, F. Metody Taksonomiczne w Rozpoznawaniu Typów Ekonomicznych Rolnictwa i obszarów Wiejskich (Taxonomic Methods for the Economic Classification of Agriculture and Rural Areas); Wydawnictwo Uniwersytetu Przyrodniczego w Poznaniu: Poznań, Poland, 2010; p. 399. [Google Scholar]
  55. Huang, I.B.; Keisler, J.; Linkov, I. Multi-criteria decision analysis in environmental sciences: Ten years of applications and trends. Sci. Total Environ. 2011, 409, 3578–3594. [Google Scholar] [CrossRef] [PubMed]
  56. Tzeng, G.H.; Huang, J.J. Multiple Attribute Decision Making: Methods and Applications; Crc Press-Taylor & Francis Group: Boca Raton, FL, USA, 2011; p. 333. [Google Scholar]
  57. Grootaert, C.; van Bastelar, T. Understanding and Measuring Social Capital: A Synthesis of Findings and Recommendations from the Social Capital Initiative; World Bank: Washington, DC, USA, 2001; p. 45. [Google Scholar]
  58. Narayan, D.; Cassidy, M.F. A Dimensional Approach to Measuring Social Capital: Development and Validation of a Social Capital Inventory. Curr. Sociol. 2001, 49, 59–102. [Google Scholar] [CrossRef]
  59. Będzik, B. Bariery i możliwości generowania kapitału społecznego na obszarach wiejskich w Polsce (Difficulties and possibilities of generating social capital in rural areas in Poland). Acta Sci. Pol. Oecon. 2008, 7, 27–34. [Google Scholar]
  60. Janc, K. Przestrzenne zróżnicowanie kapitału ludzkiego i społecznego na Dolnym Śląsku (Spatial diversity of human and social capital in Lower Silesia). In Endo i Egzogeniczne Determinanty Obszarów Wzrostu i Stagnacji w Województwie Dolnośląskim w Kontekście Dolnośląskiej Strategii Innowacji; Dobrowolska-Kaniewska, H.E.K., Ed.; Dolnośląska Agencja Współpracy Gospodarczej: Wrocław, Poland, 2009; pp. 38–63. [Google Scholar]
  61. Foxton, F.; Jones, R. Social Capital Indicators Review; Office for National Statistics: London, UK, 2011; p. 7.
  62. Sierocińska, K. Kapitał społeczny. Definiowanie, pomiar, typy (Social Capital: Definitions, Measurement, and Types). Stud. Ekon. 2011, 1, 69–86. [Google Scholar]
  63. Siegler, V. Measuring Social Capital; Office for National Statistics: London, UK, 2014; p. 7.
  64. Inglot-Brzęk, E. Diagnoza Kapitału Społecznego (Social Capital Diagnosis); University of Information Technology and Management in Rzeszow: Rzeszow, Poland, 2016; p. 173. [Google Scholar]
  65. Witczak-Roszkowska, D. Kapitał społeczny polskich regionów (Social capital of Polish regions). Prace Naukowe Uniw. Ekon. Wroc. 2016, 686–698. [Google Scholar] [CrossRef] [Green Version]
  66. Józefowski, T.; Młodak, A. Special economic zones in the context of regional development. Europa 2017, 21, 33–47. [Google Scholar] [CrossRef]
  67. Lira, J. A Comparison of the Methods of Relative Taxonomyfor the Assessment of Infrastructural Developmentof Counties in Wielkopolskie Voivodeship. Quant. Methods Econ. 2015, 16, 53–62. [Google Scholar]
  68. Gliński, P.; Palska, H. Cztery wymiary społecznej aktywności obywatelskiej (Four dimensions of social civic participation). In Elementy Nowego Ładu; Domański, H., Rychard, A., Eds.; Wydawnictwo IFiS PAN: Warszawa, Poland, 1997; pp. 356–392. [Google Scholar]
  69. Grootaert, C. Quantitative Analysis of Social Capital Data. In Understanding and Measuring Social Capital: A Multidisciplinary Tool for Practitioners; Grootaert, C., van Bastelaer, T., Eds.; World Bank: Washington, DC, USA, 2002; pp. 41–84. [Google Scholar]
  70. Kowalski, M. Geografia Wyborcza Polski—Przestrzenne Zróżnicowanie Zachowań Wyborczych Polaków w Latach 1989–1998 (The Elekctoral Geography of Poland—Spatial Differences in Electoral Behaviour 1989–1998); IGiPZ PAN: Warszawa, Poland, 2000; Volume 7, p. 137. [Google Scholar]
  71. Barańska, M. Wolontariat w Planowaniu Kariery Zawodowej Studentów (Volunteering in Student Career Planning); Wydawnictwo Naukowe UAM: Poznań, Poland, 2016. [Google Scholar]
  72. Pawlus, T. Podstawy prawne i etyczne wolontariatu (Legal and ethical basis of volunteering). Warmińsko-Mazurski Kwart. Nauk. Nauk. Społeczne 2012, 2, 59–74. [Google Scholar]
  73. Grenier, P.; Wright, K. Social capital in Britain: An update and critique of Hall’s analysis. In International Working Paper Series; Centre for Civil Society, London School of Economics and Political Science: London, UK, 2003; p. 29. [Google Scholar]
  74. SRPC. Strategia rozwoju Polski Centralnej do roku 2020 z perspektywą 2030 (Development Strategy of Central Poland until 2020 with a 2030 perspective); Rada Ministrów: Warszawa, Poland, 2015; p. 68. [Google Scholar]
  75. Sztompka, P. Zaufanie. Fundament Społeczeństwa (Trust. The Foundation of Society); Znak: Kraków, Poland, 2007; p. 424. [Google Scholar]
  76. SRKS. Strategia Rozwoju Kapitału Społecznego 2020 (Social Capital Development Strategy 2020); Rada Ministrów: Warszawa, Poland, 2013; p. 90. [Google Scholar]
  77. Lederman, D.; Loayza, N.; Menendez, A.M. Violent crime: Does social capital matter? Econ. Dev. Cult. Change 2002, 50, 509–539. [Google Scholar] [CrossRef] [Green Version]
  78. Mehlum, H.; Moene, K.; Torvik, R. Crime induced poverty traps. J. Dev. Econ. 2005, 77, 325–340. [Google Scholar] [CrossRef] [Green Version]
  79. Zhong, L. Communities, Crime and Social Capital in Contemporary China; Willan: Milton, UK, 2013. [Google Scholar]
  80. SRSGPW. Strategia Rozwoju Społeczno-Gospodarczego Polski Wschodniej do Roku 2020 (Strategy of Social and Economic Development of Eastern Poland Until 2020); Rada Ministrów: Warszawa, Poland, 2013.
  81. Ministry of Regional Development, Development of Eastern Poland Operational Program 2007–2013; Ministry of Regional Development: Warszawa, Poland, 2012; p. 120.
  82. Ministry of Infrastructure and Development. Eastern Poland Operational Program 2014–2020; Ministry of Infrastructure and Development: Warszawa, Poland, 2018; p. 91.
  83. Bartkowski, J. Tradycja i Polityka: Wpływ Tradycji Kulturowych Polskich Regionów na Współczesne Zachowania Społeczne i Polityczne (Tradition and Politics: The Influence of Cultural Traditions of Polish Regions on Contemporary Social and Political Behaviour); Zak: Warszawa, Poland, 2003. [Google Scholar]
  84. Bednarek-Szczepańska, M. Zróżnicowanie przestrzenne kapitału społecznego w Polsce—Ujęcie przeglądowe (Spatial differentiation of social capital in Poland—A review). Prz. Geogr. 2013, 85, 573–597. [Google Scholar] [CrossRef]
  85. Nizio, S. Geografia organizacji pożytku publicznego w Polsce (The geography of public benefit organizations in Poland). Prz. Geogr. 2012, 84, 237–260. [Google Scholar] [CrossRef]
  86. Cialdini, R.B.; Trost, M.R. Social influence: Social norms, conformity and compliance. In The Handbook of Social Psychology; Gilbert, D.T., Fiske, S.T., Lindzey, G., Eds.; McGraw-Hill: New York, NY, USA, 1998. [Google Scholar]
  87. Hechter, M.; Opp, K.-D. Social Norms; Russell Sage Foundation: New York, NY, USA, 2001. [Google Scholar]
  88. Biel, A.; Thøgersen, J. Activation of social norms in social dilemmas: A review of the evidence and reflections on the implications for environmental behaviour. J. Econ. Psychol. 2007, 28, 93–112. [Google Scholar] [CrossRef]
  89. Lubas, K. Normy społeczne jako niezbędnik życia każdego człowieka. Analiza problemu na przykładzie norm moralnych (Social Norms as a Necessity of Every Person’s Life: Analysis of the Problem on the Example of Moral Norms). RynekSpołecz. Kult. 2017, 2, 47–50. [Google Scholar]
  90. Bogocz, D. Problem wykluczenia społecznego w świetle rozmytych metod taksonomicznych (The problem of social exclusion in the light of fuzzy taxonomic methods). Tarnow. Colloq. Nauk. 2018, 149–159. [Google Scholar]
  91. Bal, I. Marginalizacja i wykluczenie społeczne jako bariera rozwoju regionalnego (The marginalization and the social exclusion of people as a reason for stopping regional development). Nierówn. Społecz. Wzrost Gospod. 2012, 28, 252–262. [Google Scholar]
  92. Bourdieu, P.; Wacquant, L.J.D. An Invitation to Reflexive Sociology; University of Chicago Press: Chicago, IL, USA, 1992; p. 332. [Google Scholar]
  93. Pennar, K.; Mueller, T. The ties that lead to prosperity. Bus. Week 1997, 15, 153–154. [Google Scholar]
  94. Theiss, M. Krewni, Znajomi, Obywatele. Kapitał Społeczny a Lokalna Polityka Społeczna (Relatives, Friends, Citizens. Social Capital versus Local Social Policy); Wydawnictwo Adam Marszałek: Toruń, Poland, 2007; p. 275. [Google Scholar]
  95. Działek, J. Kapitał Społeczny Jako Czynnik Rozwoju Gospodarczego w Skali Regionalnej i Lokalnej w Polsce (Social Capital as a Factor of Regional and Local Economic Development in Poland); Wydawnictwo Uniwersytetu Jagiellońskiego: Kraków, Poland, 2011; p. 180. [Google Scholar]
  96. Markowska-Przybyła, U. Kapitał społeczny a wzrost i rozwój gospodarczy—wybrane aspekty teoretyczne (Social Capital Versus Economic Growth—Selected Theoretical Aspects). Prace Nauk. Uniw. Ekon. Wroc. 2014, 108–120. [Google Scholar] [CrossRef]
  97. Fukuyama, F. Social Capital. In Culture Matters: How Values Shape Human Progress; Harrison, L.E., Huntington, S.P., Eds.; Basic Books: New York, NY, USA, 2000; pp. 98–111. [Google Scholar]
  98. Coleman, J.S. Foundations of Social Theory; The Belknap Press of Harvard University Press: Cambridge, MA, USA, 1994; p. 993. [Google Scholar]
  99. Inglehart, R. Modernization and Postmodernization Cultural, Economic, and Political Change in 43 Societies; Princeton University Press: Princeton, NJ, USA, 1997; p. 464. [Google Scholar]
  100. Bowles, S.; Gintis, H. Social Capital and Community Governance. Econ. J. 2002, 112, F419–F436. [Google Scholar] [CrossRef]
  101. Borozan, D.; Funaric, M.R. Social capital in Croatia: Measurement and regional distribution. Innov. Eur. J. Soc. Sci. Res. 2016, 29, 481–505. [Google Scholar] [CrossRef]
  102. Bartkowski, J. Kapitał społeczny i jego oddziaływanie na rozwój w ujęciu socjologicznym (Social capital and its influence on the development in the sociological consideration). In Kapitał Ludzki i Kapitał Społeczny a Rozwój Regionalny; Herbst, M., Ed.; Wydawnictwo Naukowe Scholar: Warszawa, Poland, 2007; pp. 54–97. [Google Scholar]
  103. Collier, P. Social Capital and Poverty; The World Bank, Social Development Department: Washington, DC, USA, 1998; p. 28. [Google Scholar]
  104. Raczkowska, M. Definiowanie kapitału społecznego i jego pomiar (Definition of social capital and its measurement). Społecz. Ekon. 2014, 135–146. [Google Scholar] [CrossRef]
  105. Kotarski, H. Kapitał społeczny—Endogenny zasób mieszkańców województwa podkarpackiego (Social capital—Endogenic resources of inhabitants of Podkarpackie voivodeship). Nierówn. Społecz. Wzrost Gospod. 2012, 28, 244–251. [Google Scholar]
  106. Janc, K. Human and social capital in Poland—spatial diversity and relations. Core and peripheral regions in Central and EasternEurope. Eur. XXI 2006, 14, 39–55. [Google Scholar]
  107. Działek, J. Social capital and economic growth in Polish regions. In Proceedings of the Civil Society, Social Capital and Economic Development, Stockholm, Sweden, 3–4 September 2009; pp. 1–25. [Google Scholar]
Figure 1. Measures of social capital. Source: own elaboration.
Sustainability 12 05583 g001
Figure 2. Spatial distribution of civic engagement in political and social life. Source: own elaboration.
Sustainability 12 05583 g002
Figure 3. Spatial distribution of the degree of selfless behavior. Source: own elaboration.
Sustainability 12 05583 g003
Figure 4. Spatial distribution of the sense of security and social confidence. Source: own elaboration.
Sustainability 12 05583 g004
Figure 5. Spatial distribution of the formation of social structures. Source: own elaboration.
Sustainability 12 05583 g005
Figure 6. Spatial distribution of the observance of norms and attitudes that foster desirable social interactions. Source: own elaboration.
Sustainability 12 05583 g006
Table 1. List of social capital variables (indicators) for every analyzed measure.
No.ItemType of Variable (Indicator)SourceYear
Civic engagement in political and social life
(Measure 1)
1General elections (voter turnout)—(x1)s[52]2015
2Local elections (voter turnout)—(x2)s[52]2014
3Participation in various events per 100 population (events organized by community centers and clubs; mass events)—(x3)s[49]2016
4Percentage of municipalities with a village fund in the total number of eligible municipalities—(x4)s[49]2016
5Percentage of citizens aged 16 years and older who are involved in community work (municipalities, districts) —(x5)s[47]2015
Degree of selfless behavior
(Measure 2)
1Number of blood donors per 10,000 population—(x1)s[49]2016
2Number of volunteers in welfare and educational institutions per 100,000 population—(x2)s[49]2016
3Number of charitable organizations entitled to receive 1% of income tax from individuals per 100,000 population—(x3)s[51]2015
4Total donations in virtue of 1% of income tax from individuals in a given area per 100 population—(x4)s[51]2015
Sense of security and social confidence
(Measure 3)
1Confidence in police (percentage of citizens aged 16 years and older)—(x1)s[47]2015
2Confidence in local authorities (percentage of citizens aged 16 years and older)—(x2) s[48]2015
3Trust in neighbors (percentage of citizens aged 16 years and older)—(x3)s[48]2015
4Crime rate per 1000 population—(x4)d[49]2016
5Sense of security in the place of residence (percentage of citizens aged 16 years and older)—(x5)s[48]2015
Formation of social structures
(Measure 4)
1Social isolation index (percentage of citizens aged 16 years and older)—(x1)d[48]2015
2Membership in sports clubs per 10,000 population—(x2)s[49]2016
3Membership in artistic organizations per 10,000 population—(x3)s[49]2016
4Membership in hobby clubs per 10,000 population—(x4)s[49]2016
5Foundations, associations, and social organizations per 10,000 population—(x5)s[49]2016
Observance of norms and attitudes that foster desirable social interactions
(Measure 5)
1Percentage of citizens aged 16 years and older who are sensitive to offenses against the public good—(x1)s[50]2015
2Unconditional disapproval of tax evasion (percentage of citizens aged 16 years and older)—(x2)s[48]2015
3Unconditional disapproval of welfare fraud (percentage of citizens aged 16 years and older)—(x3)s[48]2015
4Unconditional disapproval of bribery (percentage of citizens aged 16 years and older)—(x4)s[48]2015
5Unconditional disapproval of illegal employment (percentage of citizens aged 16 years and older)—(x5)s[48]2015
6Unconditional disapproval of fare evasion in public transport (percentage of citizens aged 16 years and older)—(x6)s[48]2015
7Indicator of good neighborly relations (percentage of citizens aged 16 years and older)—(x7)s[48]2015
Key: s—stimulant, d—destimulant. Source: own elaboration.
Table 2. Composite indicator of civic engagement in political and social life.
No.Voivodeshipx1x2x3x4x5Si
1Lower Silesia49.4244.74280.6582.8419.860.728
2Kujawy and Pomerania46.3644.96221.6474.0212.50.403
3Lublin49.0149.88230.2069.7417.050.548
4Lubuskie44.6346.91275.6175.6819.150.670
5Łódź51.6248.12161.3152.2011.990.246
6Małopolska54.9048.65350.2564.2815.680.668
7Mazovia58.7051.20203.6163.0814.290.441
8Opole43.1242.69187.2280.8821.660.576
9Podkarpacie50.4350.87265.8178.4717.020.648
10Podlasie47.1048.18289.5545.7910.030.356
11Pomerania51.8745.88278.5667.0015.160.560
12Silesia52.2543.38253.0764.2317.370.566
13Świętokrzyskie46.8153.38215.1454.6414.670.396
14Warmia and Mazury42.3247.02256.7766.007.910.318
15Wielkopolska50.1647.20242.6575.4815.380.541
16Western Pomerania45.8744.15263.3459.2214.350.450
Polish average49.0447.33248.4667.1015.25-
Key: Si—composite indicator. Source: own elaboration.
Table 3. Composite indicator of the degree of selfless behavior.
No.Voivodeshipx1x2x3x4Si
1Lower Silesia172.7015.1928.201552.790.307
2Kujawy and Pomerania165.0922.8913.57464.040.118
3Lublin117.4325.9217.48488.870.130
4Lubuskie153.9428.3125.05487.450.196
5Łódź148.8716.3816.76704.080.099
6Małopolska137.1021.4919.181189.320.192
7Mazovia128.2621.1723.295170.880.720
8Opole139.8324.5730.92564.770.214
9Podkarpacie134.8920.4923.31383.920.128
10Podlasie297.6236.2420.19475.630.315
11Pomerania172.4223.4125.61878.200.212
12Silesia148.1630.8619.36981.750.224
13Świętokrzyskie148.4116.3613.12316.450.052
14Warmia and Mazury152.6619.8421.12399.030.117
15Wielkopolska194.1419.4416.691442.140.251
16Western Pomerania147.5126.2915.20494.420.136
Polish average159.9423.0520.57999.61-
Key: Si—composite indicator. Source: own elaboration.
Table 4. Composite indicator of the sense of security and social confidence.
No.Voivodeshipx1x2x3x4x5Si
1Lower Silesia63.1150.0071.0025.7384.000.185
2Kujawy and Pomerania72.0650.0070.0017.8289.000.554
3Lublin73.4148.0073.0014.6289.000.711
4Lubuskie67.6652.0064.0022.3889.000.316
5Łódź71.1343.0068.0018.5085.000.456
6Małopolska70.6852.0076.0021.5089.000.405
7Mazovia69.5845.0073.0020.2080.000.384
8Opole59.8846.0075.0020.0183.000.378
9Podkarpacie69.8456.0078.0011.0293.000.943
10Podlasie68.5849.0077.0014.3688.000.729
11Pomerania71.1654.0072.0019.9387.000.473
12Silesia66.6249.0072.0023.1885.000.263
13Świętokrzyskie67.2648.0072.0015.1291.000.669
14Warmia and Mazury70.4753.0077.0018.7690.000.544
15Wielkopolska69.6954.0073.0017.7491.000.590
16Western Pomerania73.2446.0078.0021.0084.000.398
Polish average69.0249.6973.0618.8787.31-
Key: Si—composite indicator. Source: own elaboration.
Table 5. Composite indicator of the formation of social structures.
No.Voivodeshipx1x2x3x4x5Si
1Lower Silesia7.00280.0558.57160.5240.360.494
2Kujawy and Pomerania10.00267.0754.72121.9032.400.315
3Lublin5.00228.0394.30135.8536.900.610
4Lubuskie10.00285.0867.37151.2837.660.416
5Łódź11.00261.1771.97140.7334.540.352
6Małopolska8.00312.31106.59152.3336.500.663
7Mazovia10.00250.1049.24125.5345.670.359
8Opole9.00351.9293.06161.8135.220.591
9Podkarpacie5.00334.73139.01145.8335.750.846
10Podlasie5.00255.7987.82122.0434.220.584
11Pomerania8.00222.9155.34105.5536.830.370
12Silesia8.00266.6077.18137.4127.480.455
13Świętokrzyskie10.00172.6371.59111.7234.380.303
14Warmia and Mazury10.00235.4878.96141.1539.470.417
15Wielkopolska7.00251.2775.93137.5238.010.511
16Western Pomerania14.00278.6267.96126.3938.440.287
Polish average8.56265.8678.10136.1036.49-
Key: Si—composite indicator. Source: own elaboration.
Table 6. Composite indicator of the observance of norms and attitudes that foster desirable social interactions.
No.Voivodeshipx1x2x3x4x5x6x7Si
1Lower Silesia57.4059.0078.0077.0040.0055.0055.000.513
2Kujawy and Pomerania52.3056.0080.0086.0047.0057.0051.000.570
3Lublin53.7053.0081.0080.0038.0059.0063.000.516
4Lubuskie55.9051.0082.0085.0048.0056.0050.000.573
5Łódź42.6046.0075.0083.0040.0048.0060.000.362
6Małopolska57.7059.0080.0081.0040.0057.0065.000.584
7Mazovia53.7044.0074.0077.0042.0041.0056.000.380
8Opole56.5058.0086.0086.0060.0061.0057.000.791
9Podkarpacie48.6053.0075.0082.0043.0061.0071.000.584
10Podlasie61.2045.0077.0080.0029.0047.0059.000.369
11Pomerania51.4052.0080.0077.0042.0057.0060.000.517
12Silesia56.9053.0081.0082.0049.0055.0057.000.636
13Świętokrzyskie50.7048.0068.0069.0032.0047.0061.000.288
14Warmia and Mazury40.0053.0072.0079.0048.0052.0060.000.488
15Wielkopolska42.3058.0077.0080.0048.0059.0058.000.557
16Western Pomerania53.2047.0079.0085.0040.0046.0048.000.380
Polish average52.1352.1977.8180.5642.8853.6358.19-
Key: Si—composite indicator. Source: own elaboration.
Table 7. Analysis of correlations between measures of social capital based on Pearson’s correlation coefficient.
Measures of Social CapitalMeasure 1Measure 2Measure 3Measure 4Measure 5
Measure 11.0000
Measure 20.09911.0000
Measure 3−0.2594−0.30521.0000
Measure 40.5154 *−0.03670.44081.0000
Measure 50.6069 *−0.0937−0.20960.48581.0000
* Key: the indicated correlation coefficients are significant at p < 0.05. Source: own elaboration.
Table 8. Variations in the analyzed measures of social capital in Poland.
VoivodeshipMeasure 1Measure 2Measure 3Measure 4Measure 5
Class
Lower SilesiaClass IClass IClass IIIClass IIClass II
Kujawy and PomeraniaClass IIIClass IIIClass IIClass IIIClass II
LublinClass IIClass IIIClass IClass IClass II
LubuskieClass IClass IIClass IIIClass IIClass I
ŁódźClass IIIClass IIIClass IIClass IIIClass III
MałopolskaClass IClass IIClass IIClass IClass I
MazoviaClass IIClass IClass IIIClass IIIClass III
OpoleClass IIClass IIClass IIIClass IClass I
PodkarpacieClass IClass IIIClass IClass IClass I
Source: own elaboration.

