Article

The Effect on Air Quality of Lockdown Directives to Prevent the Spread of SARS-CoV-2 Pandemic in Campania Region—Italy: Indications for a Sustainable Development

Chemical, Materials and Production Engineering Department—University of Naples “Federico II”, 80125 Naples, Italy
*
Author to whom correspondence should be addressed.
Sustainability 2020, 12(14), 5558; https://doi.org/10.3390/su12145558
Submission received: 8 June 2020 / Revised: 2 July 2020 / Accepted: 7 July 2020 / Published: 10 July 2020
(This article belongs to the Section Health, Well-Being and Sustainability)

Abstract

:
Data on air quality collected by the regional network of fixed stations in the most urbanized areas of the Campania region in the south of Italy are examined. Two periods are considered: before and during the adoption of the main directives limiting human activities to fight the spread of SARS-CoV-2 infection. The first period is from the 5th of February to the 5th of March, and the second is from the 13th of March to the 13th of April. Meteorological conditions in the two periods were compared and significant differences were not observed. Therefore, the comparison of air quality data is feasible. During the second period, an intercontinental transport of particulate matter occurred. Data collected during this event (4 p.m. on the 30th of March to 4 p.m. on the 31st of March) were excluded from the analysis. The main reduction of pollutant concentration is observed for NO2 (−48% of the period average). PM10 shows a lower reduction (−17%). The PM2.5 average period concentration was quite constant, while the 98° percentile was reduced by −21%. Ozone shows, on the contrary, an increase in concentration due mainly to an increase in solar irradiation during the 2nd period, but also due to the decrease of NOx concentration. The reduction or the increase of pollutant concentration depends on the category of the station: background, industrial, residential, and traffic. In addition to air quality, the reduction of anthropogenic emissions is also studied. All the information available on the reduction of emissions from transport, industry, heating, and other main emissive sectors were collected. The results give useful insights for the development of air quality management policies that could be adopted when the sanitary emergency will end to guarantee the sustainable development of the Campania region.

Graphical Abstract

1. Introduction

The diffusion of the SARS-CoV-2 pandemic started in Wuhan (China) in December 2019 and has dramatically impacted all the countries in the world. At the end of April 2020, the number of estimated deaths is about 200,000 and more than 1 million have been infected all over the world. These data will be still higher in the next months. Governments in most of the countries have adopted directives to reduce the spread of the pandemic, minimizing the possibilities of contacts among people. In many cases, a lockdown was decided. The consequences on all human activities were tremendous, with deep effects on the economy and social life and a strong reduction of commercial and industrial activities and the mobility of all the citizens. Consequently, all anthropogenic emissions of pollutants in the environment were hugely reduced. The effect on air quality was evident immediately starting from China and then in Europe and the USA following the progress of the pandemic. The first evidence comes from satellite observations in China [1] showing how, in the Wuhan region, concentrations of airborne pollutants were significantly reduced after the lockdown of about 10 million of residents. Similar observations were then reported for the north of Italy, where lockdown directives were applied for the first time in Europe and thereafter in other European countries [www.snpambiente.it].
From the point of view of research on air pollution, the lockdown directives can be considered as a planetary test of how the reduction of anthropogenic emissions could ameliorate air quality. Several reports have been published to show the betterment of air quality as a consequence of the application of lockdown directives all over the world. Satellite observations and data from public on-land monitoring networks have been analyzed and reported. They represent a huge data set that will without doubt be deeply studied by environmental scholars.
Isaifan [2] reports satellite data of Wuhan area using modified Copernicus Sentinel 5P data processed by the European Space Agency. Satellite observations in European countries are reported by ESA (www.esa.int). NO2 concentrations during the lockdown in Madrid, Milan and Rome were reduced by about 45% and by 54% in Paris.
Some papers and reports have also been published using data coming from on-land monitoring stations. Generally, a large reduction of NO2 is observed: −53% New Dheli [3]; −47% and −51% in Barcelona in the urban background and traffic sites, respectively [4], and between −57% and −61% in Wuhan, Jingmen, and Enshi cities in the Hubei Province of central China [5].
The reduction of p.m. is less evident: −28% in traffic stations and −31% in urban background sites for PM10 in Barcelona, and between −15.8 and −30.1% for PM2.5 and −22.5% and 40.5% in Wuhan, Jingmen, and Enshi. However, in New Dheli, the reductions of PM10 and PM2.5 are −52% and −53%, respectively.
On contrary, ozone increased only by 0.78% in New Dheli; by +29% and +33% as the daily average and 8-h average daily maximum in the urban background; and by +58%, and +57% in traffic sites in Barcelona. In Wuhan, Jingmen, and Enshi, the increase of O3 was between +11.6% and +14.3%.
In Italy, several environmental regional agencies have published reports with a statistical analysis of data collected during lockdown compared with previous periods. NO2 was reduced by −30% to −60% when compared with the previous months (January-February) in Tuscany; in the Lazio region, the reduction is between −20% and −70% compared to the data measured in March 2020 with the averages of the month of March in the last four years; in Campania, the average hourly concentrations of nitrogen monoxide were reduced by −60%. The reduction of PM10 was about −13% in Tuscany. In Milan and hinterland, reductions observed are in the range of −45.4% and −48.3% for PM10, −47.1 and −70% for PM2.5, −57.1 and −61.4% for NO2, and an increase between 157.4% and 252.3% of O3 was observed [6].
This very valuable dataset of monitoring data is of relatively low usefulness if it is not correlated with a reduction of anthropogenic emissions. Unfortunately, these data are more difficult to obtain. Due to the lockdown, it was not possible to conduct specific monitoring campaigns to assess the actual volume of the main anthropic activities. However, information can still be derived from many sources. In Italy, data on traffic flow on main highways, motorways, or freeways are available from ANAS (https://www.stradeanas.it/it). For ship traffic in ports and flight traffic in airports, data are published by the respective authorities. National organisms like ENEA, ENEL, and ISPRA publish data on the reduction of industrial activities and fuel consumption. Emissions from agriculture and animal husbandry activities experienced a minor decrement.
While the emissions of most of the anthropogenic activities were reduced, some emissions could be increased during the lockdown period. Among them are emissions of PM10 from domestic cooking and heating and emissions of COV from sanitary products. The contribution of these sources to air pollution may sometimes be quite important or at least not negligible.
Even in those sectors where a whole reduction of emissions is evident, some aspects would be deeply analyzed. As an example, the vehicular traffic flow is dramatically reduced. However, it is also true that, in urban areas, the average speed is enhanced, and consequently so are non-exhaust emissions. The composition of the circulating fleet is also changed. The traffic of public transport vehicles, commercial vehicles, ambulances, and vehicles of police did not observe the same reduction as private vehicles; on the contrary, it is logical to anticipate that their mobility is increased. Therefore, average emission factors often adopted in the evaluation of primary emissions from vehicles would be opportunely updated. The same is true in the case of uses of procedures like COPERT [7,8].
Therefore, a strong effort in the accurate assessment of anthropogenic emissions during lockdown periods is requested from the scientific community to avoid erroneous conclusions.
In this paper, we have studied the effect of lockdown directives on air quality in the districts of Naples and Caserta in the Campania region in the south of Italy. Data of monitoring stations of the regional air quality network managed by the regional agency ARPAC have been collected and examined. We compared data from the 5th of February to the 5th of March before the beginning of the main limitations on personal mobility with data from the 13th of March to the 13th of April during the adoption of lockdown restrictions. The area considered is the most urbanized and industrialized of the Campania region. We have also collected information on meteorological conditions and anthropogenic emissions in the two periods.
The aim is a quantitative assessment of the reduction of airborne pollutants and the corresponding reduction of anthropogenic emissions. These data can be used in the development of policies of air quality management for the sustainable development of the Campania region.

2. Methods

Campania region in the south of Italy is extended for 13,671 km2 with about 5.8 million residents. The districts of Naples and Caserta are the most urbanized, with about 4 million of residents, and are the most industrialized too.
In Campania, the air quality is monitored by the Environmental Regional Agency (ARPAC). In Figure 1, a map of the location of air quality stations in the districts of Naples and Caserta is reported. Data on the monitoring stations are reported in Table 1, including: (i) acronyms used in this paper; (ii) the official name of the station; (iii) coordinates expressed in Universal Transverse Mercator projection system (UTM) and iv) monitoring efficiency before and during lockdown. All stations are lumped into four categories: Background, Industrial, Residential, and Traffic. No rural stations are present. The last letter in the acronym (Table 1) indicates to which category the station belongs to.
Background stations (5 stations) are located in urban areas but are far from specific sources (traffic, heating); Industrial stations (3 stations) are sited in industrial areas; Residential stations (4 stations) are located in urbanized are but are not near to high traffic roads; Traffic stations (10 stations) are sited in high-traffic roads.
The main directives to limit the spread of SARS-CoV-2 infections in Italy and in Campania region are:
  • 5th of March—All educational activities of schools and universities throughout the country are suspended and all events involving gatherings of people are prohibited.
  • 8th of March—Lockdown of some districts in the north of Italy and limitations to many activities across the nation (DPCM 8 March 2020).
  • 10th of March—The lockdown is extended to the whole national territory.
  • 12th of March—The Campania region provides for a reduction of up to 50% of the rides of local public transport companies.
  • 1st of April—All government anti-pandemic measures, previously in effect until 3 April, are extended until the 13th of April.
On the basis of the above calendar of directives, we defined two periods to be investigated. The first is from the 5th of February to the 5th of March before the first important directive of the lockdown: the closure of schools established with DPCM on the 4th of March 2020. It is well known that this measure determines in Naples and Caserta a strong reduction in vehicular traffic, especially in correspondence with the beginning and end of lessons. The second from the 13th of March to the 13th of April after that lockdown was established across the country. In the following, these periods will be referred as “before lockdown” and “during lockdown” or “1st period” and “2nd period”.
A database was created with hourly average validated data of NO2, O3, PM10, and PM2.5 for all the monitoring stations present in the districts of Naples and Caserta. Meteorological data were downloaded from Weather Underground (https://www.wunderground.com/). Data on solar irradiance were measured in Nola using a monitoring station developed in the research project CAMSOL-ARIA POR CAMPANIA FESR 2014–2020 (Figure 1).
Data on the trend of anthropogenic emissions were obtained by different sources reported in the following.

3. Results

3.1. Definition of the dataset

To define exactly the dataset to be used, the efficiency of monitoring stations was preliminarily verified. The monitoring efficiency was evaluated for the 1st and 2nd periods per each station and each pollutant as:
ME   % = numbers   of   hours   validated total   numbers   of   hours
Table 1 shows the efficiency for all analyzers in all the stations before and during lockdown separated by a slash. A quality criterion was established to consider only the analyzers having an efficiency higher than 70% in both periods.
As reported in a technical report prepared by the environmental regional agency ARPAC [http://cemec.arpacampania.it/meteoambientecampania/php/eventi/20200330/evento_sahariano_30_marzo_2020.pdf] during the 30th–31st of March, a significant transport of particulate matter from Caspian Sea region occurred, increasing significantly the concentrations of PM10 and PM2.5 in the studied area.
We use these preliminary considerations to define exactly the dataset. Data from analyzers with less than 70% of efficiency in at least one of the two periods (see Table 1) were excluded together with data from 4 p.m. on the 30th of March to 4 p.m. on the 31th of March for all pollutants and all stations. As a conclusion, the receptor points considered per pollutant are: 20 for NO2 (4B, 3I, 4R, 9T); 11 for O3 (4B, I1, 4R, 2T); 16 for PM10 (3B, 2I, 2R, 9T) and 13 for PM2.5 (2B, 2I, 2R, 7T).

3.2. Meteorological Conditions

Meteorological conditions play a relevant role in determining the dispersion or the accumulation of pollutants in the atmosphere. In Figure 2 box and whisker diagrams of the main meteorological parameters are reported. Rose wind graphs are reported in Figure 3. All these data were measured in the meteorological stations of Capodichino (Figure 1) apart from solar irradiance, and precipitation from the monitoring site in Nola (Figure 1).
The main observations about the meteorological conditions in the two periods are: (i) wind velocity is very similar (average 3.04 ± 2.12 m/s in the 1st period and 2.82 ± 1.92 m/s in the second period). Wind speed is a key parameter in determining the dilution of emissions in the atmosphere, therefore its constancy is very important; (ii) pressure and humidity are similar but lower in the second period; (iii) temperature and solar irradiation were higher in the second period. The difference observed for solar radiation may be relevant for secondary pollutants (ozone) and is considered; (iv) differences are present in the wind direction (Figure 3). During the first period, the wind was blowing predominantly from west (W) and southwest (SW), whereas in the second period the wind direction was blowing predominantly from east-northeast (ENE) and south-southwest (SSE). Results correspond to the typical wind pattern of the breeze regime: south-southwest (SSW) and north-northeast (NNE). In both the two periods, precipitation levels are similar and limited: in the first period it is 19 mm, while in the second it is 18 mm.
As reported, meteorological parameters observed in the two periods are similar. Therefore, it is appropriate to compare the concentration levels observed in the two periods.

3.3. Pollutant Concentrations

The average pollutant concentration and 98° percentile were evaluated for the 1st and 2nd periods per each station and each pollutant. Then difference and the percentage of difference of concentration between the 2nd and 1st periods were calculated as:
Δ C i , s = C i , s d C i , s b
Δ C i , s % = C i , s d C i , s b C i , s b · 100
where: C i , s b and C i , s d are, respectively, the average period concentration or 98° percentile of pollutant i at station s “before” (from 5 February to 5 March) and “during” (from 13 March to 13 April) the lockdown, while Δ C i , s and Δ C i , s % are the difference and the percentage of difference of pollutant i at station s. A negative value of Δ C i , s or Δ C i , s % corresponds to a reduction of concentration, while a positive value corresponds to an increase of concentration.
Results are then reported and discussed for each pollutant.

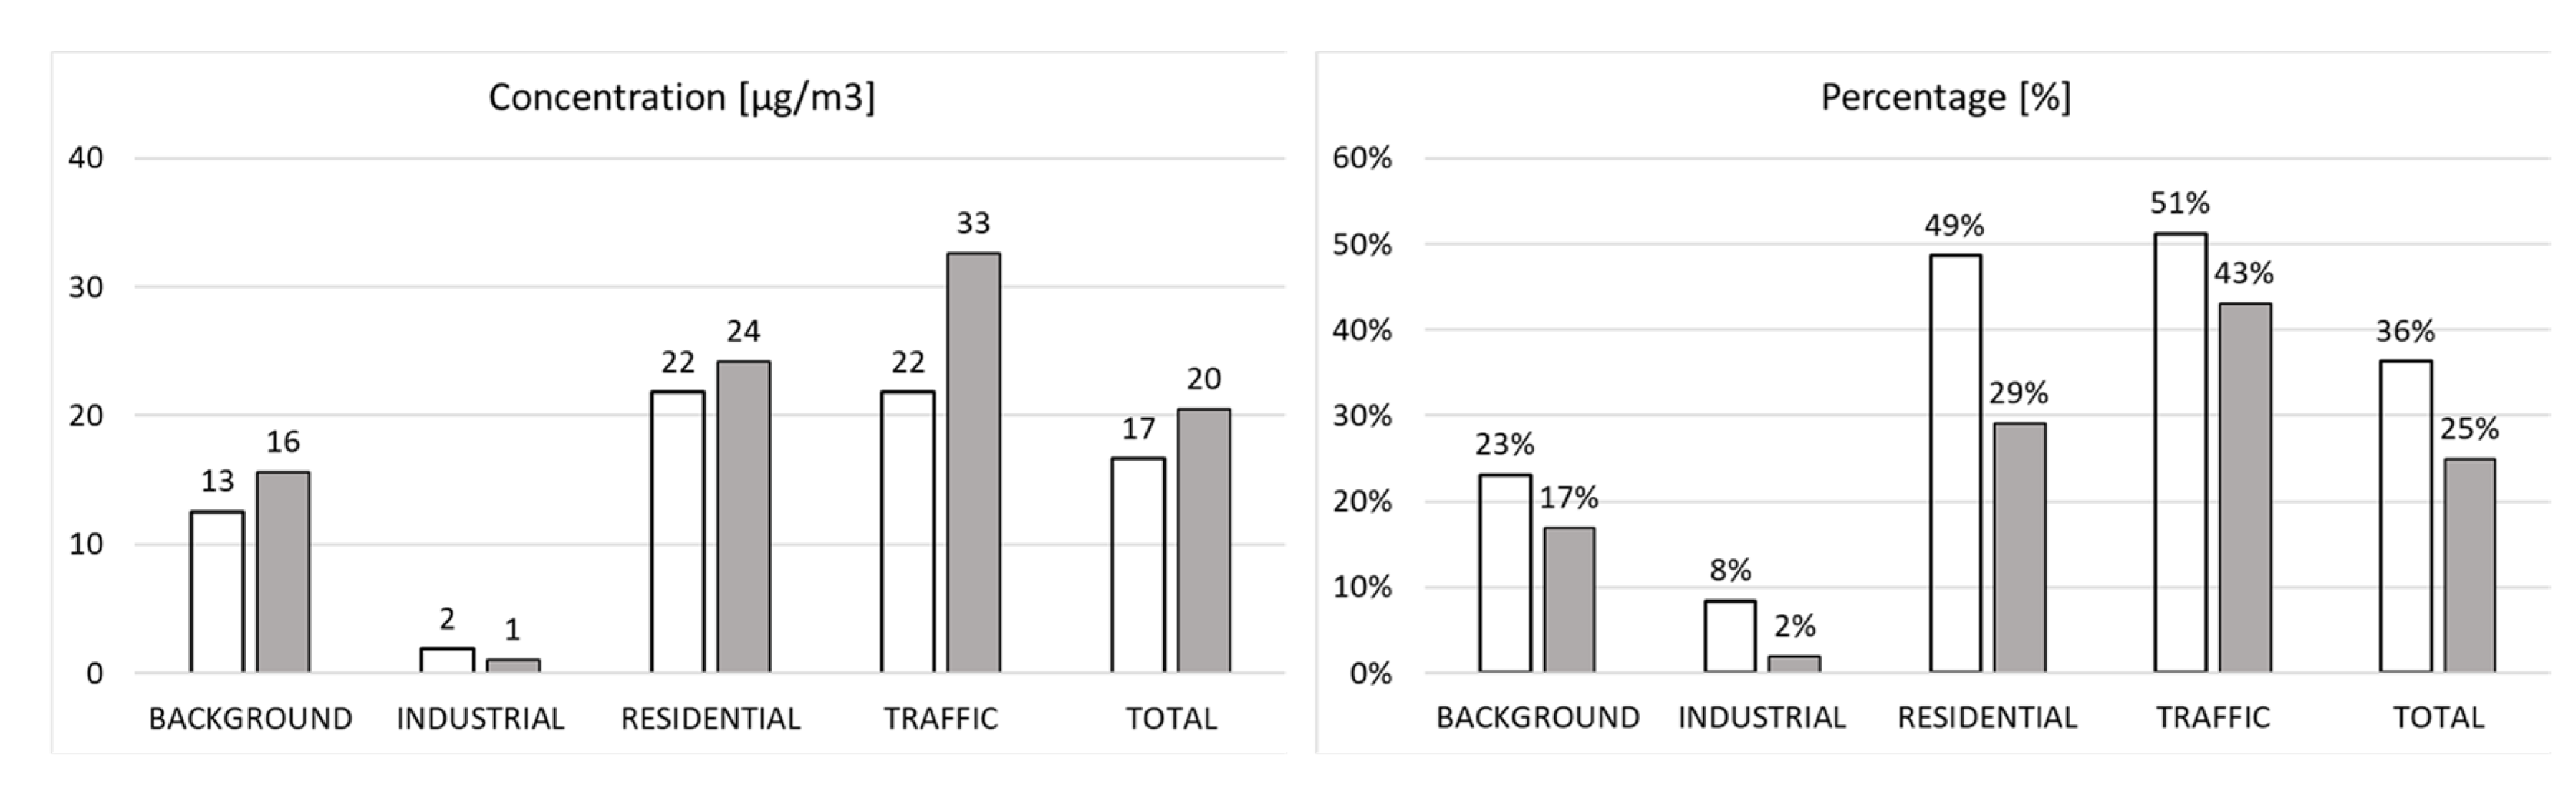
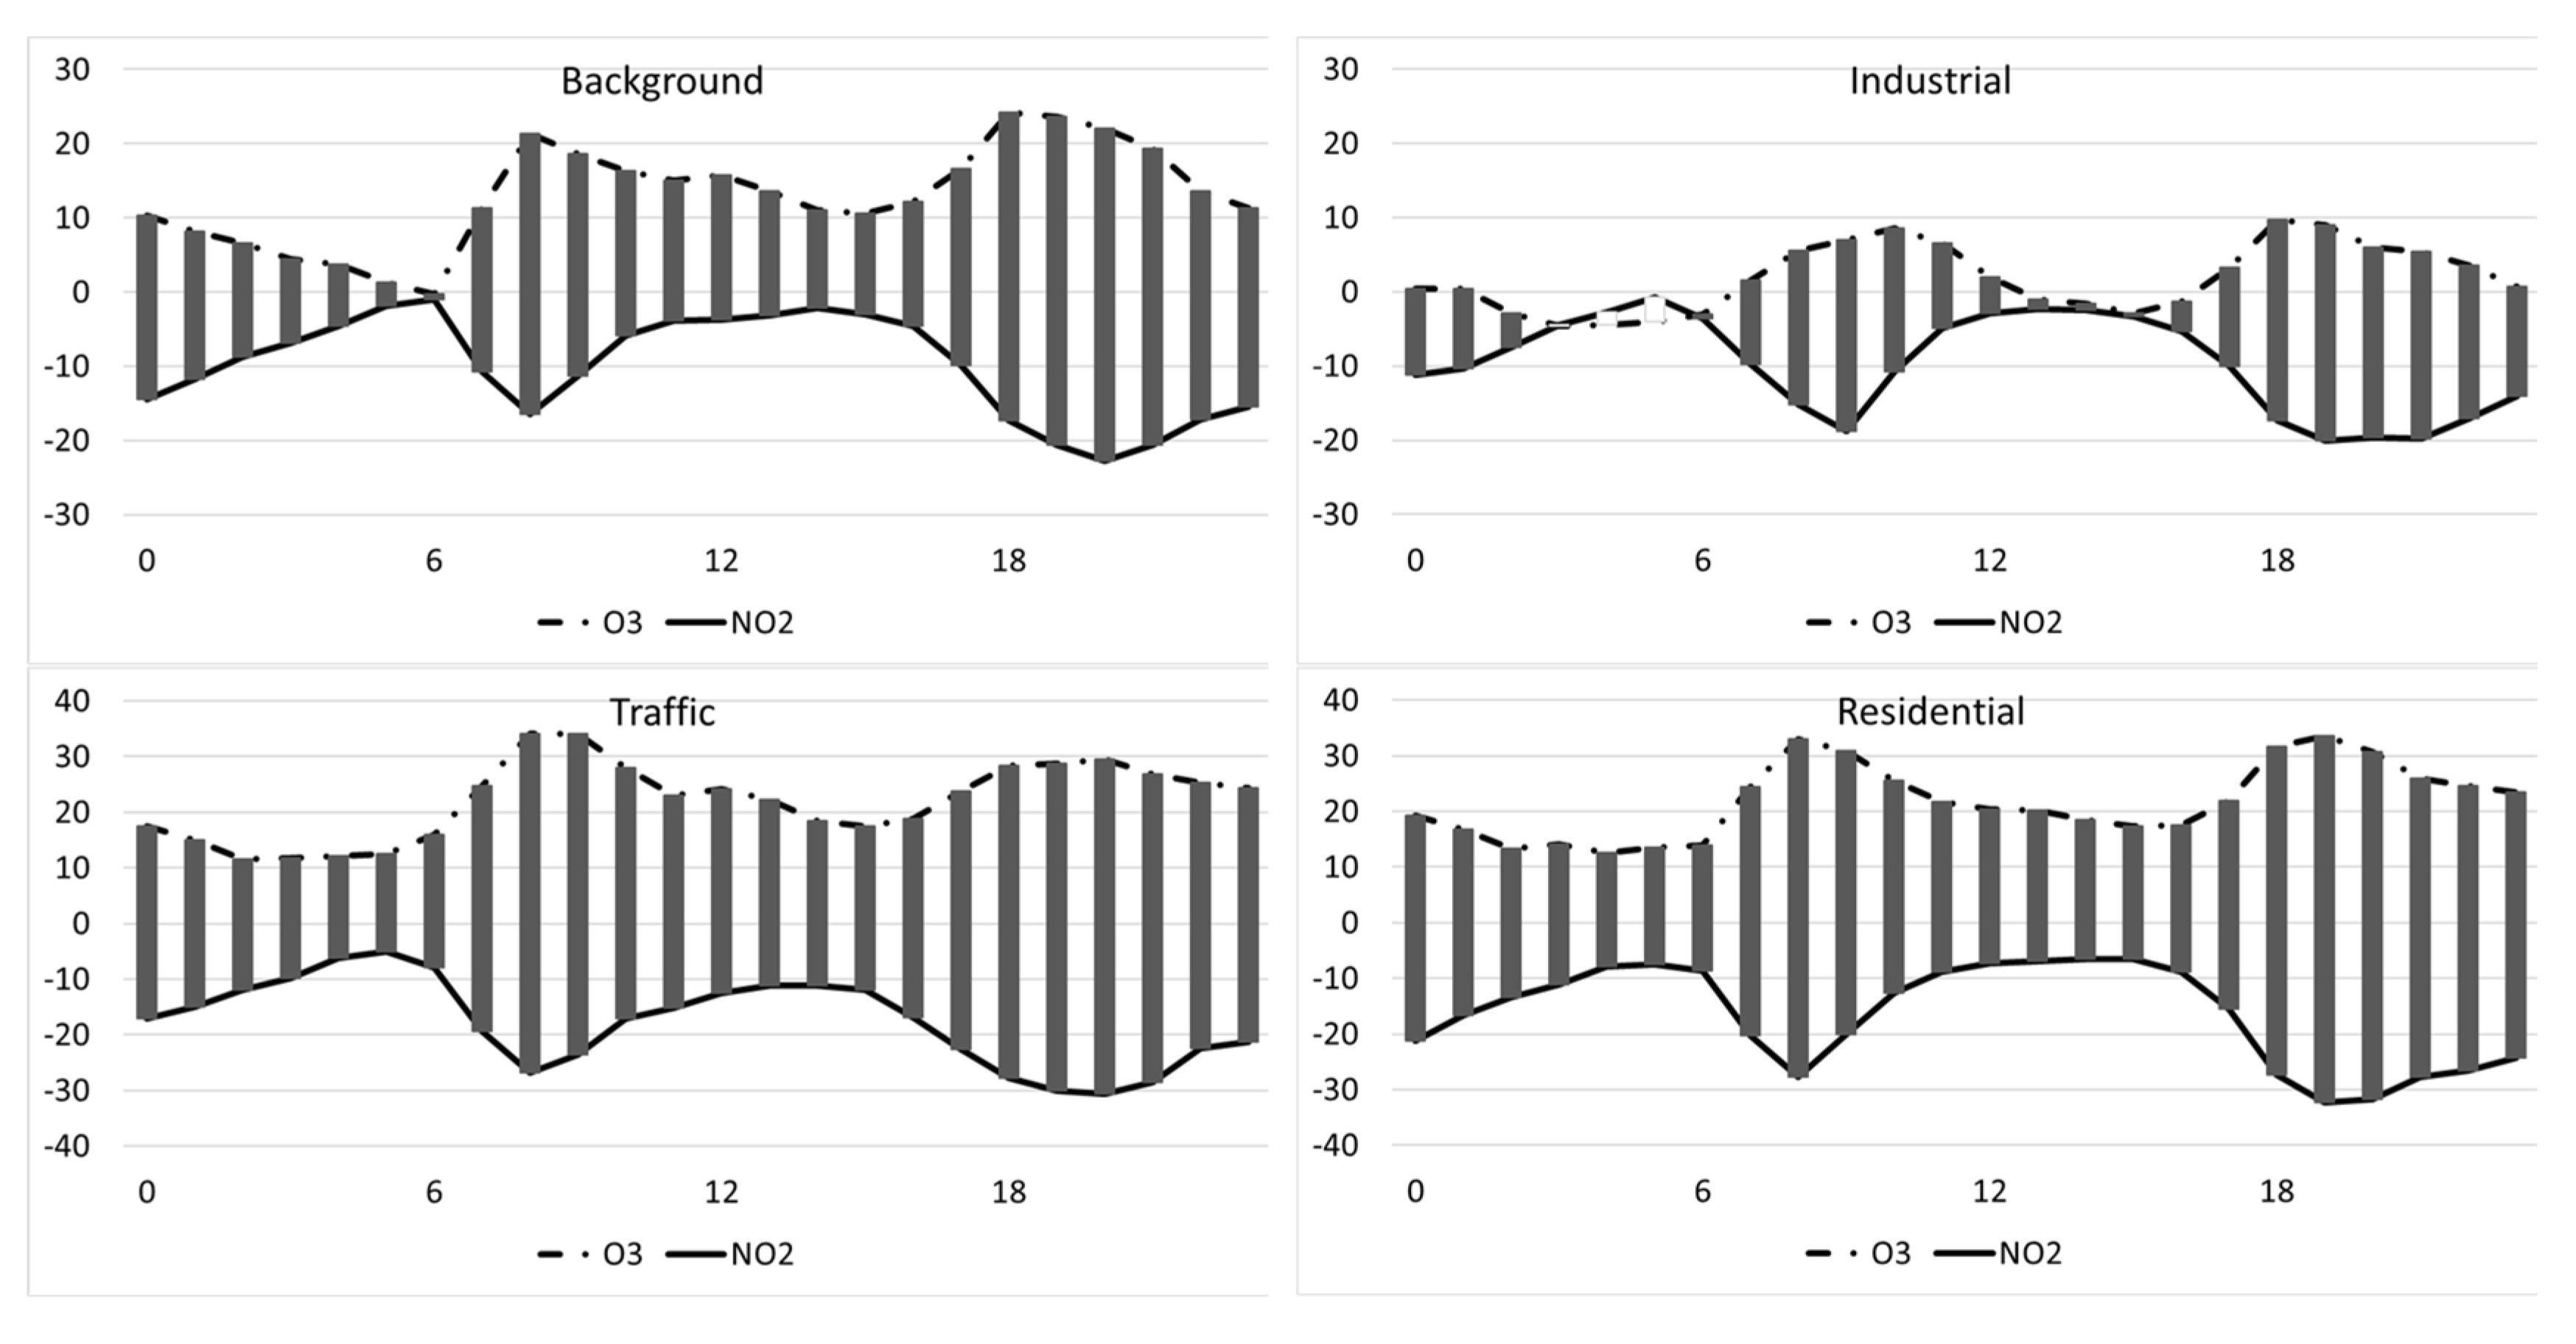
3.3.1. Nitrogen dioxide NO2

The absolute and percentage differences of the average period and 98° percentile of NO2 are reported in Figure S2 for each receptor.
The effect of the lockdown on NO2 concentration is evident. In all the receptor points NO2 concentration is reduced. The average period concentration reduces on the average in all the area considered of 15 µg/m3 (−48%). The 98° percentile reduces at an average of 32 µg/m3 (−39%). These data are in agreement with those reported in other urban areas, both in Italy and in other countries: China [5]; Rio de Janeiro [9]; New Delhi [3] and Barcelona [4]. Moreover, maps obtained from satellite COPERNICUS Sentinel 5P show a significant reduction of NO2 in the area of Naples similar to that reported for Rome (−49%) in the period from the 13th of March to the 13th of April 2020 compared with the same period in 2019 (https://www.esa.int/ESA_Multimedia/Images/2020/04/NO2_concentrations_over_Europe).
Even though NO2 is reduced in all stations, some differences exist depending on the category (Figure 4).
The period average percentage reduction is in this order: Industrial (−39%) < Background (−40%) < Traffic (−50%) < Residential (−53%). The same order is observed for the 98° percentile reduction: Industrial (−28%) < Background (−38%) < Traffic (−39%) < Residential (−46%). The reduction of the period average is always higher than the reduction of the 98°percentile.
In Figure 5, diurnal variations of NO2 before and during lockdown are reported for each station category. Patterns are similar with the two concentration peaks during the day: at about 7–9 a.m. and 7–9 p.m.
Similar patterns are observed between backgrounds with industrial stations and between traffic with residential stations. In fact, background and industrial stations are both located in open spaces. Residential and traffic stations have also common peculiarities: both are in urbanized and poorly-ventilated areas.

3.3.2. Ozone O3

The absolute and percentage differences of average period concentration and the 98° percentile of O3 concentration due to the lockdown are reported in Figure S3 for each receptor.
The effect of lockdown on O3 is also relevant but in opposition with that of NO2. In all the receptor points the O3 concentration increases. In all the areas studied, the average period concentration shows an increase of 17 µg/m3 (+36%). The 98° percentile increases at an average of 20 µg/m3 (+25%). These data agree with those reported in other urban areas both in Italy and in other countries: China [5]; Rio de Janeiro [9]; New Delhi [3] and Barcelona [4].
Significant differences exist in the increment of ozone depending on the station category (Figure 6).
The period average percentage increase is in the following order: Industrial (+8%) < Background (+23%) < Residential (+49%) < Traffic (+51%). The same order is observed for the 98° percentile: Industrial (+2%) < Background (+17%) < Residential (+29%) < Traffic (+43%). Percentage reductions of the period average are always higher than the reduction of the 98°percentile.
In Figure 7, diurnal variations of O3 before and during lockdown are reported for each station category. Also, for O3 a similarity is quite evident between background and industrial stations and between residential and traffic ones.
Ozone is a secondary pollutant and its concentration is strongly dependent on solar radiation. In Figure 8 ozone average period concentration for Background stations and Residential + Traffic stations is reported as function of solar irradiance before and during lock down. The range of values of solar irradiance is discretized in nine bins. In the same graphs the percentage of occurrence of solar irradiance bins is also reported.
Figure 8 shows that apart from the higher average solar irradiance observed in the 2nd period (see also Figure 2), another phenomenon is present, as shown by the higher ozone concentration in the 2nd period even in correspondence of the same value of the solar irradiance (see bars in Figure 8). This second phenomenon could be due to the lower concentration of NO2 observed during the lockdown (Figure 4). The role of nitrogen oxides in the photo-stationary cycle of ozone is well-known. The inverse correlation between NO2 and O3 concentrations is evident in the diurnal variation curves (Figure 9) of O3 and NO2 differences between the two periods. It is possible to evaluate the importance of the two phenomena. The higher solar irradiation in the second period contributes to 79% of the increase of the average period concentration of O3 in background stations but only to 47% of the increase in Residential + Traffic stations where photochemistry plays the major role.

3.3.3. PM10

The absolute and percentage differences of the average period concentration and the 98° percentile of PM10 concentration are reported in Figure S4 for each receptor.
The effect of lockdown on PM10 is less evident than for NO2 and O3. In most of the cases, the PM10 concentration was reduced by the lockdown directives, but at some receptors it increased. However, considering all the areas studied, the average period concentration is reduced at the average of 6 µg/m3 (−16%), and the 98° percentile is reduced at the average of 19 µg/m3 (−24%). These data agree with those reported in other urban areas both in Italy and in other countries: China [5]; Rio de Janeiro [9]; New Delhi [3] and Barcelona [4].
Again, differences exist depending on the category of stations (Figure 10).
The period average percentage reduction is in order: Background (+2%), Industrial (−16%) < Residential (−17%) < Traffic (−23%). A similar order is observed for 98° percentile reduction: Background (0%) < Industrial (−24%) < Traffic (−25%), < Residential (−38%). Reduction of 98° percentile are always higher than reduction of period average values.
Diurnal variation diagrams of PM10 are not reported because in many receptors analyzers give only the 24 h average value.

3.3.4. PM2.5

The absolute and percentage differences of the average period concentration and the 98° percentile of PM2.5 concentration due to the lockdown are reported in Figure S5 for each receptor.
The effect of the lockdown on PM2.5 is the most complex of the four pollutants studied. In some cases, the concentration decreases, and in others, it increases. At all the areas studied, the average period concentration increases at 1 µg/m3 (+3%). The 98° percentile reduces at an average of 11 µg/m3 (−21%).
The increment of PM2.5 is mainly present at background stations (+31% of the period average and +9% of the 98° percentile. Industrial stations show an increment of the period average (+11%) and a decrease of the 98° percentile (−17%). Residential and Traffic stations undergo a reduction of both the period average and the 98° percentile (Figure 11).
Diurnal variation diagrams of PM2.5 are not reported because, as for PM10, in many stations, the analyzers give only the 24 h average value.

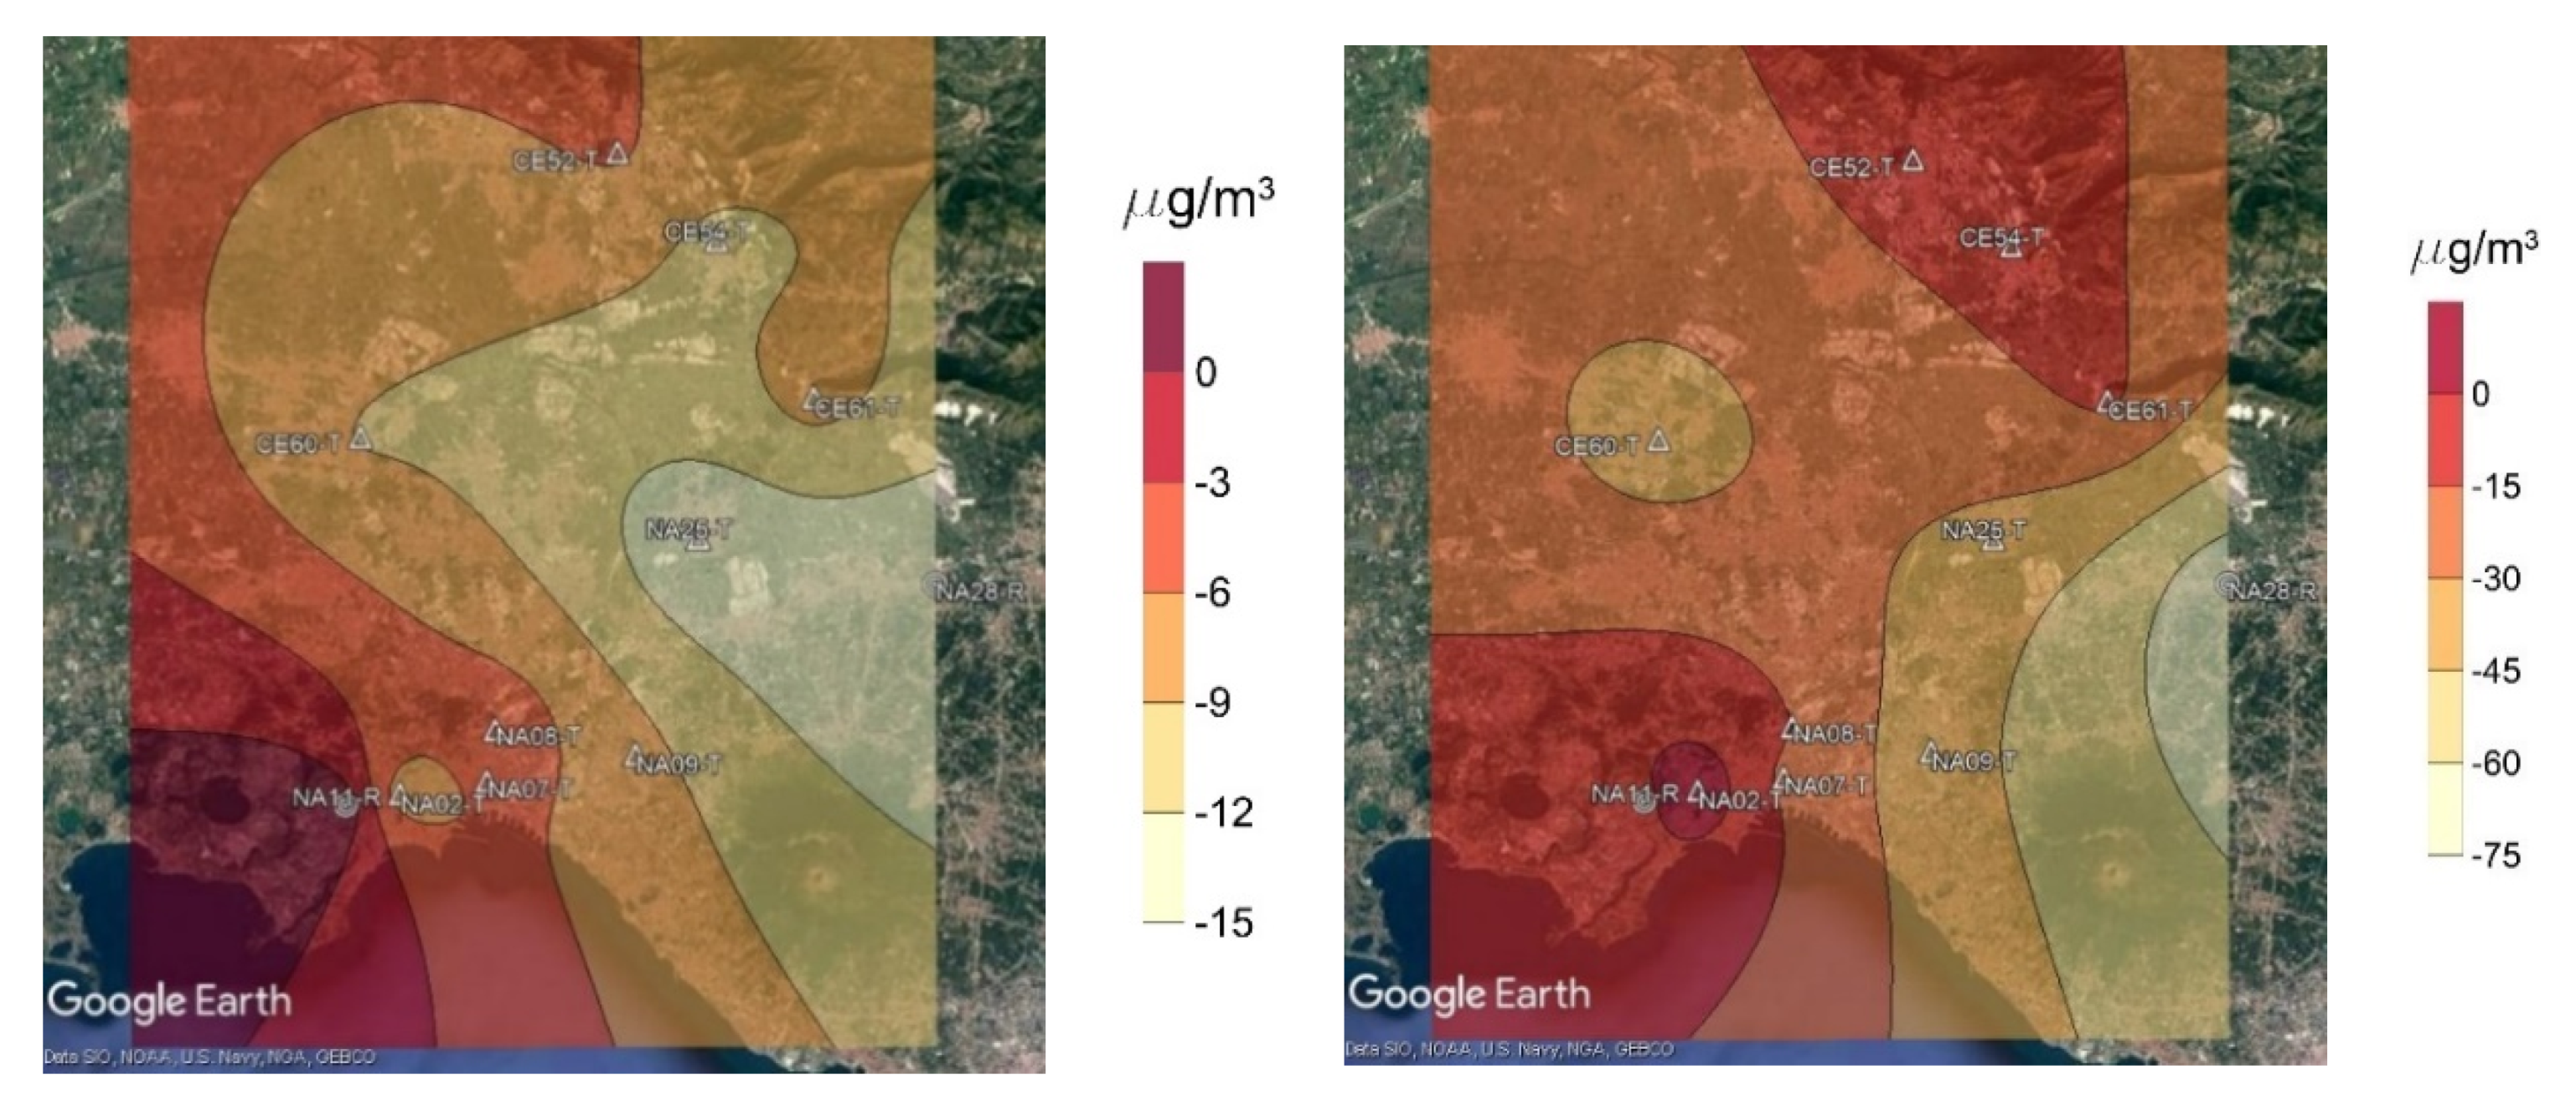
3.3.5. Spatial variation

To observe the spatial distribution of the variations occurring during the lockdown, contour maps of NO2, PM10, and PM2.5 period averages and the 98° percentile are reported in Figure 12, Figure 13, Figure 14 and Figure 15. Since the concentration levels depend strongly on the station category, we have considered residential and traffic stations to draw NO2, PM10, and PM2.5 maps, and background and industrial stations for O3 maps.
The contour maps show some interesting findings: (i) NO2 reduction is higher in the most urbanized areas and along the axis Naples-Caserta, where high-traffic highways are present; (ii) PM10 and PM2.5 reductions are more relevant in less urbanized areas; (iii) the O3 increment is higher in the N-NE area of the studied region that is downwind with respect to diurnal wind direction due to the sea breeze regime.

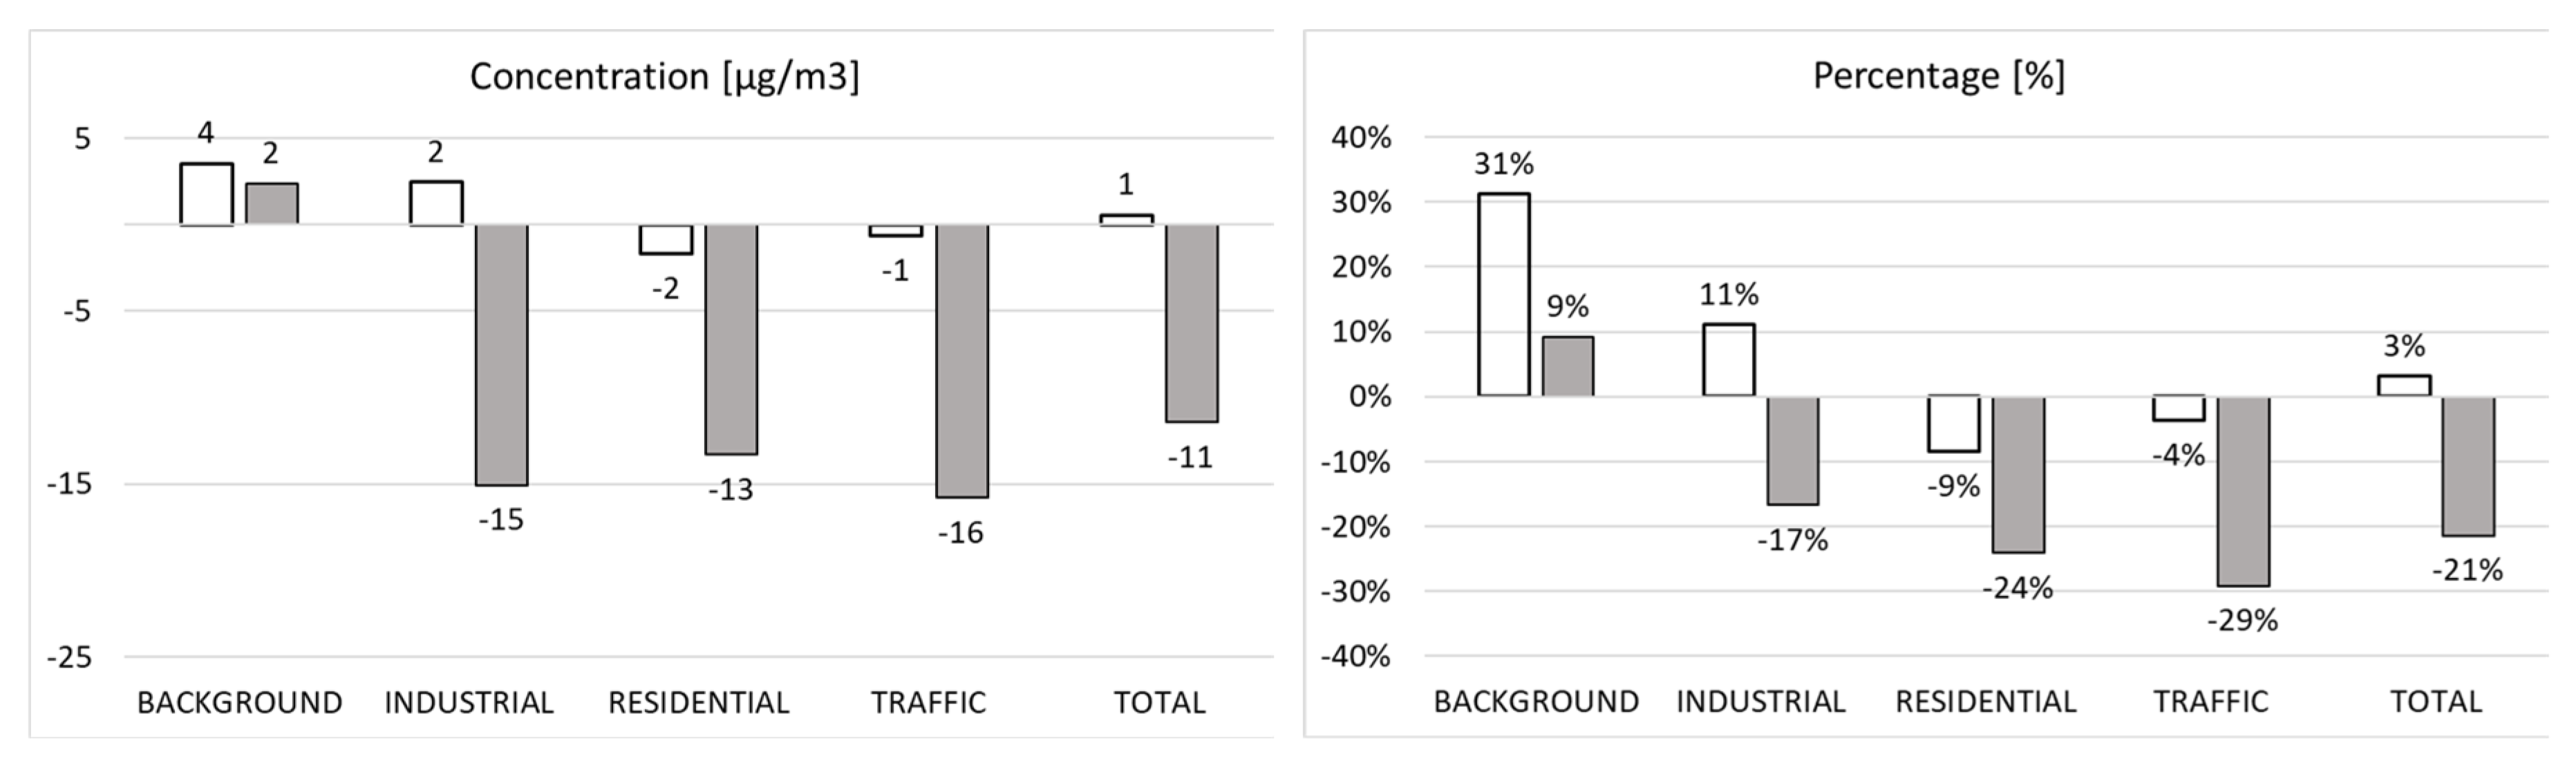
3.4. Effect of Lockdown on Emissions

The lockdown directives have a great impact on anthropogenic emissions of all kind activities: transport, industrial and residential. Data on atmospheric emissions before lockdown from the national emission inventory disaggregated at district level by ISPRA up to 2015 are reported in Table 2 (http://www.sinanet.isprambiente.it/it/sia-ispra/inventaria/disaggregazione-dellinventario-nazionale-2015/view).
As shown in Table 2 the main sectors with respect to NOx emissions were: “road transport” and “other mobile sources and machinery” especially maritime activity. For PM10 and PM2.5 the main sector was “non-industrial combustion plants”.
Data collected to assess the reduction of emissions due to lockdown directives are reported in the following.

3.4.1. Transport

Three sub-sectors of transport are studied: road, maritime, and aviation. The reduction of vehicular traffic was consistent. On a national base, the traffic reduction is estimated at −80% of vehicles <3.5 t and −55% of vehicles >3.5 t. It is consistent with gasoline and diesel consumption (−43% in March and about −80% in April) [10].
Data on vehicular traffic in the Campania region were downloaded from ANAS, the national company responsible for the construction and maintenance of the road network in Italy. Vehicular traffic is given as an index (IMR) that reports the daily average value of circulating vehicles. Vehicles are lumped in two groups: light vehicles (<3.5 t) and heavy vehicles (>3.5 t).
Data of IMR in Campania show a reduction due to the lockdown from 8507 to 3399 light vehicles per day and per measuring point, corresponding to a percentage of reduction of 60%, while for heavy vehicles the reduction is from 617 to 438 vehicles, corresponding to a 29% reduction. Overall, the traffic reduction is 58%. These reductions are lower than those reported above at the national level (−80% and −55%). A possible reason is that data from ANAS measure only sub-urban traffic.
In evaluating emissions, the change in the composition of the circulating fleet must be considered: light vehicles were reduced from 92.7% to 87.8% and heavy vehicles increased from 7.3% to 12.2%. An increase in average speed with less time spent in stop and go regimes is also expected due to the traffic reduction. However, it was not possible to evaluate this effect due to the absence of data. Therefore, we consider only the effect of traffic reduction and change in fleet composition before and during the lockdown. Average emission factors for NO2, NOx, PM10 and PM2.5 are evaluated using the composition of light vehicles (<3.5 t) and heavy vehicles from ACI data (http://www.aci.it/). They are in g/km: for light vehicles category 0.41 (NOx); 0.04 (PM10) and 0.03 (PM2.5) and for heavy vehicles 4.45 (NOx); 0.18 (PM10) and 0.14 (PM2.5). The reductions in emissions estimated from IMR data and emission factors between the 1st and 2nd periods are reported in Figure 16.
Traffic reduction was more evident on weekend days, with −70% of circulating vehicles. In fact, typical days of NO2 concentration during lockdown show a higher decrease in weekend days with respect to working days (Figure S6).
On a national basis, ship traffic was reduced by −5% in March on the national average and by about −20% in April [10].
Data on ship traffic in the port of Naples were downloaded from the website of the port authority (https://adsptirrenocentrale.it/) and are expressed as average monthly values of tons of goods transported and the number of passengers. Data from January and February were assumed as a reference for the pre-lockdown period, and April data were assumed for the lockdown period. During the lockdown, tons of goods reduced from 1.55 to 1.15 million. More consistent was the reduction in the number of passengers of local ships, with 2.63 × 10⁵ in the pre-lockdown period against 1.99 × 10⁴ during the lockdown period. The number of passengers of cruise ships was zero in both periods. The emissions from maritime activity during the two periods for NOx and PM10 were calculated as proposed by Toscano and Murena [11]. The reduction in emissions between the 1st and 2nd periods are −17% and −31% for NOx and PM10, respectively (Figure 16).
Data on aviation traffic at the International Airport of Capodichino were downloaded from the website of ASSAEROPORTI (https://assaeroporti.com/statistiche/). Traffic data are distinguished in terms of national and international movements. The number of movements in the 1st period was 4967, while in the 2nd period 116 movements are estimated. For the calculation of emissions, only the landing and takeoff phases (LTO cycle) of aircraft operations were considered. Emission factors from ICAO [12,13] were adopted. The estimation of the emission reduction is 98% both for NOx and PM10 (Figure 16).

3.4.2. Other sectors

As reported in Table 2 the most important of “other sectors” to be investigated is the SNAP sector 2 “Non-industrial combustion processes”.
It is reported by ENEA [10] that the reduction of natural gas consumption for thermo-electrical uses in the 2nd period is of about −30%. However, this is mostly due to the industrial sector, while an increase of consumption is anticipated for the residential sector. In contrast, a reduction in residential heating may be assumed due to higher temperatures in April (Figure 2). Therefore, it is reasonable to assume for domestic heating a quite constant emission of pollutants before and during the lockdown.
Biomass combustion is an important source of PM10 within SNAP sector 2. In fact, it is individuated by ARPAC [14] as the principal cause of high PM10 concentration levels observed in some sub-urban zones. Within the urban area of Naples, emissions from domestic open chimneys are limited, but a significant contribution can come from catering activities using wood to prepare food (pizzeria and steakhouse) and from street food shops, in particular chip shops. At the moment, these data are not available in the Campania region. The inventory of emissions in Lombardia shows that the contribution of wood combustion catering activities to PM10 emissions to the whole SNAP sector 2 is of 49% in Milan and of 12% in the whole region, while the contribution to NOx emissions is not relevant being 0.5–0.6%. Campania has the highest number of pizzerias in Italy, and Lombardia is next, both with about 12% of all pizzerias in Italy. During lockdown in Campania, all catering activities were closed; therefore, zero emissions must be assumed. On the basis of these data, we assume as rule of thumb at a 25% reduction in emissions of PM10 and 0% of NOx in sector 2.
To estimate the reduction occurring in sectors: 1 (combustion in the production and transformation of energy); 3 (industrial combustion plants) and 4 (industrial processes without combustion), we consider that in the central south of Italy, the electricity demand reduced from −5.4% in the second week of March to −17.2% in the second week of April [10], and the reduction of natural gas consumption for thermo-electrical uses had a reduction of about −30%. On this basis, it is quite reasonable to assume for these sectors a reduction of 20% of emissions of both PM10 and NOx.
Sectors 5, 6, 9, and 10 give a minor contribution to NOx and p.m. emissions in the investigated area. Activities of sectors 9 (wastes) and 10 (agriculture) suffered a certain reduction during lockdown but were never stopped.

4. Conclusions

During the lockdown, air quality in the districts of Naples and Caserta in the Campania region was remarkably good. Period average (from 13th March to 13th April) values are 15.9 µg/m3 for NO2, 28.5 µg/m3 for PM10, and 17.7 µg/m3 for PM2.5. In the same period, high concentration levels represented by the 98° percentile of hourly averages, are 57.4 µg/m3 for NO2, 68.6 µg/m3 for PM10, and 49.7 µg/m3 for PM2.5. All limit values on air quality were respected during the lockdown. As demonstrated in this paper, this is not due to some favorable atmospheric conditions but is a consequence of the large reduction in anthropogenic emissions.
Among the sources of primary pollutants in the area, the airport of Naples experienced the highest reduction of emissions (about −98% both for NOx and PM), but on the basis of the national inventory of emissions (ISPRA) it is not a main source of pollutants.
The reduction of vehicular traffic plays the major role in the decrease of the NO2 period average concentration to –48%. The reduction of −46% of NOx emissions from road traffic is probably an under-estimation of the actual reduction. In fact, at the national level, the reduction of traffic flow is between −80% for light vehicles (<3 t) and −55% for heavy vehicles (>35 t). In the absence of data for road traffic reduction inside the urban areas of Naples and Caserta, only sub-urban road data were used. This is the possible reason for the under-estimation.
It is noteworthy to observe that the period average PM10 concentrations slightly increase at background stations (+2%), but at residential (−38%) and traffic (−35%) stations decrease significantly. The decrease in the 98° percentile is higher than that of period average.
For PM2.5, the background stations experienced an increase in the period average (+3%) but a decrease of the 98° percentile (−21%). In particular, at traffic stations, a decrease in the 98° percentile of −29% is measured.
These findings, in conjunction with the more limited reductions of other sources in the urban areas, are an indication that emissions of p.m. from road traffic are probably underestimated in the national inventory of emissions (Table 2).
The reduction of emissions of the maritime activities are quite limited with respect to other sectors (−17% NOx and −31% PM10). This is a confirmation that this source is not a major source in the area for both pollutants [15].
Finally, the increment of ozone concentrations observed (+36% of period average and +25% of 98° percentile) is mainly due to the higher solar radiation occurring in the 2nd period. We have estimated that about 79% in background stations and 47% in traffic and residential stations of the observed increment depend on the increased solar radiation.
The results reported can be very useful for public administrators responsible for the management of air quality in Campania in fixing targets for the sustainable development of the area.
From our data it is evident that traffic road emissions play a primary role in determining the air quality in Naples and Caserta, particularly for NOx but also for PM. If a significant advancement in air quality is a goal of the present or future public administrations, a large reduction in emissions from vehicular traffic is mandatory. The replacement of a fraction of the vehicular fleet, both gasoline and diesel vehicles, by electric vehicles could give a significant contribution in reducing the concentration of NOx and PM. It is a hard task, but the objective would be a reduction of at least 40% in traffic road emissions. Otherwise, the metropolitan areas of Naples and Caserta will continue to suffer from bad air quality.

Supplementary Materials

The following are available online at https://www.mdpi.com/2071-1050/12/14/5558/s1, Figure S1:Monitorig efficiency; Figure S2: NO2 average period (left) and and 98° percentile (right) absolute difference (up) in µg/m3 and percentage difference (bottom) due to lock down; Figure S3: O3 average period (left) and 98° percentile (right) absolute difference (up) in µg/m3 and percentage difference (bottom) due to lock down; Figure S4 PM10 average period (left) and 98° percentile (right) absolute difference (up) in µg/m3 and percentage difference (bottom) due to lock down; Figure S5: PM2.5 average period (left) and 98° percentile (right) absolute difference (up) in µg/m3 and percentage difference (bottom) due to lock down; Figure S6: Typical day curves of NO2 in working and weekdays before and during lock down.

Author Contributions

Conceptualization, D.T. and F.M.; Methodology, D.T. and F.M.; Software, D.T.; Formal analysis, DT and F.M.; Investigation, D.T. and F.M.; Resources, D.T. and F.M.; Data curation, D.T.; Writing—original draft preparation, F.M.; Writing—review and editing, D.T. and F.M.; Visualization, D.T. All authors have read and agreed to the published version of the manuscript.

Funding

This research received no external funding.

Acknowledgments

Data from meteorological station in Nola were collected during CAMSOL-ARIA project financed by “POR Campania FESR 2014-2020-Ricerca e Innovazione” fund. The research staff is gratefully acknowledged.

Conflicts of Interest

The authors declare no conflict of interest.

References

  1. Wang, Q.; Su, M. A preliminary assessment of the impact of COVID-19 on environment–A case study of China. Sci. Total Environ. 2020, 138915. [Google Scholar] [CrossRef] [PubMed]
  2. Isaifan, R.J. The dramatic impact of Coronavirus outbreak on air quality: Has it saved as much as it has killed so far? Glob. J. Environ. Sci. Manag. 2020, 6, 275–288. [Google Scholar] [CrossRef]
  3. Mahato, S.; Pal, S.; Ghosh, K.G. Effect of lockdown amid COVID-19 pandemic on air quality of the megacity Delhi, India. Sci. Total Environ. 2020, 139086. [Google Scholar] [CrossRef] [PubMed]
  4. Tobías, A.; Carnerero, C.; Reche, C.; Massagué, J.; Via, M.; Minguillón, M.C.; Alastury, A.; Querol, X. Changes in air quality during the lockdown in Barcelona (Spain) one month into the SARS-CoV-2 epidemic. Sci. Total Environ. 2020, 138540. [Google Scholar] [CrossRef] [PubMed]
  5. Xu, K.; Cui, K.; Young, L.H.; Hsieh, Y.K.; Wang, Y.F.; Zhang, J.; Wan, S. Impact of the COVID-19 event on air quality in Central China. Aerosol Air Qual. Res. 2020, 20, 915–929. [Google Scholar] [CrossRef] [Green Version]
  6. Collivignarelli, M.C.; Abbà, A.; Bertanza, G.; Pedrazzani, R.; Ricciardi, P.; Miino, M.C. Lockdown for CoViD-2019 in Milan: What are the effects on air quality? Sci. Total Environ. 2020, 732, 139280. [Google Scholar] [CrossRef] [PubMed]
  7. Ntziachristos, L.; Samaras, Z. COPERT II: Computer Programme to Calculate Emissions from Road Transport: User Manual; Technical report No 5; European Environment Agency: Copenhagen, Denmark, 1997. [Google Scholar]
  8. Ntziachristos, L.; Samaras, Z.; Eggleston, S.; Gorissen, N.; Hassel, D.; Hickman, A.J. Copert III. Computer Programme to Calculate Emissions from Road Transport, Methodology and Emission Factors (Version 2.1); Technical report No 49; European Energy Agency: Copenhagen, Denmark, 2000. [Google Scholar]
  9. Dantas, G.; Siciliano, B.; França, B.B.; da Silva, C.M.; Arbilla, G. The impact of COVID-19 partial lockdown on the air quality of the city of Rio de Janeiro, Brazil. Sci. Total Environ. 2020, 729, 139085. [Google Scholar] [CrossRef] [PubMed]
  10. ENEA. Analisi Trimestrale del Sistema Energetico Italiano. n.1/2020. Agenzia Nazionale Per le Nuove Tecnologie, L’energia e lo Sviluppo Economico Sostenibile Unità Studi Analisi e Valutazioni. 2020. Available online: https://www.enea.it/it/seguici/pubblicazioni/pdf-sistema-energetico-italiano/01-analisi-trimestrale-2020.pdf (accessed on 6 May 2020).
  11. Toscano, D.; Murena, F. Atmospheric ship emissions in ports: A review. Correlation with data of ship traffic. Atmos. Environ. X 2019, 4, 100050. [Google Scholar] [CrossRef]
  12. International Civil Aviation Organization (ICAO). Airport Local Air Quality Guidance Manual; International Civil Aviation Organization (ICAO): Montreal, QC, Canada, 2007. [Google Scholar]
  13. International Civil Aviation Organization (ICAO). Environmental Report; International Civil Aviation Organization (ICAO): Montreal, QC, Canada, 2007. [Google Scholar]
  14. Onorati, G. Relazione Sulle Campagne di Monitoraggio Delle Polveri Sottili Nel Territorio Nolano-Acerrano e Sull’andamento Meteorologico; ARPAC: Campania, Italy, 2017. [Google Scholar]
  15. Murena, F.; Mocerino, L.; Quaranta, F.; Toscano, D. Impact on air quality of cruise ship emissions in Naples, Italy. Atmos. Environ. 2018, 187, 70–83. [Google Scholar]
Figure 1. The map of the area studied with the positions of monitoring stations: rhombus (background); square (industrial); circle (residential); triangle (traffic) and meteorological stations.
Sustainability 12 05558 g001
Figure 2. Box and whisker diagrams of meteorological parameters observed before (left) and during (right) lockdown. The values of solar radiation correspond to diurnal hours (from 8:00 to 16:00).
Sustainability 12 05558 g002
Figure 3. Wind-rose before (left) and during (right) lockdown.
Sustainability 12 05558 g003
Figure 4. NO2 difference of concentration (left) and percentage of reduction (right) per station categories. White bars correspond to period average, grey bars to 98° percentile.
Sustainability 12 05558 g004
Figure 5. NO2 diurnal variation for station categories.
Sustainability 12 05558 g005
Figure 6. O3 difference of concentration (left) and percentage of reduction (right) per station category. White bars correspond to the period average, grey bars to 98° percentile.
Sustainability 12 05558 g006
Figure 7. O3 diurnal variation for station categories.
Sustainability 12 05558 g007
Figure 8. Distribution of ozone average period concentration vs. solar irradiance before and during lock down (bars). Lines represent the percentage of occurrences of solar irradiance values per bin.
Sustainability 12 05558 g008
Figure 9. O3 and NO2 diurnal variation curves of concentration differences between the two periods per station categories.
Sustainability 12 05558 g009
Figure 10. PM10 difference of concentration (left) and percentage of reduction (right) per station categories. White bars correspond to period average, grey bars to 98° percentile.
Sustainability 12 05558 g010
Figure 11. PM2.5 difference of concentration (left) and percentage (right) per station category. White bars correspond to period average, grey bars to 98° percentile.
Sustainability 12 05558 g011
Figure 12. Maps of the NO2 difference of concentration of period average (left) and 98° percentile (right).
Sustainability 12 05558 g012
Figure 13. Maps of the PM10 difference of concentration of period average (left) and 98° percentile (right).
Sustainability 12 05558 g013
Figure 14. Maps of the PM2.5 difference of the concentration of period average (left) and 98° percentile (right).
Sustainability 12 05558 g014
Figure 15. Maps of the O3 difference of the concentration of period average (left) and 98° percentile (right).
Sustainability 12 05558 g015
Figure 16. Estimated percentages of the reduction of emissions during lockdown for the main SNAP sectors and sub-sectors.
Sustainability 12 05558 g016
Table 1. List of the monitoring stations in the Naples and Caserta districts. Monitoring efficiency (ME%) before/during lockdown is: bold when the efficiency quality criteria is respected; italics when not respected and empty when the analyzer is not present.
UTMME%
AcronymOfficial NameEasting [m]Northing [m]NO2O3PM10PM2.5
CE51-RCE51 Istituto Manzoni444,422.384,547,702.9995/9399/9765/8265/82
CE52-TCE52 Scuola de Amicis443,818.094,547,512.9895/92 100/87100/97
CE54-TCE54 Scuola Settembrini447,731.834,544,040.4895/9296/8593/9793/94
CE60-TAversa Scuola Cirillo433,653.014,536,336.3094/69 100/7273/72
CE61-TSan Felice a Cancello Centro scolastico451,550.084,537,856.8993/9392/9297/9797/97
NA01-BNA01 Osservatorio Astronomico437,174.004,523,893.0095/9195/9197/9797/97
NA02-TNA02 Ospedale Santobono435,187.004,522,320.0095/92 93/78
NA06-TNA06 Museo Nazionale436,897.004,522,837.0095/92 99/5099/50
NA07-TNA07 Ferrovia438,617.004,522,822.0097/91 97/9597/95
NA08-TNA08 Ospedale Nuovo Pellegrini438,947.004,524,837.0095/92 97/90
NA09-TNA09 Via Argine444,493.004,523,854.0096/91 97/8597/85
NA10-BParco Virgiliano430,800.004,516,727.0078/6697/5240/9760/94
NA11-RVia Epomeo433,038.004,521,846.0095/8995/8999/9299/92
NA20-BPozzuoli Villa Avellino426,005.004,519,470.0092/9293/8660/8480/75
NA21-BCasoria Scuola Palizzi440,934.004,529,517.0093/9295/9280/9457/97
NA22-IPomigliano d’Arco Area ASI448,210.004,530,151.0090/88 81/9490/93
NA23-IVolla Via Filichito445,239.004,526,346.0096/9296/92100/95100/97
NA24-IAcerra Zona Industriale449,608.004,536,666.0092/92 83/6563/78
NA25-TAcerra Scuola Caporlae446,984.004,532,338.0095/92 100/8490/87
NA26-BPortici Parco Reggia445,121.004,518,521.0095/8196/9293/9097/84
NA27-RTorre Annunziata Scuola Pascoli452,575.004,512,327.0095/9299/92
NA28-RSan Vitaliano Scuola Marconi456,334.004,530,486.0086/9295/9287/9773/97
Table 2. Emission inventory of the main pollutant sources in Naples and Caserta districts in 2015 (ISPRA). The most relevant sectors are highlighted using bold characters.
SNAP CodeSNAP DescriptionNOxPM10PM2.5
1Combustion in the production and transformation of energy1.62%0.03%0.02%
2Non-industrial combustion plants8.92%71.77%75.29%
3Industrial combustion plants5.54%1.09%0.98%
4Industrial processes without combustion0.00%1.66%1.36%
5Extraction and distribution of fossil fuels and geothermal energy
6Use of solvents and other products 0.00%0.01%
7Road Transport51.60%12.38%10.69%
8Other mobile sources and machinery 8.04 Maritime activity23.45%3.00%3.17%
Other mobile sources and machinery 8.05 Aviation3.72%0.17%0.19%
Other mobile sources and machinery (rest)3.79%1.77%1.88%
9Waste treatment and disposal0.12%0.21%0.20%
10Agriculture0.80%1.78%0.88%
11Other sources and sinks (nature)0.49%6.14%5.33%

