Article

A Stochastic User Equilibrium Model Under Traffic Rationing Based on Mode Shifting Rate

1
School of Transportation, Southeast University, No.2 Southeast University Road, Nanjing 211189, China
2
College of City Construction, Jiangxi Normal University, 99 Ziyang Avenue, Nanchang 330022, China
*
Authors to whom correspondence should be addressed.
Sustainability 2020, 12(13), 5433; https://doi.org/10.3390/su12135433
Submission received: 2 June 2020 / Revised: 2 July 2020 / Accepted: 3 July 2020 / Published: 6 July 2020
(This article belongs to the Section Sustainable Transportation)

Abstract

:
As a countermeasure to urban exhaust pollution and traffic congestion, traffic restriction based on the last digit of license plate numbers has been widely introduced throughout the world. However, the effect of traffic restriction is weakened as it causes the long-distance detour of restricted travel modes and induces travel demand to shift to unrestricted travel modes. To consider detour and shift of traffic demand caused by traffic restriction, we propose a stochastic user equilibrium model under traffic rationing based on mode shifting rate and the corresponding solution algorithm. A case study is conducted to verify the effectiveness of proposed model and algorithm. Main findings of numerical experiments include: (1) Compared with traditional stochastic user equilibrium model, the temporary traffic demand shift caused by long-distance detour are well considered in proposed model. (2) Sensitivity analysis of the consumption parameters used in the proposed model shows that, the involved cost parameters have different effectiveness on the mode shifting rate. This study provides a reasonable relaxation of the intensively used assumption, that all restricted vehicles outside the restricted district will detour in traffic rationing research, and provides a reasonable approach to evaluate the change of link flow and the beneficial effectiveness on the sustainability of traffic environment after implementation of traffic restriction policy.

1. Introduction

Recently, urban pollution and traffic congestion are caused by the rapid development of urban motorization. In order to deal with these troubles, various measures such as improving public transportation, setting up HOV lanes and congestion charging (London, Stockholm, Singapore, Milan, etc.) have been developed and proved to be effective in eliminating traffic congestion. However, the above measures usually require transforming the existing traffic infrastructure, resulting in a high additional consumption. Comparatively, traffic restriction on driving authority can fully use the existing traffic infrastructure and avoid high consumption. At present, some cities in Asia and Latin America restrict the driving of private cars in some areas at specific times of the day. The license plate numbers, as the symbol of vehicle identification, are used to provide conveniences for implementation of traffic restriction. Considering the characteristics of low consumption and easy implementation, traffic restriction based on the last digit of license plate numbers has been widely introduced throughout the world.
Traffic restriction implemented in many cities indicates that there is an uncertain impact of traffic restriction on controlling traffic demand and optimizing the traffic structure. Traffic restriction on private cars does reduce the traffic flow generated by private cars during the control period, but increases the traffic flow generated by other unrestricted traffic modes. For instance, traffic restriction in New Delhi, India, reduces traffic flow of private cars less than 20%, while traffic flow of motorcycles, tricycles and buses increase [1]. Traffic restriction adopted in Beijing improves the travel speed of buses from 14.5 km/h to 20 km/h, and the proportion of passengers who have private cars is also improved from 35% to 45%. The utilization rates of carpooling, taxis and other unrestricted modes increases; the average carrying rate of private cars is improved from 1.17 people/car to 1.28 people/car [2]. However, some studies from Mexico show that traffic restriction has little effect on reducing the overall travel demand of motor vehicles [3,4,5,6]. Guerra et al. (2007) [5] conclude from the family trip survey that only changing travel date is selected to deal with traffic restriction, when changing travel time, changing travel destination, and changing travel modes are also optional. Similarly, Davis et al. (2017) [7] show the quantity of passengers shifting from private cars is not obviously increased after expansion of public modes. Liu (2008) [8] indicates the utilization of public modes in Beijing only increases 2.74% compared with data surveyed before the traffic restriction; that is, traffic restriction does not meet the expectation of promoting a mode shift from private cars to public modes.
To further determine whether and how traffic restriction changes the behaviors of mode selection, Wang et al. (2014) [9] select four variables, including travelers’ social-economic attributes, attributes of a single trip, peripheral accessibility of each OD point and dummy variable reflecting traffic policy, and develop a nested logit model to analyze travelers’ selection among private car, public mode and non-motorized mode. Jiang (2016) [10] builds a bi-level programming model to solve the problem of travel mode selection under the condition of traffic restriction and optimized departure frequency of public mode. In which, the upper model determines traffic restriction and departure frequency with public transit, and the lower model is the multiple logit choice model of private car and public transit. The model assumes that all traffic demand of private cars shifts to public mode when there are restrictions. Shi et al. (2014) [11] integrate elastic traffic demand and logit-based mode selection model into a multiple user equilibrium assignment. The model assumes that private cars are still selected when the travel route is not completely restricted. Li et al (2016) [12] build logit models for private cars and buses, respectively, based on consumption functions. Similarly, restricted private car travelers are assumed to completely shift to public modes in this model.
From the above analysis of previous studies, some limitations can be concluded as follows. When determining the mode shifting rate, private car travelers are assumed to either completely shift to public modes if their cars are restricted, or remain unchanged if unrestricted. The above assumptions reflect two extreme situations caused by traffic restriction, which are not consistent with the actual driving behaviors. The deviation between existing assumptions and actual driving behaviors is caused by the following: (1) Existing studies do not consider the location of a specific restricted area, and simply assume that all driving areas are fully restricted. (2) Mode shift caused by detour is ignored in existing studies under the assumption that most private car travelers prefer to detour to avoid restricted areas. However, detours usually induce multiple extra travel distance and high travel consumption. Numerous studies and experiments indicate that traffic demand of private cars will shift to public modes and other alternative modes when faced with high travel consumption.
Considering the limitations in existing studies, this paper focuses on the analysis of traffic equilibrium under a short-term traffic restriction, based on the assumption of stable vehicle ownership and traffic demand in the study region. When traffic restriction is firstly or temporarily adopted as a traffic demand management policy, restricted private car travelers must take one of the two actions: shifting to alternative traffic modes or choosing other routes with detours. During this process, travelers must reassess travel consumption and reselect their travel route; then the structure of traffic demand is required to be updated according to the specific scheme of traffic restriction. In this study, when analyzing the short-term traffic equilibrium under the condition of traffic restriction, the effectiveness of traffic restriction on traffic demand structure, travel consumption and travel route selection is comprehensively considered.
The remainder of this study is organized as follows. In Section 2, the mode shifting rate is defined and calculated based on the specific restricted area and restricted proportion. Then, traffic equilibrium assignment model is developed based on mode shifting rate under the condition of traffic restriction. Section 3 proposes the solving algorithm for the equilibrium model proposed in Section 2. In Section 4, a numerical experiment is conducted to examine the performance of proposed model and corresponding algorithms. Section 5 concludes the study with a summary of main findings and directions for future research.

2. Equilibrium Model under Traffic Rationing

2.1. General Framework

Traffic restriction is proposed to make traffic control for specific areas in the city. Generally, the restricted traffic mode is the private car, but taxi and bus are exempted. During the process of model construction in this study, travel consumption which effects travelers’ selection of travel modes is determined by both travel time and travel cost. Considering different characteristics on travel time and travel cost, travel modes are classified into three categories.
  • Point to point travel by private car with purchasing traffic tools: Travel time is equal to driving time on the road, without additional time. Travel cost includes the fixed cost for phrasing traffic mode and use cost related to travel time.
  • Point to point travel by taxi with purchasing traffic services: This category includes traditional taxi, online taxi-hailing, time-sharing car rental and future autonomous taxi. Travel time is composed of driving time on the road and waiting time for services. Travel cost only includes the use cost related to travel time.
  • Fixed route travel by bus with purchasing traffic services: This category includes various public modes with fixed stations and routes. Travel time is composed of driving time on the road, waiting time for services and access time such as time for “the last mile”. Travel cost is equal to fixed cost or use cost related to travel distance.
For simplified description, private car, taxi and bus are used to represent the above three categories of traffic modes. Preparing for the following analysis on short-time traffic equilibrium under traffic restriction, some assumptions are proposed as follows.
  • Bus lines have sufficient operation capacity and high reliability of operation time, that is, travel time by bus is not affected by the quantity of passengers on the bus.
  • There is only one bus line with fixed travel time and fixed unit time fare between each OD. Study on route selection only covers private car and taxi rather than bus.
  • Traffic flow of bus is independent from traffic flow of private car and taxi.
  • Each trip of private car or taxi only serves a single passenger.
  • Carrying capacity of taxi is sufficient and efficiency of taxi dispatching keeps stable.
For better describing the traffic equilibrium of the network, the symbolic representation of basic elements is given as follows. Furthermore, symbols used in the traffic equilibrium assignment model are summarized in Table 1.
  • Base network: G ( N , L , L B ) represents directed strongly connected network, in which N represents the set of nodes and L represents the set of directed links for car. l L represents a directed link. L B is the set of bus route and l L B represents one route between a specific OD.
  • Travel demand: W is the set of ODs and w W represents an OD. Travel demand is denoted as a vector Q = ( , q w , ) T , in which the number of rows is | W | and q w represents the traffic demand between OD w .
  • Route selection: P w represents the set of alternative travel routes between OD w . The strong connection of network can ensure P w Ø . p P w denotes an alternative travel route, and the set of whole alternative travel routes among all ODs is denoted as P = w W P w .
  • Travel impedance: Travel impedance of links is denoted as a vector T = ( , t l , ) T , in which the number of rows is equal to | L | and t l represents the travel impedance of link l . t ( ) represents the function for calculating link impedance, c p represents the travel impedance of route p and τ w represents the minimum travel impedance between OD w .
  • Traffic assignment: Traffic flow on links is denoted as a vector X = ( , x l w , ) T , x l w represents traffic flow on link l generated from OD w . f p represents the traffic flow of route p .
  • Matching relationship: Define link-route incidence matrix A R | L | × | P | , whose elements are denoted as δ l p . If link l is on route p , δ l p = 1 ; else, δ l p = 0 . Define OD-route incidence matrix B R | W | × | P | , whose elements are denoted as φ w p . For each OD w , if p P w , φ w p = 1 ; else, φ w p = 0 .

2.2. Mode Shifting Rate under Traffic Rationing

When traffic restriction is implemented on a single trunk road, structure of traffic demand is not affected because travelers can complete their trips by adjacent roads. When analyzing traffic restriction of a single trunk road, it is reasonably assumed that traffic demand of trips located both in and out of the restricted area remains unchanged. Thus, relevant research only needs to consider the process of route reselection by adjusting the impedance function.
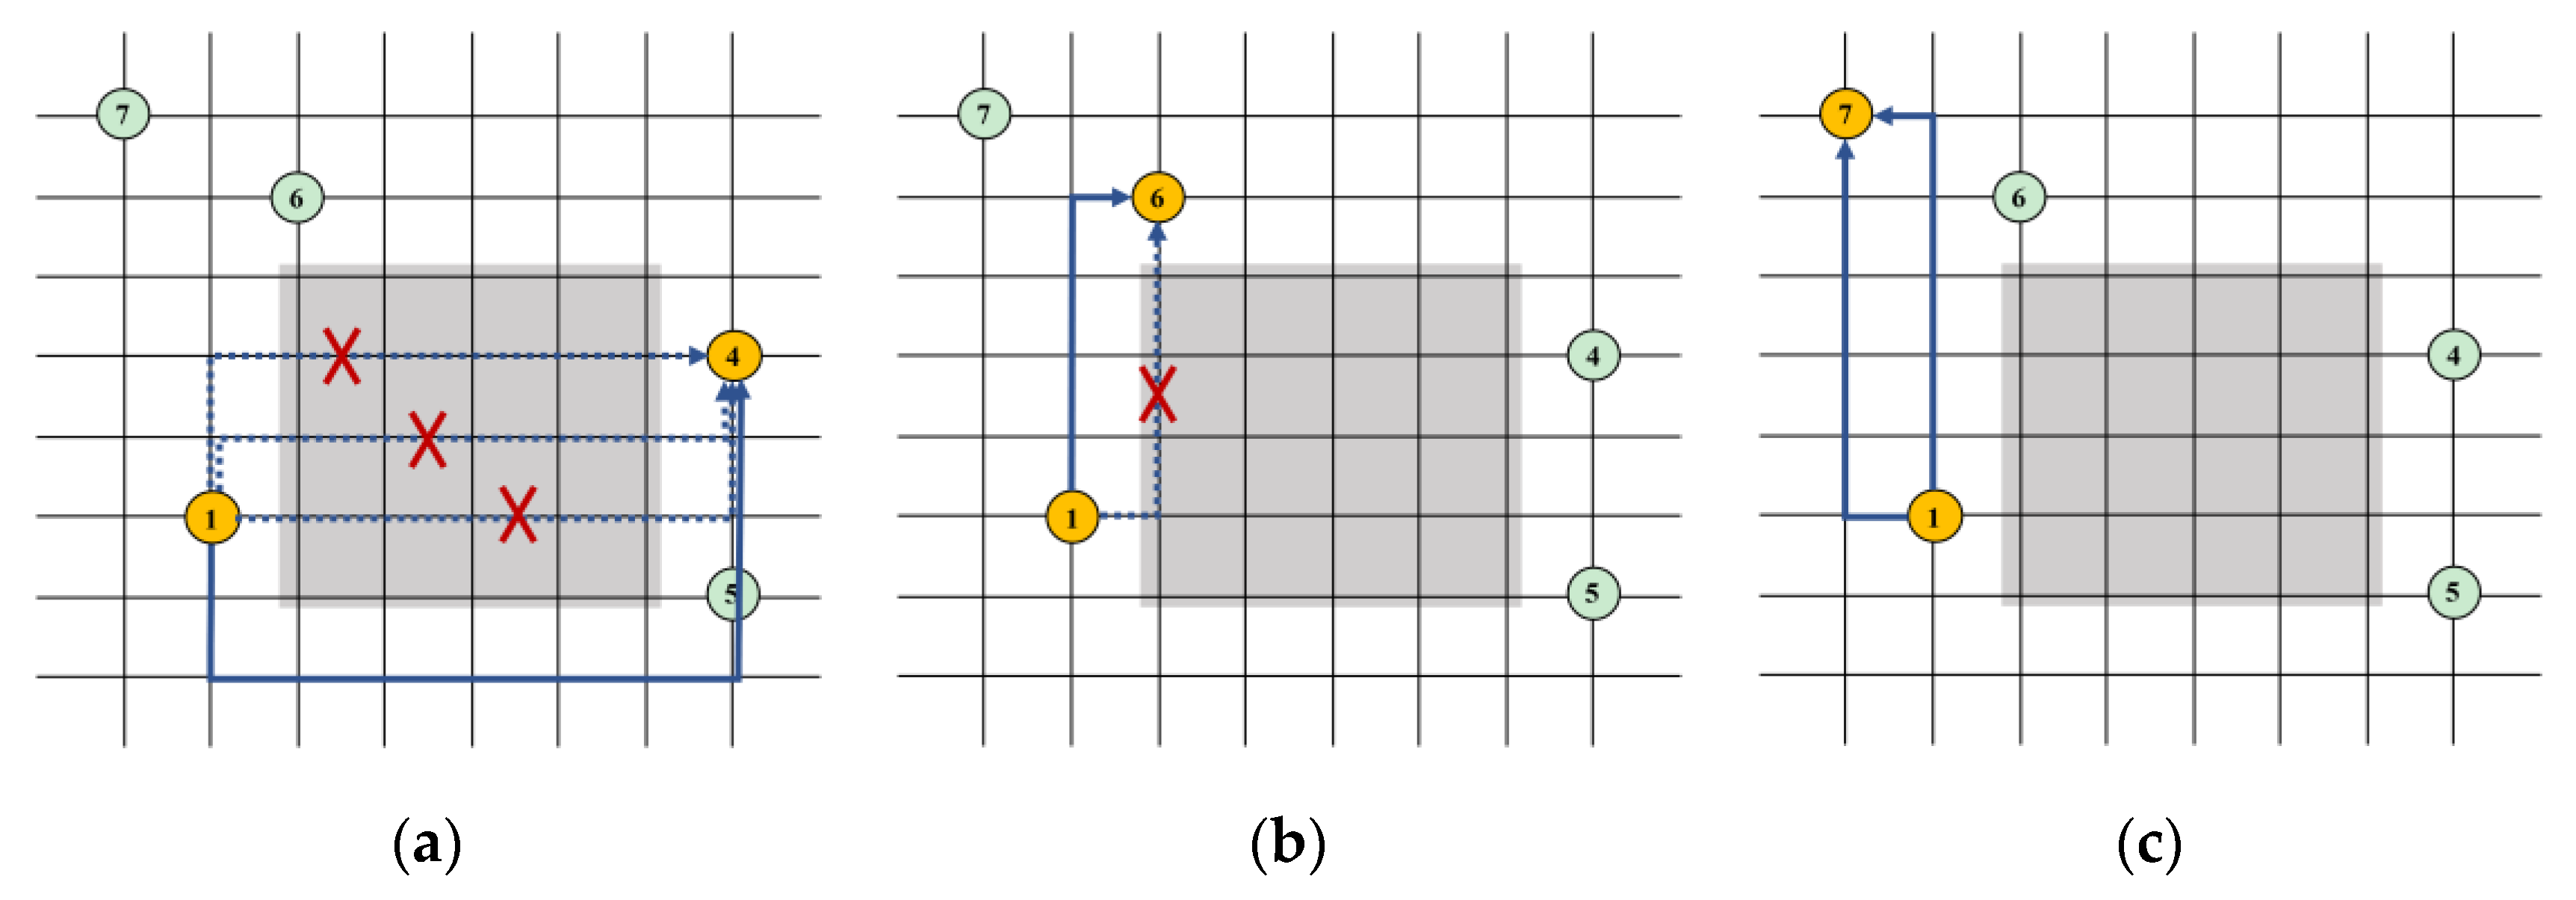
When traffic restriction is implemented on the whole nodes and links in a specific area (Figure 1), traffic demand of trips located both in and out of the restricted area is affected with mode shifting caused by detour. For further analysis, ODs are classified into three categories according to whether traffic analysis nodes are located in the restricted area or not. The set of ODs whose origin and destination are both located in the restricted area are denoted as I I ; the set of ODs in which only one of origin and destination is located in the restricted area are denoted as I O ; the set of ODs, neither of whose origin and destination are located in the restricted area, are denoted as O O . The simplified traffic network is shown in Figure 1, in which the restricted areas are illustrated as the gray areas and the OD pairs of yellow nodes in Figure 1a–c belong to I I , I O , O O respectively.
During the period of traffic restriction, it is assumed that traffic demand and ownership of private cars keeps stable; restricted travelers complete their trips by detour and mode shifting. Traffic modes considered in the analysis of traffic equilibrium include three categories: private car, taxi and bus, which are denoted as c , r , b respectively. The set of traffic modes is denoted as M , M { c , r , b } . The overall traffic demand of OD w is denoted as q w 0 = q w 0 c + q w o r + q w 0 b . The restricted proportion of private cars is denoted as λ and mode shifting rate from private cars to other modes is denoted as γ . Quantity of overall traffic demand keeps unchanged, while the structure of traffic demand changes because of mode shift caused by traffic restriction.
Furthermore, change of traffic demand structure caused by traffic restriction is analyzed. Traffic demand is classified into six categories: (1) unrestricted traffic demand of private cars, (2) restricted traffic demand of private car which completes trips by detour, (3) original traffic demand of taxi, (4) traffic demand shifting from private car to taxi, (5) original traffic demand of bus, (6) traffic demand shifting from private car to bus. The above six categories of traffic demand are denoted as c , c c , r , r c , b , b c respectively, and traffic demand of automobiles without bus is denoted as I = { c , c c , r , r c } .

2.2.1. Calculation of Mode Shifting Rate

For OD w belonging to I I and I O , private car must be abandoned and traffic demand of private car completely shifts to other alternative modes when restricted. At this time, the mode shifting rate γ = 1.00 . For OD w belonging to O O , some ODs whose original travel routes do not pass by restricted areas are not affected by traffic restriction, but others whose original travel routes pass by restricted areas must adjust their travel routes. Consequently, detours generate in the process of adjusting routes and detour rate is defined as τ ¯ w c c / τ ¯ w c , which is the ratio of the minimum estimated travel time of alternative travel routes after and before traffic restriction.
To further calculate the mode shifting rate of ODs belonging to O O , three situations are classified based on alternative routes under traffic restriction (Figure 2)
(1)
All the original travel routes are restricted and detour is needed for completing trips, as shown in Figure 2a. At this time, detour rate is greater than 1.00. Travelers decide whether to still travel by private car or shift to taxi and bus based on updated traffic consumption of private car, taxi and bus.
(2)
Only part of original travel routes are restricted, as shown in Figure 2b. The updated set of alternative travel route includes the remaining unrestricted travel routes and detour routes. The mode shifting rate is determined by detour rate. If detour rate is equal to 1.00, mode shift rate is γ = 0 . If detour rate is larger than 1.00, mode shift rate is calculated based on updated traffic consumption of private car, taxi and bus.
(3)
ll the original travel routes are not restricted, as shown in Figure 2c. At this time, detour rate is equal to 1.00 and there is no shift of traffic demand. That is, γ = 0 .
Considering mode shifting, travel consumption of c c , r c , b c on alternative routes set and route p are denoted as P w c c , P w r , P w b and c p c c , c p r c , c p b c . Alternative route sets of taxi and bus are unchanged after traffic restriction. It is assumed that estimated errors ξ p of travel consumption are independent and obey Gumbel distribution. Referring to route selection based on Logit model [13], expected minimum travel consumptions of c c , r c , b c between OD w are denoted as Φ w c c , Φ w r c , Φ w b c . The calculation formulas are given as Equations (1)–(3).
Φ w c c = E [ min p P w c c ( c ^ p c c ) | c p c c ] = 1 θ ln p P w c c exp ( θ c p c c )
Φ w r c = E [ min p P w r ( c ^ p r c ) | c p r c ] = 1 θ ln p P w r exp ( θ c p r c )
Φ w b c = E [ min p P w b ( c ^ p b c ) | c p b ] = c p b 1 θ E ( ξ p ) = c p b
where θ is a parameter. Then, mode shifting rate between OD w can be calculated by Logit route selected model under traffic restriction, given as Equation (4):
γ = 1.00 exp ( θ Φ w c c / Φ ¯ w ) i { c c , r c , b c } exp ( θ Φ w i / Φ ¯ w )
where Φ ¯ w is the average of Φ w c c , Φ w r c , Φ w b c , introduced to modify the absolute difference of the expected minimum estimated travel cost to a relative one. Accordingly, when the traffic mode of restricted private car shifts to other alternative modes, the selection probability of taxi and bus can be calculated as Equation (5).
{ p w r c = exp ( θ Φ w r c / Φ ¯ w ) exp ( θ Φ w r c / Φ ¯ w ) + exp ( θ Φ w b c / Φ ¯ w ) p w b c = exp ( θ Φ w b c / Φ ¯ w ) exp ( θ Φ w r c / Φ ¯ w ) + exp ( θ Φ w b c / Φ ¯ w )
Combined with the above analysis, calculating function of mode shifting rate under traffic restriction is proposed based on detour rate and location of restricted area, as shown in Equation (6).
γ = { 1.00 , w I I I O 1.00 exp ( θ Φ w c c / Φ ¯ w ) i { c c , r c , b c } exp ( θ Φ w i / Φ ¯ w ) , w O O , τ ¯ w c c / τ ¯ w c > 1.00 0.00 , w O O , τ ¯ w c c / τ ¯ w c = 1.00

2.2.2. Calculation of Changed Traffic Demand Structure

Original traffic demand of private car for OD w before traffic restriction is denoted as q w 0 c , thus traffic demand of unrestricted private car can be calculated as Equation (7).
q w c = ( 1 λ ) q w 0 c
Traffic demand shifting from private car to taxi and bus caused by traffic restriction is denoted as γ λ q w 0 c , so traffic demand of a private car which chooses to detour when restricted can be calculated as Equation (8).
q w c c = ( 1 γ ) λ q w 0 c
Taxi and bus are not restricted by traffic restriction. Assuming that taxi and bus can provide sufficient travel services after traffic restriction, original travelers of taxi and bus will keep their trips. Consequently, original traffic demand of taxi and bus is unchanged. q w 0 r , q w 0 b represents original traffic demand of taxi and bus, so traffic demand of taxi and bus under traffic restriction can be denoted as Equation (9).
{ q w r = q w 0 r q w b = q w 0 b
Combined with the selected probability of taxi and bus, traffic demand shifting from private car to taxi and bus under traffic restriction can be calculated by Equations (10) and (11).
q w r c = λ γ q w 0 c p w r c
q w b c = λ γ q w 0 c p w b c
The change of traffic demand structure after short-time implementation of traffic restriction is concluded in Table 2; where γ is calculated by Equation (6) and p w r c , p w b c are calculated by Equation (5).

2.3. General Travel Cost and Multimodal Path Sets under Traffic Rationing

Value of time (VOT) [14] is adopted in this study and unit VOT is denoted as v . In this way, travel time can be transferred into travel cost and traffic consumption can be calculated by combining travel time and travel cost. Then, links’ travel time and estimated travel consumption of alternative route under traffic restriction are analyzed.

2.3.1. Travel Consumption of Private Cars under Traffic Restriction

Links are classified into two categories in this study, including restricted links L I and unrestricted links L O . Unrestricted private cars are passable on all links l L . Restricted private cars are passable on links l L O but are not passable on link l L I , this time, t l c c + . Travel time of private cars on passable links is represented as a function of traffic flow of car. Travel time of c and c c on link l and route p can be denoted as Equations (12) and (13).
t l c = t l c ( x l ) , t p c = l L δ l p t l c
t l c c = t l c ( x l ) , t p c c = l L O δ l p t l c c
where the travel time function t l c ( x l ) is an increasing, non-negative and continuously differentiable function of link traffic flow x l .
Traffic demand of unrestricted private cars generates from each OD w W . Alternative routes are composed of any link l L and set of alternative routes is denoted as P w c . The average purchase cost of a private car allocated to a single trip is denoted as α c 0 , use cost per unit time of a private car is denoted as α c . Accordingly, estimated travel consumption of unrestricted private cars on route p is calculated by Equation (14).
c ^ p c = c p c 1 θ ξ p = t p c ( v + α c ) + α c 0 1 θ ξ p ,    p P w c , w W
Traffic demand of restricted private cars only generates from OD w O O . Alternative routes are composed of unrestricted links l L O . Estimated travel consumption of restricted private cars on route p is calculated by Equation (15).
c ^ p c c = c p c c 1 θ ξ p = t p c c ( v + α c ) + α c 0 1 θ ξ p ,    p P w c c , w O O

2.3.2. Travel Consumption of Taxis under Traffic Restriction

Travel time of taxis is determined by function of traffic flow of cars, which is the same as travel time function of private cars. Taxis are not restricted by traffic restrictions. Thus, all links are passable for taxis. Additional waiting time when taking a taxi is denoted as β γ . Travel time of taxis on route p is calculated by Equation (16).
t l r = t l c ( x l ) ,    t p r = β r + l L δ l p t l r
Original traffic demand generates from any ODs w W . Traffic demand shifting from private car to taxi generates from both w I I I O and w O O , so traffic demand shifting from private car to taxi also generates from any OD w W . Alternative travel routes for taxi are composed of any link l L . Use cost of per unit time of taxi is denoted as α r . The purchase cost α c 0 still exists for traffic demand shifting from private cars to taxis. Estimated travel consumption of r and r c on route p is calculated by Equations (17) and (18).
c ^ p r = c p r 1 θ ξ p = t p r ( v + α r ) 1 θ ξ p ,    p P w r , w W
c ^ p r c = c p r c 1 θ ξ p = t p r ( v + α r ) + α c 0 1 θ ξ p ,    p P w r , w W

2.3.3. Travel Consumption of Buses under Traffic Restriction

Travel time in a bus line is fixed which is not affected by the quantity of passengers it is serving. Travel time on link l L B is equal to t l b , and additional time is denoted as β b , including waiting time and access time. Consequently, traffic time of the bus line on route p is calculated by Equation (19).
t p b = β b + l L B δ l p t l b
Similarly, with taxis, traffic demand of b , b c generates from any OD w W and alternative routes are composed of links l L B . Use cost of per unit time of bus is denoted as α b and the purchase cost still exists for traffic demand shifting from private cars to buses. Estimated travel consumption of b and b c on route p is calculated by Equations (20) and (21).
c ^ p b = c p b 1 θ ξ p = t p b ( v + α b ) 1 θ ξ p ,    p P w b , w W
c ^ p b c = c p b c 1 θ ξ p = t p b ( v + α b ) + α c 0 1 θ ξ p ,    p P w b , w W

2.3.4. Route Choice Model

Considering that errors ξ p of estimated travel consumption are independent and obey Gumbel distribution, the probability of route selection for type i traffic demand is calculated based on Logit model as shown in Equation (22).
p p i = exp ( θ t p i ) k P w i exp ( θ t k i ) , i I , p P w i
The expected minimum estimated travel time of type i traffic demand after traffic restriction between OD w is calculated as Equation (23).
τ ¯ w i = 1 θ ln p P w i exp ( θ t p i ) , i I
Summarizing the above analysis, travel consumption and route selection of various types of traffic demand after short-term traffic restrictions are shown in Table 3.

2.4. Stochastic User Equilibrium Model

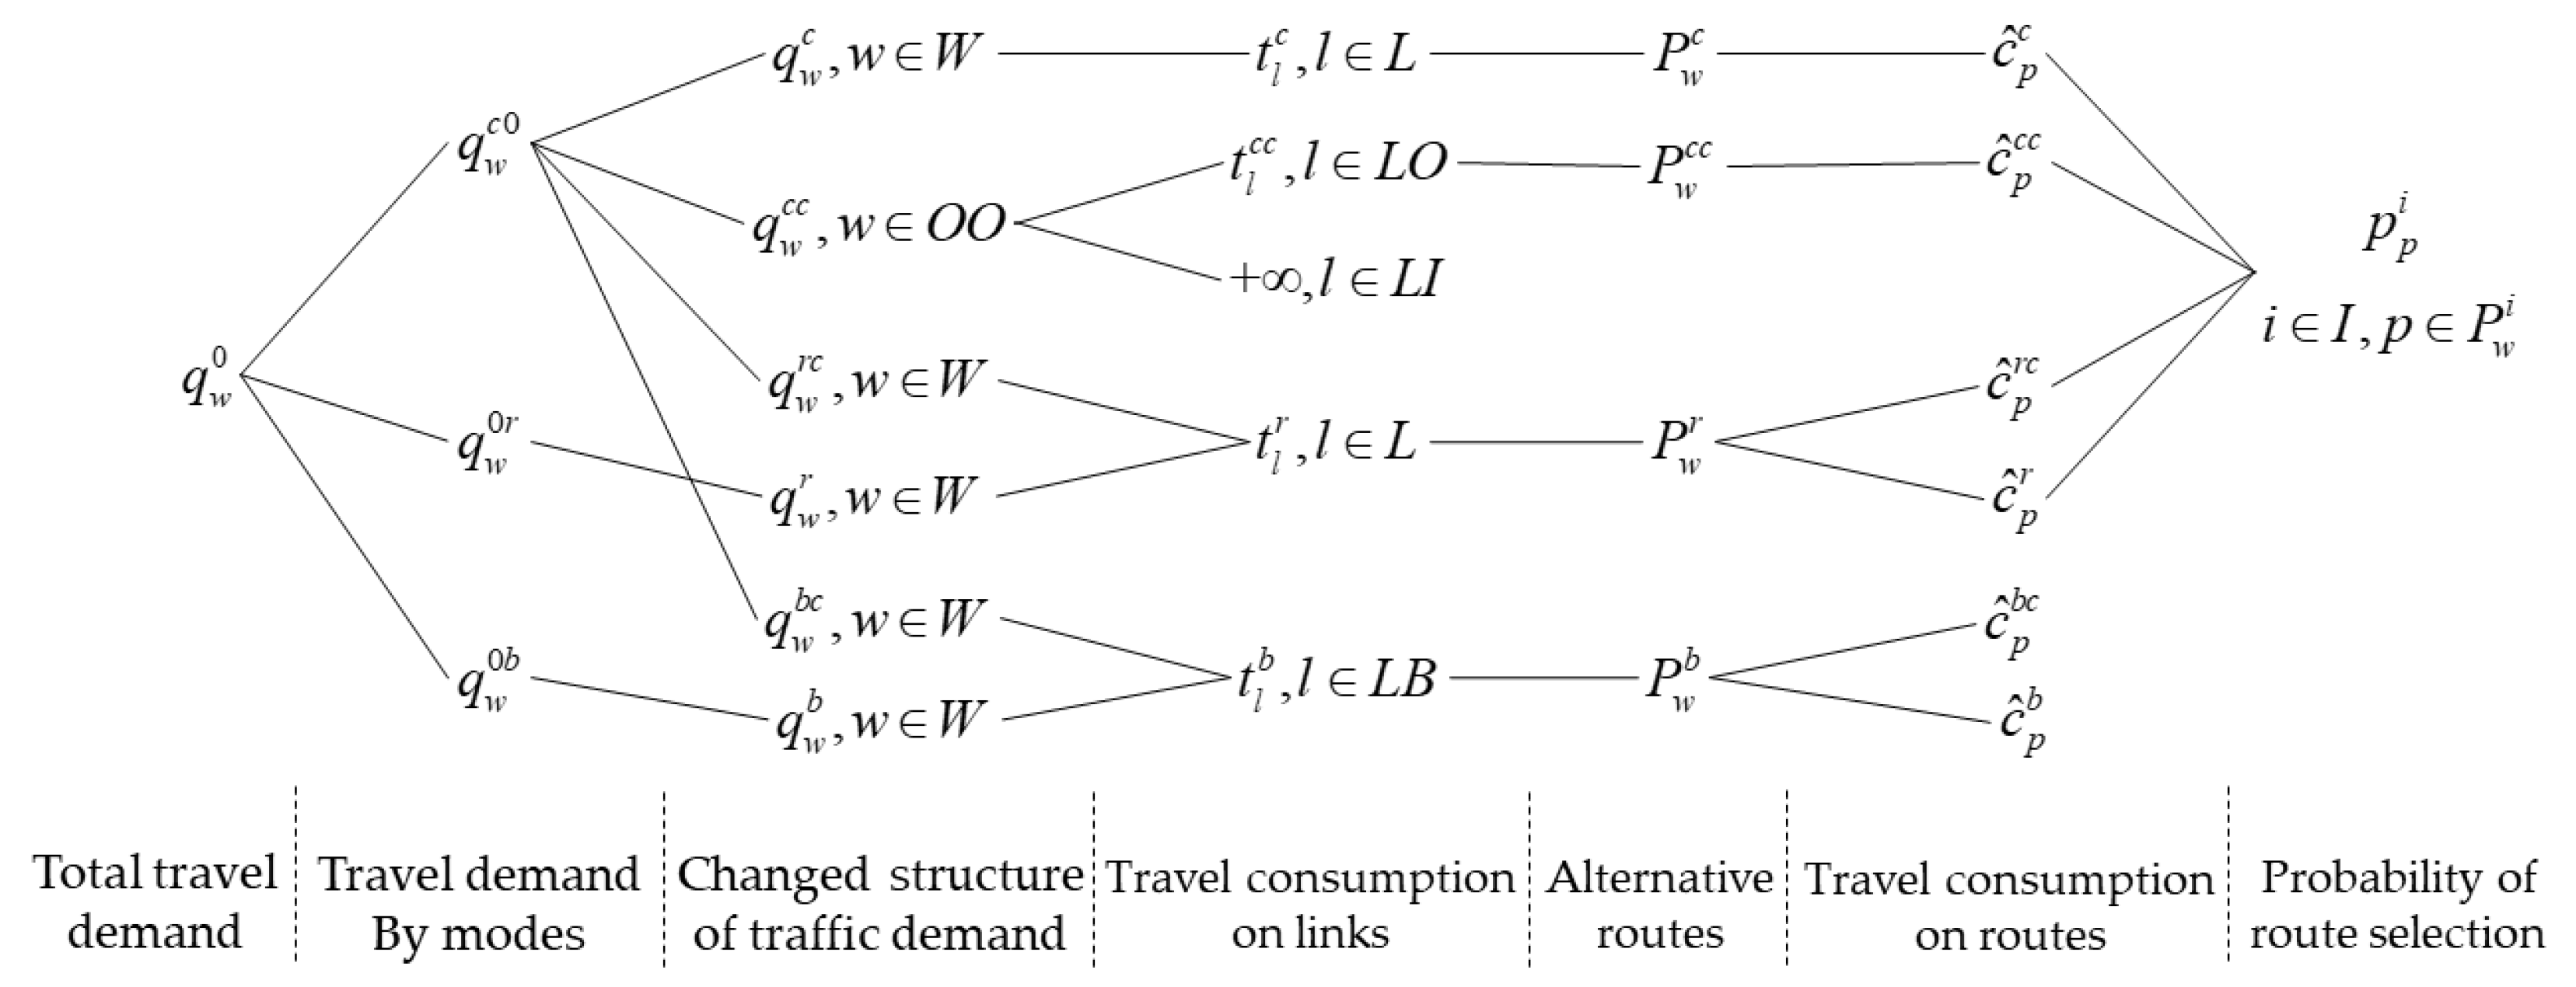
The analyzing structure of traffic demand, travel consumption and route selection under short-term traffic restriction is shown in Figure 3.
On the basis of stable traffic demand, traffic demand of buses can be obtained after adjusting structure of traffic demand under traffic restriction. Considering the assumption that traffic flow of car and bus do not interfere with each other and travel by bus do not need to consider route selection, equilibrium assignment is made only for traffic demand of cars under traffic restriction. For type i traffic demand, condition of stochastic user equilibrium (SUE) can be represented as Equation (24).
f p i ( f p i q w i p p i ) = 0 , i I , p P w i
Combined with the aforementioned function of travel consumption, logit-based mode selection model and route selection model, stochastic user equilibrium model under short-term traffic restriction is proposed as Equation (25).
min Z ( F ) = i I ( ( v + α i ) l 0 x l t l i ( ω ) d ω + w p P w i f p i ( Δ i + 1 θ ln f p i ) ) s . t . { p P w i f p i = q w i , w W , i I i I w W p P w i δ l p f p i = x l , l L f p i 0 , w W , i I , p P w i
where if i = c c , l L O , w O O , else l L , w W . Value of α i and Δ i meets Equations (26) and (27).
α i = { α c , i { c , c c } α r , i { r , r c }
Δ i = { α c 0 if   i { c , c c } ( v + α r ) β r if   i = r ( v + α r ) β r + α c 0 if   i = r c
The proof of stochastic user equilibrium is given as below. The Lagrange function corresponding to Equation (25) is written as Equation (28).
L = Z ( F ) i I w W μ w i ( p P w i f p i q w i )
calculating the partial derivative of f p i , then
L f p i = ( v + α i ) l δ l p t l i + Δ i + 1 θ ( ln f p i + 1 ) μ w i , i I , w , p P w i
because ( v + α i ) l δ l p t l i + Δ i = c p i , Equation (30) is obtained.
L f p i = 1 θ ( ln f p i + 1 ) + c p i μ w i , i I , w , p P w i
Set L f p i = 0 , the optimal f p i for the objective function is denoted as Equation (31).
f p i = exp ( θ c p i + θ μ w i 1 ) , i I , w W , p P w i
Traffic demand of type i for OD w meets Equation (32).
q w i = p P w i f p i = exp ( θ μ w i 1 ) p P w i exp ( θ c p i ) , i I , w W
Combined with selected probability of p p i denoted in Equation (22), the optimal solution of the proposed model has been proved to meet condition of SUE. Due to Equation (25) having strict convex objective function and constraints set composed of linear and non-negative constraints, the proposed model has a unique optimal solution.

3. Solution Algorithm

Equilibrium assignment under short-term traffic restriction in this study is achieved by the following two progresses: adjustment of traffic demand structure and equilibrium assignment of car.
The steps for adjusting traffic demand structure are shown as follows.
(1)
OD classification: Original OD of private car { q w 0 c | w W } is classified into restricted OD { λ q w 0 c | w W } and unrestricted OD { ( 1 λ ) q w 0 c | w W }
(2)
Detour rate calculation: Travel time on links t l c ( x l ) is calculated based on equilibrium flow before traffic restriction. Travel time on routes t p is further calculated based on alternative route sets P w c , P w c c . Referring to Equation (23), the expected minimum travel time and detour rate of OD w are obtained.
(3)
Mode shifting rate calculation: Mode shifting rate is determined by Equations (1)–(6) based on set of alternative routes P w b c , P w r c .
(4)
Traffic demand calculation: Solving the updated structure of traffic demand under traffic restriction based on Equations (7)–(11).
When updated structure of traffic demand is received, steps of equilibrium assignment based on method of successive averages (MSA) algorithm are shown as follows:
(1)
Flow initialization: Set iteration k = 0 . Travel time and travel consumptions on routes t p i ( k ) , c p i ( k ) are calculated based on given actual travel time on links t l i ( k ) under condition of free flow. Then, traffic demand q w i , i I is randomly assigned to network according to the estimated travel consumption c ^ w i ( k ) and the initial set of link flow { x l ( k ) | x l ( k ) = i I x l i ( k ) , l L } is obtained.
(2)
Travel time updating: Set iteration k = k + 1 , updated travel time on links { t l i ( k ) | i I , l L } is calculated based on the function t l i ( k ) = t l i ( x l ( k 1 ) ) .
(3)
Descent direction solution: Travel time of route is updated based on updated travel time on links. Traffic demand q w i is randomly assigned to network according to the estimated travel consumption. Consequently, the additional flow of link y l ( k ) and descent direction ( y l ( k ) x l ( k ) ) are obtained.
(4)
Traffic flow updating: Traffic flow on links is updated based on the function x l ( k + 1 ) = x l ( k ) + 1 k ( y l ( k ) x l ( k ) ) .
(5)
Convergence judgement: If the convergence condition shown in Equation (33) is met, it indicates that the equilibrium assignment is finished. Otherwise, return to step 2 and continue the iteration.
| τ ¯ w i ( k ) τ ¯ w i ( k 1 ) τ ¯ w i ( k 1 ) | < ε , i I , w W
It is noted that the random assignment used in MSA algorithm is related to route selection model. For route selection model based on Probit stochastic model, random assignment can be achieved by Monte-Carlo stochastic simulation and Analytical Approximate [15]. For route selection model based on Logit model, random assignment can be achieved by Dial algorithm [16] and Bell algorithm [17].

4. Case Study

In this section, numerical analysis of a simple network is used to verify the effectiveness of short-term traffic restriction on traffic equilibrium.

4.1. Case Description

The typical network of Sioux Falls [18] is selected as the base network in the numerical experiment. The network includes 24 nodes, 76 links and 528 ODs, whose network topology and traffic demand distribution is shown in Figure 4. In this case, it is assumed that there is only one bus route for every OD, and travel time of bus is quadruple of minimum travel time of private car under free flow condition, given traffic demand is set as traffic demand of private car before traffic restriction (see Figure 4).
The initial sharing ratio of taxi, private car and bus is set as 1:10:20.
Parameters used in the numerical experiment are shown in Table 4. The calculating function of link travel time by car is represented as Equation (34).
t l c ( x l ) = t l 0 [ 1.0 + 0.15 ( x l C a p l ) 4 ]
where t l 0 represents travel time on links of cars under condition of free flow. C a p l represents the capacity of link l .

4.2. Efficiency Analysis

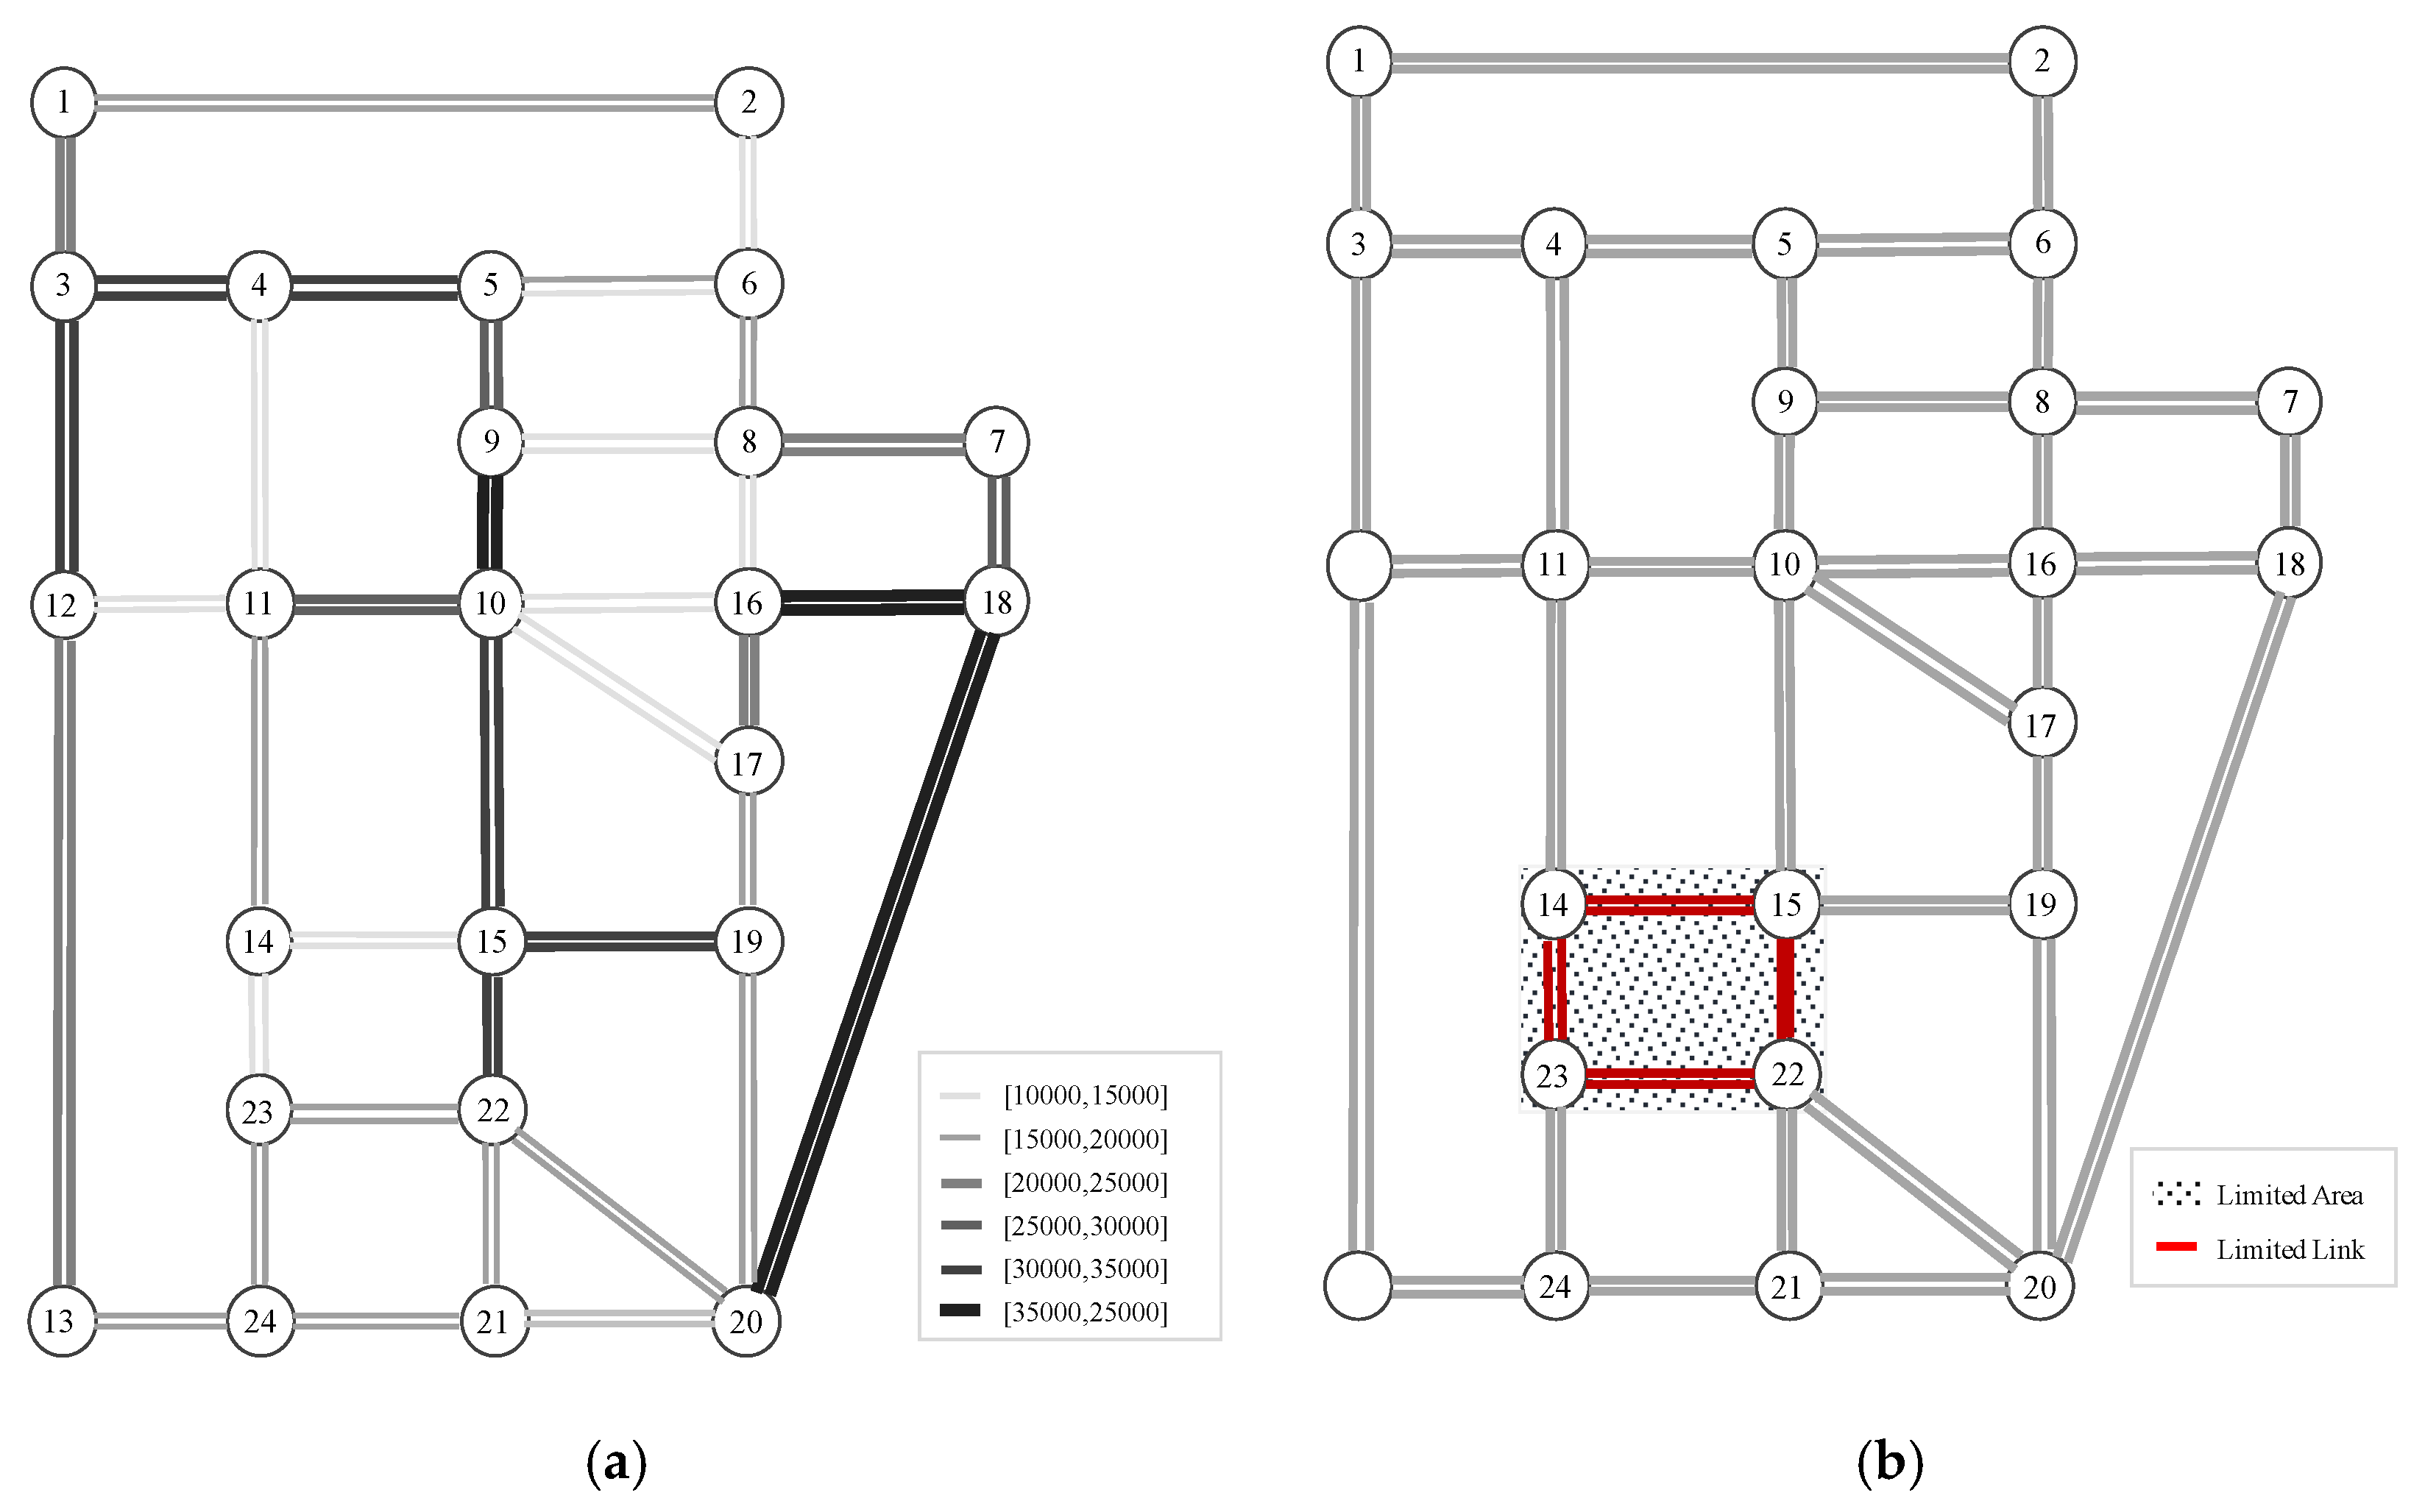
The traffic flow (Figure 5) before traffic restriction solved by SUE model is shown in Figure 5a. Shadow area shown in Figure 5b is set as the restricted area of private cars, and includes nodes 14, 15, 22, 23 and their connected links. The restricted proportion of private cars is set λ 1 = 0.2 and λ 2 = 0.5 .
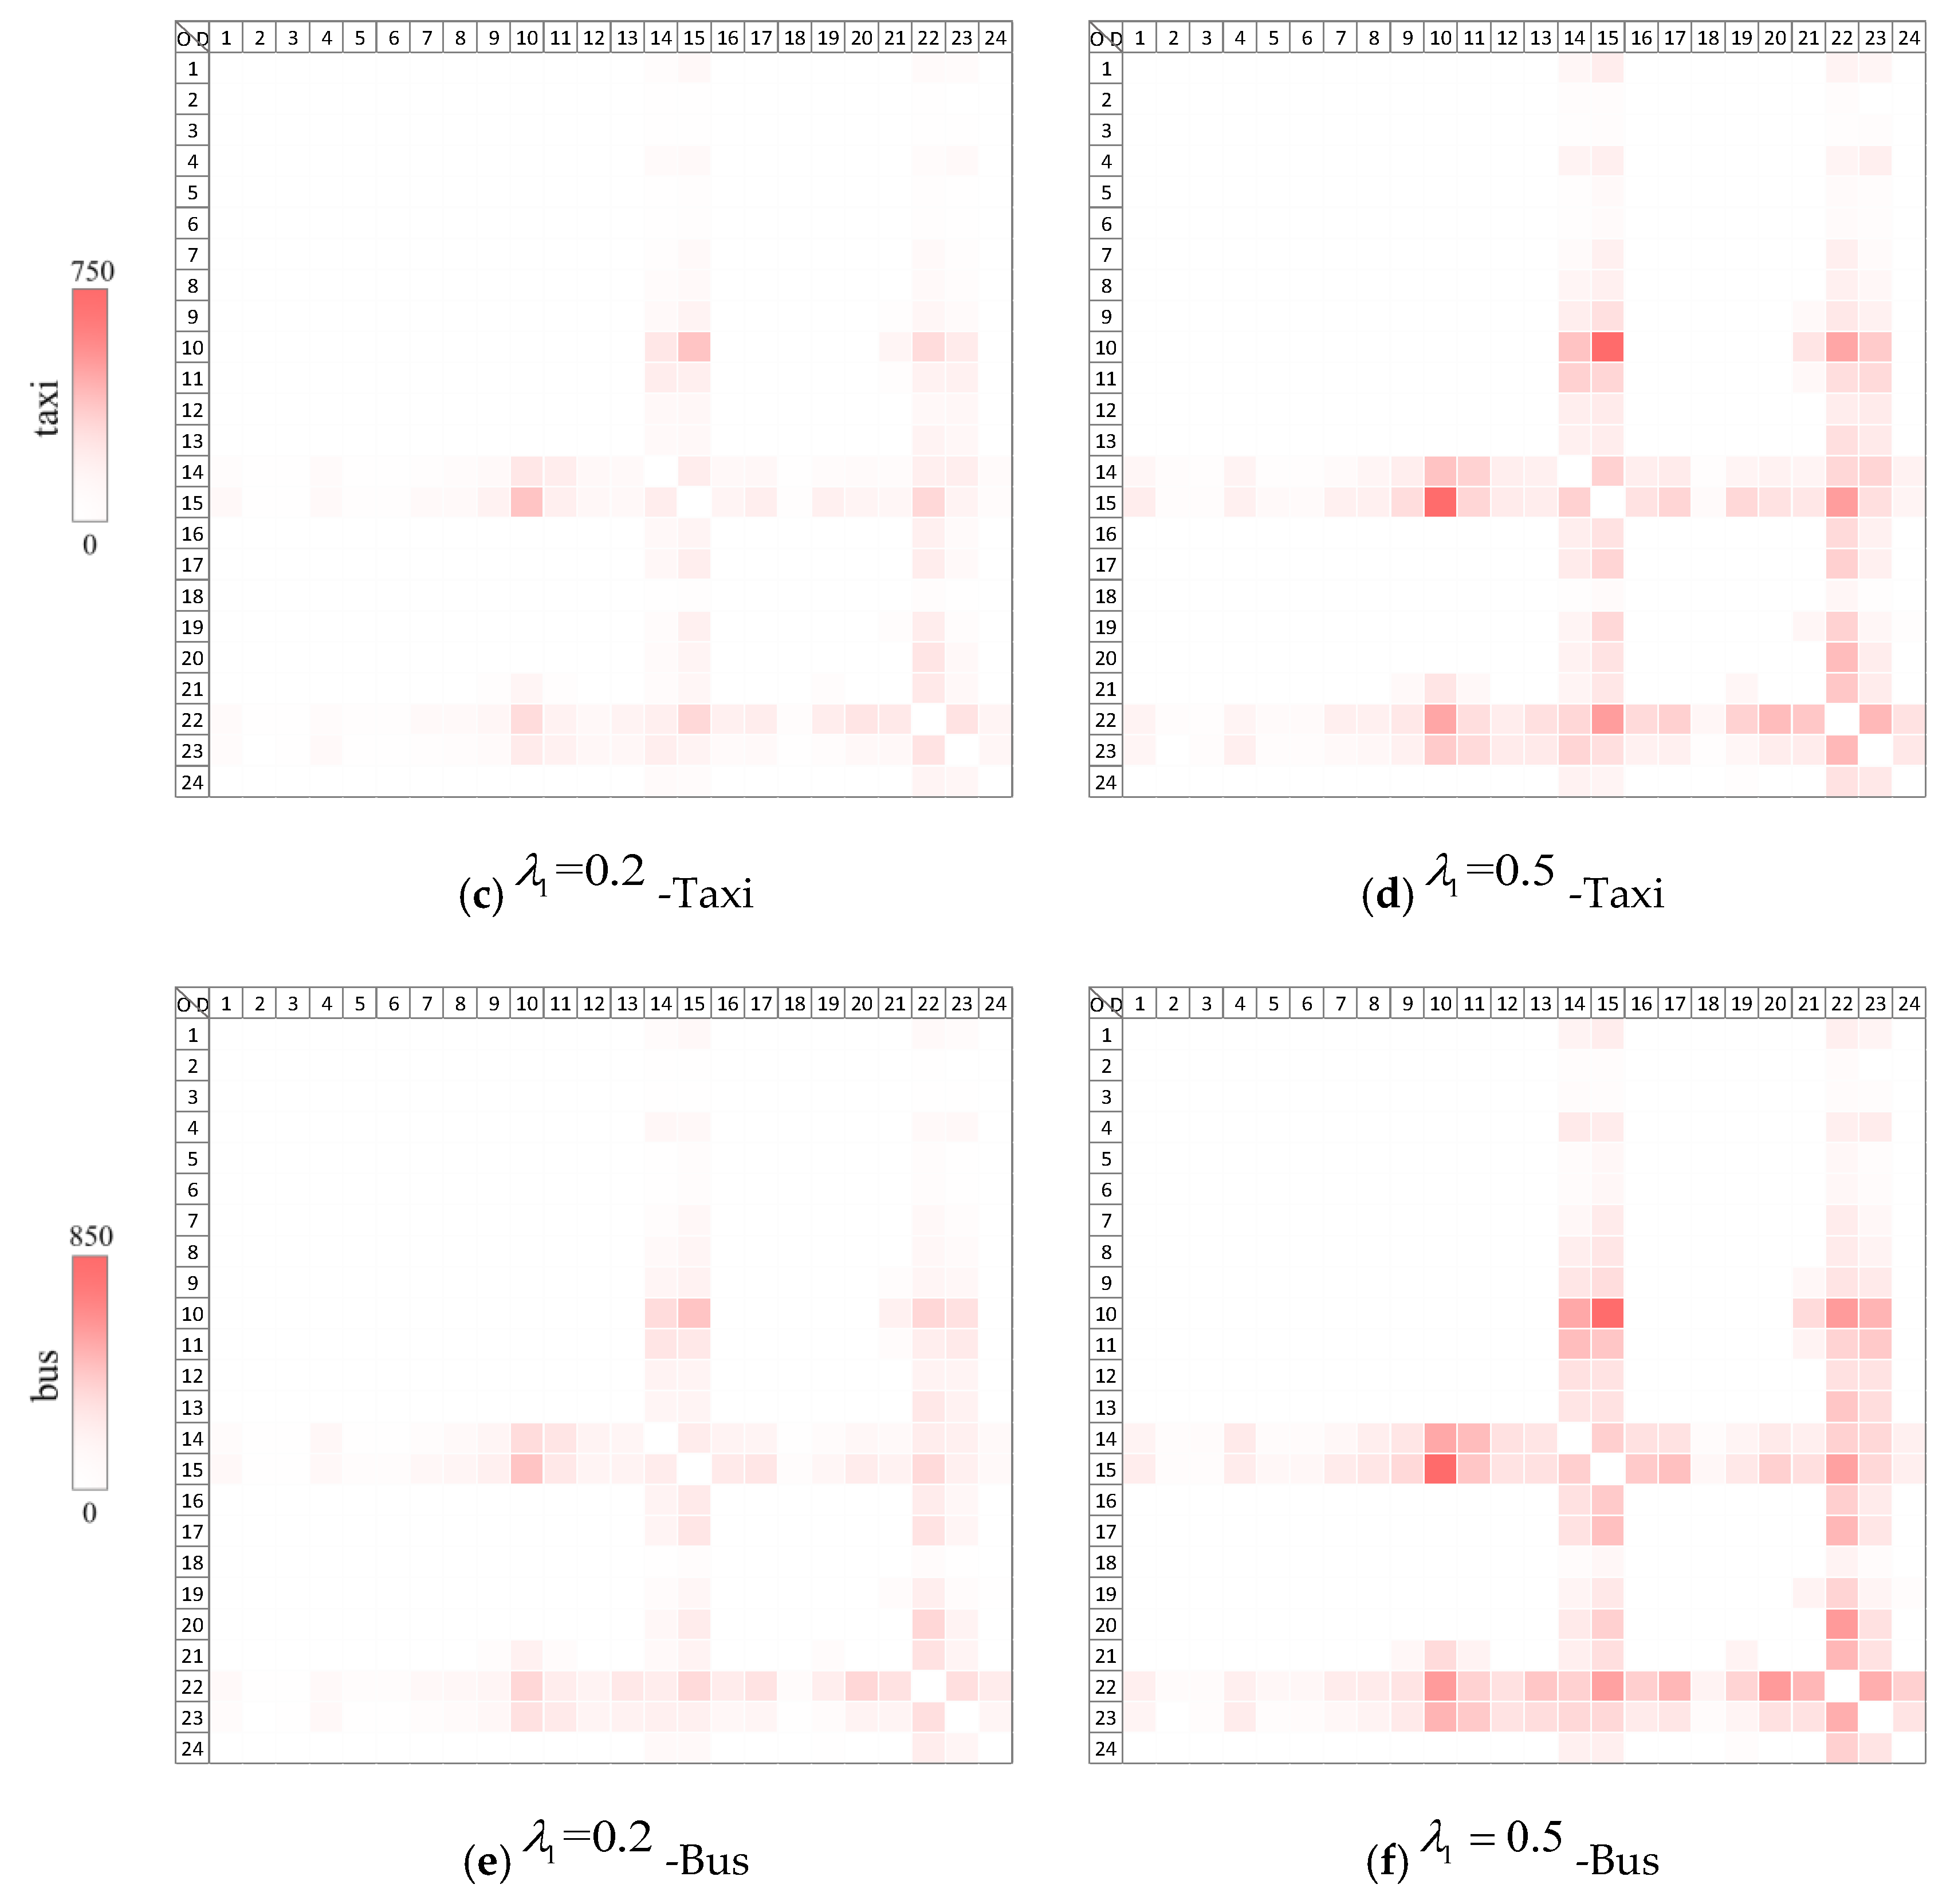
Based on the steps of solving traffic demand, the shift of traffic demand under traffic restriction is calculated as Figure 6.
From Figure 6, traffic demand of private car reduces, whereas traffic demand of taxi and bus increases after short-term traffic restriction. It is indicated that part of private cars are restricted, and traffic demand shifts from private cars to taxi and bus. Besides, the nodes with large mode shift are concentrated in the restricted area. Travelers reselect traffic modes considering the expanded travel consumption caused by traffic restriction, so traffic demand of trips in which both origin and destination are not located in the restricted area is also changed.
From the perspective of restricted proportion, shift of traffic demand under λ 1 = 0.5 is larger than that under λ 1 = 0.2 . This indicates there are a higher quantity of restricted private cars and higher shift of traffic demand under higher restricted proportion. By comparison between taxi and bus, traffic demand shift of bus is larger than that of taxi. It shows that travel consumption of bus is less than that of taxi with the set parameter in Table 4. When private cars are restricted, buses have the larger probability to be selected as an alternative traffic mode.
To further verify the effectiveness of the proposed model which takes detour rate and mode shifting rate into account, the traditional model that assumes traffic demand and is not affected by detour is compared. M0 represents equilibrium state before traffic restriction, M1 represents equilibrium state solved by proposed model, and M2 represents equilibrium state solved by traditional model under traffic restriction. The difference on traffic demand of car and traffic flow on links, which is calculated by M2-M1, is shown in Figure 7 and Figure 8.
From Figure 7, traffic demand of ten ODs in M2 is larger than M1. It is indicated that travel trips by private car generating from these ODs needs to detour after traffic restriction. Detour rate and mode shift rate are considered in M1, therefore, part of traffic demand shifts from private car to taxi and bus. However, there is no shift of traffic demand in M2. Comparing Figure 7a with Figure 7b, the gap of traffic demand between M1 and M2 increases with the expand of restricted proportion.
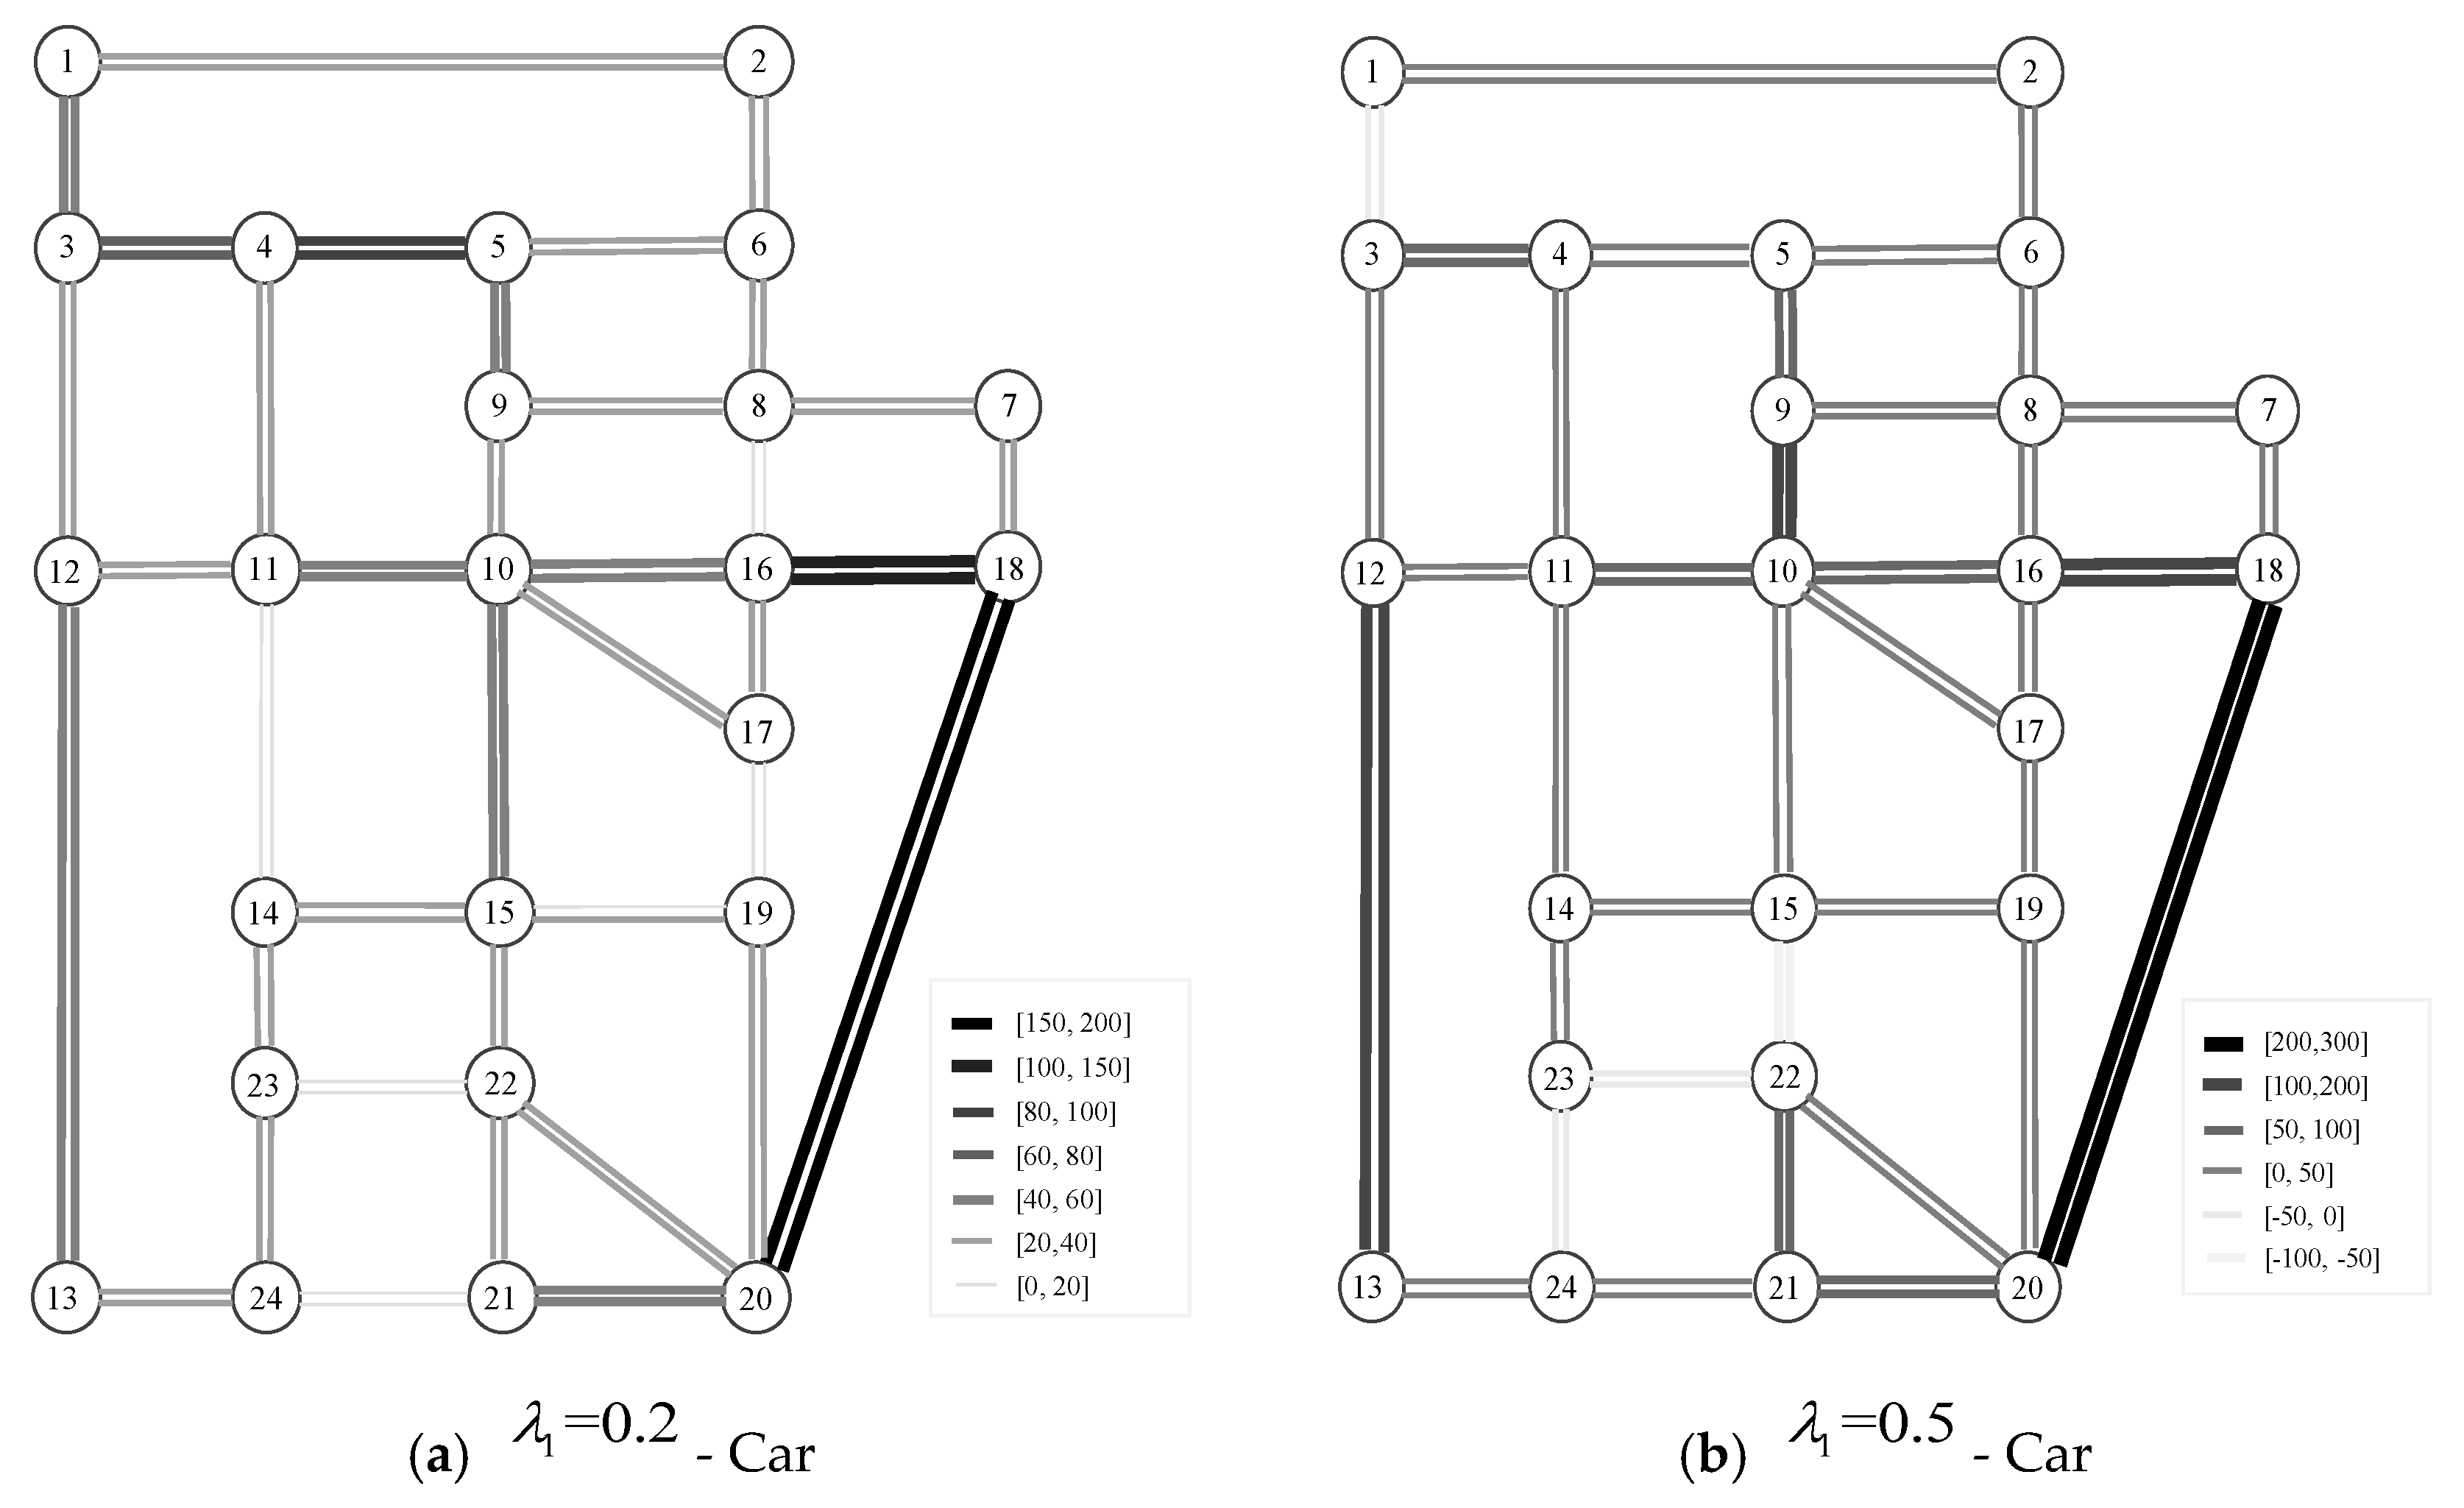
From Figure 8, similar to traffic demand, link traffic flow of cars in M2 is also larger than that in M1. Besides, the gap of link traffic flow between M1 and M2 increases with the expansion of restricted proportions.
From the above analysis, traffic restriction with mode shifting leads to the reduced traffic demand of private cars and the increased traffic demand shifting to taxis and buses, with further results in the reduced traffic flow on links. Consequently, traffic restriction has the potential to decrease the total exhaust emission (TEE) and total energy consumption (TEC). To verify it, TEE including CO2, NOx, and TEC are calculated by referring to the emission and consumption indexes of traffic modes, which are calibrated by United States Environment Protection Agency [19]. The results of TEE and TEC under scenarios including M0, M1 and M2 are summarized in Table 5, in which the evaluation indexes are presented as percentages.
From Table 5, it is obvious, as expected, that both TEE and TEC of M1 are less than those of M0 and M2; and the larger the value of restricted proportion, the more decrease. TEE and TEC of M1 are reduced by about 5% and 11% compared with M0, under λ 1 = 0.2 and λ 1 = 0.5 respectively. This finding indicates that traffic restriction is effective on reducing TEE and TEC of transportation system, and the effectiveness increases with restricted proportion. Compared with M2 when λ 1 = 0.2 , M1 improves the precision of M2 on the evaluation of TEE and TEC by a degree of more than 4.5%, while the improvements under λ 1 = 0.5 are about 2.5%. This result indicates that the proposed equilibrium model considering mode shift due to detour is verified to perform better in TEE and TEC than the traditional equilibrium model without mode shift. Moreover, the precision of M2 is close to that of M1 under a strict traffic restriction policy so that the traffic is in good condition. It is reasonable because the detour under a good traffic condition usually costs shorter time than that under a congested one. Hence, the bias caused by the ignorance of detour is diminished under a higher restricted proportion. However, the restricted proportion of 0.2 is more commonly used than 0.5, and this fact highlights the practical significance of the proposed model in accurate evaluation of beneficial effectiveness of traffic restriction on sustainability of the traffic environment.
To further explain the effectiveness of detour rate on process of equilibrium assignment, the OD from 21 to 11 which needs to detour under traffic restriction is selected as an example. The original travel route of OD 21-11 with minimum travel consumption is 21-22-15-11. After traffic restriction, five alternative routes are extracted and traffic flow is assigned into these routes. The route flow of alternative routes in M1 and M2 are shown in Table 6.
Table 6 shows that M1 and M2 have the same alternative routes where the detour rate reaches about 3.0 after traffic restriction. It indicates that the detour route takes triple of the original travel consumption, if private car is still selected as traffic mode. Under this condition, travelers tend to choose other alternative modes for saving consumption. However, route flow in M2 is still high, even with a large detour and increased travel consumption. It is obviously unreasonable. By comparison, route flow in M1 reduces to nearly 1/4 of M2, reflecting that traffic demand shifts from private car to other alternative modes under a large detour and high consumption. The result proves that the proposed model considering detour and mode shift accords with the actual condition.

4.3. Parametric Sensitivity Analysis

From the above analysis, mode shift rate in this study is obtained by calculating the ratio of travel consumption of private car, taxi and bus after traffic restriction. Therefore, parameters shown in Table 4 could determine travel consumption and affect mode shift rate. To further study the effectiveness of parameters on mode shift rate, parameters in Table 4 are adjusted in reasonable ranges and the maximum shift rate of private car is set as the calculating indicator. The maximum shift rate of private car with various parameters is shown in Figure 9.
From Figure 9, the maximum shift rate is monotonous for all kind of parameters. When the purchase cost of private car (Figure 9a), use cost of taxi (Figure 9c), use cost of bus (Figure 9d), wait time of taxi (Figure 9e) and wait time of bus (Figure 9f) increases, maximum shift rate of private car reduces. For taxis and buses, increased use cost and wait time induce an increase of travel consumption and decrease of attraction. For private cars, high purchase cost cuts down the comparative advantage of buses and taxis on travel consumption and reduces travelers’ willingness to change traffic modes. Different from the above five parameters, maximum shift rate of private cars reduces with the increasing use cost of private cars (Figure 9b). When use cost of private cars increases, the gap of travel consumption between private cars, taxis and buses is further broadened. Travelers are more willing to change their traffic modes for saving travel consumption at this time.
From the sensitivity of shift rate to parameters, use cost of private cars is the primary factor affecting shift rate, especially under the condition of a large detour rate. Besides, use cost of taxis also significantly affects the shift rate of private cars. By contrast, shift rate is not sensitive to purchase cost of a private car, or wait time of taxi or bus. All of the three parameters determine the fixed consumption of private car, taxi and bus in each trip, but are not related to detour distance. Accordingly, travel consumption is subtly affected by these three parameters and shift rate is not sensitive to them.

5. Conclusions

This study analyzes the short-term effectiveness of temporary traffic restriction on traffic equilibrium. Traffic consumptions of all types of traffic modes are calculated and alternative routes of restricted private cars are reselected under traffic restriction. Then, the detour rate and mode shifting rate are determined to update the structure of traffic demand. To obtain the traffic flow on links, we propose a stochastic user equilibrium model under traffic rationing based on mode shifting rate and the corresponding solution algorithm. Finally, a numerical experiment based on the Sioux Falls network is conducted to verify the effectiveness of the proposed model and algorithm, and sensitivity analysis is developed to further study the effectiveness of parameters used in the model on mode shift rate.
From the results of the case study, the main conclusions are made as follows:
(1)
Trips whose origin and destination not located in a restricted area are also affected by traffic restriction. Large detours and huge consumption of private cars caused by traffic restriction prompt traffic demand to shift from private car to taxi and bus.
(2)
The proposed stochastic user equilibrium model is proved to be realistic to reflect the mode shift caused by traffic restriction, especially under the condition with a large detour rate.
(3)
When traffic restriction is implemented, reducing wait time and use cost of taxi and bus can effectively guide traffic demand to shift from private car to taxi and bus. Besides, use cost of private car is the primary factor in determining the mode shifting rate. The achievements of this study have significant reference for the implementation of traffic restriction and evaluation of link flow under traffic restriction. Furthermore, the proposed stochastic user model can obviously improve the estimated accuracy of exhaust emission and energy consumption, and precisely evaluate the beneficial effectiveness of traffic restriction on the sustainability of the traffic environment.
Furthermore, even some achievements have been made in exploring the effectiveness of short-term traffic restriction on traffic equilibrium, but some limitations still exist and are worth further study. Mode shift rate in this study is determined only by travel consumption composed of travel time and travel cost, but ignored the effects of other factors on travel demand structure, such as travel comfort of traffic modes, accessibility of public mode, parking problem of private cars, taxis and buses. Future studies can collect the traffic demand and link flow under actual traffic restriction, and can further consider the above factors when analyzing the traffic demand structure, so as to modify the model proposed in this study.

Author Contributions

Conceptualization, X.W. and W.W.; Formal analysis, X.W.; Methodology, X.W. and X.H.; Project administration, W.W. and X.H.; Resources, Y.X.; Software, X.W. and W.Y.; Visualization, W.Y.; Writing—original draft, X.W. and W.Y.; Writing—review and editing, X.W., W.W. and Y.X. All authors have read and agreed to the published version of the manuscript.

Funding

This research was supported by National Natural Science Foundation of China (no. 51878166 and no. 71801042), Scientific Research Foundation of Graduate School of Southeast University (no. YBJJ1837) and Jiangsu Graduate Research Innovation Program (no. KYCX18_0134).

Acknowledgments

The authors are grateful to reviewers for their constructive comments.

Conflicts of Interest

The authors declare no conflict of interest.

References

  1. Mohan, D.; Tiwari, G.; Goel, R.; Lahkar, P. Evaluation of Odd–Even Day Traffic Restriction Experiments in Delhi, India. Transp. Res. Rec. J. Transp. Res. Board 2017, 2627, 9–16. [Google Scholar] [CrossRef]
  2. Li, C.; Chen, J.; Guo, J.; Wang, S. Analysis on Impacts of Car-using Restriction on Travel Behavior. J. Transp. Syst. Eng. Inf. Technol. 2008, 8, 73–77. [Google Scholar]
  3. Eskeland, G.S.; Feyzioglu, N.T. Rationing Can Backfire: The “Day without a Car” in Mexico City. World Bank Econ. Rev. 1997, 11, 383–408. [Google Scholar] [CrossRef]
  4. Davis, L.W. The Effect of Driving Restrictions on Air Quality in Mexico City. J. Political Econ. 2008, 116, 38–81. [Google Scholar] [CrossRef] [Green Version]
  5. Guerra, E.; Millard-Ball, A. Getting around a license-plate ban: Behavioral responses to Mexico City’s driving restriction. Transp. Res. Part D Transp. Environ. 2017, 55, 113–126. [Google Scholar] [CrossRef]
  6. Gallego, F.; Montero, J.-P.; Salas, C. The Effect of Transport Policies on Car Use: Theory and Evidence from Latin American Cities. J. Public Econ. 2013, 107. [Google Scholar] [CrossRef]
  7. Davis, L.W. Saturday Driving Restrictions Fail to Improve Air Quality in Mexico City. Sci. Rep. 2017, 7, 41652. [Google Scholar] [CrossRef] [PubMed] [Green Version]
  8. Liu, J. Study on the Influence of the TDM Policies on Urban Transportation Structure. Master’s Thesis, Beijing Jiaotong University, Beijing, China, 2008. [Google Scholar]
  9. Wang, L.; Xu, J.; Qin, P. Will a driving restriction policy reduce car trips?—The case study of Beijing, China. Transp. Res. Part A Policy Pr. 2014, 67, 279–290. [Google Scholar] [CrossRef]
  10. Jiang, Y. Study on System Optimization Based on Travel Mode Choice and Traffic Policies. Master’s Thesis, Beijing Jiaotong University, Beijing, China, 2016. [Google Scholar]
  11. Shi, F.; Xu, G.-M.; Liu, B.; Huang, H. Optimization method of alternate traffic restriction scheme based on elastic demand and mode choice behavior. Transp. Res. Part C Emerg. Technol. 2014, 39, 36–52. [Google Scholar] [CrossRef]
  12. Li, Q. The Impact of Bus Service Levels and Driving Restriction Policy on the Stability Domain and Dynamical Characteristics. Master’s Thesis, Beijing Jiaotong University, Beijing, China, 2016. [Google Scholar]
  13. Uncles, M.K. Discrete Choice Analysis: Theory and Application to Travel Demand. J. Oper. Res. Soc. 2017, 370–371. [Google Scholar] [CrossRef]
  14. Leurent, F. Cost versus time equilibrium over a network. Eur. J. Oper. Res. 1993, 71, 205–221. [Google Scholar] [CrossRef]
  15. Liu, Z.; Meng, Q. Distributed computing approaches for large-scale probit-based stochastic user equilibrium problems. J. Adv. Transport. 2013, 47, 553–571. [Google Scholar] [CrossRef]
  16. Dial, R.B. A probabilistic multipath traffic assignment model which obviates path enumeration. Transp. Res. 1971, 5, 83–111. [Google Scholar] [CrossRef]
  17. Bell, M.H.G. Alternatives to Dial’s logit assignment algorithm. Transp. Res. Part B Methodol. 1995, 29, 287–295. [Google Scholar] [CrossRef]
  18. Transportation Networks for Research Core Team. Transportation Networks for Research. Available online: https://github.com/bstabler/TransportationNetworks (accessed on 28 June 2019).
  19. Average Annual Emissions and Fuel Consumption for Gasoline-Fueled Passenger Cars and Light Trucks: Emission Facts; United States Environmental Protection Agency, Office of Transportation and Air Quality: Washington, DC, USA, 2008.
Figure 1. Classification of ODs under traffic restriction.
Sustainability 12 05433 g001
Figure 2. Changes of alternative routes set for ODs belonging to O O .
Sustainability 12 05433 g002
Figure 3. Framework of analysis on traffic demand, traffic consumption and route selection.
Sustainability 12 05433 g003
Figure 4. (a) Topology of base network; (b) Initial traffic demand of base network.
Sustainability 12 05433 g004
Figure 5. (a) Traffic flow under traffic equilibrium before restriction; (b) The location of traffic restricted area.
Sustainability 12 05433 g005
Figure 6. Shift of traffic demand for private car, taxi and bus under traffic restriction.
Sustainability 12 05433 g006aSustainability 12 05433 g006b
Figure 7. Difference of traffic demand between M2 and M1 under traffic restriction.
Sustainability 12 05433 g007
Figure 8. Difference of link traffic flow between M2 and M1 under traffic restriction.
Sustainability 12 05433 g008
Figure 9. Sensitivity analysis of shift rate to parameters used in proposed model.
Sustainability 12 05433 g009aSustainability 12 05433 g009b
Table 1. Symbolic representation used in traffic equilibrium assignment model.
SymbolDefinitionAdditional Notes
m A traffic mode--
M Set of traffic modes m M
I I Set of ODs whose origin and destination are both located in restricted area W = I I I O O O I I I O = Ø I I O O = Ø I O O O = Ø
I O Set of ODs in which one of origin and destination is located in restricted area
O O Set of ODs whose origin and destination are both located out of restricted area
q w 0 m Traffic demand of mode m before traffic restriction q w 0 = m M q w 0 m
λ Proportion of restricted private cars account for total private cars λ ( 0 , 1 )
q w i Traffic demand of type i after traffic restriction q w i 0
P w i Set of alternative travel routes for type i traffic demand between OD w p P w i
p p i Probability of being selected for route P p p i [ 0 , 1 ]
p w m c Probability of being selected for mode m to replace private car p w m c [ 0 , 1 ]
f p i Traffic flow generated from type i traffic demand on route P f p i 0
x l i Traffic flow generated from type i traffic demand on link l x l = i I x l i , l L
t l m ( ) Function for calculating travel time of mode m on link l--
t l i Travel time of type i traffic demand on link l t l i = t l m ( x l )
t p i Travel time of type i traffic demand on route P t p i = l δ l p t l i
β m Additional time of mode m in single trip β m 0
τ ¯ w i The minimum travel time of type i traffic demand between OD w τ w i = min { t p i | w W , p P w i }
v Unit time value of travelers v > 0
α m Use cost of unit time for mode m α r > α c > α b
α c 0 Purchase cost of private car in single trip α c 0 > 0
c p i Travel consumption of type i traffic demand on route P c p i > 0
c ^ p i Estimated travel consumption of type i traffic demand on route P c ^ p i = c p i 1 θ ξ p
Φ w i Expected minimum travel consumption of type i traffic demand between OD w Φ w i = min { c p i | w W , p P w i }
Table 2. The change of traffic demand structure after traffic restriction.
ModeBefore RestrictionReduced DemandIncreased DemandAfter Restriction
Private Car q w 0 c λ γ q w 0 c -- ( 1 λ γ ) q w 0 c
Taxi q w 0 r -- λ γ q w 0 c p w r c q w 0 r + λ γ q w 0 c p w r c
Bus q w 0 b -- λ γ q w 0 c p w b c q w 0 b + λ γ q w 0 c p w b c
Table 3. Travel consumption and route choice after short-term traffic restrictions.
TypeTraffic DemandLink Travel TimeRoute SetRoute Travel TimeEstimated Travel ConsumptionProbability of Route Choice
c q w c , w W t l c , l L P w c t p c c ^ p c p p i i I , p P w i
c c q w c c , w O O t l c c , l L O P w c c t p c c c ^ p c c
r q w r , w W t l r , l L P w r t p r c ^ p r
r c q w r c , w W c ^ p r c
b q w b , w W t l b , l L B P w b t p b c ^ p b --
b c q w b c , w W c ^ p b c --
Table 4. Basic parameters for numerical experiment.
Parameter α c 0 α c α r α b β γ β b
Value50 RMB/trip0.4 RMB/min1.5 RMB/min0.1 RMB/min5 min10 min
Table 5. Total exhaust emission and energy consumption under various scenarios.
λ 1 = 0.2 λ 1 = 0.5
CO2 (kg)NOx (kg)TEC (ton)CO2 (kg)NOx (kg)TEC (ton)
M079.79426.632879.79426.6328
M175.81405.9226.670.65379.0324.79
M275.99406.8326.6670.87380.1924.87
(M0-M1)/M04.98%4.86%4.98%11.45%11.16%11.46%
(M0-M2)/M04.76%4.64%4.76%11.17%10.89%11.17%
(M2-M1)/(M0-M2)4.56%4.58%4.56%2.53%2.49%2.53%
Table 6. Demand assignment results comparison for a certain OD 21-11.
Routes (M1 and M2)Detour RateRoute Flow
M1M2M1M2
121-20-18-16-102.7402.7699.93333.723
221-20-19-15-103.0263.0429.01630.604
321-24-13-12-3-4-5-9-103.1153.1318.98230.352
421-22-20-18-16-103.1573.1858.20127.844
521-20-18-16-17-103.3733.3968.09327.477