Article

The Effects of Multiple Factors on Elderly Pedestrians’ Speed Perception and Stopping Distance Estimation of Approaching Vehicles

1
Department of Psychology and Behavioral Sciences, Zhejiang University, Hangzhou 310027, China
2
Center for Psychological Sciences, Zhejiang University, Hangzhou 310027, China
3
Department of Systems and Industrial Engineering, University of Arizona, Tucson, AZ 85721, USA
*
Author to whom correspondence should be addressed.
Sustainability 2020, 12(13), 5308; https://doi.org/10.3390/su12135308
Submission received: 19 May 2020 / Revised: 18 June 2020 / Accepted: 26 June 2020 / Published: 30 June 2020

Abstract

:
To make safe road-crossing decisions, it is necessary for pedestrians to accurately estimate the speed and stopping distance of approaching vehicles. Accordingly, the objective of our study was to examine the effects of multiple factors, such as weather conditions, context time (day or night), and illuminance of the roads, on older pedestrians’ (>60 years old) speed perception and stopping distance estimation of approaching vehicles. The participants in this study included 48 older participants who were asked to estimate the speed and stopping distance of approaching vehicles based on 12 s video clips that were selected from natural conditions. The results revealed that actual speeds, weather, context time, and lighting conditions played important roles in the performance of the participants. Compared with young adults, older pedestrians were found to have smaller accurate estimation intervals that varied by multidimensional influencing factors and thus resulted in missing road-crossing opportunities at lower vehicles’ speeds and increasing road-crossing dangers at higher speeds. The older pedestrians’ performance with respect to speed perception and stopping distance estimation is modeled using a regression model with a complex level of tasks. These models can be used by engineers when establishing speed limits and lighting conditions in the areas with senior residents.

1. Introduction

According to a WHO report, approximately 270,000 pedestrians worldwide were killed in 2010, accounting for 22% of the total fatalities resulting from traffic accidents [1]. In urban China, crossing streets has become a necessary activity as well as an essential skill for all citizens. This normal activity requires that pedestrians make immediate decisions based on approaching vehicles and their own mobility [2]. This is a highly challenging task for the older people of China, who make up an extremely vulnerable population of pedestrians using the roads [3,4]. A report from the Zhejiang Public Security Bureau (a Chinese province) showed that, in 2016, more than 1500 pedestrians over the age of 60 were involved in road-crossing accidents, which accounts for 36.4% of the total number of traffic accidents that year [5].
Visual, cognitive, and motor abilities, which are known to decline with age, are necessary for the task of crossing the street [6]. Data further indicate that adults over 60 years of age are more likely to sustain serious injuries than younger adults [2,3,7,8]. Consistent with this, several studies of road-crossing decisions have concluded that older people make more dangerous decisions, e.g., smaller gap acceptance, shorter time-to-collision estimation, etc., than do younger people, particularly in complex traffic environments [6,7,9,10,11,12,13,14,15] and that these decisions are associated with a decline in physical and cognitive functions [2,6,13,16,17].
In studies on pedestrian crossing safety, it has been determined that a vehicle’s approaching speed has a great effect on the selected gaps between pedestrians and approaching vehicles [11,18]. In some studies [17,19,20], selecting gaps mainly based on distance increases unsafe crossing decisions when the approaching vehicles are traveling at high speeds because the time available for crossing is overestimated. Moreover, shorter gap distances associated with lower speeds lead older pedestrians to decide not to cross and to miss safe crossing opportunities [21]. A study further determined that training older pedestrians on speed estimation improves their ability to make more accurate gap-acceptance decisions [22]. Thus, we hypothesized that the poor ability to estimate the speeds of approaching vehicles may explain why older pedestrians lose road-crossing opportunities at lower vehicle speeds while increasing road-crossing dangers at higher speeds.
However, there remains a lack of research regarding the ability of older pedestrians to correctly assess the speed of approaching vehicles. With respect to younger pedestrians, Troscianko et al. [23] conducted a study in real traffic in which 10 participants were asked to estimate the speed of the vehicles from an interior site and found that the participants significantly underestimated vehicle speed. Sun et al. [19] extended the study in a naturalistic traffic environment and explored some environmental factors related to speed and stopping distance estimation. They found that actual speed and weather had an effect on subjective speed and stopping distance estimations. The results also indicated that the pedestrians made estimation errors at different speed ranges and influencing weather factors. Thus, one of the objectives of our study was to explore the speed perception of approaching vehicles by older pedestrians and the degree to which environmental factors impacted speed estimation.
Environmental factors such as time, weather, and illuminance of the road may influence one’s perception of speed. Compared with daytime estimation, the nighttime estimation ability of pedestrians is more important and useful as the poor light at night may cause more traffic accidents [24,25,26,27]. Furthermore, regarding night conditions, previous studies have indicated that older pedestrians are at greater risk of road-crossing accidents and pay more attention to safety precautions [28,29]. Therefore, we offer the following hypothesis:
Hypothesis 1.
Under the conditions of night, older pedestrians will be more conservative and less likely to underestimate vehicle speed.
Horswill and Plooy [30] investigated the effect of reducing image contrast on speed perception in a simulated experiment and found vehicle speeds appear slower in reduced contrast conditions. Under rainy conditions, the heavy gloomy sky and raindrops block the pedestrian’s line of sight [30], thus reducing the contrast. Therefore, we offer the following hypothesis:
Hypothesis 2.
Older pedestrians will perceive the speed of an approaching vehicle as slower under rainy conditions than under sunny ones.
Researchers have found a strong association between traffic accidents and road lighting conditions [31], but cognitive research conducted in the laboratory indicates that the degree of luminance across a visual scene influences one’s perception of speed (e.g., [32,33,34,35,36]). Similar findings were also found under actual driving conditions [37,38]. Thus, we offer the following hypothesis:
Hypothesis 3.
In conditions of lower illumination at night time, pedestrians will perceive the speed of approaching vehicles to be slower than it actually is, and therefore, they will be more likely to underestimate the vehicle’s speed.
Stopping distance, also called braking distance, is “the amount of travel required to bring the vehicle to a full stop given the current deceleration” [39]. The ability to accurately estimate a vehicle’s stopping distance is not only important for drivers [39,40,41], but it is also important for pedestrians as they must make safe street-crossing decisions, especially in emergent situations [19]. Street-crossings based on gap distance are safe in most circumstances. First, pedestrians have already left a buffer in their critical gaps to have a larger safety margin [42], which means the safety margin is large enough for pedestrians to cross the road safely. Second, pedestrians usually assume that drivers maintain or decrease their speeds upon seeing them. Thus, the available gap becomes sufficiently large enough for the pedestrian to make a safe decision. Nevertheless, in some emergent situations, such as rainy conditions with reduced friction coefficients between the tires and the road, which increases braking distance, if the approaching vehicle is traveling too fast, pedestrians who are determined to cross the street could expend the buffer zone even if the vehicle brakes for them. Therefore, the ability to make safe estimations, i.e., accurate or overestimations, of vehicle stopping distances is also critical. Similar to the speed estimation survey, the following factors are incorporated into the current work to investigate their effects on stopping distance estimation: Weather, time, and illuminance of the road. With respect to stopping distance estimations, we offer the following hypotheses:
Hypothesis 4.
Older pedestrians will underestimate the stopping distance of approaching vehicles at night.
Hypothesis 5.
Older pedestrians will underestimate the stopping distance of approaching vehicles during rainy conditions.
Hypothesis 6.
Older pedestrians will underestimate the stopping distance of approaching vehicles under conditions of lower illumination at night time.
Consequently, a projector-based experiment was conducted to extend the findings of Sun et al. [19] to older pedestrians and three environmental factors were incorporated into our study, namely, weather, road nighttime illuminance, and context time.

2. Method

2.1. Participants

The 48 older participants were divided into two weather condition groups: The sunny group (14 women, MAge = 65.4 years, SD = 4.2 years; and 10 men, MAge = 70.8 years, SD = 4.9 years) and the rainy group (14 women, MAge = 66.4 years, SD = 5.3 years; and 10 men, MAge = 68.7 years, SD = 5.2 years). All participants had at least nine years of formal education and had no traffic accidents after the age of 60. None of the participants in this study possessed a license. The participants engaged in a street-crossing related interview (see Appendix A) and were administered a vision test prior to the formal experiment.

2.2. Experimental Design

We designed a 2 (weather: Sunny or rainy) * 2 (context: Site_1/site_2) * 2 (context time: Day or night) mixed design projector-based laboratory experiment, see Table 1. To avoid fatigue effect, the variable weather was designed as a between-subject variable while the others were within-subject variables.
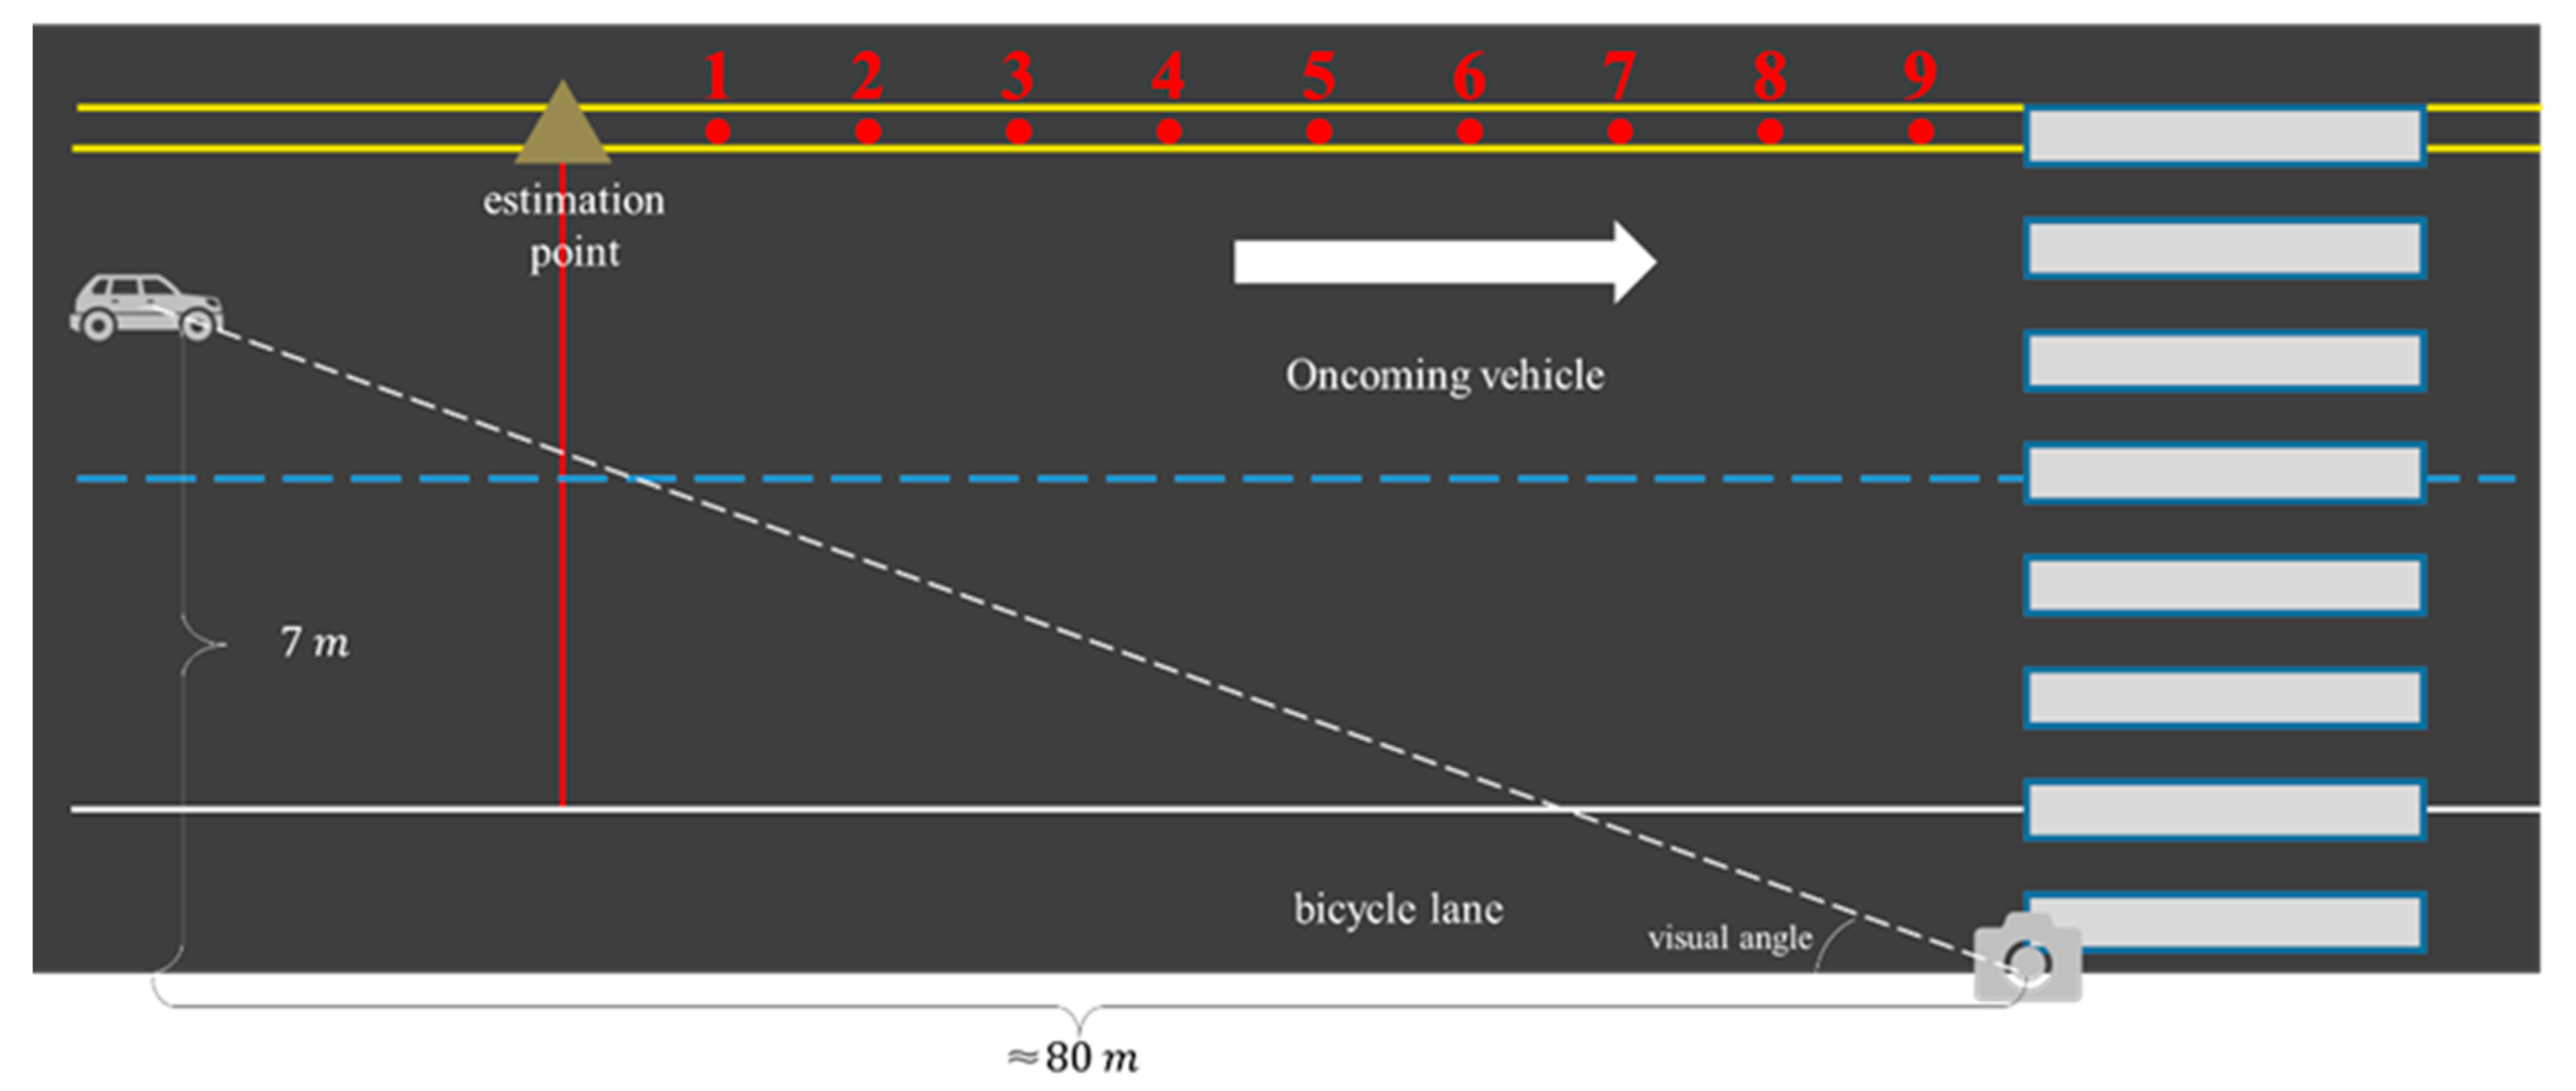
The simulated street-crossing scenarios (2 weather conditions × 2 sites × 2 time conditions = 8 scenarios) were prerecorded on two real streets using a high-resolution digital camera (SONY FDR-AX40 4K camera) set at the height of the eyes of the pedestrians (height: 1.45 m; visual angle (visual angle = arctan (vertical distance between camera and target vehicle)/(horizontal distance between camera and target vehicle) = arctan (7 m)/(80 m) ≈ 5°): 5 degrees between the roadside and the camera). Both of the prerecorded rural roadway scenarios consisted of two straight travel lanes on each side. The two roadways were quite similar other than the considerable difference in light intensity at night (average illuminance: 12 lux for site_1 and 30 lux for site_2). The weather included completely sunny and moderately rainy conditions, according to the real-time weather forecast. The accurate velocity of each approaching vehicle ranged from 25 to 70 km/h and was measured using a Bushnell 10–1921 radar gun with an accuracy of ±1.6 km/h.
A three-hour video of each scenario, a total of 24 h video, was recorded both at midday (11:00 a.m. to 2:00 p.m.) and at night (9:00 p.m. to 12:00 p.m.), and then edited into a series of clips in which there was only one approaching vehicle on the screen. For each scenario, the vehicle’s velocity was divided into nine levels at increments of 5 km/h. Two clips were selected for each speed level, one for the speed estimation task and one for the stopping distance estimation task. In all, 18 clips for each scenario were selected as the material for the formal experiment. Because older pedestrians experience more difficulty making safe crossing decisions when the approaching vehicles are in the far lane [7], the approaching vehicles chosen in our experiment were all in the far lane. In addition, as vehicle color had no effect on speed perception in the Sun et al. experiment [19], we recorded vehicle color as a control variable.
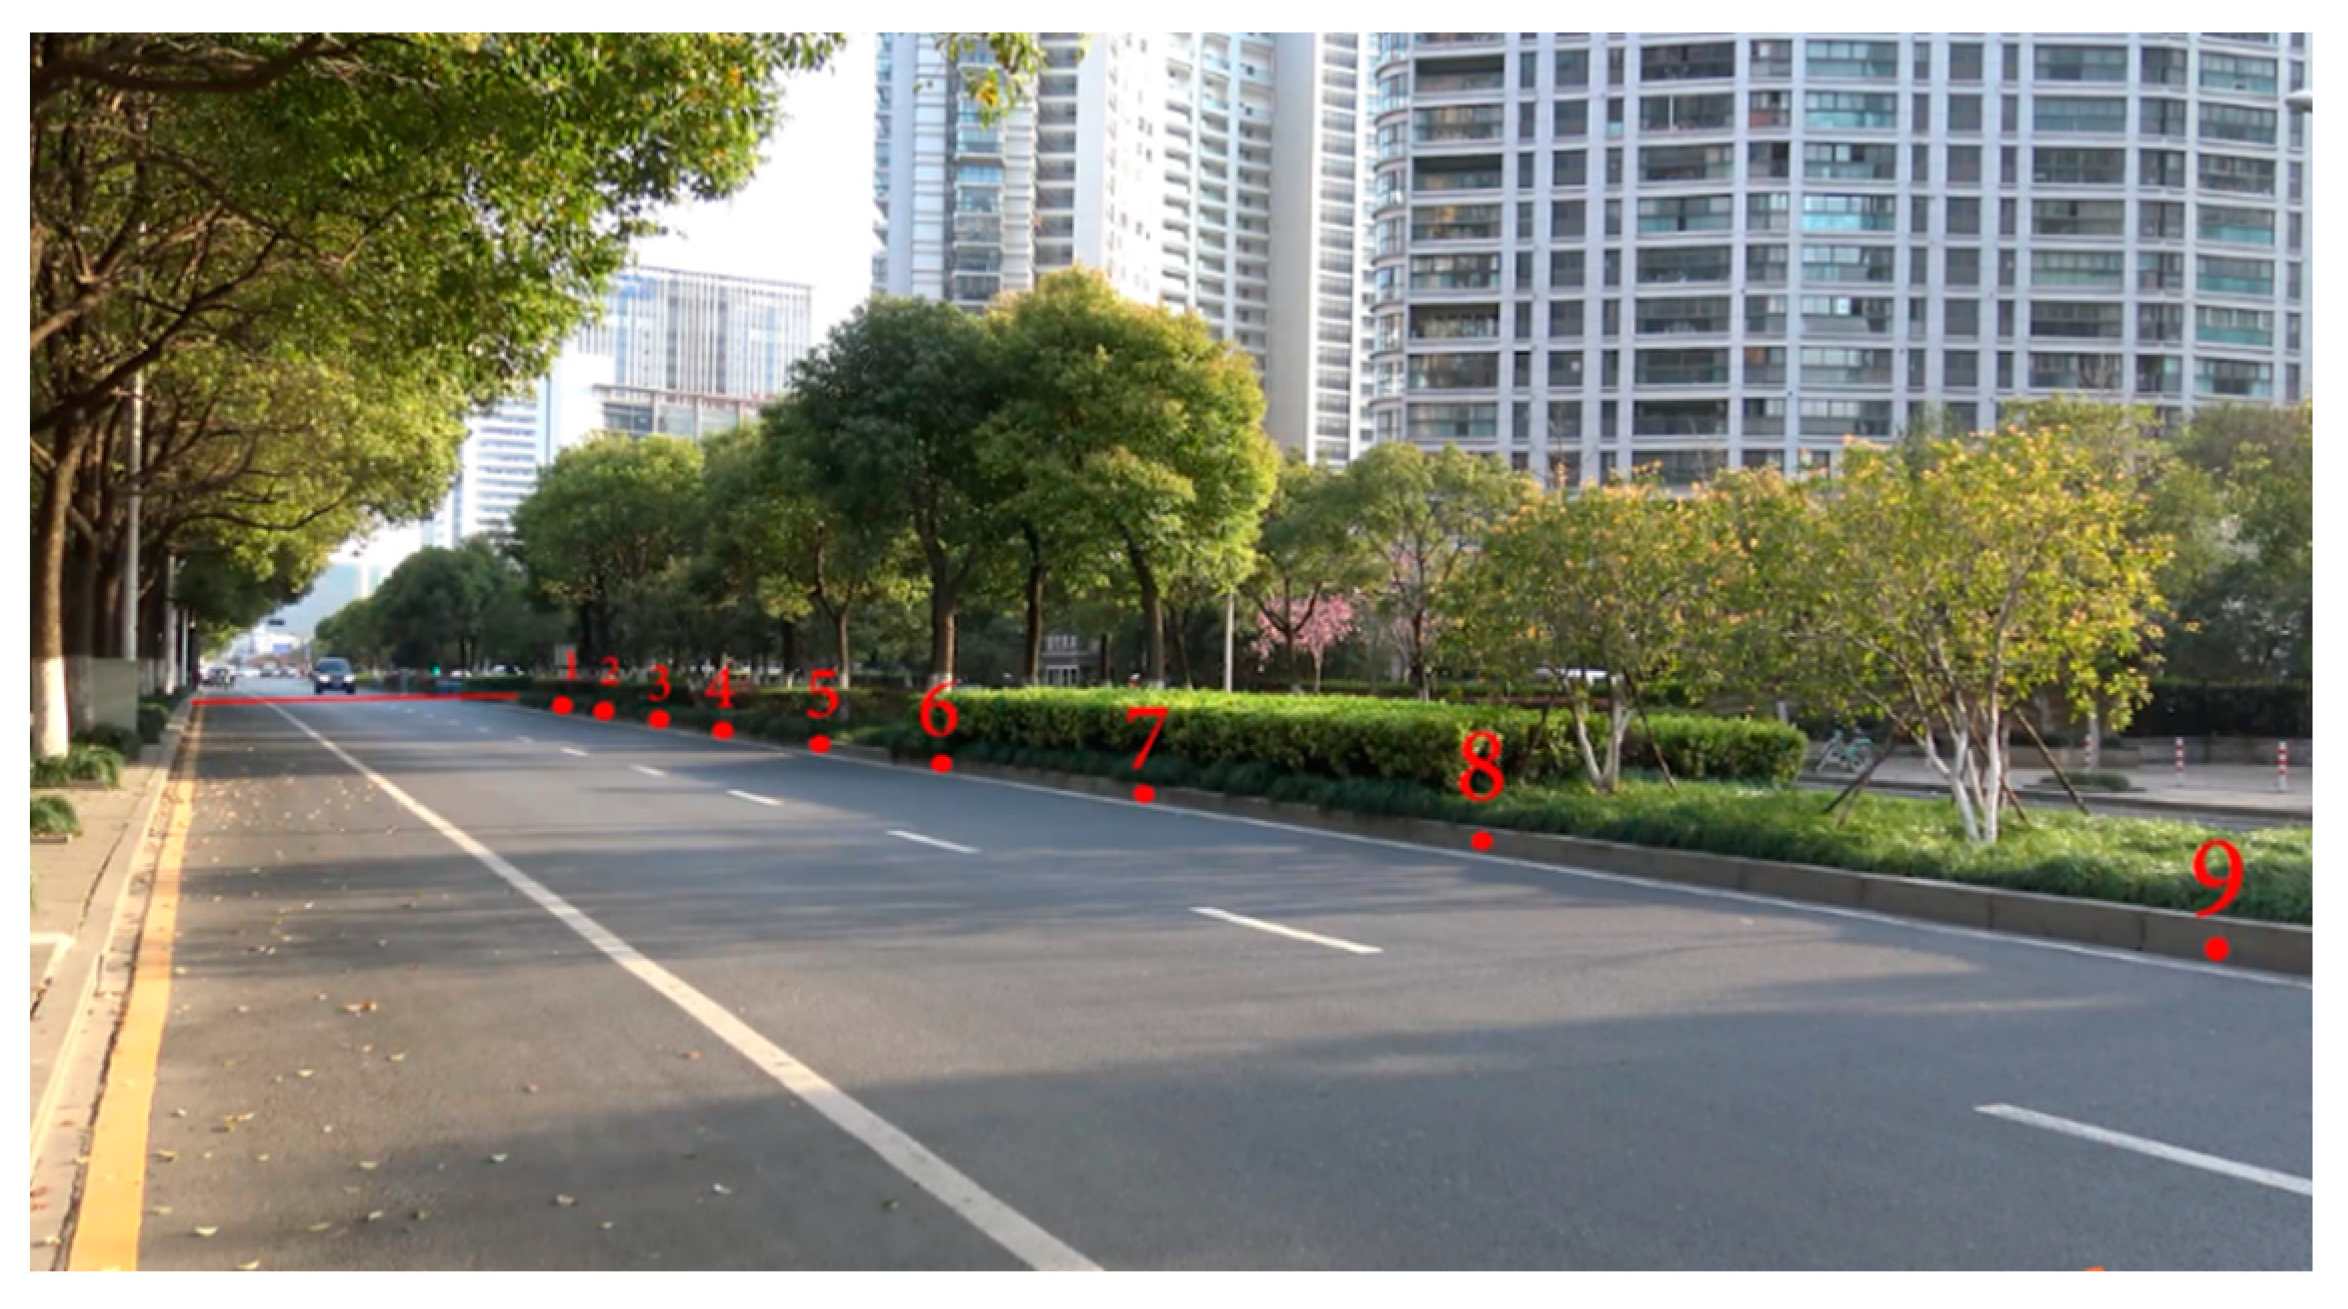
A 50 m point was chosen according to prior experiments to investigate the effects of the viewing distance on speed estimation [19]. We labeled the 50 m point using a red line on the video. We also used the numbers 1 through 9 to mark the stopping distance points for the same interval, as displayed in Figure 1 and Figure 2. The video was presented via a projector with 720P resolution in a darkroom. The distance between the screen and standpoint of the participants was approximately 4 m, meaning that the field of vision could span the whole image (3 × 2.5 m) of the video.

2.3. Procedure

First, we explained to the participants that their task was to watch one short video clip at a time and observe the approaching vehicle in each video. When the approaching vehicle arrived at the estimation point (for 3–4 s, the video did not stop), the participants were asked to estimate and verbally state either the vehicle’s speed or its stopping distance, according to the experimenter’s instructions before the vehicles’ arrival. In the stopping distance estimation task, participants had to imagine the car stopping suddenly as if the car would have yielded for them, and then estimate the stopping position using numbers 1 to 9. Before the experiment, participants signed informed consent forms that had been approved by the ethics committee. Participants then completed three practice video clips (37 km/h for sunny-day-site_1, 54 km/h for sunny-night-site_2 and 42 km/h for rainy-day-site_2) as an introduction to the experiment. In the formal experiment phase, which lasted 45 min, each participant completed 72 total trials. An estimation strategy-related interview was also conducted, see Appendix B.
The actual vehicle stopping distance was calculated using the following equation [38]:
s = k ( v 2 0.5 φ g t k ) 2 φ g
where S is the actual stopping distance, k is the braking torque/braking force function coefficient, v is the actual vehicle speed, φ is the tire/road interface coefficient of adhesion, and g is the gravitational acceleration [43,44].

3. Results

Speed estimation results and stopping distance estimation results are presented in Section 3.1 and Section 3.2, respectively. For each, a descriptive analysis of the observation was conducted, followed by an ANOVA of the contributing factors affecting estimation bias.

3.1. Speed Estimation

3.1.1. Descriptive Analysis

The descriptive statistics for speed estimation are represented in Table 2. The average actual speed was 47.4 km/h, while the estimated speed was slightly lower at 46.4 km/h, resulting in an average underestimation of 1.0 km/h. Due to the difference in speed perception or expectation, participants exhibited different tendencies in eight scenarios. For rainy and day conditions, site_1 participants had an average overestimation of 1.73 km/h, t (215) = 2.07, p < 0.05, Cohen’s d = 0.28. Nevertheless, for similar conditions in site_2, there were no overestimations or underestimations. Under both sunny and rainy night conditions in site_2, the average estimated speed was generally lower, thus leading to an average underestimation of 3.84 km/h, t (215) = −5.19, p < 0.001, Cohen’s d = 0.71 and 3.24 km/h, t (215) = −3.81, p < 0.01, Cohen’s d = 0.52, whereas regarding site_1, no such underestimation occurred.
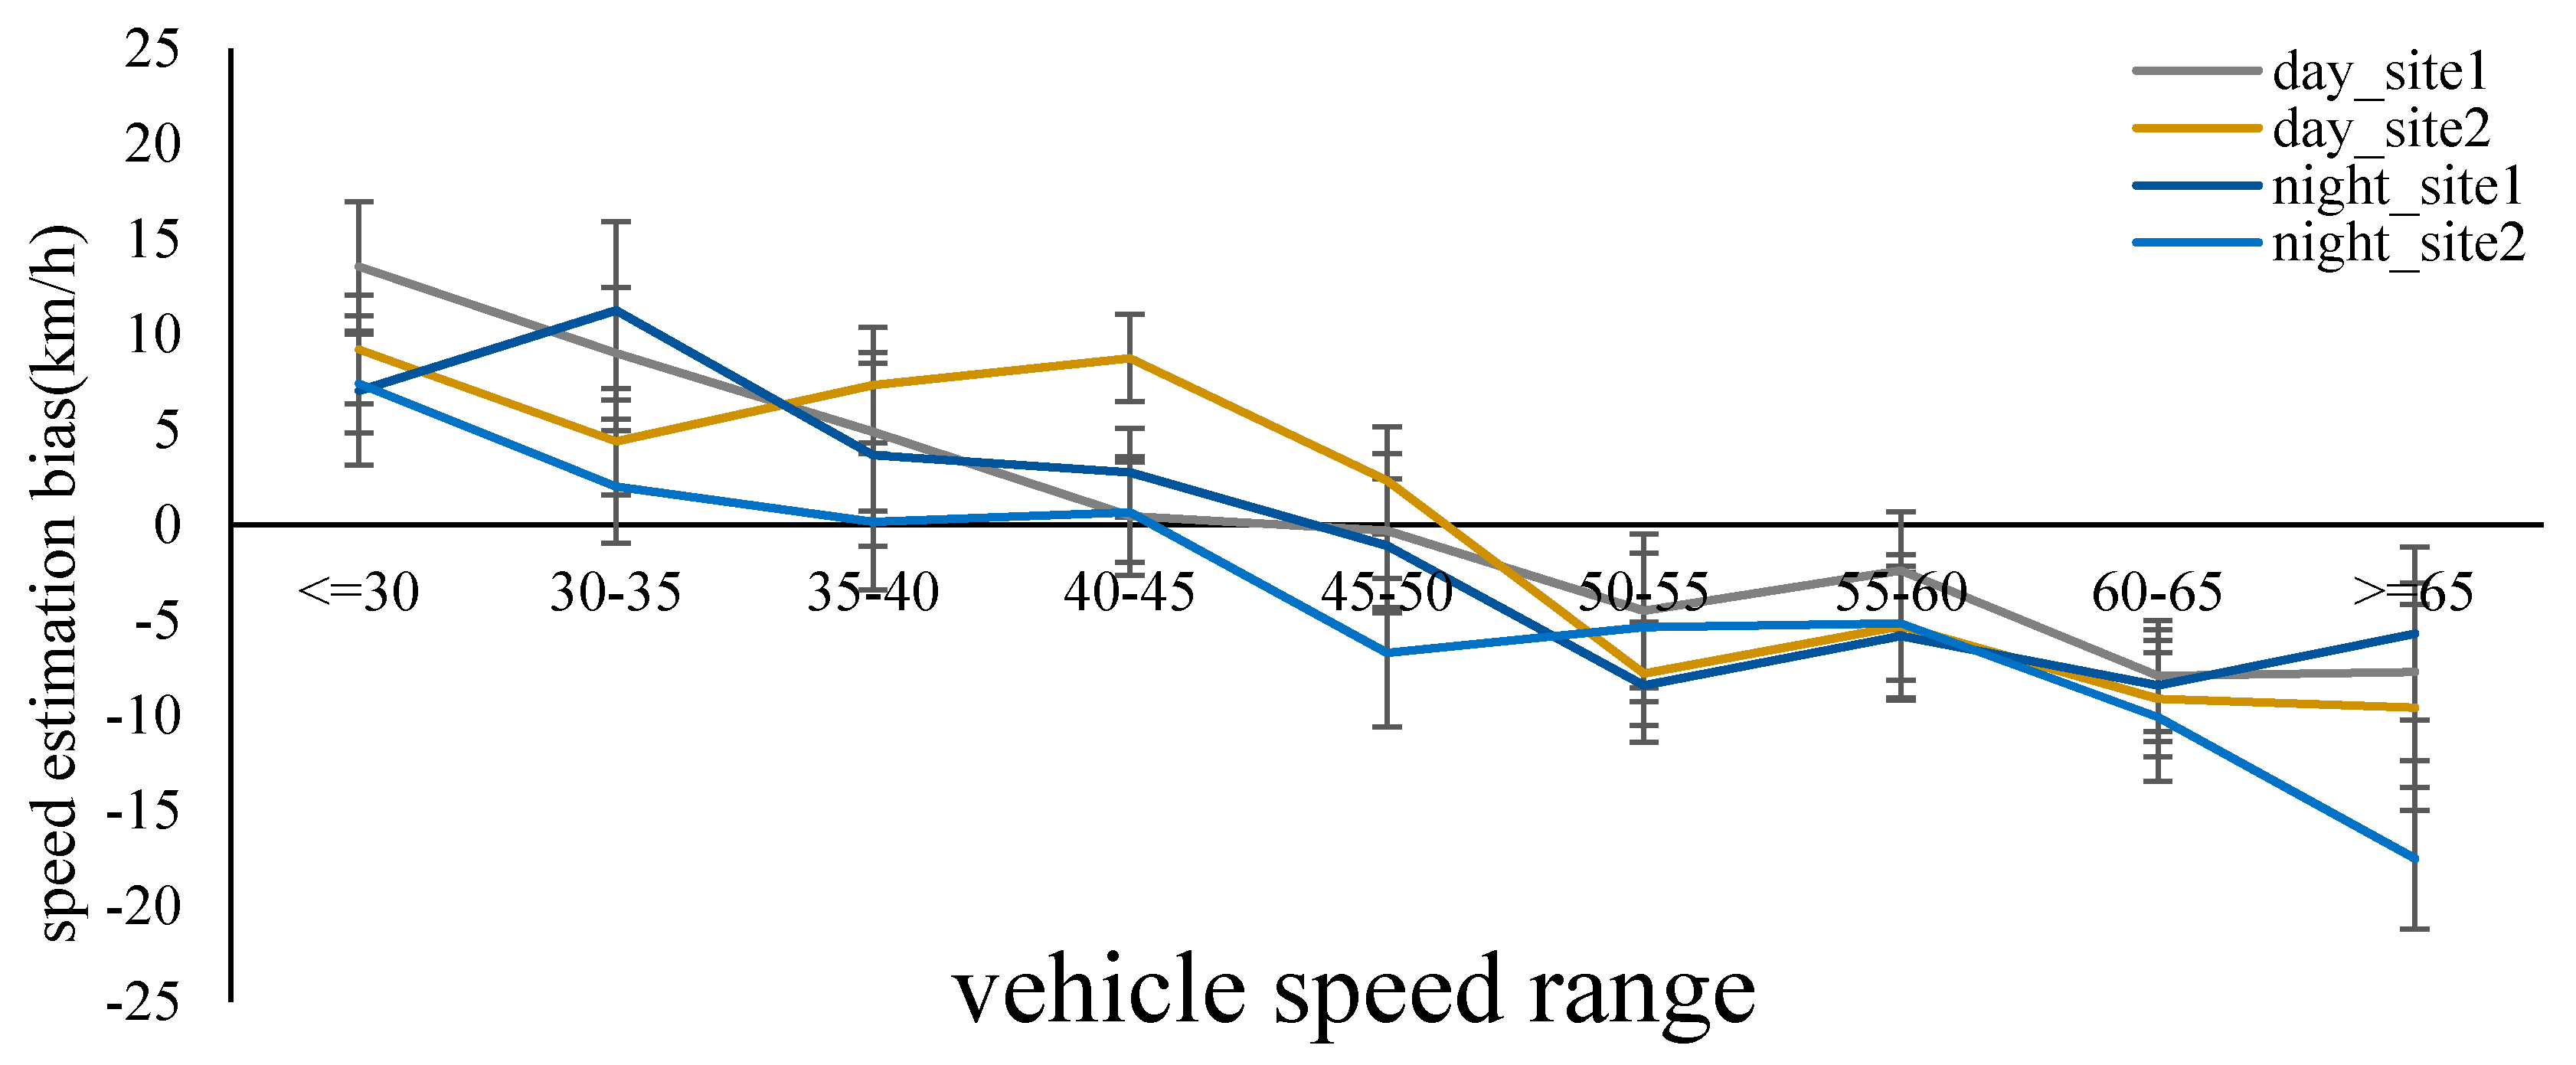
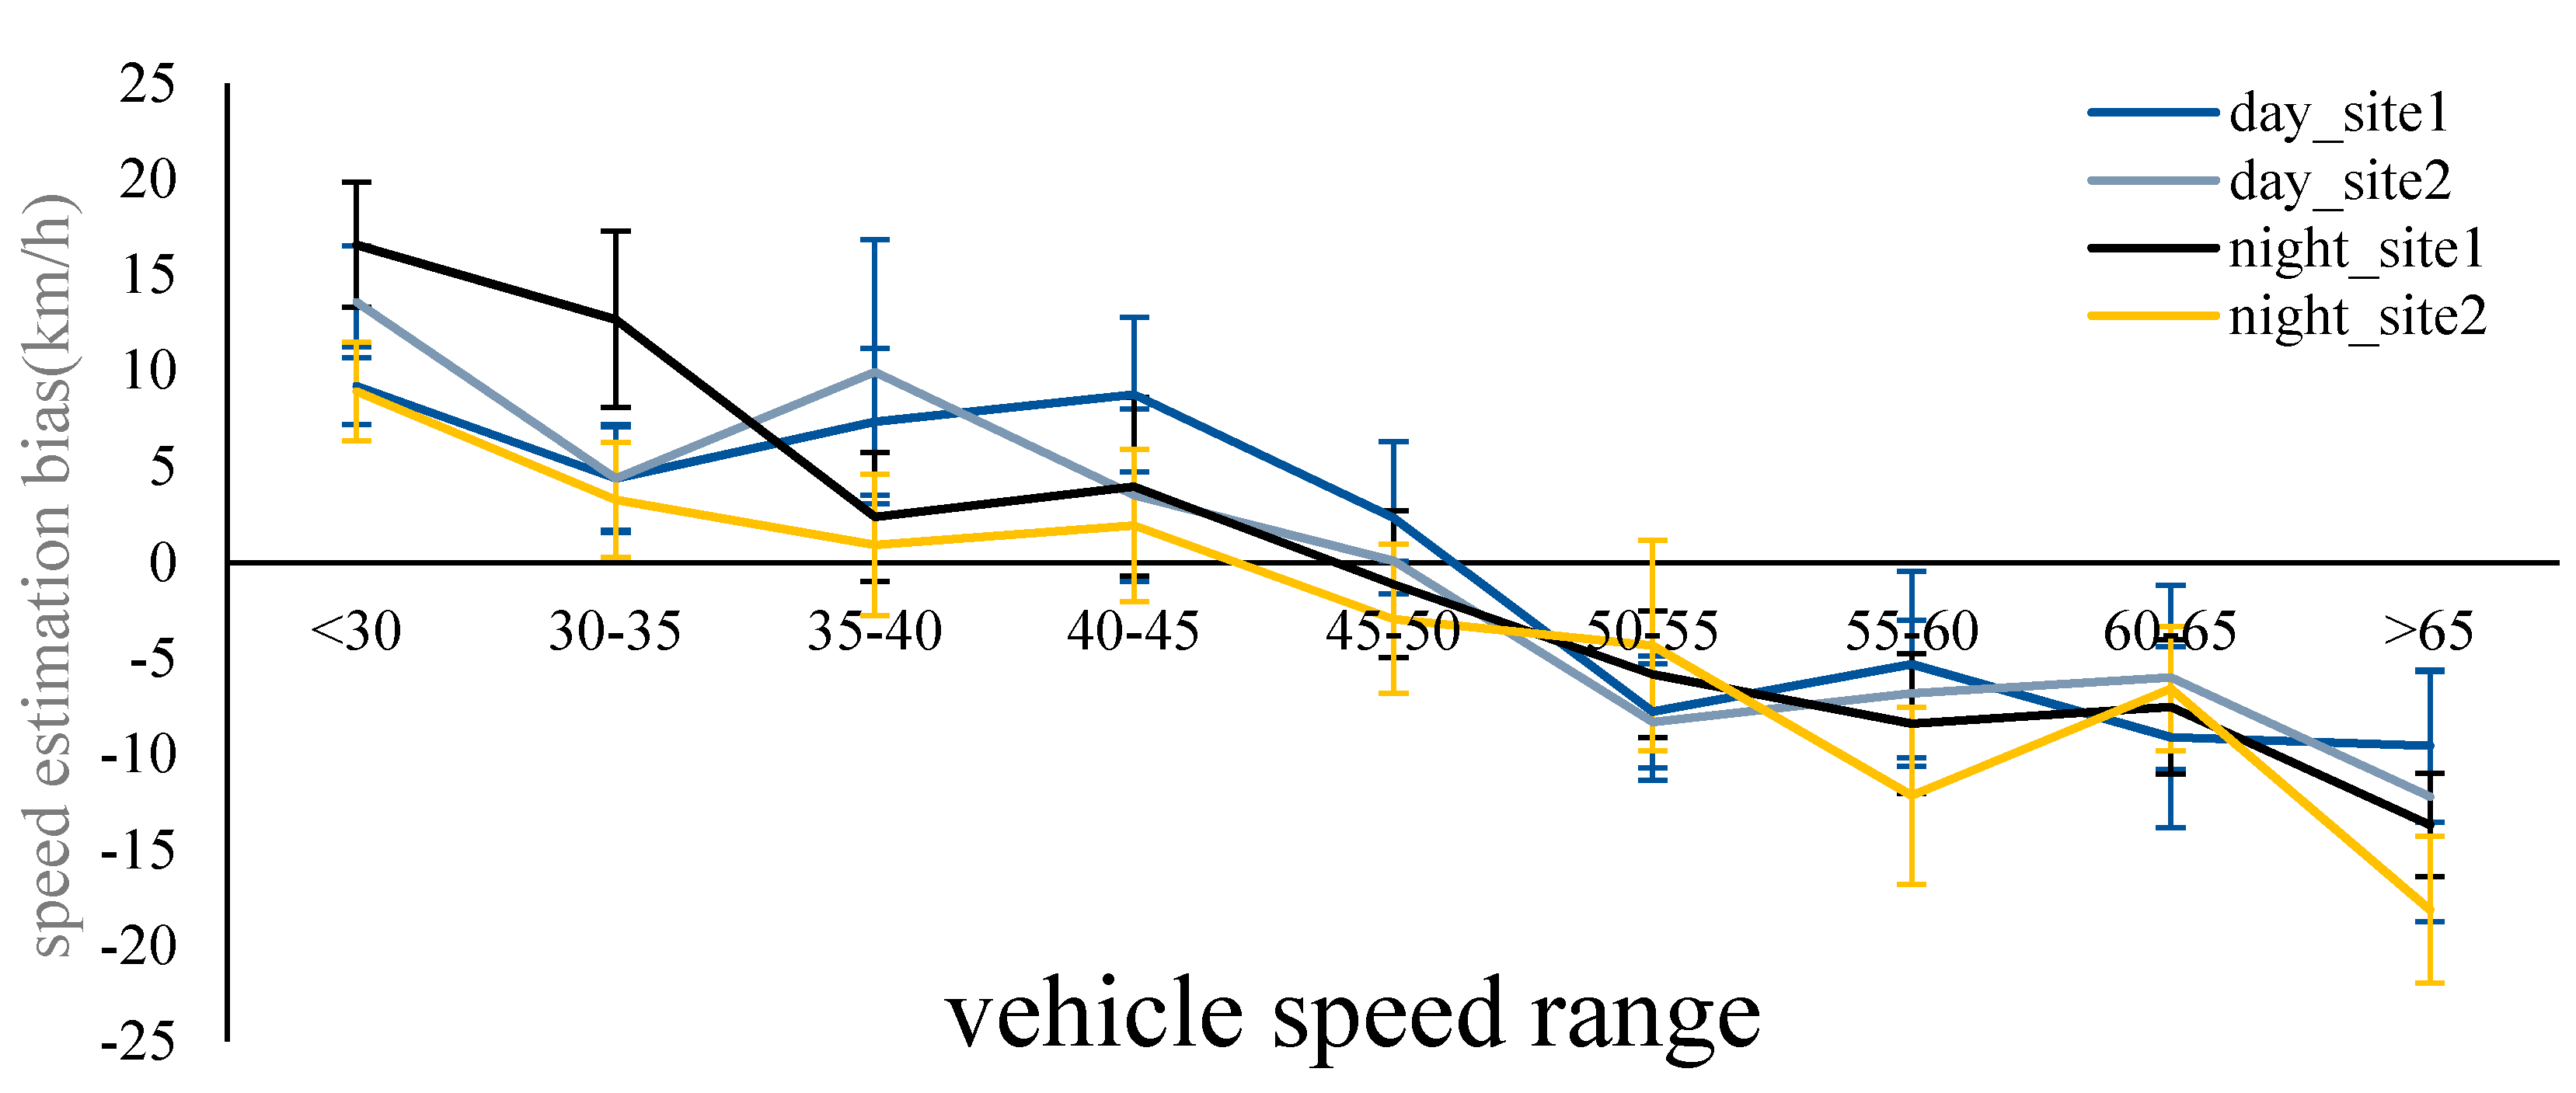
To obtain the speed range of accurate and inaccurate estimations, the actual speed was divided into nine groups at increments of 5 km/h. The general tendency of speed estimation bias was to overestimate at lower vehicle speeds and underestimate at higher vehicle speeds. However, the accurate speed range of the participants varied significantly according to the different scenarios, see Figure 3 and Figure 4.
A general analysis reveals that under sunny conditions, people overestimated vehicle speed when the speed did not exceed 35 km/h with ts > 6.27, ps < 0.01. However, when actual speed exceeded 50 km/h, the participants greatly underestimated the vehicle speed, ts < −6.70, ps < 0.01. Given rainy conditions, the accurate speed range was quite smaller. When the actual vehicle speed was less than 45 km/h, participants greatly overestimated the speed of the vehicle, ts > 5.17, ps < 0.01, but when the actual speed exceeded 55 km/h, pedestrians greatly underestimated the speed of the vehicle, ts < −5.66, ps < 0.01.
Specifically, with respect to sunny conditions, each scenario was quite different. Given the day condition, the accurate speed ranges for site_1 and site_2 were similar, (40 to 50 km/h) for site_1 and (45 to 50 km/h) for site_2. Considering the night conditions, regarding lower speeds, the participants were more likely to overestimate for site_1 (lower than 45 km/h) than for site_2 (lower than 30 km/h). Conversely, when the actual speeds exceeded 50 km/h, pedestrians greatly underestimated for site_1, ts < −5.39, ps < 0.01, while the threshold was 45 km/h for site_2. This may be due to the illuminance effect on speed perception. Under darker conditions, decreased vision caused participants to be more conservative.
With respect to rainy day conditions, the accurate speed ranges for site_1 and site_2 were similar, (45 to 50 km/h) for site_1 and (40 to 50 km/h) for site_2. At night, the accurate speed range (35 to 55 km/h) at site_2 (lower illuminance) was much greater than site_1 where the accurate speed range was 45 to 50 km/h. It is noted that when the speed of the approaching vehicles was lower (<40 km/h), participants were more likely to overestimate when the degree of illuminance was lower.

3.1.2. ANOVA Analysis

The descriptive analysis revealed speed estimation bias in different scenarios. However, the influence of the speed of the vehicle and the three environmental factors on the errors in estimation is unknown. Hence, a mixed-design ANOVA in which speed (nine levels), time, and site were within-subject variables and weather was a between-subject variable was conducted.
The ANOVA revealed that weather had no significant effect on the speed estimation bias, F (1, 46) = 0.72, p > 0.05, which means that there was no difference between rainy and sunny conditions with respect to speed estimation. However, the main effect of time was significant, F (1, 46) = 15.86, p < 0.001, indicating that older pedestrians lowered their speed estimation expectation and were more likely to underestimate vehicle speed at night. Furthermore, the main effect of speed was significant, F (1, 46) = 467.33, p < 0.001, η2 = 0.70, which means that when the vehicle was traveling faster, the participants were more likely to underestimate the speed of the vehicle speed, a factor that increases the degree of danger to the older pedestrian.
The site also had a significant effect on speed estimation bias, F (1, 46) = 32.87, p < 0.001, η2 = 0.27. Considering that site_1 and site_2 are different in terms of luminance at night, we analyzed the day and night conditions separately using a paired sample t-test. The results revealed that only at night was there a significant different estimation bias between the two sites, t (863) = 2.75, p < 0.01, Cohen’s d = 0.19, thus indicating that lighting plays an important role in estimating vehicle speed. Specifically, lighter conditions lead to greater underestimations of speed compared to darker conditions.

3.2. Stopping Distance Estimation

The ability to make safe estimations (accurate or overestimations) of vehicle stopping distances is important for older pedestrians. Thus, we only focus on the speed range of the underestimations in our study, as this may lead to dangerous situations.

3.2.1. Descriptive Analysis

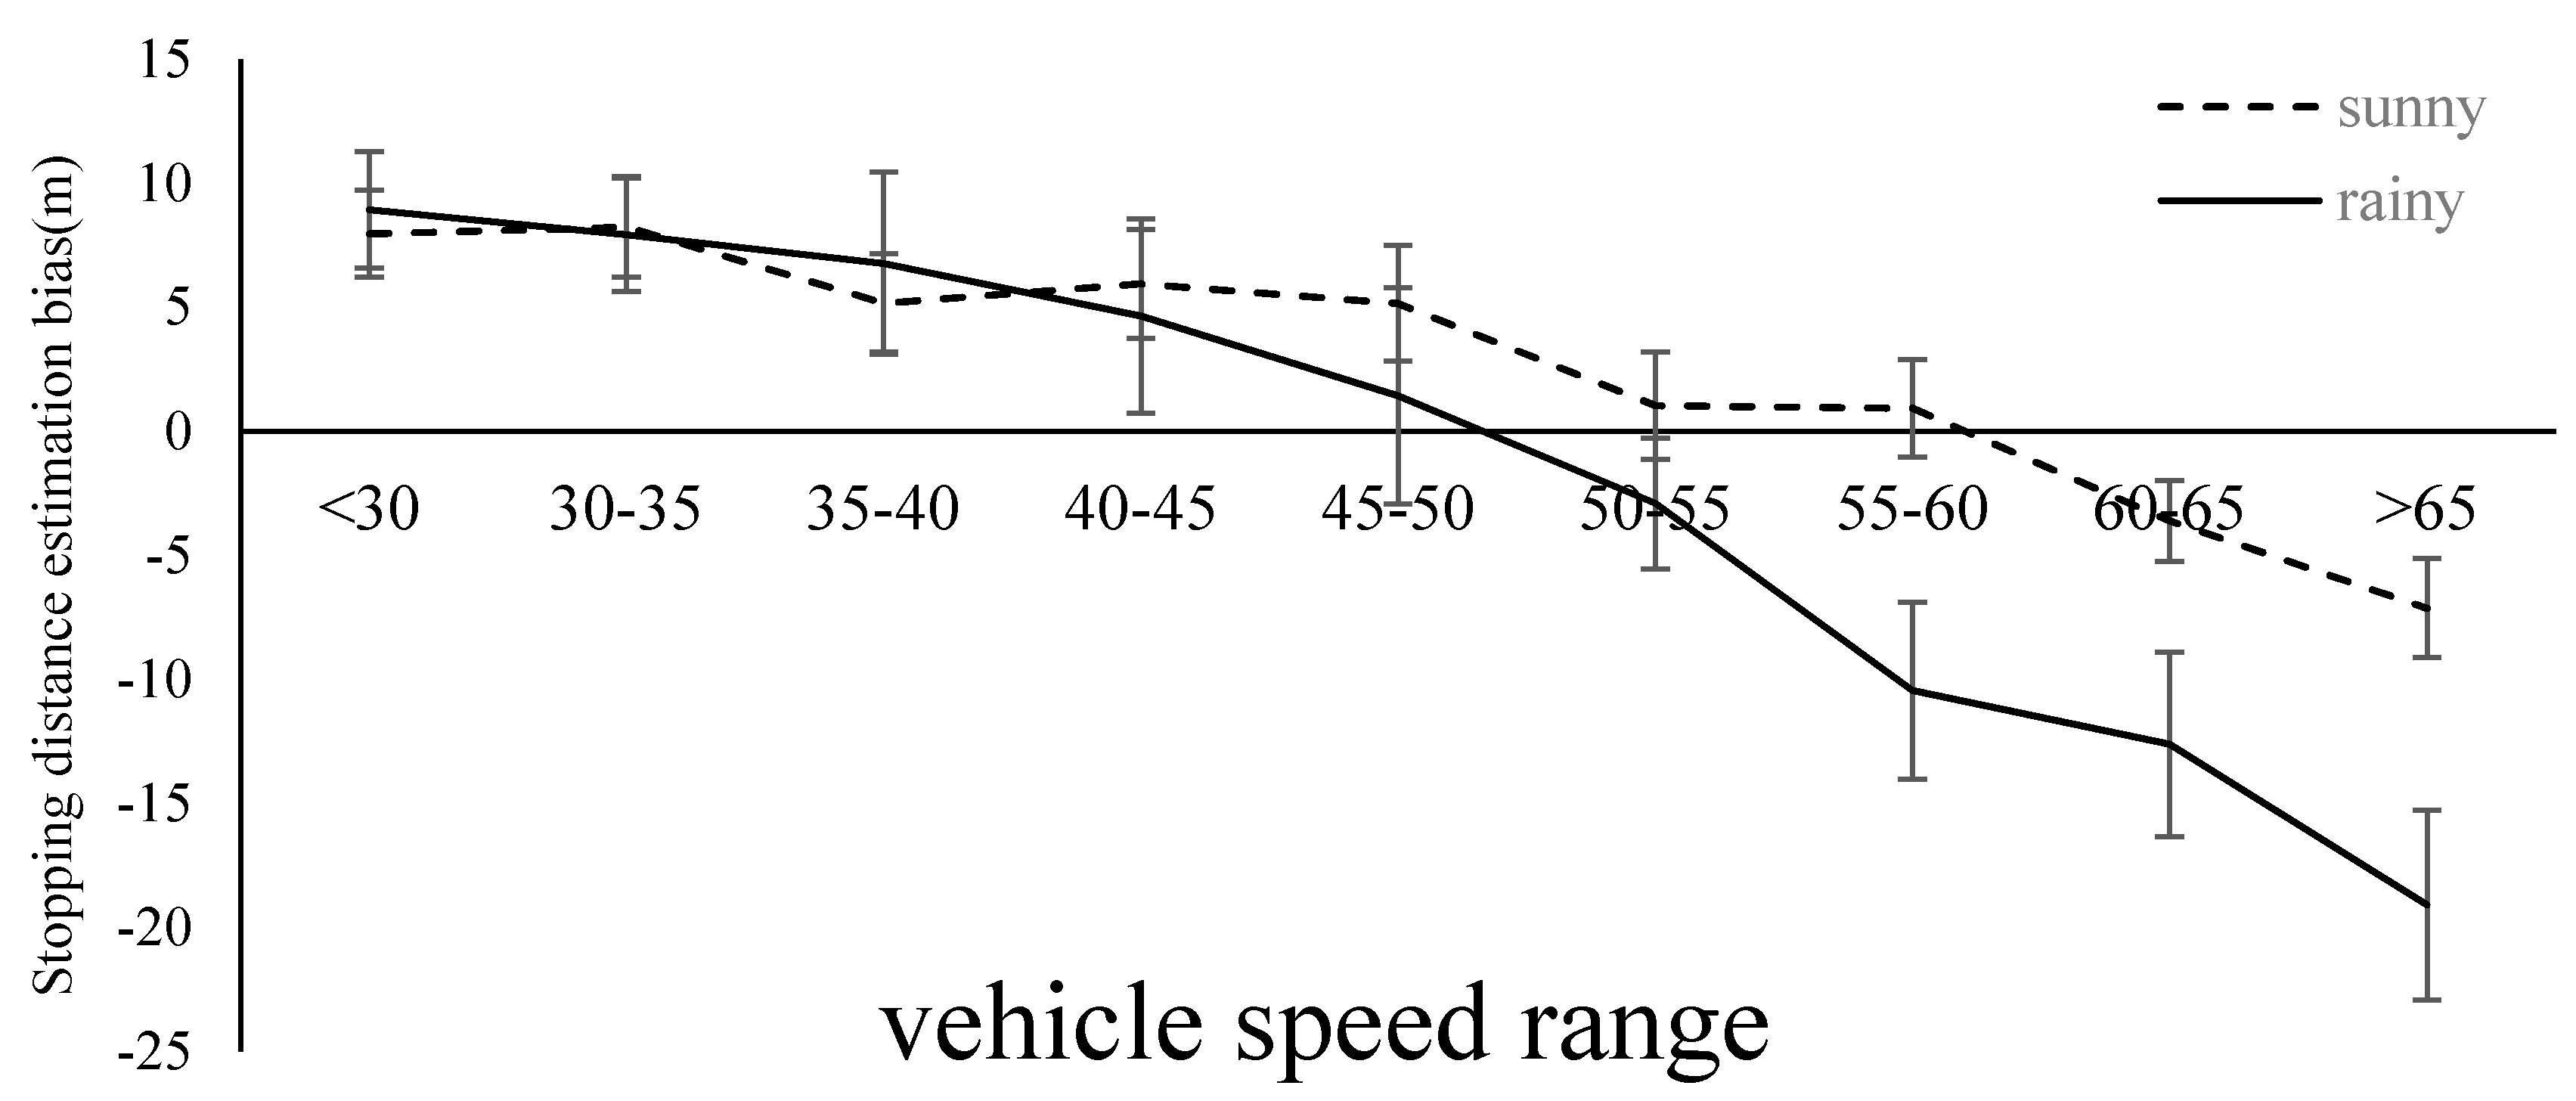
For the stopping distance estimation task, the underestimation speed range of the participants was quite different, given the different scenarios, see Figure 5.
A general analysis revealed that under sunny conditions, people underestimated vehicle speed when the speed exceeded 60 km/h with ts < −8.67, ps < 0.01, whereas in rainy conditions, the safe speed threshold was considerably lower. Specifically, when the actual speed exceeded 50 km/h, participants greatly underestimated the speed of the vehicle, ts < −4.29, ps < 0.01.

3.2.2. ANOVA Analysis

Similar to speed estimation, a mixed-design ANOVA revealed that weather had a significant effect on the stopping distance estimation bias, F (1, 46) = 31.16, p < 0.001, η2 = 0.96, which means that the participants tended to underestimate the stopping distance of the vehicle. The main effect of the time of day was only marginally significant, F (1, 46) = 4.01, p = 0.051, η2 = 0.28, indicating that older pedestrians reduce their speed estimation expectations and are more likely to underestimate the stopping distance of a vehicle at night. The main effect of speed was significant, F (1, 46) = 226.39, p < 0.001, η2 = 0.90, which means if the vehicle was traveling at a high rate of speed the participants were more likely to underestimate the vehicle’s stopping distance, a situation that may lead to increased dangers. Only under night conditions did light play an important role in stopping distance bias, F (1, 46) = 7.46, p < 0.01, η2 = 0.35. These data indicate that lighter conditions lead to greater underestimations compared to darker conditions.

4. Regression Model and Application

In previous studies, the criteria for road design includes energy savings [45,46] and road safety [47,48,49,50,51,52]. More recently, greater attention has been given to road safety, with a focus on user-friendly roads and human factors related to road safety. A road-user friendly design not only consists of the human errors from the perspectives of the drivers [53,54,55,56,57] but also from the perspectives of the pedestrians. Thus, we build models to provide references, such as road speed limits, for those who develop road design guides, such as engineering psychologists and road engineers.

4.1. Regression Models

4.1.1. Speed Estimation

First, we transformed the categorical variables, i.e., gender and weather, into dummy variables. Due to the difference in illuminance conditions between the two sites only under night conditions, we conducted the regression model for day and night separately.
Under day conditions, the actual speed, weather (0 represents for sunny and 1 for rainy), and participants’ age and gender (0 for female and 1 for male) were incorporated into the regression function with speed estimation bias as the dependent variable. In Table 3, only the actual speed, age, and gender were included in the final regression function. These factors exhibited a significant linear relationship with speed estimation bias, F (3, 860) = 174.76, p < 0.001, thus accounting for 37.7% of the total variation. Since the constant is significantly lower than zero, it can be deduced that both accurate and inaccurate estimations existed in the speed estimation process. The speed-estimation equation provided by the stepwise regression was used to derive the accurate estimation speed. For example, a 65-year-old female participant can accurately estimate vehicle speed at (approximately) 48 km/h.
Y1 = 53.29 − 0.58x1 − 0.39x2 + 2.03x3
where x1 is the actual vehicle’s speed, x2 is older pedestrians’ age (or average age of the pedestrians), and x3 is older pedestrians’ gender (0 for female and 1 for male).
Under night conditions, the actual speed, weather, illuminance of the road (12 lux and 30 lux), and participants’ age and gender were incorporated into the regression function. In Table 4, the actual speed, age, and illuminance were incorporated into the final regression function, see Equation (3). These factors exhibited a significant linear relationship with speed estimation bias, F (3, 860) = 195.95, p < 0.001, thus accounting for 40.4% of the total variation.
Y2 = 46.18 − 0.55x1 − 0.28x2 − 0.14x3
where x1 is the actual vehicle’s speed, x2 is older pedestrians’ age, and x3 is the average illuminance of the road at night time.

4.1.2. Stopping Distance Estimation

Under day conditions, the actual speed, weather (0 for sunny and 1 for rainy), the participants’ age and gender (0 for female and 1 for male) were entered into the regression function with stopping distance estimation bias as the dependent variable. In Table 5, the actual speed, weather, age, and gender were incorporated into the final regression function, see Equation (4). These factors exhibited a significant linear relationship with stopping distance estimation bias, F (4, 859) = 198.84, p < 0.001, thus accounting for 47.1% of the total variation. The stopping distance-estimation equation provided by the stepwise regression was used to derive the accurate estimation speed. For example, on a rainy day, a 65-year-old female participant may make an unsafe crossing decision due to the underestimation of the vehicle stopping distance if the approaching vehicle travels faster than 44 km/h.
Y3 = 39.44 − 0.51x1 − 3.91x2 − 0.20x3 + 1.66x4
where x1 is the actual vehicle’s speed, x2 represents weather condition (0 for sunny, 1 for rainy), x3 is older pedestrians’ age, and x4 older pedestrians’ gender (0 for female and 1 for male).
Under night conditions, only the actual speed and weather entered the final regression function, see Equation (5). These factors had a significant linear relationship with stopping distance estimation bias, F (2, 861) = 445.12, p < 0.001, thus accounting for 50.7% of the total variation, see Table 6.
Y4 = 29.00 − 0.55x1 − 5.43x2
where x1 is the actual vehicle’s speed, and x2 represents weather condition (0 for sunny, 1 for rainy).

5. Model Application

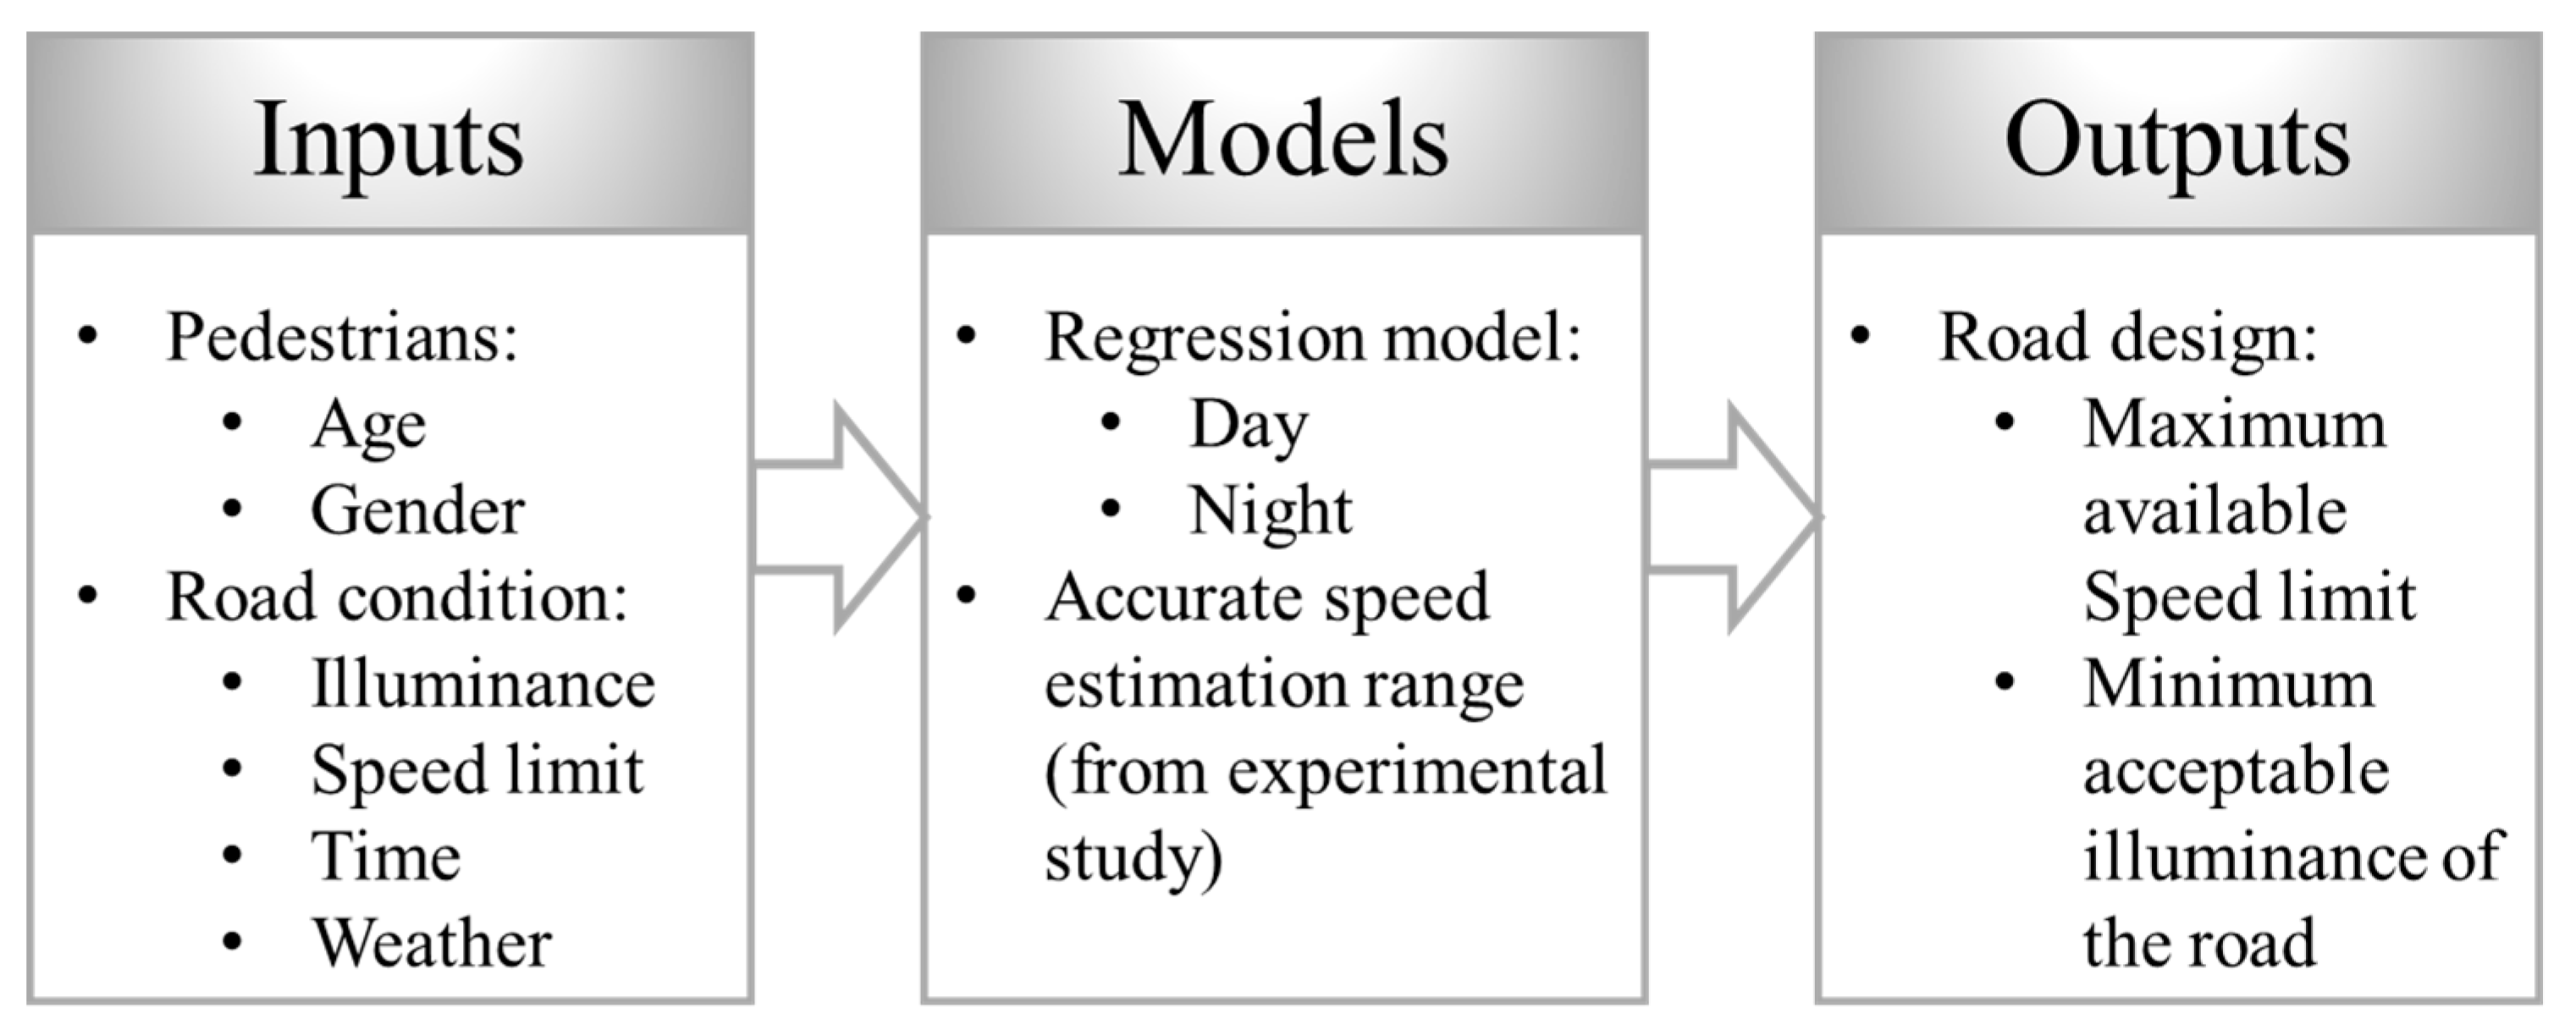
The basic structures of the models are presented in Figure 6. The example inputs of the pedestrian features include age and gender. The inputs of road features include the illuminance of the road, weather, time (day or night), and speed limit. The older pedestrians’ speed perception was modeled using a regression model. The settings of the related parameters of the road design are obtained from the outputs of the model, including the maximum available speed limit for certain conditions, such as rainy nights, and the recommended acceptable illuminance of the road at night.
In Equations (2)–(5), if “y = 0”, then x1 means older pedestrians can accurately estimate the speed and stopping distance of approaching vehicles. If we input the parameters of the model, such as the age and gender of the pedestrian and the illuminance of the road at night, we obtain the accurate speed range for older pedestrians. This information provides good reference material when establishing road speed limit designs, especially in senior living communities. For example, if those crossing the road in a community are older persons whose average age is 65, from Equation (2), a speed limit of 50 km/h may be a better choice for the road on sunny days.

6. Discussion

This study aimed to investigate the ability of older pedestrians to estimate vehicle speed and stopping distance while crossing the street, especially at night, and to determine what factors affect the ability of older pedestrians to accurately estimate speed and stopping distance. This study determined that older pedestrians exhibit varied estimation bias tendencies, see Table 7.
The underestimation of the speeds and stopping distances of approaching vehicles may lead to unsafe street-crossing decisions. The speed and stopping distance estimation bias generally increased with higher vehicle speeds. Our results indicated that older pedestrians had smaller accurate estimation intervals than did the adults in the Sun et al. study [19]. This result may partly explain the reason why older pedestrians often make unsafe decisions when vehicles are approaching at high speed and explain why they miss many crossing opportunities when the vehicle speed is low [2].
Compared with daytime estimations, the estimation ability of older pedestrians under nighttime conditions is more important and useful as the poor lighting at night may cause more traffic accidents [24,25,26,27]. With respect to both speed and stopping distance estimations, the main effect of the time was significant, indicating that pedestrians lower their speed estimation expectations and are more likely to underestimate the speed and stopping distance of a vehicle at night. Thus, H1 is supported.
As the underestimation of speed and stopping distance was more severe in rainy conditions, H2 is rejected. H2 assumed that the effect of blurred vision on cognition under rainy conditions may cause greater uncertainty [58], and thus cause pedestrians to be more conservative when estimating the speed of a vehicle. However, in our study, there was no significant difference between sunny and rainy conditions with respect to the perception of speed. This may be due to the between-subject experimental design and the unfamiliarity of the participants with rainy conditions. To avoid the fatigue effect, the weather variable was designed as a between-subject variable. We have counterbalanced as many factors as possible between the two groups, including age, gender, and certain unintended factors that may contribute to the differences. That said, the projector-based setting and the unfamiliarity with the rainy conditions may also have contributed to the differences. For example, the interview before the formal experiment indicated that 20 out of 24 participants cross the street on rainy days less than once a week. Thus, it is not easy for them to imagine rainy conditions based on a 2D visual image. With respect to the stopping distance estimation task, although older pedestrians realized that the approaching vehicle required a longer stopping distance under rainy conditions compared to sunny conditions, the extent of that distance was underestimated, thus supporting H5. Specifically, older pedestrians underestimated the vehicle stopping distance in rainy conditions even when the speed was 45 km/h.
The illuminance of the roads under night conditions exhibited significant effects on speed and stopping distance estimation tasks. However, contrary to H3 and H6, under higher illuminance conditions, older pedestrians are more likely to underestimate the speed and stopping distance. The decline of older persons’ visual abilities in low light conditions combined with the high beams of the vehicles may account for this finding. The reduced visual contrast of the night conditions made it difficult for the older participants to distinguish the vehicle from the surrounding environment [59], especially when the illuminance was lower. Previous studies that have focused more on recognizing oncoming vehicles have also demonstrated that performances on visual information processing tasks are poorer in low light conditions than in high light conditions [24,60,61]. Moreover, the headlights of the oncoming vehicle made it difficult for pedestrians to detect a vehicle’s real-time position [59]. Interviews following the experiment supported the findings that older pedestrians had difficulty judging the speed of vehicles in certain cases, such as night conditions with lower illuminance, and accordingly, they overestimated the speed of the vehicle.
Previous studies have concluded that pedestrians make crossing decisions based primarily on the distance rather than the vehicle arrival time or speed [10,17,19]. According to our study, road crossing based primarily on gap distance may increase the underestimating bias due to the increase in vehicle speed. The speed underestimation threshold may be even lower under severe conditions such as rainy nights. Furthermore, the speed ranges of the unsafe stopping distance estimation were considerable in rainy conditions, leading to increased danger, which may partly explain why more accidents occur in rainy conditions [62,63,64,65]. Thus, the misjudgment of the speed and stopping distance of the approaching vehicle approaching may be two of the key factors responsible for the accident.
Previous study have shown that, from the driver’s perspective, participants with driving experience can accurately estimate the driving speed whereas those without driving experience had greater underestimation [66]. People with a driving license may be more familiar with the vehicles, leading to being more trained in speed and stopping distance judgment. Because only 1% of the people over 60 have a driving license in China in 2018, none of the participants in this study possessed a license. However, this number is growing rapidly. In future work, comparing older pedestrians with and without a driving license is worthy of study.
The findings have theoretical implications for future works. Previous studies on pedestrian decision making, e.g., gap acceptance [67] and pedestrian behavior model [68] have used vehicle speed as the indicator of the pedestrian’s perceived speed. However, in our study, the physical speed of the approaching vehicles and the perceived speed of the pedestrians were quite different. The estimation bias also varied based on different physical situations. Thus, in future works, these models should be updated based on the perceived speed.
The findings also have practical implications for future works. In our study, we developed application models to guide road design and future research aimed at improving pedestrian security. Four models provide references regarding speed limits and lighting conditions in the areas with senior living communities. The current work also offers ideas for developing an apparatus for older pedestrians, such as an application (APP) in handheld mobile devices. For example, by integrating the data from a DSRC (dedicated short-range communications) system that can detect the speed and location of oncoming vehicles, the APP will calculate the safety threshold integrated by the pedestrian’s walking speed, personal estimating ability, distance between the pedestrian and the oncoming vehicle, and other related factors. If the vehicle speeds exceed the safety threshold, a warning will be given to the individual to avoid potential dangers. For example, if an approaching vehicle is 60 km/h on a rainy day, considering the underestimation of speed and stopping distance, a warning signal is sent through his handheld mobile.
There are several limitations in this work that require attention and further investigation. First, the study was conducted using a video projector, and there were subsequent limitations relative to the projector-based experiment. For example, the 3D vision of the vehicle was weakened, specifically with respect to depth perception. It also reduced the perception of other related factors, such as rain, wind, and free view. In addition, the fixed screening angle and height limit the field of view of the participants, which may influence the speed judgment. A VR system could be used in future works to eliminate these factors. Second, because long experiments cause fatigue for older pedestrians, the effect of the side of the road was not counterbalanced. Some investigations suggest that older pedestrians are more likely to be hit on the far side of a two-way street than on the near side [7,9,69]. Finally, speed or stopping distance estimation tasks in our study required the pedestrians to focus only on speed. In a natural traffic environment, interactions between pedestrians and vehicles are more complicated and more frequent. Thus, limited attention was paid to vehicle speed in the road-crossing tasks. Accordingly, future studies should examine the relationship between speed perception and crossing risks.
7. Conclusions

In conclusion, older pedestrians have smaller accurate estimation intervals that vary by multidimensional influential factors such as context time, illuminance of the road, and speed. The poorer speed and stopping distance estimation ability may result in lost road-crossing opportunities at lower vehicle speeds and increased road-crossing dangers at higher vehicle speeds. To design user-friendly roads in senior living communities, a regression model can be referenced when establishing speed limits and lighting conditions.

Author Contributions

Funding acquisition, X.Q.; Investigation, J.S.; Methodology, J.S.; Writing—original draft, J.S.; Writing—review & editing, C.W. and X.Q. All authors have read and agreed to the published version of the manuscript.

Funding

This study is funded by National Double First-rate Program of China107500*194211702/006.

Conflicts of Interest

The authors declare no conflict of interest. And the funders had no role in the design of the study; in the collection, analyses, or interpretation of data; in the writing of the manuscript, or in the decision to publish the results.

Appendix A. Street-Crossing Related Interview

  • Do you have a driving license?
  • How often do you cross the streets in the day time?
  • How often do you cross the streets at night?
  • How often do you cross the streets on rainy days?
  • Have you ever crossed the street without traffic lights? If so, what is your crossing strategy?
  • Have you seen an approaching vehicle comming to a sudden stop?

Appendix B. Experiment Related Interview

  • What is your strategy in speed estimation?
  • Do you think environment-related factors have influenced your speed judegment?
  • What is your strategy in stopping distance estimation?
  • Do you think environment-related factors have influenced your stopping distance judegment?

References

  1. World Health Organization. Make Walking Safe: A Brief Overview of Pedestrian Safety around the World; World Health Organization: Geneva, Switzerland, 2013. [Google Scholar]
  2. Butler, A.A.; Lord, S.R.; Fitzpatrick, R.C. Perceptions of Speed and Risk: Experimental Studies of Road Crossing by Older People. PLoS ONE 2016, 11, e152617. [Google Scholar] [CrossRef] [PubMed] [Green Version]
  3. O’Hern, S.; Oxley, J.; Logan, D. Older adults at increased risk as pedestrians in victoria, australia: An examination of crash characteristics and injury outcomes. Traffic Inj. Prev. 2015, 16 (Suppl. S2), S161–S167. [Google Scholar]
  4. Tournier, I.; Dommes, A.; Cavallo, V. Review of safety and mobility issues among older pedestrians. Accid. Anal. Prev. 2016, 91, 24. [Google Scholar] [CrossRef] [PubMed]
  5. Zhejiang Public Security Department. Traffic Management Data Report of Zhejiang Province; Zhejiang Public Security Department: Zhejiang, China, 2016.
  6. Dommes, A.; Lay, T.L.; Vienne, F.; Dang, N.T.; Beaudoin, A.P.; Do, M.C. Towards an explanation of age-related difficulties in crossing a two-way street. Accid. Anal. Prev. 2015, 85, 229–238. [Google Scholar] [CrossRef] [PubMed]
  7. Dommes, A.; Cavallo, V.; Dubuisson, J.B.; Tournier, I.; Vienne, F. Crossing a two-way street: Comparison of young and old pedestrians. J. Saf. Res. 2014, 50, 27–34. [Google Scholar] [CrossRef] [Green Version]
  8. Liu, Y.C.; Tung, Y.C. Risk analysis of pedestrians’ road-crossing decisions: Effects of age, time gap, time of day, and vehicle speed. Saf. Sci. 2014, 63, 77–82. [Google Scholar] [CrossRef]
  9. Oxley, J.; Fildes, B.; Ihsen, E.; Charlton, J.; Day, R. Differences in traffic judgements between young and old adult pedestrians. Accid. Anal. Prev. 1997, 29, 839. [Google Scholar] [CrossRef]
  10. Oxley, J.A.; Ihsen, E.; Fildes, B.N.; Charlton, J.L.; Day, R.H. Crossing roads safely: An experimental study of age differences in gap selection by pedestrians. Accid. Anal. Prev. 2005, 37, 962–971. [Google Scholar] [CrossRef]
  11. Lobjois, R.; Cavallo, V. Age-related differences in street-crossing decisions: The effects of vehicle speed and time constraints on gap selection in an estimation task. Accid. Anal. Prev. 2007, 39, 934–943. [Google Scholar] [CrossRef]
  12. Lobjois, R.; Cavallo, V. The effects of aging on street-crossing behavior: From estimation to actual crossing. Accid. Anal. Prev. 2009, 41, 259–267. [Google Scholar] [CrossRef]
  13. Holland, C.; Hill, R. Gender differences in factors predicting unsafe crossing decisions in adult pedestrians across the lifespan: A simulation study. Accid. Anal. Prev. 2010, 42, 1097–1106. [Google Scholar] [CrossRef] [Green Version]
  14. Asher, L.; Aresu, M.; Falaschetti, E.; Mindell, J. Most older pedestrians are unable to cross the road in time: A cross-sectional study. Age Ageing 2012, 41, 690–694. [Google Scholar] [CrossRef] [Green Version]
  15. Romeroortuno, R.; Cogan, L.; Cunningham, C.U.; Kenny, R.A. Do older pedestrians have enough time to cross roads in dublin? A critique of the traffic management guidelines based on clinical research findings. Age Ageing 2010, 39, 80–86. [Google Scholar] [CrossRef] [Green Version]
  16. Dommes, A.; Cavallo, V. The role of perceptual, cognitive, and motor abilities in street-crossing decisions of young and older pedestrians. Ophthalmic Physiol. Opt. 2011, 31, 292. [Google Scholar] [CrossRef] [PubMed]
  17. Dommes, A.; Cavallo, V.; Oxley, J. Functional declines as predictors of risky street-crossing decisions in older pedestrians. Accid. Anal. Prev. 2013, 59, 135. [Google Scholar] [CrossRef] [PubMed]
  18. Petzoldt, T. On the relationship between pedestrian gap acceptance and time to arrival estimates. Accid. Anal. Prev. 2014, 72, 127–133. [Google Scholar] [CrossRef] [PubMed]
  19. Sun, R.; Zhuang, X.; Wu, C.; Zhao, G.; Zhang, K. The estimation of vehicle speed and stoppingping distance by pedestrians crossing streets in a naturalistic traffic environment. Transp. Res. Part F Psychol. Behav. 2015, 30, 97–106. [Google Scholar] [CrossRef]
  20. Chung, Y.S.; Chang, C.Y. Farther and safer: An illusion engendered by incapability? Transp. Res. Part F Traffic Psychol. Behav. 2018, 54, 110–123. [Google Scholar] [CrossRef]
  21. Dommes, A.; Cavallo, V. Can simulator-based training improve street-crossing safety for elderly pedestrians? Transp. Res. Part F Psychol. Behav. 2012, 15, 206–218. [Google Scholar] [CrossRef]
  22. Hunt, M.; Harper, D.N.; Lie, C. Mind the gap: Training road users to use speed and distance when making gap-acceptance decisions. Accid. Anal. Prev. 2011, 43, 2015–2023. [Google Scholar] [CrossRef]
  23. Troscianko, T.; Wright, P.; Wright, D. Perceived speed of urban traffic. Perception 1999, 28, 60. [Google Scholar]
  24. Borzendowski, S.A.W.; Rosenberg, R.L.; Sewall, A.S.; Tyrrell, R.A. Pedestrians’ estimates of their own nighttime conspicuity are unaffected by severe reductions in headlight illumination. J. Saf. Res. 2013, 47, 25–30. [Google Scholar] [CrossRef] [PubMed]
  25. Tyrrell, R.A.; Patton, C.W.; Brooks, J.O. Educational interventions successfully reduce pedestrians’ overestimates of their own nighttime visibility. Hum. Factors 2004, 46, 170. [Google Scholar] [CrossRef] [PubMed]
  26. Tyrrell, R.A.; Wood, J.M.; Carberry, T.P. On-road measures of pedestrians’ estimates of their own nighttime conspicuity. J. Saf. Res. 2004, 35, 483–490. [Google Scholar] [CrossRef] [PubMed]
  27. Wood, J.M.; Lacherez, P.; Tyrrell, R.A. Seeing pedestrians at night: Effect of driver age and visual abilities. Ophthalmic Physiol. Opt. 2014, 34, 452–458. [Google Scholar] [CrossRef] [PubMed] [Green Version]
  28. Harrell, W.A. Perception of risk and curb standing at street corners by older pedestrians. Percept. Mot. Ski. 1990, 70, 1363–1366. [Google Scholar] [CrossRef]
  29. Harrell, W.A. Factors influencing pedestrian cautiousness in crossing streets. J. Soc. Psychol. 1991, 131, 367–372. [Google Scholar] [CrossRef]
  30. Horswill, M.S.; Plooy, A.M. Reducing contrast makes speeds in a video-based driving simulator harder to discriminate as well as making them appear slower. Perception 2008, 37, 1269–1275. [Google Scholar] [CrossRef]
  31. Ivan, K.; Haidu, I.; Benedek, J.; Ciobanu, S.M. Identification of traffic accident risk-prone areas under low lighting conditions. Nat. Hazards Earth Syst. Sci. 2015, 15, 191–197. [Google Scholar] [CrossRef] [Green Version]
  32. Hammett, S.T.; Champion, R.A.; Thompson, P.G.; Morland, A.B. Perceptual distortions of speed at low luminance: Evidence inconsistent with a bayesian account of speed encoding. Vis. Res. 2007, 47, 564–568. [Google Scholar] [CrossRef]
  33. Assum, T.; Bjørnskau, T.; Fosser, S.; Sagberg, F. Risk compensation—The case of road lighting. Accid. Anal. Prev. 1999, 31, 545. [Google Scholar] [CrossRef]
  34. Boyce, P.R.; Eklund, N.H.; Hamilton, B.J.; Bruno, L.D. Perceptions of safety at night in different lighting conditions. Int. J. Lighting Res. Technol. 2000, 32, 79–91. [Google Scholar] [CrossRef]
  35. Haans, A.; De Kort, Y.A.W. Light distribution in dynamic street lighting: Two experimental studies on its effects on perceived safety, prospect, concealment, and escape. J. Environ. Psychol. 2012, 32, 342–352. [Google Scholar] [CrossRef]
  36. Hassan, O.; Hammett, S.T. Perceptual biases are inconsistent with bayesian encoding of speed in the human visual system. J. Vis. 2015, 15, 1–9. [Google Scholar] [CrossRef] [Green Version]
  37. Owens, D.A.; Wood, J.; Carberry, T. Effects of reduced contrast on the perception and control of speed when driving. Perception 2010, 39, 1199–1215. [Google Scholar] [CrossRef]
  38. Pritchard, S.J.; Hammett, S.T. The effect of luminance on simulated driving speed. Vis. Res. 2011, 52, 54–60. [Google Scholar] [CrossRef] [Green Version]
  39. Levison, W.H.; Kantowitz, B.H.; Moyer, M.J.; Robinson, M. A stopping-distance model for driver speed decision making in curve approach. Proc. Hum. Factors Ergon. Soc. Annu. Meet. 1998, 42, 1222–1226. [Google Scholar] [CrossRef]
  40. Wood, E. The mathematics of stoppingping your car. Aust. Sr. Math. J. 2005, 19, 44–49. [Google Scholar]
  41. Itoh, M.; Inagaki, T. Adapting alarm threshold to driver’s brake timing: Is it more effective and/or acceptable than stoppingping distance algorithm? Proc. Hum. Factors Ergon. Soc. Annu. Meet. 2007, 51, 1526–1530. [Google Scholar] [CrossRef]
  42. Zhuang, X.; Wu, C. The safety margin and perceived safety of pedestrians at unmarked roadway. Transp. Res. Part F Traffic Psychol. Behav. 2012, 15, 119–131. [Google Scholar] [CrossRef]
  43. Wu, M. The relationship between automotive breaking distance and speed. Highw. Automot. Appl. 2010, 3, 46–49. [Google Scholar]
  44. Delaigue, P.; Eskandarian, A. A comprehensive vehicle braking model for predictions of stopping distances. Proc. Inst. Mech. Eng. Part D J. Automob. Eng. 2004, 218, 1409–1417. [Google Scholar] [CrossRef]
  45. Atıcı, C.; Ozcelebi, T.; Lukkien, J.J. Exploring user-centered intelligent road lighting design: A road map and future research directions. IEEE Trans. Consum. Electron. 2011, 57, 788–793. [Google Scholar] [CrossRef] [Green Version]
  46. Hu, X.; Qian, K. Optimal design of optical system for led road lighting with high illuminance and luminance uniformity. Appl. Opt. 2013, 52, 5888–5893. [Google Scholar] [CrossRef]
  47. Naznin, F.; Currie, G.; Logan, D. Exploring road design factors influencing tram road safety—Melbourne tram driver focus groups. Accid. Anal. Prev. 2018, 110, 52–61. [Google Scholar] [CrossRef]
  48. De Jong, D. Participatory design and road safety and design. In Proceedings of the Tenth Conference on Participatory Design, Bloomington, IN, USA, 30 September–4 October 2008. [Google Scholar]
  49. Hoekstra, T.; Wegman, F. Improving the effectiveness of road safety campaigns: Current and new practices. IATSS Res. 2011, 34, 80–86. [Google Scholar] [CrossRef] [Green Version]
  50. Weekley, J.; Barrell, J.; Mccarthy, T. Developing a road safety review tool to identify design standard and safety deficits on high risk road sections. Transp. Res. Procedia 2016, 14, 4130–4139. [Google Scholar] [CrossRef] [Green Version]
  51. Polus, A.; Pollatschek, M.A.; Farah, H. Impact of infrastructure characteristics on road crashes on two-lane highways. Traffic Inj. Prev. 2005, 6, 8. [Google Scholar] [CrossRef]
  52. Wegman, F.; Slop, M. Safety effects of road design standards in Europe. Transp. Res. Circ. 1998, 39, 1–10. [Google Scholar]
  53. Kanellaidis, G.; Zervas, A.; Karagioules, V. Drivers’ risk perception of road design elements. Transp. Hum. Factors 2000, 2, 39–48. [Google Scholar] [CrossRef]
  54. Mayeur, A.; Brémond, R.; Bastien, J.M. Effects of the viewing context on target detection. Implications for road lighting design. Appl. Ergon. 2010, 41, 461–468. [Google Scholar] [CrossRef] [PubMed]
  55. Chowdhury, I. Designing safe road systems: A human factors perspective. Ergonomics 2013, 56, 340–341. [Google Scholar] [CrossRef]
  56. Plankermann, K. Human Factors as Causes for Road Traffic Accidents in the Sultanate of Oman under Consideration of Road Construction Designs. Ph.D. Thesis, University of Regensburg, Regensburg, Germany, May 2014. [Google Scholar]
  57. Borsos, A.; Birth, S.; Vollpracht, H.J. The role of human factors in road design. In Proceedings of the IEEE International Conference on Cognitive Infocommunications, Gyor, Hungary, 19–21 October 2015; IEEE: Piscataway, NJ, USA, 2015. [Google Scholar]
  58. Bertone, A.; Bettinelli, L.; Faubert, J. The impact of blurred vision on cognitive assessment. J. Clin. Exp. Neuropsychol. 2007, 29, 467–476. [Google Scholar] [CrossRef]
  59. Balasubramanian, V.; Bhardwaj, R. Pedestrians’ perception and response towards vehicles during road-crossing at nighttime. Accid. Anal. Prev. 2018, 110, 128–135. [Google Scholar] [CrossRef]
  60. Owens, D.A.; Antonoff, R.J.; Francis, E.L. Biological motion and nighttime pedestrian conspicuity. Hum. Factors J. Hum. Factors Ergon. Soc. 1994, 36, 718–732. [Google Scholar] [CrossRef]
  61. Plainis, S.; Murray, I.J.; Pallikaris, I.G. Road traffic casualties: Understanding the night-time death toll. Inj. Prev. J. Int. Soc. Child Adolesc. Inj. Prev. 2006, 12, 125–128. [Google Scholar] [CrossRef] [Green Version]
  62. Brodsky, H.; Hakkert, A.S. Risk of a road accident in rainy weather. Accid. Anal. Prev. 1988, 20, 161–176. [Google Scholar] [CrossRef]
  63. Andreescu, M.; Frost, D. Weather and traffic accidents in montreal, canada. Clim. Res. 1998, 9, 225–230. [Google Scholar] [CrossRef] [Green Version]
  64. Keay, K.; Simmonds, I. Road accidents and rainfall in a large australian city. Accid. Anal. Prev. 2006, 38, 445–454. [Google Scholar] [CrossRef]
  65. Theofilatos, A.; Yannis, G. A review of the effect of traffic and weather characteristics on road safety. Accid. Anal. Prev. 2014, 72, 244–256. [Google Scholar] [CrossRef]
  66. Wu, C.; Yu, D.; Doherty, A.; Zhang, T.; Kust, L.; Luo, G. An investigation of perceived vehicle speed from a driver’s perspective. PLoS ONE 2017, 12, e0185347. [Google Scholar] [CrossRef] [Green Version]
  67. Yannis, G.; Papadimitriou, E.; Theofilatos, A. Pedestrian gap acceptance for mid-block street crossing. Transp. Plan. Technol. 2013, 36, 450–462. [Google Scholar] [CrossRef]
  68. Zhuang, X.; Wu, C. Pedestrians’ crossing behaviors and safety at unmarked roadway in china. Accid. Anal. Prev. 2011, 43, 1927–1936. [Google Scholar] [CrossRef] [PubMed]
  69. Fontaine, H.; Gourlet, Y. Fatal pedestrian accidents in france: A typological analysis. Accid. Anal. Prev. 1997, 29, 303. [Google Scholar] [CrossRef]
Figure 1. Sketch of the site to measure the estimation of vehicle speed and stopping distance.
Sustainability 12 05308 g001
Figure 2. A video screenshot of a test clip.
Sustainability 12 05308 g002
Figure 3. Relationship of speed estimation bias and actual speed under sunny conditions. Error bars represent a 95% confidence interval of estimation bias.
Sustainability 12 05308 g003
Figure 4. Relationship of speed estimation bias and actual speed under rainy conditions. Error bars represent a 95% confidence interval of estimation bias.
Sustainability 12 05308 g004
Figure 5. Relationship of stopping distance estimation bias and actual speed in sunny and rainy conditions. Error bars represent a 95% confidence interval of estimation bias.
Sustainability 12 05308 g005
Figure 6. The structure of a road design model from the perspective of the pedestrian.
Sustainability 12 05308 g006
Table 1. Experiment design factorial table.
Variable
Independent Variablebetween-subject variableWeather (sunny or rainy)
within-subject variablesIlluminance of the road at night time (12 lux for site_1 and 30 lux for site_2); Time (day or night); Speed level (9 levels at increments of 5 km/h)
Dependent VariableSpeed estimation bias; Stopping distance estimation bias
Table 2. Descriptive statistics for speed estimation.
WeatherActual Speed b DayEstimated Speed (Day)Estimation Bias aActual Speed NightEstimated Speed (Night)Estimation Bias
site 1 csunny47.0847.640.5646.2745.75−0.53
rainy47.3149.041.73 *47.1547.03−0.12
site 2 csunny48.2746.73−1.55 *48.9445.10−3.84 **
rainy47.0446.82−0.2147.9644.72−3.24 **
a Speed estimation bias = estimated speed-actual speed; it represents the accuracy of the speed estimation made by pedestrians; b all speed-related variables have the unit ‘kilometer per hour’; c site_1 and site_ 2 are different in terms of luminance at night (12 lux for site_1 and 30 lux for site_2); * p < 0.05, ** p < 0.01 level; it represents the significant underestimation or overestimation in such a scenario.
Table 3. Stepwise regression of speed estimation bias and contextual predictors under day conditions.
VariablesCoefficientsStd. CoefficientstpΔR2
(Constant)53.29 10.93<0.001
Actual Speed−0.580.03−22.02<0.0010.357
age−0.390.07−5.43<0.0010.016
gender2.030.762.68<0.010.003
Adjusted R2 = 0.377.
Table 4. Stepwise regression of speed estimation bias and contextual predictors under night conditions.
VariablesCoefficientsStd. CoefficientstpΔR2
(Constant)46.18 10.82<0.001
Actual Speed−0.550.02−23.32<0.0010.380
age−0.280.06−4.73<0.0010.015
illuminance−0.140.04−3.96<0.0010.011
Adjusted R2 = 0.404.
Table 5. Stepwise regression of stopping distance estimation bias and contextual predictors under day conditions.
VariablesCoefficientsStd. CoefficientstpΔR2
(Constant)39.44 9.81<0.001
Actual Speed−0.510.02−26.71<0.0010.430
Weather−3.910.50−7.74<0.0010.036
Age−0.200.05−3.29<0.010.003
gender1.660.562.96<0.010.005
Adjusted R2 = 0.471.
Table 6. Stepwise regression of stopping distance estimation bias and contextual predictors under night conditions.
VariablesCoefficientsStd. CoefficientstpΔR2
(Constant)29.00 28.89<0.001
Actual Speed−0.550.02−28.13<0.0010.448
Weather−5.430.53−10.29<0.0010.060
Adjusted R2 = 0.507.
Table 7. Accurate speed ranges for each scenario regarding speed and stopping distance estimation tasks.
WeatherTimeSiteAccurate Speed Ranges (Speed Estimation)Safe Speed Range (Stopping Distance)
sunnydaysite_1 a40–45 km/h<60
site_245–50 km/h<60
nightsite_145–50 km/h<60
site_230–45 km/h<60
rainydaysite_145–50 km/h<50
site_245–50 km/h<50
nightsite_145–50 km/h<45
site_235–45 km/h<50
a site_1 and site_2 are different in terms of luminance at night (12 lux for site_1 and 30 lux for site_2).