Article

Unravelling the Role of Gender in Fisheries’ Socio-Economic Performance: The Case of Greek Small-Scale Fisheries

by
Angelos Liontakis
*,
Irene Tzouramani
,
Stamatis Mantziaris
and
Alexandra Sintori
Agricultural Economics Research Institute, Hellenic Agricultural Organization, Terma Alkmanos str. P.C., 11528 Athens, Greece
*
Author to whom correspondence should be addressed.
Sustainability 2020, 12(13), 5304; https://doi.org/10.3390/su12135304
Submission received: 12 June 2020 / Revised: 28 June 2020 / Accepted: 29 June 2020 / Published: 30 June 2020

Abstract

:
Small-scale fisheries account for 94% of the Greek fishing fleet. The sector consists mainly of family-owned vessels and highly depends on family labor. While the role of women as crew members is of particular interest, there is little evidence of their actual employment status, labor situation, and contribution in the fishing activity. This paper focuses on women in small-scale fisheries in order to investigate their role in the sector and reveal their contribution to fishing enterprises. In addition, it implements a comparative analysis to investigate the differences in various socio-economic indicators in small-scale vessels with and without female crew members. The results indicate that the presence of women has a positive outcome on several social and economic indicators that reflect the wealth of both fishing households and employees. In terms of employment, several differences in the structural characteristics appeared regarding the onshore employment, the share of unpaid labor, and the total hours worked. The majority of female crew members can be characterized as “fisherwomen,” since fishing is their main occupation. Further in-depth research to investigate the family relations among crew members and how they affect the fishing enterprise can supplement the existing research.

1. Introduction

The role of women in small-scale fisheries has recently gained global attention. This trend follows the increased acknowledgement of women’s role in fisheries, but also the increasing attention in small-scale fisheries in general [1]. Though the first studies on women in fisheries appeared approximately four decades ago (e.g., [2,3,4]), it wasn’t until the last two decades that their role was further investigated (e.g., [1,5,6,7,8,9]). Over time, researchers from various disciplines became interested in the gender niche and have provided significant contributions to the studies in this area (e.g., [10,11,12,13]).
However, a lot of research effort is still needed, and much more policy attention has to be paid to women in small-scale fisheries. Policy changes do not always translate into national policies integrating a gender perspective [12], or they do so with further biases, such as by focusing exclusively on post-harvest [14] or leaving women out of fisheries’ governance [11,15]. The still limited research is partially explained by data scarcity, predominantly because fisheries research has been slower than others in recognizing the importance of gender within their purview [1,6,7,16]. This lack of attention may also be related to the poor recognition of the importance of small-scale fisheries, an area where women’s contributions are much more vital than in large-scale fisheries and aquaculture units [1,17]. The lack of attention to small-scale fisheries has inevitably led to women’s marginalization and invisibility [1]. At a European level, only later attempts to recognize their contribution have been successful [8,18], while globally, women in fisheries have recently cooperated to form a legal body and to promote their position and their rights (see http://akteaplatform.eu).
Even if women usually offer their labor onshore, they are responsible for many tasks either directly related to the fishing activity or not [8,19]. In a recent attempt to further analyze European Union Multi-Annual Program (EU-MAP) data, AGRERI [20] and Liontakis et al. [21] reveal some additional figures about the onshore activity and unpaid labor of women in fisheries in Greece. According to the authors, the onshore activity of female fishers accounts for about 60% of their total contribution, while in the case of men, on shore activity accounts for about 30% of their total labor input. The main onshore activities reported are: clearing nets; preparing gears for fishing activity; cleaning the vessel; minor repairs on the vessel; administrative work; or other paperwork.
An essential contribution of women regards the activities and income diversification beyond capture. According to Frangoudes et al. [18], “when a fishing family’s income is under threat, it’s mostly the women who instigate diversification of activities to secure sufficient family earnings.” The most common sources of income diversification are direct sales, fish processing for higher value-added, fishing tourism, and touristic services, such as restaurants and B&Bs [22,23].
Despite the significant scientific contribution of the aforementioned studies in the relevant literature, there is still a rather limited number of studies that analyze the role of women in fisheries from a more quantitative point of view, focusing on their socio-economic contribution in the sector. A possible reason is that women’s work in fisheries is rarely found in statistics, while at the same time, women’s contribution to the economy of the fishing households or enterprises is under-documented [1,5,6,7,8,9,16,24,25].
Giving the existing research gap, the purpose of this study is twofold: firstly, to analyze in depth the employment status and the labor situation of women involved in small-scale fisheries and to compare the male and female employment structure using a comparative analysis; secondly, to reapply the comparative analysis at the fishing vessel level so as to reveal, describe, and explain the possible benefits of the presence of women in the crew. The quantification of this contribution can promote women’s empowerment and increase their participation in management and decision-making [22]. For this purpose, various indicators (fishing effort, social, and economic), as well as technical efficiency scores are estimated at the fishing vessel level. Then, the fishing vessels are split into two groups based on the presence of women in the crew or not and a non-parametric statistical analysis (Mann–Whitney test) is utilized to compare the indicators between these two groups.
The study focuses on the small-scale fishing sector in Greece, which is the larger fleet in Europe (12,588 vessels) [26]. The sector operates throughout the extensive Greek coastline, utilizing various passive fishing gears (mainly nets, longlines, pots, and traps). Another common structural characteristic of the sector is the family ownership of the capital, as well as the low level of investments [26]. It provides income and employment in coastal areas while it is acknowledged as part of their cultural heritage, strongly connected with their culture and traditions [17,27,28]. According to [27], members of small-scale fishing communities are proud of their professional status as fishers and show a significant degree of commitment to the fishing lifestyle. Therefore, the fishing sector is vital for local economies and contributes to the social cohesion of coastal communities [17,28]. Its role is even more important in remote areas and small islands, where there are few alternative economic activities [20]. According to Scientific, Technical and Economic Committee for Fisheries STECF [29], women’s contribution in terms of employment in the small-scale fisheries is about 9%, but it is less in terms of full-time equivalents (FTE) (6% share), which is an indication that women in fisheries are underemployed. It should be noticed that FTE is defined as the working hours offered by an employee per year divided by a certain number of working hours that corresponds to a full-time job in the sector. In our analysis, we adopted the national FTE, which correspond to 1750 working hours per year [20].
The primary data used in this analysis stems from two sources. Firstly, economic (cost items and income from landings) and some social variables (employment by gender, unpaid labor by gender, education level, age, and nationality) are collected through the EU Multi-Annual Programme (under the provisions of Council Regulation (EC) 2017/1004 and the Commission Decision (EU) 2016/1251. In the case of Greece, 537 fishing vessels for the reference year 2018 have been sampled. To cover the needs of this survey, additional data have been collected from a subsample of the EU-MAP fishing enterprises (for a total of 326 small-scale fishing vessels). Additional data regards the distribution channel of the catch, the off-fishing employment, and the share of family income from off-fishing activities.

2. Methodology

2.1. Employment Status and the Labor Situation of Women in Small-Scale Fisheries

The first step of the analysis is focused on the employment status and the labor situation of women in small-scale fisheries.

2.1.1. Classes of Women’s Employment

The labor situation of women in the primary sector attracted research attention many decades ago. In the late 80’s, Gasson [30] distinguished three “ideal role types” of farm women: farm housewives, working farm wives, and women farmers. Each role was characterized by a different task allocation within the family business, different motivations and incentives, and a different set of capacities needed.
To explore the labor situation of women in small-scale fisheries, we followed similar studies in the EU agrarian areas [31,32,33]. We performed a classification analysis based on the labor intensity in fisheries and off-fishing employment so as to categorize women into the following distinct groups:
  • Fisherwomen: this group consisted of women, employees, or owners of fishing vessels that were actively participating in onboard and/or onshore activities offering employment that corresponded to one (or close to one) full-time equivalent (FTE). In addition, the women in this group declared no other sources of income or other professional activities. In rare cases, these women covered almost 100% of the employment in a fishing vessel. However, more frequently, these women worked together with other crew members (either men or women and usually family members) offering mainly onshore fishing activities, but also actively engaged in direct sales and administrative/paperwork. These women were actively participating in the decision-making of the family business and in the management of inputs/resources.
  • Pluriactive women: the women classified in this group contributed less to the fishing activity, but they engaged in other family-related activities (mainly agricultural or tourism-related activities). Pluriactivity (i.e., the household’s combination of fishing and non-fishing activities) is common in the family-type business model that dominates small-scale fisheries in the regional areas of Greece. Under this framework, women provide employment in several other economic activities of the primary (e.g., agriculture), secondary (e.g., processing of fishing products), and/or tertiary sector (fishing tourism, B&Bs, restaurants, etc.).
  • Housewives: women with minor contributions in terms of employment in the family fishing and/or non-fishing activities were placed in this last group. Their main role was concentrated in the household, and there were only “subsidizing” fishing or other professional activities by their labor [22,34]. Common tasks included caring for children, providing food, and working in the household.

2.1.2. Male vs. Female Employment Status

Following this classification, a comparative analysis was performed to map the differences among the employment status of female relatives to male fishers using the following variables: a) age class (<=14 years, 15–24 years, 25–39 years, 40–64 years, >=65 years); b) education level (low, medium, high); c) ownership (yes/no); d) paid labor (yes/no); e) share of onshore employment; and f) total hours worked per year. Age classes and education level were based on the EU Multi-Annual Programme (EU-MAP) classification (see [29]). The two groups were then compared using the non-parametric Mann–Whitney test [35], which tested the hypothesis that two independent samples were from populations with the same distribution.

2.2. Comparative Analysis on the Fishing Vessel Level

The second step of the analysis involved the implementation of a comparative analysis, in which the primary purpose was to reveal how the presence of women in the crew can affect the socio-economic indicators of the fishing enterprises. To do that, fishing vessels were split into two distinct groups; one group consisted of vessels with no women in their crew, while the second, smaller group consisted of fishing enterprises where there were one or more women in their crew. Then, the estimation of various indicators for the two groups took place, and the Mann–Whitney test was utilized to check if the existing differences were statistically significant or not. As the size of the vessel was a variable that could significantly affect those indicators, two more groups were formed based on vessel length (0–6 m, 6–12 m) in order to filter out possible distortions caused by this variable.

2.2.1. Women and Distribution Channel of the Catch

As one of the most common tasks assigned to women is the direct sales of the catch (typically outside of the vessel), a comparative analysis on the distribution channel of the catch was performed to check the hypothesis that the presence of women in the crew favors direct sales. Direct sales can significantly boost revenues, as the fishing vessel gate price is much higher compared to longer market-chains.

2.2.2. Women and Fishing Effort: Social and Economic Performance Indicators

For each distinct group (women in the crew/no women in the crew), the following indicators were estimated (see also Table 1):
  • Fishing effort indicators:
    • Number of fishing days per year (DAYS), equal to the number of days where the fishing activity occurred.
    • Fuel consumption per fishing day (lt/day) (FUEL).
  • Social Indicators:
    • Hours worked per fishing day (HOURS).
    • Full-time equivalents (FTEs). At the vessel level, FTE represented the sum of the full-time jobs that corresponded to the aggregate working hours of the crew members during one fishing year. This variable was of social interest, as it showed how many full-time jobs the fishing enterprise could offer to the community. It was estimated as:
      FTEs = HOURS ∗ DAYS/1750
    • Total jobs per vessel (JOBS). Total number of persons who had worked onboard and/or onshore for one year, irrespective of the labor they offered. It was closely related with the FTEs, as it revealed how many jobs the fishing enterprise provided to the local community during the year. The FTEs/JOB ratio was an indication of labor intensity. A rate close to one indicated that the people involved in the vessel worked full time. The lower the ratio, the higher the underemployment in the vessel.
  • Economic indicators:
    • Revenues per fishing day (€/day) (REVENUES).
    • Cost per fishing day (€/day) (COSTS): it was estimated as the sum of the following cost items per fishing day (definitions are based on [26]):
      -
      Fuel cost (FUEL_COST): refers to the fuel consumed.
      -
      Repair and maintenance (REPAIR): refers to the regular maintenance and repair of fixed assets used in production.
      -
      Personnel cost (WAGES): refers to the total remuneration paid by the employer in return for work done by the employee in one day at sea.
      -
      Imputed value of unpaid labor (UNPAID): refers to the imputed value of labor offered by engaged crew that does not receive any kind of remuneration.
      -
      Other variable costs (OTHER): refers to the value of all purchased inputs (goods and services) related to fishing activity, excluding energy costs, personnel costs, and repair and maintenance costs.
      -
      Non-variable costs (FIXED): refers to the value of all purchased inputs not related to the level of fishing effort divided by the number of days at sea.
      -
      Capital costs (CAPITAL): includes depreciation costs (DEPRECIATION) and the opportunity cost of capital (OPPORTUNITY). The former refers to the decline in the value of the vessel and equipment as a result of normal wear, tear, and obsolescence. The latter is equal to the fixed tangible asset value multiplied by the real interest rate.
    • Gross profit (€) (G_PROFIT): it is estimated by deducting operating costs per day at sea, excluding capital costs from the revenue per day, as follows:
      G_PROFIT = REVENUES-(FUEL_COST+REPAIR+WAGES+UNPAID+OTHER+FIXED)
    • Fishing family income (€) (FFI): fishing family income was probably the most important performance indicator as the most representative index of the wealth of a family engaged in fisheries. Although profit is commonly used as the ultimate indicator for the evaluation of the economic performance, FFI is of special importance in the primary sector. It represents the reward of the production factors that belong to the family. Therefore, it is considered as a measure of family wealth. On the other hand, profit is the proper indicator of economic performance in a more entrepreneurial model of fishing activity, such as the large-scale fisheries sector, where the enterprises are closer to typical economic units rather than to family businesses. The usage of the FFI index is very common in agriculture studies (e.g., [36,37,38,39,40,41]). In the case of small-scale fisheries, the household typically owns the fixed assets (such as the vessel, the registry, the fishing gears, and the equipment of the vessel) and offers labor to the fishing activity. Therefore, the fishing family income was calculated as:
      FFI = G_PROFIT-DEPRECIATION+UNPAID+OPPORTUNITY
    • Fishing family income margin (%): it was calculated as the ratio between fishing family income and revenue, and it represents the share of revenues that transformed into wealth for the family at the end of the year.
    • Gross value added per vessel (GVA): it is the net output of a vessel after deducting intermediate inputs from all outputs. It is a measure of the contribution to the gross domestic product (GDP) made by a single fishing vessel per year, and it was estimated as:
      GVA = REVENUES – FUEL_COST-REPAIR-OTHER-FIXED
    • Labor productivity: it was used as a measure of economic growth, competitiveness, and living standards within a sector. In addition, it can be viewed as an indicator of the worker’s wellbeing or living standards under the assumption that any increase in productivity was accompanied by an increase in wages. It was calculated as:
      LABOUR PRODUCTIVITY = GVA/FTE

2.2.3. Women and Technical Efficiency

Finally, a comparative analysis in the technical efficiency scores was implemented to check if the vessels with women in their crew had different scores compared to the vessels with no women in their crew. Technical efficiency is defined as the ability of a decision-making unit (DMU) to maximize outputs utilizing a given set of inputs (output orientation) or to minimizing inputs to produce a specific level of outputs (input orientation) [42]. In this study, we considered efficiency as the ability to achieve the maximum level of catch subject to the available resources. The technical efficiency scores were estimated using a data envelopment analysis (DEA), a non-parametric linear programming approach to assess efficiency. This was introduced by Charnes et al. [43], who based their approach on the model of Farrell [44]. The main advantage of this method is its non-parametric nature, as it does not a priori assume a specific functional form for the frontier production [45].
Consider n DMUs producing m different output using h different inputs. Y is an m × n matrix of outputs and X is a h × n matrix of inputs. Both matrices contain data for all n DMUs. The technical efficiency (TE) measure θ can be formulated as follows:
min θ,
subject to:
yi + Yλ ≥ 0
θxiXλ ≥ 0
NIλ = 1
λ ≥ 0
and solved for each DMU in the sample. θ is the DMU’s index of technical efficiency, yi and xi represent the output and input of DMU i, respectively, and Yλ and Xλ are the efficient projections on the frontier, where is a n × 1 vector of ones. A measure of θi = 1 indicated that the DMU was technically efficient. Thus, 1 − θ measured how much the DMU i’s inputs could be proportionally reduced without any loss in output.
In this study, we considered one output—(REVENUES*DAYS)—and five inputs: DAYS, HOURS, FUEL, REPAIR, and OTHER.

3. Results

3.1. Employment Status and the Labor Situation of Women in Small-Scale Fisheries

3.1.1. Classes of Women’s Employment

Based on the working hours and the share of off-fishing activities, women in small scale fisheries can be classified in the following groups (see also Figure 1):
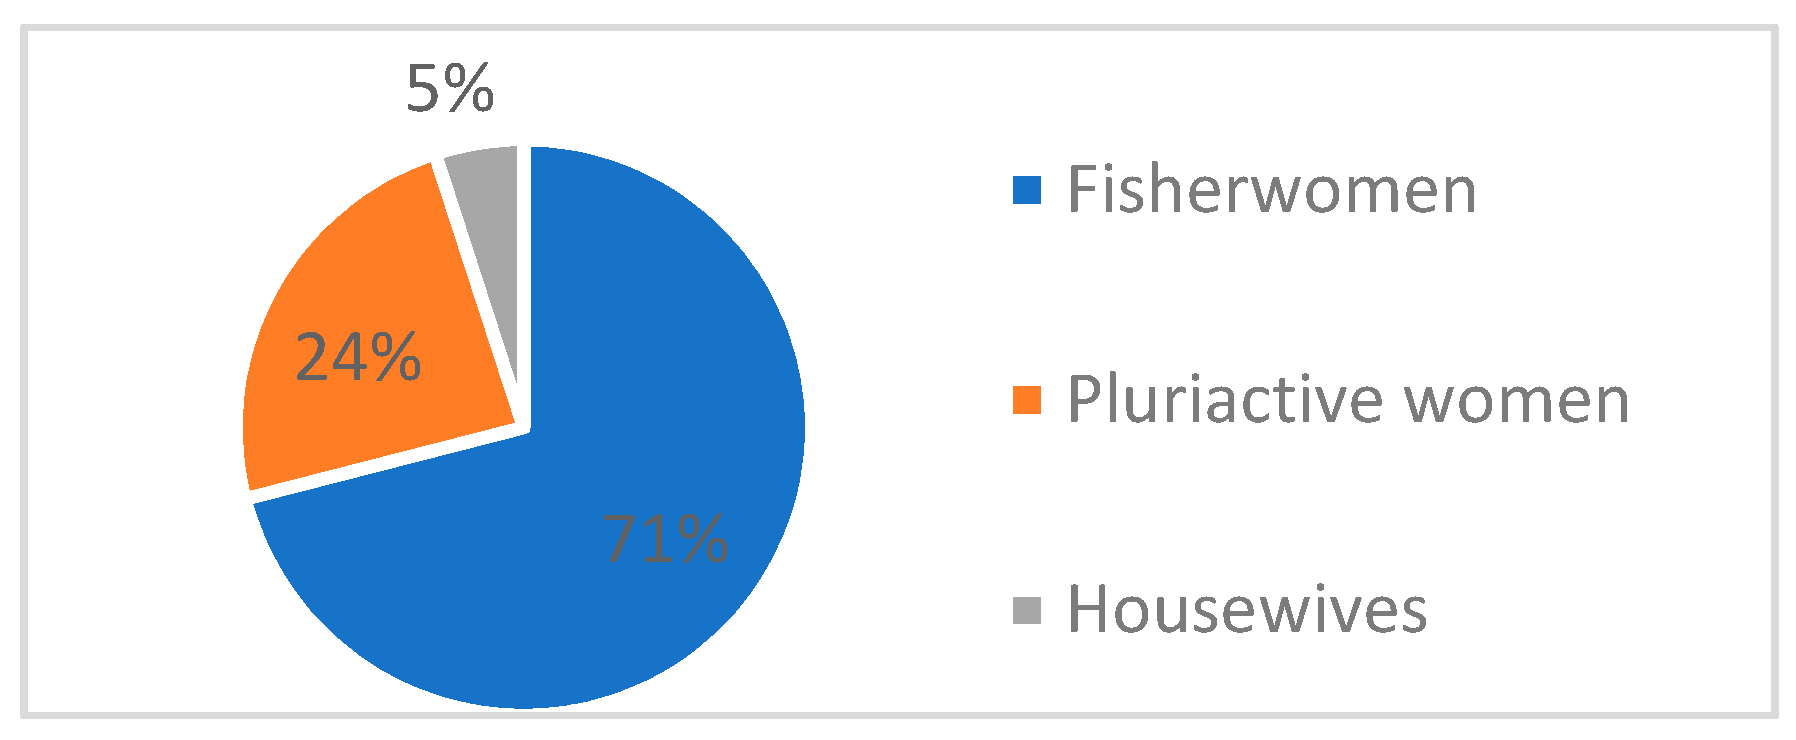
  • Fisherwomen: in this category, there are women employees or owners of fishing vessels that are actively participating in onboard and/or onshore activities with more than 0.8 FTEs. These women constitute 71% of the total women employees.
  • Pluriactive women: in this group, there are women that contribute to less than 0.75 FTEs in the fishing activity, but they actively participate in other family-related activities. The 24% of the women employees is related to this category. They are usually employed in the agricultural or livestock sector, processing, or tertiary sector: e.g., B&B, tavern.
  • Mainly housewives: these women employees offer low labor (less than 0.25 FTE) in the fishing activity, supporting and subsidizing husbands’ fishing activities. In our analysis, only 5% of the women employees fell into this group.
To our knowledge, there is no similar research into fisheries to compare our results. However, women’s labor situations in agriculture has been further explored in several studies. In surveys that took place in rural Italian and Norwegian regions (see [31,32]), the share of “pluriactive” women engaged in farming was similar to our results. In rural Greece and the Netherlands, the share of women characterized as “mainly farmers” was similar to the share of “fisherwomen” found in our survey (see [31]). On the other hand, in all the above studies, the share of “mainly housewives” was much higher. Only Ilak Peršurić [33] reported such a low share of housewives in a study for farm women in Croatia. It has to be emphasized that, apart from the study of Ilak Peršurić [33], which is recent, all the other studies were implemented 15–20 years ago. Nowadays, women are more encouraged to achieve their potential in the labor market [46], and, therefore, the presence of women in the labor force is more pronounced. In addition, these studies took place in more prosperous eras. Economic crisis probably also affects women’s employment status, as it forces families to utilize women’s capacity outside the household.

3.1.2. Male vs. Female Employment Status

Small-scale vessels in Greece usually employ one to four crew members. Figure 2 depicts the share of women in the crew, given the total number of crew members. As shown, the one-member crew did not include women (there was only one exemption in our survey), which indicated that women do not usually work alone. In the case of one or more crew members, the presence of women was common, as one in three vessels had at least one woman within their crew. In addition, 17.6% of these women were reported as captains. However, the reliability of this statistic was questioned, as, in many cases, women were only the officially registered and not the actual owners/captains, especially when their husbands were not eligible for an individual professional fishing license [47].
According to our results, women in small-scale fisheries represented 7.4% of fishers in small-scale fisheries, which was slightly lower than the 9% share reported in AGRERI [20]. Figure 3a,b depicts the distribution of age and education for both male and female fishers. These distributions are quite similar—a result that was also validated through the implementation of the nonparametric Mann–Whitney test. This test found no statistically significant differences in these distributions among male and female workers. These results were also similar to the results presented in STECF [29] and AGRERI [20] that refer to the year 2017.
However, the statistically significant difference among male and female fishers has been found in the employment status between paid and unpaid employment (see Figure 4). Female fishers were unpaid in the vast majority of cases (about 95%), indicating their unpaid but significant role in the family business. On the other hand, male employment was unpaid by almost 70%, which was a rather expected outcome in the case of the small-scale fishing sector. The Mann–Whitney test confirmed the obvious statistically significant difference (z = −4.7, statistically significant at 0.01 level of significance) among male and female fishers in terms of employment status.
Another important difference among male and female employment in fisheries was the share of onshore employment, previously reported in AGRERI [20]. Traditionally, women are more engaged in onshore activities, either directly related to the fishing activity (e.g., preparing nets) or not (e.g., direct sales, administrative issues, and paperwork, accounting). On the other hand, male fishers are more engaged in onboard activities. These differences may be explained by the adversity of onboard working conditions and the high level of ability of women to effectively manage challenging onshore situations. As in the previous case, the Mann–Whitney test confirmed the obvious statistically significant difference (z = −9, statistically significant at 0.01 level of significance) among male and female fishers in terms of employment status. Finally, it is also important to emphasize that female fishers were underemployed. Compared to men fishers, they worked less than 1 FTE per year (which corresponded to 1750 hours per year). On the other hand, men fishers were slightly above this threshold (see Table 2).

3.2. Comparative Analysis on the Fishing Vessel Level

3.2.1. Women and Distribution Channel of the Catch

One of the most common tasks that is traditionally assigned to women is the direct sales of the catch, which commonly takes place on the dock. Table 3 presents the differences in the distribution of landings when women were employed in the vessels. The Mann–Whitney test found significant differences between the share of direct sales. Apparently, the share of direct sales to consumers is much higher when there are women in the crew—a fact with further consequences in the economic and financial indicators of the enterprises, as we present in the next subchapter.

3.2.2. Women and Social, Environmental, and Economic Performance Indicators

Table 4 presents the estimated indicators for the comparative analysis. According to this table, the vessels with and without female crew members did not significantly differ in terms of fishing activity. However, they differed significantly in terms of their social indicators. Vessels with female crew members appeared to utilize more labor inputs. The analysis also validated the increasing revenues of the vessels with female crew members. An increased direct sale to consumers was probably the main reason behind that. The imputed value of unpaid labor was significantly higher in the vessels with women in their crew—an expected outcome given the high unpaid/paid ration of women in small-scale fisheries.
Finally, economic performance indicators were significantly higher in the case of vessels with female crew members. Fishing family income and labor productivity were indicators that were directly related to the wealth and the living standards of the family and the employees, respectively. Therefore, the participation of women in small-scale fisheries had positive outcomes not only for employees, but also for the family business.

3.2.3. Women and Technical Efficiency

The average technical efficiency scores estimated using the DEA method are presented in Table 5. The analysis found no significant differences among vessels with and without female crew members, as the technical efficiencies scores were similar in both groups. According to Pinello et al. [48], fishing ability in small-scale fisheries is mainly attributed to the human capital rather than the equipment. The latter is found to be a more crucial factor in large-scale fisheries. Based on the above finding, we can conclude that women in fisheries can be considered at least as good as men in the “art of fishing.”
Another finding of this analysis was that, irrespective of the presence of women in the crew, the technical efficiency levels of smaller vessels were higher. A possible interpretation is that smaller vessels have high flexibility and, therefore, they can easily adjust their cost determinants according to the seasonal or regional variations of fish availability [48].

4. Conclusions

The contribution of women in small-scale fisheries has recently gained much research attention; however, the quantitative analysis is still in scarcity, mainly due to data limitations. The present study attempts to unravel the role of gender in small-scale fisheries by utilizing primary data and a quantitative analysis not only at the employee level, but also at the fishing enterprise level. The results indicate that women’s share in small-scale fisheries employment is about 7.5%, and for the majority of them, the fishing activity is their main occupation (fisherwomen). “Pluriactive” women and “mainly housewives” are also present, and, as a result, the labor intensity of women appears lower. On average, women offer 70% of their fisheries employment in onshore activities, while, on the other hand, men provide only 30% of their employment in onshore activities. The presence of women in the crew encourages direct sales to consumers (62% share on total sales versus 47% in vessels without female crew members), and, therefore, it boosts the revenues and consequently, the economic performance indicators at an enterprise level. Fishing family income, as an indicator of household wealth and labor productivity and also as an indicator of employees’ wealth are both positively influenced by the presence of women (about 45% increase in the case of vessels with female crew members). Finally, technical efficiency scores are not statistically different between vessels with and without female crew members. Therefore, the analysis validates that women can be at least as good fishers as men, and, therefore, their presence can only provide benefits to the fishing enterprise. A limitation of this research is that it does not specify the family relations among crew members or how these relations affect the fishing enterprise (e.g., wives’ employment, daughters’ employment, other relatives’ employment). In addition, future research can focus on how women reflect on policy incentives and how their participation in decision making affects managerial decisions.

Author Contributions

Conceptualization, A.L. and A.S.; Data curation, A.L. and S.M.; Formal analysis, A.L., I.T., S.M., and A.S.; Investigation, A.L., I.T., S.M., and A.S.; Methodology, A.L.; Project administration, I.T.; Resources, I.T.; Software, I.T.; Validation, A.L.; Visualization, A.L. and S.M.; Writing–original draft, A.L. and A.S.; Writing–review & editing, I.T. and A.S. All authors have read and agreed to the published version of the manuscript.

Funding

This research was funded by Greek Work Plan for data collection in the fisheries and aquaculture sectors 2017–2019, co-ordinated by the General Directorate of Sustainable Fisheries, Greek Ministry of Rural Development and Food.

Conflicts of Interest

The authors declare no conflict of interest.

References

  1. Frangoudes, K.; Gerrard, S. (En)Gendering Change in Small-Scale Fisheries and Fishing Communities in a Globalized World. Marit. Stud. 2018, 17, 117–124. [Google Scholar] [CrossRef] [Green Version]
  2. Gerrard, S. Arbeidsliv og Lokalsamfunn: Samarbeid Og Skille Mellom Yrkesgrupper i et nord-norsk Ffskevær (Working Life and Local Community-Collaboration and Divisions among Workers in a North-Norwegian Fishing Village). Ph.D. Thesis, Institutt for Samfunnsvitenskap, Universitetet i Tromsø, Tromsø, Norway, 1975; 290. [Google Scholar]
  3. Gerrard, S. Kvinner i Fiskeridistrikter–fiskerinæringas” bakkemannskap”. Kan Fisk. Styres 1983, 217–241. [Google Scholar] [CrossRef]
  4. Porter, M. Time, the life course and work in women’s lives. Reflections from Newfoundland. Womens. Stud. Int. Forum 1991, 14, 1–13. [Google Scholar] [CrossRef]
  5. Frangoudes, K.; Keromnes, E. Women in artisanal fisheries in Brittany, France. Development 2008, 51, 265–270. [Google Scholar] [CrossRef]
  6. Kleiber, D.; Harris, L.M.; Vincent, A.C.J. Gender and small-scale fisheries: A case for counting women and beyond. Fish. Fish. 2015, 16, 547–562. [Google Scholar] [CrossRef] [Green Version]
  7. Frangoudes, K. Chapter 6: Women’s contribution in small-scale fisheries in the European Union. In World Small-Scale Fisheries: Contemporary Visions; Chuenpagdee, R., Ed.; Eburon: Delft, The Netherlands, 2011; pp. 101–115. [Google Scholar]
  8. Frangoudes, K.; Marugán-Pintos, B.; Pascual-Fernandez, J.J. Gender in Galician Shell-Fisheries: Transforming for Governability; Bavinck, M., Chuenpagdee, R., Eds.; MARE Publication Series 7; Springer: Dordrecht, The Netherlands, 2013; pp. 241–261. [Google Scholar]
  9. Kleiber, D.; Frangoudes, K.; Snyder, H.T.; Choudhury, A.; Cole, S.M.; Soejima, K.; Pita, C.; Santos, A.; McDougall, C.; Petrics, H.; et al. Promoting Gender Equity and Equality Through the Small-Scale Fisheries Guidelines: Experiences from Multiple Case Studies. In The Small-Scale Fisheries Guidelines; Jentoft, S., Chuenpagdee, R., Barragán-Paladines, M., Franz, N., Eds.; MARE Publication Series; Amsterdam University Press: Amsterdam, The Netherlands, 2017; Volume 14, pp. 737–759. [Google Scholar]
  10. Yodanis, C.L. Constructing gender and occupational segregation: A study of women and work in fishing communities. Qual. Sociol. 2000, 23, 267–290. [Google Scholar] [CrossRef]
  11. Bennett, E. Gender, fisheries and development. Mar. Policy 2005, 29, 451–459. [Google Scholar] [CrossRef]
  12. Williams, M.J. Why look at fisheries through a gender lens? Development 2008, 51, 180–185. [Google Scholar] [CrossRef]
  13. Calhoun, S.; Conway, F.; Russell, S. Acknowledging the voice of women: Implications for fisheries management and policy. Mar. Policy 2016, 74, 292–299. [Google Scholar] [CrossRef]
  14. Lentisco, A.; Lee, R.U. A Review of Women’s Access to Fish. In Small-scale Fisheries. Food and Agriculture Organization; Fisheries and Aquaculture Circular No. 1098; FAO: Rome, Italy, 2015; Volume 1098, ISBN 9789251088579. [Google Scholar]
  15. Alonso-Población, E.; Siar, S.V. Women’s Participation and Leadership in Fisherfolk Organizations and Collective Action in Fisheries. Fao Fish. Aquac. Circ. 2018, 1159, 48. [Google Scholar]
  16. Harper, S.; Grubb, C.; Stiles, M.; Sumaila, U.R. Contributions by Women to Fisheries Economies: Insights from Five Maritime Countries. Coast. Manag. 2017, 45, 91–106. [Google Scholar] [CrossRef]
  17. Kolding, J.; Béné, C.; Bavinck, M. Small-scale fisheries: Importance, vulnerability and deficient knowledge. In Governance of Marine Fisheries and Biodiversity Conservation: Interaction and Co-evolution; John Wiley & Sons, Ltd.: West Sussex, UK, 2014; pp. 317–331. ISBN 9781118392607. [Google Scholar]
  18. Frangoudes, K.; Carrol, M.; Holmyard, N.; Marcianiak, B.; Cristina, M.; Pascual-Fernandez, J.; Marugan Pintos, B.; Ronn, C.; Quist, C. The Role of Women in the Sustainable Development of European Fisheries Areas, European Parliament. Policy Department B: Structural and Cohesion Policies Fisheries (IP/B/TRAN/IC/2007_033, PE 389.586). 2008.
  19. Salz, P.; Buisman, E.; Smit, J.; de Vos, B. Employment in the Fisheries Sector: Current Situation (FISH/2004/4); Final Report; FISH/2004/4 (2006); European Commission: Brussels, Belgium, 2006. [Google Scholar]
  20. AGRERI. Social Variables Report; AGRERI: Athens, Greece, 2018. [Google Scholar]
  21. Liontakis, A.; Mantziaris, S.; Valakas, G.; Sintori, A.T.I. The Overlooked Role of Women in Fisheries: The Case of the Greek Small-Scale Fishing Sector; AGRERI: Athens, Greece, 2019. [Google Scholar]
  22. Harper, S.; Zeller, D.; Hauzer, M.; Pauly, D.; Sumaila, U.R. Women and fisheries: Contribution to food security and local economies. Mar. Policy 2013, 39, 56–63. [Google Scholar] [CrossRef]
  23. Kyvelou, S.S.I.; Ierapetritis, D.G. Fisheries sustainability through soft multi-use maritime spatial planning and local development co-management: Potentials and challenges in Greece. Sustainability 2020, 12, 2026. [Google Scholar] [CrossRef] [Green Version]
  24. Santos, A.N. Fisheries as a way of life: Gendered livelihoods, identities and perspectives of artisanal fisheries in eastern Brazil. Mar. Policy 2015, 62, 279–288. [Google Scholar] [CrossRef]
  25. Zhao, M.; Tyzack, M.; Anderson, R.; Onoakpovike, E. Women as visible and invisible workers in fisheries: A case study of Northern England. Mar. Policy 2013, 37, 69–76. [Google Scholar] [CrossRef]
  26. Scientific Technical and Economic Committee for Fisheries (STECF). Scientific, Technical and Economic Committee for Fisheries (STECF): The 2019 Annual Economic Report on the EU Fishing Fleet (STECF 19-06); Publications Office of the European Union: Luxembourg, 2019; Volume JRC 97371, ISBN 9789276095170. [Google Scholar]
  27. Béné, C. Small-Scale Fisheries: Assessing Their Contribution To Rural Livelihoods in Developing Countries; Food and Agriculture Organization: Rome, Italy, 2006; Volume 1008. [Google Scholar]
  28. Jentoft, S. Walking the talk: Implementing the international voluntary guidelines for securing sustainable small-scale fisheries. Marit. Stud. 2014, 13. [Google Scholar] [CrossRef] [Green Version]
  29. Scientific Technical and Economic Committee for Fisheries (STECF). Social data in the EU fisheries sector (STECF-19-03); Publications Office of the European Union: Luxembourg, 2018. [Google Scholar]
  30. Gasson, R. Farm Diversification and Rural Development. J. Agric. Econ. 1988, 39, 175–182. [Google Scholar] [CrossRef]
  31. Overbeek, G.; (AUA) Efstratoglou, S.; (CRES) Saraceno, E. Labour Situation and Strategies of Farm Women in Diversified Rural Areas of Europe; Executive Summary; Office for Official Publications of the European Communities: Luxemburg, 1999. [Google Scholar]
  32. Haugen, M.S.; Blekesaune, A. Farm and Off-farm Work and Life Satisfaction Among Norwegian Farm Women. Sociol. Rural. 2005, 45, 71–85. [Google Scholar] [CrossRef]
  33. Ilak Peršurić, A.S. Social roles of farmwomen: The case of croatia. Agric. Econ. 2011, 57, 297–307. [Google Scholar] [CrossRef] [Green Version]
  34. The WorldFish Center Gender and fisheries: Do women support, complement or subsidize men’s small-scale fishing activities? Key Messages. Issues Br. 2108 2010, 2108, 8.
  35. Mann, H.B.; Whitney, D.R. On a Test of Whether one of Two Random Variables is Stochastically Larger than the Other. Ann. Math. Stat. 1947, 18, 50–60. [Google Scholar] [CrossRef]
  36. Van Calker, K.J.; Berentsen, P.B.M.; De Boer, I.M.J.; Giesen, G.W.J.; Huirne, R.B.M. An LP-model to analyse economic and ecological sustainability on Dutch dairy farms: Model presentation and application for experimental farm “de Marke.”. Agric. Syst. 2004, 82, 139–160. [Google Scholar] [CrossRef]
  37. Van Calker, K.J.; Berentsen, P.B.M.; Giesen, G.W.J.; Huirne, R.B.M. Identifying and ranking attributes that determine sustainability in Dutch dairy farming. Agric. Hum. Values 2005, 22, 53–63. [Google Scholar] [CrossRef]
  38. O’Donoghue, C.; Ballas, D.; Clarke, G.; Hynes, S.; Morrissey, K. Spatial Microsimulation for Rural Policy Analysis; O’Donoghue, C., Ballas, D., Clarke, G., Hynes, S., Morrissey, K., Eds.; Advances in Spatial Science; Springer: Berlin, Heidelberg, 2012; ISBN 978-3-642-30025-7. [Google Scholar]
  39. Tzouvelekas, V.; Pantzios, C.J.; Fotopoulos, C. Technical efficiency of alternative farming systems: The case of Greek organic and conventional olive-growing farms. Food Policy 2001, 26, 549–569. [Google Scholar] [CrossRef]
  40. Ryan, M.; Buckley, C.; Dillon, E.J.; Donnellan, T.; Hanrahan, K.; Hennessy, T.; Moran, B. The Development of Farm-Level Sustainability Indicators for Ireland using the Teagasc National Farm Survey. In Proceedings of the 88th Annual Conference Agricultural Economics Society, Paris, France, 9–11 April 2014. [Google Scholar]
  41. Liontakis, A.; Tzouramani, I. Economic sustainability of organic aloe vera farming in Greece under risk and uncertainty. Sustainability 2016, 8, 338. [Google Scholar] [CrossRef] [Green Version]
  42. Kumbhakar, S.C.; Lovell, C.A.K. Stochastic Frontier Analysis; Cambridge University Press: Cambridge, UK, 2000; ISBN 9781139174411. [Google Scholar]
  43. Charnes, A.; Cooper, W.W.; Rhodes, E. Measuring the efficiency of decision making units. Eur. J. Oper. Res. 1978, 2, 429–444. [Google Scholar] [CrossRef]
  44. Farrell, M.J. The Measurement of Productive Efficiency. J. R. Stat. Soc. Ser. A 1957, 120, 253. [Google Scholar] [CrossRef]
  45. Coelli, T.J. A guide to DEAP Version 2.1: A Data Envelopment Analysis (computer) program. CEPA Work. Pap. 1996. [Google Scholar]
  46. ILO. Global Employment Trends for Women 2009; Employment Analysis Unit, Employment Strategy Department, International: Geneva, Switzerland, 2009; ISBN 9789221221227. [Google Scholar]
  47. Tzanatos, E.; Georgiadis, M.; Peristeraki, P. Small-Scale Fisheries in Greece: Status, Problems, and Management. In Small-Scale Fisheries in Europe: Status, Resilience and Governance; Springer: Dodrecht, The Netherlands, 2020; pp. 125–150. [Google Scholar]
  48. Pinello, D.; Liontakis, A.; Sintori, A.; Tzouramani, I.; Polymeros, K. Assessing the efficiency of small-scale and bottom trawler vessels in Greece. Sustainability 2016, 8, 681. [Google Scholar] [CrossRef] [Green Version]
Figure 1. Share of women labor groups in Greek small-scale fisheries.
Sustainability 12 05304 g001
Figure 2. Share of crews with and without women, based on the total number of crew members.
Sustainability 12 05304 g002
Figure 3. Education (a) and age class (b) distribution for male and female employment.
Sustainability 12 05304 g003
Figure 4. Paid and unpaid labor (a) and onshore/onboard employment (b) per gender in small-scale fisheries.
Sustainability 12 05304 g004
Table 1. Fishing Effort, Social, and Economic indicators for which comparative analysis takes place.
Fishing effortSocialEconomic
1. Number of fishing days per year
2. Fuel consumption per fishing day (lt/day)
1. Hours worked per fishing day
2. FTEs
3. Total jobs
1. Revenues per fishing day (€/day)
2. Cost items per fishing day (€/day)
- Fuel cost
- Repair & maintenance
- Personnel cost
- Imputed value of unpaid labor
- Other variable costs
- Non-variable costs
- Capital costs
3. Gross Profit (€)
4. Fishing Family Income (FFI) (€)
5. FFI margin (%)
6. Gross Value Added (€)
7. Labor productivity (€)
Table 2. Average working hours per year for male and female employees in small-scale fisheries.
GenderAverage working hours per year 1
Male1769
Female1525
1 Statistically significant difference among genders using Mann–Whitney test (z = 0.048)
Data source: Primary data collected for the Greek Work Plan for data collection in the fisheries and aquaculture; authors processing.
Table 3. Share of catch distribution channel in vessels with crews with and without women.
Market ChannelsNo Women on CrewWomen on Crew
Wholesaler13.78%10.00%
Processing0.43%0.00%
Fisheries stores19.61%12.93%
Direct sales to consumers **46.8%61.22%
Restaurants10.20%6.71%
Self-consumption9.18%9.15%
** Statistically significant differences among the two groups (at 0.05 level of significance, z= -2.108) using Mann–Whitney test.
Data source: Complementary survey, parallel to the Greek Work Plan for data collection in the fisheries and aquaculture; authors processing.
Table 4. Average values of various indicators per vessel groups based on vessel length and the presence of women in crew.
No Women on CrewWomen in Crew
Indicators0–6m6–12mAll vessels0–6m6–12mAll vessels
Effort indicators
Days at sea140186176158189185
Fuel consumption per day at sea7.5719.4816.8411.0019.4418.41
Social indicators
FTEs0.681.010.941.29 *1.65 ***1.61 ***
Jobs1.101.361.301.80 ***2.28 **2.22 ***
Working hours per day9.313.512.616.1 ***19.5 **19.1 ***
Economic indicators
Value of landings per day at sea68.33116.18105.5797.82 **138.32 **133.38 ***
Imputed Value of Unpaid labor per day47.048.948.573.2 **73.3 ***73.3 ***
Variable cost per day at sea 5.8313.8712.083.7913.0011.88
Repair & Maintenance cost per day at sea 4.059.288.122.627.887.24
Gross Profit per day at sea−0.6311.068.461.5512.2110.91
Family income per day at sea46.3859.9556.9474.76 **85.47 ***84.16 ***
Family Income Margin0.620.550.560.720.61 ***0.63 ***
GVA6,60711,60410,49611,401 **16,862 ***16,196 ***
Labor productivity11,37712,69012,39911,52517,797 **17,032 **
* Statistically significant differences among the corresponding group with no women on crew at 0.10 level of significance, using Mann–Whitney test.
** Statistically significant differences among the corresponding group with no women on crew at 0.05 level of significance, using Mann–Whitney test.
*** Statistically significant differences among the corresponding group with no women on crew at 0.01 level of significance, using Mann–Whitney test.
Data source: Primary data collected for the Greek Work Plan for data collection in the fisheries and aquaculture; authors processing.
Table 5. Average values of technical efficiency per vessel groups based on vessel length and the presence of women in crew.
No Women in CrewWomen in Crew
Variables0–6m6–12mAll Vessels0–6m6–12mAll Vessels
Technical Efficiency0.860.750.780.810.780.78

