Abstract
The amount of live and dead coral is related to recruitment, but differentiating them by remote sensing techniques is difficult. We measured change in the amount of live, bleached, and recently (<6 months) dead coral cover (CCA6) for an island archipelago in the South China Sea. Six Landsat 4/7 ETM/8 OLI images from 1989–1990, 2005, and 2014 were analyzed to assess changes in CCA6 at 14 coral reefs in the western Xisha Islands. Satellite images were georectified and calibrated to remote sensing reflectance. Models for three shallow water (<6 m) geomorphic zones throughout the western Xisha Islands are proposed based on ground-truthed data collected in 2014 and satellite-determined spectral values for 2014 images. Nonlinear models based on Landsat image blue spectral bands for reef slope and lagoon habitats, and green bands for reef flat habitats, are determined as optimal models. Significant changes in CCA6 from 2005 to 2014, and changes in coral reefs and geomorphic zones, correlate with increased numbers of both crown-of-thorns starfish, and sea surface temperature in 2007. Detecting change in CCA6 by remote sensing can provide large-scale information of value for coral reef management, restoration, and protection.
1. Introduction
Worldwide, coral reefs are under threat from climate warming [1], rising sea levels [2], increased frequency and intensity of El Niño-Southern Oscillation (ENSO) events [3], and local anthropogenic disturbances such as overfishing [4]. These stressors contribute to decreased live coral cover on many coral reefs [5,6,7], for which the long-term outlook is “poor, and getting worse” [8].
On healthy corals, more than 80% of tissue is typically alive. Recently (<6 months) dead coral typically retains corallite structure which, with the passing of time, grazing fish and sea urchins obliterate. Accordingly, the skeletons of dead corals that retain corallite structure provide valuable information, in that they indicate that coral mortality was recent (<6 months) [9]. The sum of areas of live, bleached, and recently (<6 months) dead coral, hereafter referred to as “live to recently (<6 months) dead coral”, provides an indication of coral cover area (CCA) over a six-months (the length of time corallite structure remains) period (CCA6). Because the amounts of live and dead coral are related to coral recruitment [10], dynamic mapping of CCA6 facilitates planning of coral reef management, protection, and recovery.
Analysis of remote-sensed data enables time- and cost-efficient monitoring of the status of coral reef communities over greater spatial scales (hundreds or thousands of kilometers) than is possible using conventional field surveys. However, coral reef ecosystems are highly heterogeneous, and thus, while spectral measurements can differentiate corals and algae when measured at narrow spectral bands (1–2 nm) using a hand-held spectroradiometer [9,11], differentiating live from dead corals is more difficult because the latter lack a unique spectral signature [9]. In recent years, the number of coral reef studies using remote-sensing techniques has increased as orbital sensors with better spatial and spectral resolutions have become available. High-spatial-resolution sensors such as IKONOS, Quickbird, and WorldView-2 (4 m, 2.4 m and 1.8 m, respectively), and airborne hyperspectral sensors (e.g., Compact Airborne Spectrographic Imager—CASI), have now all been used [12,13,14,15,16,17,18,19] to improve the accuracy of coral cover maps compared with traditional spatial resolution sensors, such as Landsat. Nevertheless, Landsat data remain the mainstay for detecting change in coral reef habitats because of the vast extent of these images, their free availability [20,21,22,23], and because the Landsat archive remains the best source of satellite data for many parts of the world. While Landsat data have been used to define coral reef habitats into very broad classes (e.g., sand, coral, rock, rubble), their ability to accurately discriminate live from dead coral or algae, or healthy from bleached corals, is low [9,24,25,26,27,28].
The South China Sea (SCS), adjoining the western Pacific Ocean, is the largest marginal sea in southeastern Asia. Reefs here cover an area over 30000 km2 [29], they host high levels of biodiversity, and they supply goods and services such as fish, tourism, and coastal protection for neighboring countries and to many people [30]. Unfortunately, live coral cover throughout this region has declined significantly over the past 30 years, with stressors including overfishing, outbreaks of crown-of-thorns starfish, and changes in water temperature [7]. While no systematic monitoring of coral cover has been undertaken throughout most of this area, field surveys from 1984 to 2006 determined that coral reefs have changed little, although in 2007 they did degrade rapidly [31]. A such, our aims became: (1) to develop a model to measure CCA6 for the western Xisha Islands using Landsat remote-sensed data; and (2) to identify any change (temporal or spatial) in CCA6 throughout this region over a 24-year period (1990–2014).
2. Materials and Methods
2.1. Study Area
The Xisha Islands, located at 15°46′–17°8′ N, 111°11′–112°47′ E, form one of four archipelagos in the northern-central SCS. This archipelago is influenced by the East Asian monsoon system, which varies significantly seasonally, with annual sea surface temperatures (SST) from 23–30 °C [32]. More than 30 reefs occur in this region, with coral taxa comprising 204 species attributed to 13 families and 50 genera [33].
Our study area (Figure 1) in the western Xisha Islands is about 105 km in length and 95 km in width. Here, coral reefs vary from complex to simple atolls, and table reefs. This area can be split along its north–south axis into: (1) a northern part featuring the complex Yongle Atoll, comprising 10 separate small reefs in a reef rim, encircling a large (about 200 km2) and deep (about 40 m) semi-enclosed lagoon with many patch reefs, and several wide channels to the open sea (Figure 1) [34]; and (2) a southern part comprising three isolated simple atolls and one table reef—the Huaguang and Yuzhuo reefs, Panshi Islet, and Zhongjian Island.
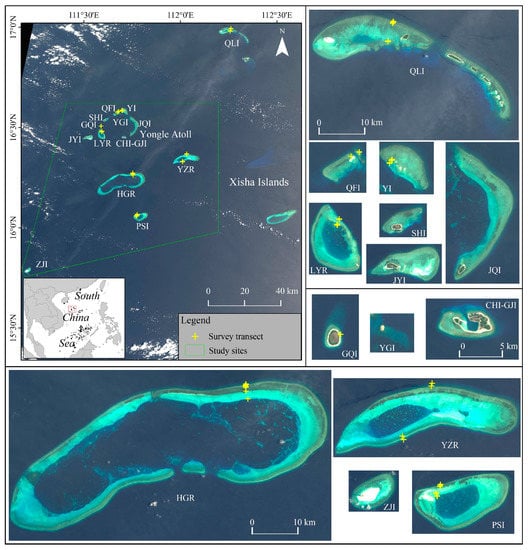
Figure 1.
Study sites (coral reefs in green polygon), western Xisha Islands, South China Sea (SCS). Islets: Panshi (PSI), Qilian (QLI), and Yin (YI). Islands: Chenhang and Guangjin (CHI–GJI), Ganquan (GQI), Jinqing (JQI), Jinyin (JYI), Quanfu (QFI), Shanhu (SHI), Yagong (YGI), and Zhongjian (ZJI). Reefs: Lingyang (LYR), Huaguang (HGR), and Yuzhuo (YZR). The true color image is an RGB mosaic of Landsat 8 data derived from 22 April 2014.
2.2. Data Acquisition
2.2.1. Field Data
From 1–7 June 2014, field surveys at 42 sites on seven reefs in the study area were undertaken (Figure 1). Data comprised 20m GPS-referenced digital-video transects using a Canon camera across reef slope, reef flat, and lagoon habitat (Table 1). For each transect, a 20 m tape was laid out perpendicular to the coastline and a snorkeler or diver swam its length over the bottom and took video of the benthos from a set height, usually 0.5–1.5 m off the seabed (depending on water clarity). Each observation was georeferenced using a small boat and a hand-held GPS (1 m precision) to record the start and end locations of each transect. Six transects at Qilian Islet(QLI) outside the study sites, in the northern Xisha Islands, were also used for model building. Accessibility, and weather and sea conditions contributed to an uneven distribution of sampling transects in geomorphic zones on each reef (Table 1).

Table 1.
Numbers of surveyed transects: Yuzhuo (YZR), Huaguang (HGR), and Lingyang (LYR) reefs; Panshi (PSI), Yin (YI), and Qilian (QI) islets; and Ganquan (GQI) and Quanfu (QFI) islands.
Digital video was converted to still frames and archived as JPEGs. Nonoverlapping images were selected for point counting, which was carried out using CPCe software [35] to identify corals and “others”. Each frame was assigned 10 randomly chosen coordinate points [36]. Corals beneath the line transect were categorized into one of “live”, “bleached”, “recently dead”, or “old dead” colonies [9] (Table 2, Figure 2). We calculated CCA6 in each transect based on sums of live coral cover (%), bleached coral cover (%), and recently dead coral cover (%).
Table 2.
Classification system for live and dead corals [9].
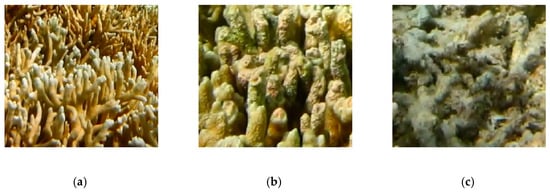
Figure 2.
Images of live and dead Montipora coral in field surveys. (a) Live, (b) recently dead, (c) old dead. Coral color changes in the transition from healthy tissue with zooxanthella on live specimens to algae on dead skeletons. Exposure of the underlying calcium carbonate skeleton is also evident because of fish and sea urchin grazing.
2.2.2. Satellite Data
We used two of each of Landsat 4 TM, 7 ETM+, and 8 OLI images in 1989–1990, and in 2005 and 2014, for which summary details are provided in Table 3. Landsat TM data have seven spectral bands, with a spatial resolution of 30 m for bands 1–5 and 7. Landsat ETM+ data have eight spectral bands, with a spatial resolution of 30 m for bands 1–7, and the resolution for band 8 is 15 m. Landsat 8 data have nine spectral bands, with a spatial resolution of 30 m for bands 1–7 and 9, and the resolution for band 8 is 15 m.
Table 3.
Summary data for satellite images used to build models and detect change in coral cover, Xisha Islands.
For radiometric corrections, ENVI ver. 5.1 software was used to convert digital number values to at-sensor radiance according to gain and offset values. For atmospheric correction, Landsat image bands were normalized using an empirical line calibration approach using pseudo-invariant features (sand and deep water) [24]. Geometric corrections used 2014 images for reference. Landsat images in 1989–1990 and in 2005 were corrected using Landsat 8 images for reference (Landsat 8 corrected). Corrected images were regarded acceptable if the root mean square error (RMSE) was one-half pixel wide (RMSE = 0.5).
2.3. Correlation Analysis and Model Building
Using pre-processed remote sensing images and field measured CCA6 for 2014, we could build our model. Areas of true coral are generally poorly classified in habitats dominated by algae or seagrass, but highly accurate if image processing is stratified by geomorphic zone [17,37]. Therefore, we built models for reef slope, reef flat, and lagoon geomorphic zones separately, and to determine the accuracy of these individual models, built a further one for CCA6 based on the entire reef. Because benthos on coral reefs is best discriminated using wavelengths between 400 and 600 nm [38], we selected the blue and green bands of Landsat images for modeling. Light attenuation was also weakest (mostly <0.1 m−1 in type II ocean water) in these blue and green bands [38].
Benthic sampling transects (surveyed in June 2014) were located on Landsat 8 images (taken in April 2014). The correlation coefficient between blue and green band reflectance values on these Landsat images with those of field measurements was computed using Pearson correlation analysis for each geomorphic zone (reef slope, reef flat, and lagoon). Regression analyses were performed using SPSS 19.0 software. Optimal fitting models were compared and finally taken according to the R2 values of equations. Because classification accuracy decreases dramatically at water depths >8.0 m [11,15], we built our models for shallow water (<6 m). Because the seawater around the Xisha Islands is clear, with low suspended matter, sediment, and phytoplankton, especially at depths <6 m, we made no spectral correction for the water column.
Quantitative validation of model effects was conducted using field measured values for CCA6 at our 42 surveyed sites. Because these data were used in model building, we cross-validated them using a “leave-one-out” method [39] in Microsoft Excel 2010. CCA6 values for each geomorphic zone on surveyed reefs were compared with Landsat data to validate the model effects.
2.4. Detecting Change in Coral Cover
Optimal models for each geomorphic zone based on 2014 Landsat images were used to extract CCA6 data from Landsat images for 1989–1990, 2005, and 2014. Because the tidal difference at the time satellite images taken from1989–1990–2014 and 2005–2014 was within ±70 cm (Table 2), we consider the influence of tide on coral reef substrate discrimination in these images to be negligible. We detected change (CCA6 in later years minus CCA6 in earlier years) on all reefs from 1989–1990–2005, and 2005–2014.
3. Results
3.1. Correlation Analysis and Statistical Modeling
Results of Pearson correlation analysis between transect CCA6 values and Landsat image blue and green band reflectance values are presented in Table 4. Negative correlation coefficients (r < 0) indicate a negative correlation between variables; as Landsat image blue and green band reflectance values increase, CCA6 values decrease. With the exception of the green band in the lagoon, p-values are <0.05, indicating correlations are statistically significant (at the 5% level).
Table 4.
Results of Pearson correlation analysis between Landsat image blue and green band reflectance values and field measured areas of live to recently (<6 months) dead coral cover.
CCA6 models based on satellite images are presented in Table 5. Models based on Landsat image blue bands had a higher R2 on reef slope (R2 = 0.8187) and lagoon (R2 = 0.8327) habitat. On reef flat habitat, the model based on the Landsat image green band behaved much better (R2 = 0.7417). Optimal models for the reef slope and lagoon based on the Landsat image blue band, and on reef flat based on Landsat image green band, were selected. Compared with models built for the entire reef (Table 5), recognizing geomorphic zones significantly improved model accuracy.
Table 5.
Optimal models based on Landsat image blue and green bands.
3.2. Mapping Coral Cover and Change
Shallow water (<6 m) CCA6 was about 72 km2 in 2014 (Figure 3). The CCA6 of reef slope, reef flat, and lagoon habitat are estimated to be 31.4 km2, 20.1 km2, and 20.4 km2, respectively. Based on our field survey, the proportion of live to recently dead coral was 0.6:0.4, 0.6:0.4, and 0.8:0.2 on reef slope, reef flat, and lagoon habitats, respectively (Table 6). Therefore, live coral cover throughout the study area is estimated to have been 18.8 km2 on the reef slope, 12.1 km2 on the reef flat, and 16.3 km2 within the lagoon in 2014.
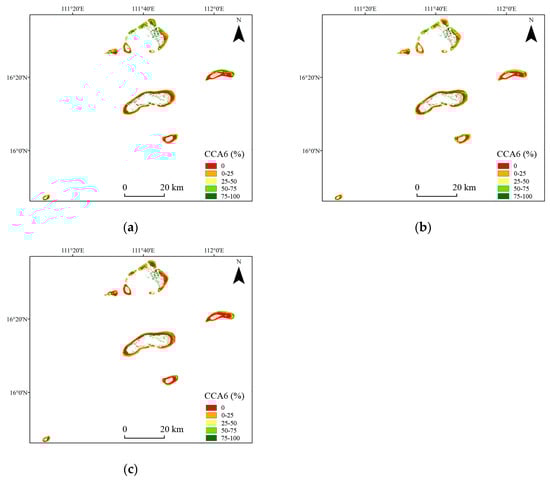
Figure 3.
Maps of live to recently (<6 months) dead coral cover (CCA6), Xisha Islands, 1989–1990 (a), 2005 (b), and 2014 (c).
Table 6.
Average coral cover in field surveys in geomorphic zones.
CCA6 in shallow water (<6 m) was about 84 km2 in 1989–1990, and 86 km2 in 2005 (Figure 3a,b). CCA6 changed little from 1989 to 2005, but decreased by 14 km2 between 2005 and 2014. CCA6 values for reef slope, reef flat, and patch reef in the lagoon exceeded about 75% between 1989 and 2005 (Figure 3a,b).
Table 7 and Figure 4 reveal changes in CCA6 between 1989 and 2005, and 2005 and 2014, for each reef. Between 1989 and 2005, CCA6 decreased significantly at Yin Islet, Quanfu, Jinqing, and Shanhu islands, and Yuzhuo Reef, but increased at Panshi Islet, Zhongjian, and Ganquan islands, and Lingyang Reef (Table 7). Between 2005 and 2014, CCA6 at nearly all reefs declined, with most located in Yongle Atoll (e.g., Lingyang Reef, and Ganquan, Jinqing, Chenhang, Guangjin, and Shanhu islands) (Table 7). It is noteworthy that CCA6 on the isolated Panshi Islet with a small cay also decreased more than at the isolated Huaguang and Yuzhuo reefs, both of which lack cays or islands (Table 7). Reef flat CCA6 declined more obviously between 2005 and 2014 than between 1989 and 2005 (Figure 4).
Table 7.
Area (km2) of live to recently (<6 months) dead coral cover (CCA6) throughout the western Xisha Islands: 1989–1990, 2005, and 2014 and rates of CCA6 changes in percent for the period of 1989–2005 and 2005–2014.
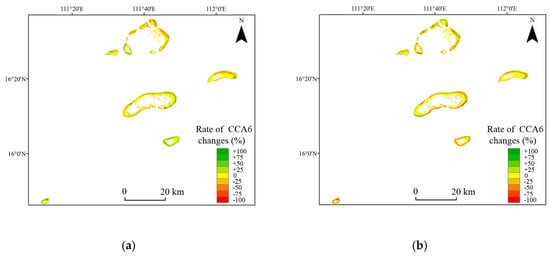
Figure 4.
Change (CCA6 in later years minus CCA6 in earlier years) in live to recently (<6 months) dead coral cover (CCA6) throughout the western Xisha Islands: (a) 1989–2005; (b) 2005–2014.
3.3. Accuracy Assessment
Validation results are shown in Figure 5. The cross-validation determination coefficient (R2) is 0.8019, with an RMSE of 0.1471. Predictions of CCA6 from Landsat and field surveys for the geomorphic zones on reefs are presented in Table 8. The correlation between field-estimated CCA6 and Landsat-derived CCA6 in geomorphic zones is high (R2 = 0.781; Figure 6), indicating that the two datasets are consistent. Reef flat data for Yuzhuo Reef and for Huaguang Reef lagoon are excluded from analysis because no CCA6 occurred in field transects (Table 1). These results demonstrate our models for estimating the area of live to recently (<6 months) dead coral cover using Landsat data are valid and useful.
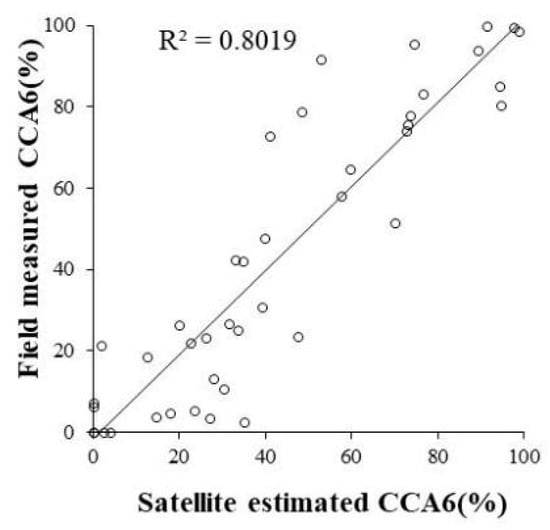
Figure 5.
Cross-validation of estimated live to recently (<6 months) dead coral cover (CCA6).
Table 8.
Live to recently (<6 months) dead coral cover (CCA6) area (km2) estimated for geomorphic zones using satellite data and field surveys.
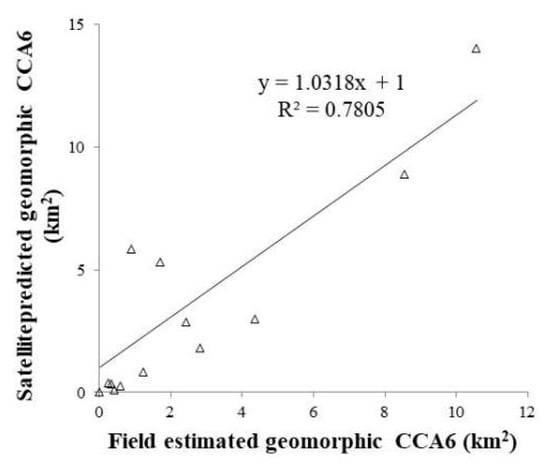
Figure 6.
Linear correlation coefficient between live to recently (<6 months) dead coral cover (CCA6) determined from field surveys and satellite images.
4. Discussion
4.1. Model Effectiveness
Estimates of CCA6 based on near-concurrently collected data from field surveys and Landsat images are strongly correlated (R2 = 0.781). Therefore, at least for these reefs, information obtained from vastly different techniques, at different spatial scales, can provide comparable measurements for CCA6. We caution against generalizing this correlation to other sites until models have been similarly built and tested elsewhere.
Cross-validation enables detection of habitat class misclassifications, the highest occurrence of which, because of the spectral similarity [11,15,28], is most likely between live to recently (<6 months) dead coral (CCA6) and macroalgae and seagrass, especially on reef flats and in lagoon habitat; we observed no instance of misclassification between CCA6 and sand. Our models, based on geomorphic segmentation, reduced misclassifications between habitats, although misclassifications within a zone require improvement. Because we randomly selected our field transects, and some transects in lagoon habitat comprised 100% sand, we consider it better to estimate large-scale CCA6 from satellite data. Compared with previous studies that have focused on identifying changes in coral reefs combining remote sensing and in situ data [20,21,22,23,25], our study demonstrates the usefulness of geomorphic segmentation for discriminating habitat.
We did not correct for the water column, which is often required to extract information from shallow bottoms using remote sensing optical images. We determined that CCA6 models constructed in shallow water (<6 m) after water column correction using Lyzenga’s algorithm [40,41] based on visible bands were less effective than optimal models in Table 5. The low performance of this procedure may be because the method produced only a single band index using both bands in the visible range. The loss of a dimension did not improve accuracy, even after correction for deep-water effects. This phenomenon was also found when Mumby et al. [42] applied water-column corrections in MSS/Landsat and Multi-/Satellite Pour l’Observation de la Terre sensors (XS/SPOT) images to map reef habitat types.
4.2. Trends on Reefs in the Western Xisha Islands
Consistent with observations from field surveys, Landsat-derived CCA6 increased slightly between 1989 and 2005, and significantly decreased between 2005 and 2014. Live coral cover reached 65–70% in the Xisha Islands before 1984 and between 2005 and 2006 [31]. CCA6 on reef slopes, reef flats, and patch reefs in the lagoon, exceeded 75% in 1990 and 2005 (Figure 3). Between 2005 and 2014, coral reefs degraded, particularly in 2007 because of bioerosion, warm water, ocean acidification, and overfishing [31,33]. Outbreaks of the coral-eating crown-of-thorns starfish (Acanthaster planci) also contributed to declines in cover of live coral in this area, with the numbers of starfish growing exponentially from 2005 to 2009 [31]. Outbreaks of this starfish also caused high mortality of many coral reefs elsewhere, such as through the Indo-Pacific from the 1940s to 1980s [43]. Because an El Niño event occurred in 2006, and satellite data indicated a period of about three weeks (average) of increased SST thermal stress around the western Xisha Islands in 2007 [32], thermal stress may also have contributed to coral degradation. Excessively high SST was earlier considered to have indirectly caused coral reef degradation around the Xisha Islands [31].
Increased CCA6 on reef flats between the years 2005 and 2014 indicated this habitat was more degraded than that of reef slopes or lagoons. This may be related to the fast-growing Montipora and Acropora corals, which dominated these areas, and that the branching M. digitata was most abundant [44]. These species occurs on reef flats where disturbance is infrequent, and it grows fast and fragments often. If conditions are favorable, transported pieces of this coral and its recruits can establish and thrive in reef flat zones, rendering this zone capable of faster recovery than others.
The isolated Huaguang and Yuzhuo reefs are considered relatively pristine compared with other coral reefs closer to human populations, such as the large Yongle Atoll and Panshi Islet with a cay [33]. Not surprisingly, estimates of CCA6 at Yongle Atoll and Panshi Islet were greater than those for Huaguang and Yuzhuo reefs (Table 6). Field surveys suggest that reefs affected by humans have lower species richness and diversity than those that are not [33]. In the SCS, from 1980–2010, coastal development, pollution, and over- and destructive fishing have all contributed to at least an 80% decline in coral abundance on coastal fringing reefs along the Chinese mainland and adjoining Hainan Island [7]. Management of reefs in the Xisha Islands to protect them from human activities will help them cope better with climate and associated oceanographic change.
5. Conclusions
We deem nonlinear optimal models for reef slope and lagoon habitats based on Landsat image blue bands, and Landsat green band images for reef flat habitats, to be valid and useful for estimating CCA6 in shallow water(depth<6 m) around the Xisha Islands. Pre-segmenting geomorphic zones significantly improves the accuracy of models. Analysis reveals CCA6 in this region of about 84 km2 in 1989–1990, 86 km2 in 2005, and 72 km2 in 2014. While the CCA6 of reef slope, reef flat, and patch reef habitat in lagoon may have exceeded 75% between 1989 and 2005, it declined at nearly all reefs from 2005–2014. Two sites that are relatively highly affected by human activities, the large Yongle Atoll and Panshi Islet with a cay, have degraded more rapidly. Management of these reefs is required to protect them from human activity so that they can better cope with climate and associated oceanographic change. The CCA6 of reef flat habitat declined more obviously between 2005 and 2014 than between 1989 and 2005, attributable to establishment of an invasive branching species of Montipora coral; this habitat may recover faster than other geomorphic habitats in favorable conditions. We demonstrated that change in CCA6 can be detected by remote sensing, and that this can provide valuable large-scale information to facilitate management, restoration, and protection of coral reef ecosystems.
Author Contributions
X.Z., F.S., J.Z., and W.W. developed the study design and wrote the paper; X.Z. collected and analyzed the data; F.S. reviewed the article; F.S. and X.Z. acquired funding. All authors have read and agreed to the published version of the manuscript.
Funding
This research has been supported by the National Natural Science Foundation of China (Grant Number: 41801341); Guangxi Natural Science Foundation of China (Grant Number: 2018JJB150030); Strategic Priority Research Program of the Chinese Academy of Sciences (Grant Number: XDA13010400); and a grant from State Key Laboratory of Resources and Environmental Information System.
Acknowledgments
Wei Shi, Junmin Li, and Guoliang Zhou are thanked for their essential assistance in the field investigation.
Conflicts of Interest
The authors declare no conflict of interest.
References
- Pernice, M.; Hughes, D.J. Forecasting global coral bleaching. Nat. Clim.Chang. 2019, 9, 803–804. [Google Scholar] [CrossRef]
- Kuffner, I.B. Sea-level rise could overwhelm coral reefs. Nature 2018, 558, 378–379. [Google Scholar] [CrossRef] [PubMed]
- Yadav, S.; Alcoverro, T.; Arthur, R. Coral reefs respond to repeated ENSO events with increasing resistance but reduced recovery capacities in the Lakshadweep archipelago. Coral Reefs 2018, 37, 1245–1257. [Google Scholar] [CrossRef]
- Tebbett, S.B.; Bellwood, D.R.; Purcell, S.W. Sediment addition drives declines in algal turf yield to herbivorous coral reef fishes: Implications for reefs and reef fisheries. Coral Reefs 2018, 37, 929–937. [Google Scholar] [CrossRef]
- De’ath, G.; Fabricius, K.E.; Sweatman, H.; Puotinen, M. The 27-year decline of coral cover on the Great Barrier Reef and its causes. Proc. Natl. Acad. Sci. USA 2012, 109, 17995–17999. [Google Scholar] [CrossRef]
- Jackson, J.B.C.; Donovan, M.K.; Cramer, K.L.; Lam, V.V. Status and trends of Caribbean coral reefs: 1970–2012. In Global Coral Reef Monitoring Network; IUCN: Gland, Switzerland, 2014. [Google Scholar]
- Hughes, T.P.; Huang, H.; Young, M.L. The wicked problem of China’s disappearing coral reefs. Conserv. Biol. 2013, 27, 261–269. [Google Scholar] [CrossRef]
- Perry, C.; Alvarez-Filip, L.; Graham, N.A.J.; Mumby, P.J.; Macdonald, C. Loss of coral reef growth capacity to track future increases in sea level. Nature 2018, 558, 396–400. [Google Scholar] [CrossRef]
- Clark, C.D.; Mumby, P.J.; Chisholm, J.R.M.; Jaubert, J.; Andrefouet, S. Spectral discrimination of coral mortality states following a severe bleaching event. Int. J. Remote Sens. 2000, 21, 2321–2327. [Google Scholar] [CrossRef]
- Anders, K.; Stacy, J.; Chris, R.; Mitchell, L.; Stuart, P. Mapping coral reef resilience indicators using field and remotely sensed data. Remote Sens. 2013, 5, 1311–1334. [Google Scholar]
- Mumby, P.J.; Hedley, J.D.; Chisholm, J.R.M.; Clark, C.D.; Ripley, H.; Jaubert, J. The cover of living and dead corals from airborne remote sensing. Coral Reefs 2004, 23, 171–183. [Google Scholar] [CrossRef]
- Palandro, D.; Andréfouët, S.; Dustan, P.; Muller-Karger, F.E. Change detection in coral reef communities using Ikonos satellite sensor imagery and historic aerial photographs. Int. J. Remote Sens. 2003, 24, 873–878. [Google Scholar] [CrossRef]
- Benfield, S.L.; Guzman, H.M.; Mair, J.M.; Young, J.A.T. Mapping the distribution of coral reefs and associated sublittoral habitats in Pacific Panama: A comparison of optical satellite sensors and classification methodologies. Int. J. Remote Sens. 2007, 28, 5047–5070. [Google Scholar] [CrossRef]
- Collin, A.; Planes, S. Enhancing coral health detection using spectral diversity indices from WorldView-2 imagery and machine learners. Remote Sens. 2012, 4, 3244–3264. [Google Scholar] [CrossRef]
- Ian, L.; Stuart, P.; Chris, R. Mapping coral reef benthos, substrates, and bathymetry, using Compact Airborne Spectrographic Imager (CASI) data. Remote Sens. 2014, 6, 6423–6445. [Google Scholar]
- Carricart-Ganivet, J.P.; Nancy, C.T.; Israel, C.O.; Paul, B. Sensitivity of calcification to thermal stress varies among genera of massive reef-building corals. Plos One 2012, 7, e32859. [Google Scholar] [CrossRef]
- Newman, C.M.; Knudby, A.J.; LeDre, E.F. Assessing the effect of management zonation on live coral cover using multi-date IKONOS satellite imagery. J. Appl. Remote Sens. 2007, 1, 011504. [Google Scholar] [CrossRef]
- Scopélitis, J.; Andréfouët, S.; Phinn, S.; Chabanet, P.; Naim, O.; Tourrand, C.; Done, T. Changes of coral communities over 35 years: Integrating in situ and remote-sensing data on Saint-Leu Reef (la Réunion, Indian Ocean). Estuarine, Coast. Shelf Sci. 2009, 84, 342–352. [Google Scholar] [CrossRef]
- Ampou, E.E.; Ouillon, S.; Lovan, C.; Andréfouëta, S. Change detection of Bunaken Island coral reefs using 15 years of very high resolution satellite images: A kaleidoscope of habitat trajectories. Mar. Pollut. Bull. 2018, 131, 83–95. [Google Scholar] [CrossRef]
- Nurdin, N.; Komatsu, T.; AS, M.A.; Djalil, A.R.; Amri, K. Multisensor and multitemporal data from Landsat images to detect damage to coral reefs, small islands in the Spermonde archipelago, Indonesia. Ocean Sci. J. 2015, 50, 317–325. [Google Scholar] [CrossRef]
- El-Askary, H.; Abd El-Mawla, S.H.; Li, J.; El-Hattab, M.M.; El-Raey, M. Change detection of coral reef habitat using Landsat-5 TM, Landsat 7 ETM+ and Landsat 8 OLI data in the Red Sea (Hurghada, Egypt). Int. J. Remote Sens. 2014, 35, 2327–2346. [Google Scholar] [CrossRef]
- Yasir Haya, L.O.M.; Fujii, M. Mapping the change of coral reefs using remote sensing and in situ measurements: A case study in Pangkajene and Kepulauan Regency, Spermonde Archipelago, Indonesia. J. Oceanogr. 2017, 73, 623–645. [Google Scholar] [CrossRef]
- Gapper, J.J.; El-Askary, H.; Linstead, E.; Piechota, T. Coral reef change detection in remote Pacific islands using support vector machine classifiers. Remote Sens. 2019, 11, 1525. [Google Scholar] [CrossRef]
- Joyce, K.E.; Phinn, S.R.; Roelfsema, C.M.; Neil, D.T.; Dennison, W.C. Combining Landsat ETM+ and Reef Check classifications for mapping coral reefs: A critical assessment from the southern Great Barrier Reef, Australia. Coral Reefs 2004, 23, 21–25. [Google Scholar] [CrossRef]
- Palandro, D.A.; Andréfoüt, S.; Hu, C.; Hallock, P.; Müller-Karger, F.E.; Dustan, P.; Callahan, M.K.; Kranenburg, C.; Beaver, C.R. Quantification of two decades of shallow-water coral reef habitat decline in the Florida Keys National Marine Sanctuary using Landsat data (1984–2002). Remote Sens. Environ. 2008, 112, 3388–3399. [Google Scholar] [CrossRef]
- Hochberg, E.J.; Atkinson, M.J. Capabilities of remote sensors to classify coral, algae, and sand as pure and mixed spectra. Remote Sens. Environ. 2003, 85, 174–189. [Google Scholar] [CrossRef]
- Yamano, H.; Tamura, M. Detection limits of coral reef bleaching by satellite remote sensing: Simulation and data analysis. Remote Sens. Environ. 2004, 90, 86–103. [Google Scholar] [CrossRef]
- Holden, H.; LeDrew, E. Spectral discrimination of healthy and non-healthy corals based on cluster analysis, principal components analysis, and derivative spectroscopy. Remote Sens. Environ. 1998, 65, 217–224. [Google Scholar] [CrossRef]
- Morton, B.; Blackmore, G. South China Sea. Mar. Pollut. Bull. 2001, 42, 1236–1263. [Google Scholar] [CrossRef]
- Burke, L.; Selig, E.; Spalding, M. Reefs at Risk in Southeast Asia; World Resources Institute Press: Washington, DC, USA, 2006. [Google Scholar]
- Wu, Z.J.; Wang, D.R.; Tu, Z.G.; Li, Y.C.; Chen, J.R.; Zhang, G.X. The analysis on the reason of hermatypic coral degradation in Xisha. Acta Ocenanol. Sin. 2011, 33, 140–146. [Google Scholar]
- Zuo, X.; Su, F.; Wu, W.; Chen, Z.; Shi, W. Spatial and temporal variability of thermal stress to China’s coral reefs in South China Sea. Chin. Geogr. Sci. 2015, 25, 159–173. [Google Scholar] [CrossRef]
- Huang, H.; You, F.; Lian, J.S.; Yang, J.H.; Li, X.B.; Dong, Z.J.; Zhang, C.L.; Yuan, T. Species diversity and distribution of scleractinian coral at Xisha Islands, China. Biodivers. Sci. 2011, 19, 710–715. [Google Scholar]
- Chen, S.; Zhong, J. Xisha Islands, Short Records of Geography of the South China Sea Islands; Hainan People’s Publishing House: Haikou, China, 1989. [Google Scholar]
- Kohler, K.E.; Gill, S.M. Coral Point Count with Excel extensions (CPCe): A Visual Basic program for the determination of coral and substrate coverage using random point count methodology. Comput.Geosci. 2006, 32, 1259–1269. [Google Scholar] [CrossRef]
- Pante, E. Temporal Variation in a Bahamian Patch Reef Community: The Decline of Rainbow Gardens Reef; College of Charleston: Charleston, SC, USA, 2005. [Google Scholar]
- Andréfouët, S.; Kramer, P.; Torres-Pulliza, D.; Joyce, K.E.; Hochberg, E.J.; Garza-Pérez, R.; Mumby, P.J.; Riegl, B.; Yamano, H.; White, W.H.; et al. Multi-site evaluation of IKONOS data for classification of tropical coral reef environments. Remote Sens. Environ. 2003, 88, 128–143. [Google Scholar] [CrossRef]
- Minghelli-Roman, A.; Chisholm, J.R.; Marchioretti, M.; Jaubert, J.M. Discrimination of coral reflectance spectra in the Red Sea. Coral Reefs 2002, 31, 307–314. [Google Scholar] [CrossRef]
- Chen, W.; Sakai, T.; Moriya, K.; Koyama, L.; Cao, C. Estimation of vegetation coverage in Semi-arid sandy land based on multivariate statistical modeling using remote sensing data. Environ. Model. Assess. 2013, 18, 547–558. [Google Scholar] [CrossRef]
- Lyzenga, D. Passive remote sensing techniques for mapping water depth and bottom features. Appl. Opt. 1978, 17, 379–383. [Google Scholar] [CrossRef]
- Lyzenga, D.R. Remote sensing of bottom reflectance and water attenuation parameters in shallow water using aircraft and Landsat data. Int. J. Remote Sens. 1981, 2, 71–82. [Google Scholar] [CrossRef]
- Mumby, P.J.; Clark, C.D.; Green, E.P.; Edwards, A.J. Benefits of water column correction and contextual editing for mapping coral reefs. Int. J. Remote Sens. 1998, 19, 203–210. [Google Scholar] [CrossRef]
- Moran, P.J.; Bradbury, R.H.; Reichelt, R.E. Distribution of recent outbreaks of the crown-of-thorns starfish (Acanthaster planci) along the Great Barrier Reef: 1985–1986. Coral Reefs 1988, 7, 125–137. [Google Scholar] [CrossRef]
- Zuo, X.; Su, F.; Zhao, H.; Zhang, J.; Wang, Q.; Wu, D. Regional hard coral distribution within geomorphic and reef flat ecological zones determined by satellite imagery of the Xisha Islands, South China Sea. Chin. J. Oceanol. Limn. 2017, 35, 501–514. [Google Scholar] [CrossRef]
© 2020 by the authors. Licensee MDPI, Basel, Switzerland. This article is an open access article distributed under the terms and conditions of the Creative Commons Attribution (CC BY) license (http://creativecommons.org/licenses/by/4.0/).