Article

How Energy Retrofit Maintenance Affects Residential Buildings Market Value?

1
Department of Structural, Geotechnical and Building Engineering, Responsible Risk Resilience Centre, Politecnico di Torino, Corso Duca degli Abruzzi 24, 10129 Torino, Italy
2
Interuniversity Department of Regional and Urban Studies and Planning, Responsible Risk Resilience Centre, Politecnico di Torino, Viale Mattioli 39, 10125 Torino, Italy
*
Author to whom correspondence should be addressed.
Sustainability 2020, 12(12), 5213; https://doi.org/10.3390/su12125213
Submission received: 31 May 2020 / Revised: 19 June 2020 / Accepted: 23 June 2020 / Published: 26 June 2020
(This article belongs to the Special Issue Toward Smart Cities: Zero Energy Buildings)

Abstract

:
By now, it is clear the built environment could play an important role in fighting climate change, since it accounts for around 39% of global energy-related carbon emissions. Generally speaking, Italian residential stock is over 50 years old and around 16% of that needs large interventions due to its poor maintenance condition. So, the maintenance in this context can play a pivotal role in acheiving both energy efficiency and asset valorization. Introduced by a reference framework for the question in the title, this paper presents the case study: a portion of a working-class neighborhoods near the metropolitan city of Turin, marked by very recurrent typologies for the period (early seventies). The local real estate market is discussed to investigate the extraordinary maintenance impact on the property values: the paper considers the market value increase due to the energy class upgrade and the external look improvement. Individual owners putting money on this group of works get a very cost-effective investment and take advantage of Italian legislation supporting these kinds of interventions: the whole is greater than the sum of its parts and in turn greater than the cost assumed for the renovation work.

Graphical Abstract

1. Introduction

Temperatures have risen by 0.8 °C and 1.2 °C, with an average increase of about 0.2 °C per decade [1] from the preindustrial period (1850–1900) to the present day. This overwarming phenomenon, anything but isolated, is affecting the whole planet and is also causing an increase in extreme weather-related disasters that cause a substantial number of deaths every year: the main reasons for this overwarming must be found in the impact of anthropic activities and their greenhouse gas emissions. In December 2015, 195 countries adopted the first global climate deal, known as the Paris Agreement, during the Paris climate conference (COP21) to cope with this issue. In this document a global action plan was set out, putting the world on track to avoid dangerous climate change by limiting global warming to well below 2 °C and pursuing efforts to restrict it to 1.5 °C [2]. However, the Germanwatch’s 2019 report showed no state has achieved this latter desirable performance [3].
The built environment is currently responsible for 39% of global energy-related carbon emissions, where 28% comes from heating, cooling, and power, and 11% from materials and construction processes [4]. It is therefore clear the built environment can have an important role to play against climate change.
In Europe, residential buildings compose the building stock for the most part; their share goes from around 60% in the northern countries, for instance Austria and Slovakia, to more than 85% in the southern countries, like Italy and Malta [5,6].
Concerning newly built constructions, the regulations on heating, cooling, and lighting systems require the construction of buildings with almost zero energy consumption over their operational lives (NZEB, nearly zero energy building). However, regarding existing buildings, the issue is more complex. Indeed, in the most part of European countries around a half of residential building stock was built before 1970, that is to say before any energy regulations [7] (Figure 1).
By processing the last available Central Institute of Statistics (ISTAT) data, dating back to 2011, it was possible to see that over that 50% of the residential stock in Italy is over 50 years old and around 16% of it needs large maintenance interventions, because of its repair condition (Figure 2).
Extraordinary maintenance works achieve an extreme relevance in this background [8]. The Italian regulations describe these kinds of works as “the works and modifications necessary to renew and replace parts of buildings, including structural parts, as well as to implement and integrate sanitary fittings and technological services” [9]. If properly designed and applied, such a kind of building maintenance could be a useful tool to achieve some of the Sustainable Development Goals (SDGs), in particular the SDGs 11 and 13 [10]. Through these works, it is possible indeed to enhance existing buildings performances, for example by improving their structural stability, minimizing their energy needs, etc. To achieve resilient and sustainable cities, maintenance works need to be spread and applied as much as possible on the large part of the building fabric. In this framework, the principles of eco-districts could be a good response to sustainability needs: indeed, they aim to bring a higher quality life to the population, creating the conditions for a reduction of human-induced ecological impact [11]. These kinds of neighborhoods can be built ex novo or can be obtained through the renovation of existing blocks currently in a bad maintenance state.
In the latter case, all the building units’ owners in the entire neighborhood will have to join their forces and act as if they were a single client: this will give them more power to negotiate prices and, at the same time, allow them to design and create shared services for the entire community. Individual private investors are still culturally tied too much to the initial investment size and too little to the concept of the overall cost and service life of assets. To make conscious decisions concerning investments, it is therefore important owners are well informed that an initial investment in energy efficiency will result both in future savings deriving from lower energy needs and in a market value increase due to the implicit effect of the energy rating improvement.
The economic benefits of an investment to improve building energy efficiency can be classified into direct or indirect ones. The first depend on energy needs and they are directly evident on the management costs (lower costs on the energy bill). The latter are more difficult to be detected, instead they consist of an increase in the asset market value due to the improvement of its energy rating. This paper aimed to evaluate the economic benefits that could derive from an intervention designed to upgrade the energy efficiency of an existing district (i.e., acting on the whole asset and not only on singular building).
A group of buildings, part of the same district and with similar characteristics (construction features, year of construction, location, and intended use) was considered as a case study. The district is located in Italy, in a town near Torino in the Piedmont area.
In particular, the buildings’ most likely market value was firstly determined by referring to the preintervention state. Secondly, suitable technologies to improve energy efficiency in this kind of building were analyzed and the new most probable market value of the transformed assets was then estimated. Lastly, the private owners’ convenience to invest in this kind of intervention was verified.
The main reference sources on real estate prices were consulted in order to determinate the current preintervention average market value for the flats. The somewhat high availability of information on different building typologies has allowed defining an accurate average reference values for each class.
In every considered building stock, the performance obsolescence lowered its market value, with particular reference to energy demand. The large part of the obsolescence and energy issues is due to the poor (thermal) behavior of the facades. This is why the more effective way to increase the market value is to go through a building vertical envelope renovation and revamping the HVAC systems.
The most probable market value of the transformed asset has been estimated working incrementally to evaluate the growth of the values due to the energy rating jump on the one hand and, on the other, to improve the repair/maintenance state for the building stock.
Lastly, the work concludes by highlighting the private owners’ economic convenience in terms of the difference between the money invested (costs) and the value “incorporated” by the real estate.
For more than a decade, the Italian state has been paying tax bonuses to partially recover the intervention costs, in order to promote general renovation works mainly. Indeed, Italian regulations allow recovering up to 36% of what is spent in 10 yearly instalments by deducting it from the individual taxation. Over time, others bonuses have been added, such as those for energy savings (from 65% to 85%), new furniture, or private greenery. So far, in Italy the most interesting fiscal bonuses have been those on energy savings, due to the high percentage of deductible costs [12,13].

2. Materials and Methods

The Fiat Village is a neighborhood located southwest of the center of Settimo Torinese, a town in the Turin metropolitan area. It was built between 1961–1968 and as of today (2020) it consists of buildings with an average age of between 50 and 60 years (Figure 3 and Figure 4).
The district consists essentially of two kinds of buildings—tower and line, both made of multistory buildings with reinforced concrete structural frames and facing brick facades. The classification of buildings, depending on the type of construction, has been further developed in subclasses. In particular, the tower buildings have been organized in the subclasses “mini tower” and “tower”, according to the number of floors, respectively equal to or greater than four, while the line buildings have got three subclasses (“in-line with 2 stairs”, “in-line with 3 stairs” and “inclined 2 stairs”), according to the number of stairwells and the floor plan shape. Each building is also identified by a unique numerical code and the reference to the superstructure, so called “super-condominium”, which regulates the use of its common areas (Figure 4).
Through these subclasses, it was possible to group the buildings located in the considered area into five clusters: n°1 including the mini tower type building units, n°2 grouping those of the tower type, n°3 concerning those of the “in line 2 stairs” type, n°4 consisting of those of the “In Line 3 Stairs” type, and n°5 involving those of the inclined 2 stairs type.
The buildings’ average energy classes were indirectly obtained considering those in the selling adverts about the properties located in the targeted area. In Italy, this processing is fully law compliant, because it is mandatory to declare the building unit energy rating already in the selling advertisings [14].
Today, almost all the websites of the real estate companies allow finalizing the research of the selling or rental advertisements using specific filters in the query masks, according to the characteristics desired by the user. So, it was possible to run a search among the advertisements in the website of an Italian real estate company [15]: the search filters were the type of buildings (“flats and dwellings”), the type of the advertisement (“sales”), and the energy rating of the estate.
The searched website does not allow users to filter one energy rate in particular, but the query mask groups energy efficiency classes into three different categories: “high”, “medium”, or “low”, clustering together A, A+, A1, A2, A3, A4 classes; B, C, D classes; and also E, F, G classes respectively. Therefore, three separate searches were carried out (according to the elected energy rated) and the obtained results were analyzed to trace back the prevailing energy rating of the properties for sale in the selected area. Specifically, twenty-five matches were identified, of which nine did not specify their energy rating, fourteen fell into the “low” class, and two into the “medium” class, so it was considered correct to assume the reference energy rating of the properties in the Fiat Village was the “F”.

2.1. Description of the Intervention to Be Carried Out

The Fiat Village in Settimo Torinese is a typical example of postwar European residential district. By now, it consists of buildings that are over half a century old and thus at the end of their (supposed) service life, battling with outdated performances, vulnerability, lexical poverty, living discomfort, and decreasing value.
Among several European renovation-based experiences on postwar neighborhoods, a particular systemic and multibenefit approach (that is to say functional-, performance-, and look-based, etc.) on buildings’ envelope retrofitting has been consolidated, because it can better convey adaptive and subject-oriented works as well. This kind of approach suits particularly the Fiat Village district where the large-scale intervention not only updates each building’s energy performance, but also enhances the whole environmental sustainability in addition to an added value to environmental quality.
The original envelope of Fiat Village buildings consists of a traditional cavity masonry wall with brick texture veneer. The backup wall (inner layer) and veneer (outer layer) are almost independent of each other and separated by a cavity generally used to host the central heating piping and the plumbing system. Partial recladding of these existing fronts can keep the building usage ongoing during retrofit intervention and it can be considered an optimal strategy for these kinds of facades. The recladding works are targeted to the outer layer (brick veneer) only and to a general revamping of the HVAC and plumbing systems—the opportunity to install new water piping connected to sustainable systems (e.g., solar hot water, nondrinkable water to flush water closets vs. drinkable water, etc.) could go together with the general rebuilding of the media networks (fiber link, satellite TV, cable TV, and so on), thus getting a higher value for each apartment. Thanks to the updated performance of the newly built cladding, the thermal transmittance will decrease from about 2 W/m2K (original façade) to a value approximately equal or less than 0.2 W/m2K. As mentioned before, the back wall is kept in place with some adjustments to fit new high-performance windows and facilities—floorings, plasters, and inhabitants’ space are almost fully preserved.
The renovation proposed for the Fiat Village buildings is not only limited to technological works, but more articulated in order to create new services and improve the inhabitants’ living comfort: therefore, it can be defined more broadly as a “district-scale” intervention.
In fact, an “energy community” will be established to reduce condominium areas’ electricity bills through the installation of photovoltaic panels connected to storage batteries. In addition, the existing lighting system will be LED upgraded, replacing the existing condominium lights and installing new lightings in the outdoor areas for security reasons, as well the fact that access to each condominium will be controlled by way of new car access bars and a new video entry system.
The services for residents will be strongly enhanced by new spaces dedicated to personal services in which each family will be able to receive medical advice at any time of the day, a new condominium car sharing service, a new e-commerce point (Amazon, Ebay, etc.) to facilitate the delivery of users’ orders, a new Wi-Fi ultra-speed network for each building, and a single contract with an Italian energy marketing company to properly sell the energy overproduced by photovoltaic panels.

2.2. Summary of the Research

The price of each estate depends directly on its reference market (RM), which in turn is conditioned by supply/demand circumstances for similar goods in that specific area.
The graph reported in Figure 5 represents the trend of the deflated house price index (HPI) about residential properties purchased by households, both newly built and existing ones. The reported values show the real increase or decrease in the values of these goods because they were stripped out by the consumer price inflation. As it is possible to see, between 2008 and 2014, the real estate bubble that originated in the United States caused a decreasing trend; then, in 2015 the house prices began to increase more than the inflation, and this trend is still ongoing. However, this graph shows an average trend of the residential market in all the states in the Eurozone; in some countries the situation can be quite different—in 2018, for example, Hungary recorded an increase of 10.9%, whereas Italy suffered a decrease of 1.5% in the same period (Figure 6).
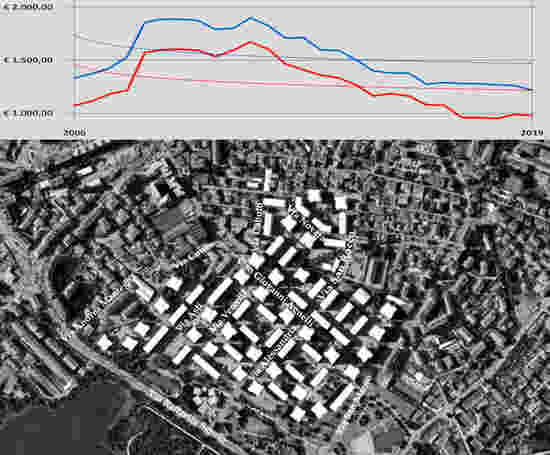
As far as the town of Turin is concerned, we processed the data provided by various sources (Estate Consultant, Real Estate Market Observatory, etc.) and we calculated their constant value, i.e., inflation-purged, referring to the year 2000 (year after the entry into force of the new Euro currency in financial markets). In this way, it was possible to reconstruct the trend of the reference market for new or renovated houses. Figure 7 shows this price has been subject to significant fluctuations over the years, the most recent of them from 2007 up until today. On that date (2007), the price of new or renovated homes was about €2450.00 per sqm of sale area, but, due to the crisis that began in the USA with the real estate bubble deflation, this price fell down in 2017 to a minimum of about €1600.00 per square meter (euro at year 2000). Since then, a slow lost value recovery phase has begun; perhaps, from a slightly optimistic point of view, it is possible to estimate that in 2021 the price of houses will be around 1700.00 €/sqm (expressed still in euro at year 2000).
The Fiat Village is located in a municipality in the first metropolitan belt of Turin, and therefore, the specific trend of the real estate market in this area has been traced. To do this, data collected in the Quotation Database of the Real Estate Market Observatory (QD REMO, that in Italy is known as “Data Base OMI”) were used, because in Italy these data are managed by the Inland Revenue (IR), that is a public body (known as “Agenzia delle Entrate” [17]) directly connected with the Ministry of Economy and Finance, so they have a good level of reliability.
Before going deeper into values and trends, it is useful to explain some general information on how this database gets updated.
The basis to set-up and update the QD REMO are the survey forms collecting information on the real estate market. They are divided into territorial or market areas according to the data recorded. Indeed, in the former, municipality and zone features influencing the market are reported, while in the latter, economic data of the real estate units are collected [18].
In particular, the municipality form reports the town’s population, the territorial position, the level of connecting facilities, and transportations besides its attractiveness according to the town’s historical, tourist, and naturalistic interests, as well as agricultural, commercial, or industrial importance. The zone form, on the other hand, reports the main aspects and peculiarities that influence the market values of sales and rentals in a specific homogeneous area of that municipality. Instead, the market form on the real estate unit reports an aggregation of information about both the whole building and the unit [18]. The surveyor must fill all these forms during the direct surveys he has carried out periodically, following the indications of the appropriate operational guide. In this way, a detailed survey of sales and rentals in a homogeneous zone is obtained, providing also the description of the building units’ features that are necessary for this study [18]. The set of survey forms acquired in each homogeneous market zone constitutes and feeds up continuously the database of the QD REMO.
Table 1 shows the mandatory fields in the survey forms according to the type of building units to be reviewed. Indeed, there are four categories of data that must be studied in any survey: the general data, in which the surveyor and the survey object are clearly identified; the data about the building, in which there are data overviewing the surrounding area and all the amenities that are or are not present near the building; the data on the real estate unit, describing its main features like the number of rooms or the floor level, etc.; the economic data reporting the total area of the building unit and its sales price or its estimated value or how much money the owner is requiring.
The annex of QD REMO contains the standardized survey forms for building units in the various building types. In particular, this annex reports the features to be evaluated in order to define the overall maintenance level of the building and the real estate unit, respectively. The building maintenance status is defined observing the state of the following items: façade, windows and doors, cladding and plaster in the common areas, atrium floors, stairs and common areas, lifts, intercoms and video intercom systems, electrical system, centralized HVAC system, sewerage and plumbing system. The real estate maintenance level must be assessed on the condition of floors, ceilings and wall claddings, internal and external windows and doors, electric installation, waterworks, heating and air conditioning systems, sanitary fittings, and alarm systems. Both as far as the maintenance state of the buildings and the real estate units are concerned, a synthetic evaluation must be given according to the number of features that are judged to be in good condition—“excellent” if there are at least eight, “normal” if there are at least five, “poor” when there are up to four [18].
The information acquiring activity in the surveys is carried out in collaboration with primary information sources, but the collection, use, and validation of all the data are the exclusive responsibility of the IR. According to the provisions of the manual, REMO’s surveyor must accurately know the object of the survey and, therefore, the features of the building and its territorial surroundings must be recognized and verified through ICT tools. Moreover, the surveyor cannot run an inspection in a virtual mode exclusively, reviewing the building through the use of existing databases such as Google Maps, Bing, and others [18].
The REMO half-yearly quotations (freely available online from the first half of 2006) derive from the processing of the above-mentioned data. The quotations identify in each specific homogeneous territorial zone (REMO’s zone) of each municipality, a minimum and maximum range of sales and rental unit prices, through the building type and state of conservation. This range of values refers to ordinary buildings. Therefore, the properties of particular value or deterioration or which in any case do not have ordinary characteristics compared to the buildings in the same area are excluded. For the same type of building more than one state of conservation can be detected; in this case, the prevailing one shall be in any case specified. It should also be noted that for shops and shopping centers, the ratings “excellent”, “normal”, and “poor” rely upon the commercial position and not on the conservation state of the building unit, because their market does not show any significant difference in appreciation of the different states of conservation.
The buildings under analysis are situated in a “semi-central” area (as defined by REMO) of Settimo Torinese and they are intended for residential use with generally good condition of maintenance—their reference market value was identified on this basis. Indeed, entering these data and questioning into the QD REMO, we obtained the parametric market values range for both civil dwelling (CD) and low-cost dwelling (LCD) in each half-year starting from 2006. The typical CD unit is a private flat that is part of a building with good general construction and layout characteristics. A CD is part of a residential building with a significant value of the finishing works (floorings, coverings, fixtures, and plants) and it generally has rational layout characteristics with a good architectural level. Instead, the typical LCD is a private housing unit that is part of a residential complex with coarse external finishes without valuable elements [19,20].
In order to trace back to 2006 using the historical data series published in the QD REMO, we turned them from current values to constant values, i.e., stripping out the inflation. Therefore, the values have been restored to the first half of 2006 using the consumer price indexes for blue-collar and white-collar households (in Italy: FOI) provided by the Central Institute of Statistics (ISTAT). The market trends of the CD and of the LCD for the case-study area are shown in Figure 8.
The information made available by a locally operating real estate brokerage company was processed through a direct estimation method for each type of estate to determine the preintervention average selling price per square meter of commercial area (PI-ASP). This brokerage company provided data about Fiat Village properties’ sales, which occurred between 1999 and 2018: the final global sale price; the location of the estate (address, floor number), and its state of conservation (original, partially renovated, completely renovated); the number of rooms; the commercial surface area; the year of selling; and the final sale price per square meter of commercial surface area (Figure 9, Figure 10, Figure 11, Figure 12, Figure 13, Figure 14 and Figure 15).
In this case too, sale prices per square meter of commercial area were stripped out of inflation and referred to the year 2006 using FOI indices provided by the NSO. Looking at the graph in Figure 16, it is easy to understand the obtained trend is similar LCD’s one, which was derived from data provided by REMO (Figure 9). Moreover, since dwellings in the area in question mostly belong to a low-cost housing category according to Land Registry classification (A/3 in the Italian Land Registry), it was deemed correct to take LCDs as the reference market.
As mentioned before, the first research goal is to define the most likely market value for Settimo Torinese Fiat Village dwellings. At the beginning, it was supposed to estimate the PI-ASP for each cluster by means of 2018 trade-only prices mediation. However, analyzing the available data, it was noticed they were numerically too little to be significant (3 sales only); therefore, it was decided to group together all the sales data from the oldest (1999) until the most recent (2018). All these data must take into account both the average price growth owing to the inflation and the effect of the real estate market developments, in order to obtain correct values for PI-ASP. Thus, all sale prices were first stripped-out of inflation and restored to 2018 using NSO’s indices (FOI), then, they were tuned using a coefficient derived from reference market direct observation, and finally the average prices of each cluster were extrapolated. The graph in Figure 16 shows a decreasing trend from 2006 to 2018 due to the sharp drop of dwelling sale prices.
Once this operation was carried out, the PI-ASP of each cluster was available and updatable to 2018. These values became the starting point to determine the new average sale price for each cluster, i.e., after the district energy revamping and the other planned works. In particular, it was believed real estate units’ value would increase because of both energy performance improvement (and the consequent energy cost savings) and the overall building improvement in its look and maintenance.
The multiple regression line, which is a direct multiparameter procedure to define asset market value, was used to assess the economic impact of the energy rating jump.
The regression has been widely used for a long time in real estate appraisal literature [21,22]. It describes the functional relationship between a dependent variable (Y, unknown) and a series of independent variables (Xi, measurable in a specific reference sample). Due to its versatility, this algorithm finds application in many fields of applied sciences, from chemistry to medicine, economic sciences, and even psychology. The generic function between Y and Xi is summarized by the following formula:
Y = α + β1 × 1 + β2X2 + … + βkXk + ε.
In the case of a real estate appraisal, the variable “Y” represents the price (i.e., the most probable market value), while Xi-k are the independent k-variables (the so-called intrinsic and extrinsic real estate features) and βi-K are the coefficients of regression, which represent the incidence of each single feature on the value of the asset.
Referring both to some recent literature on energy performance and housing prices in Europe and Italy [23,24,25] and to the authors’ previous research (aimed at estimating energy rating incidence on property market value in very similar real estate markets to the one of this survey), it was possible to approximate each energy rating upgrade increase of about 2% the estate value (R2 = 0.734542312; adjusted R2 = 0.687970788, both significant in real estate applications).
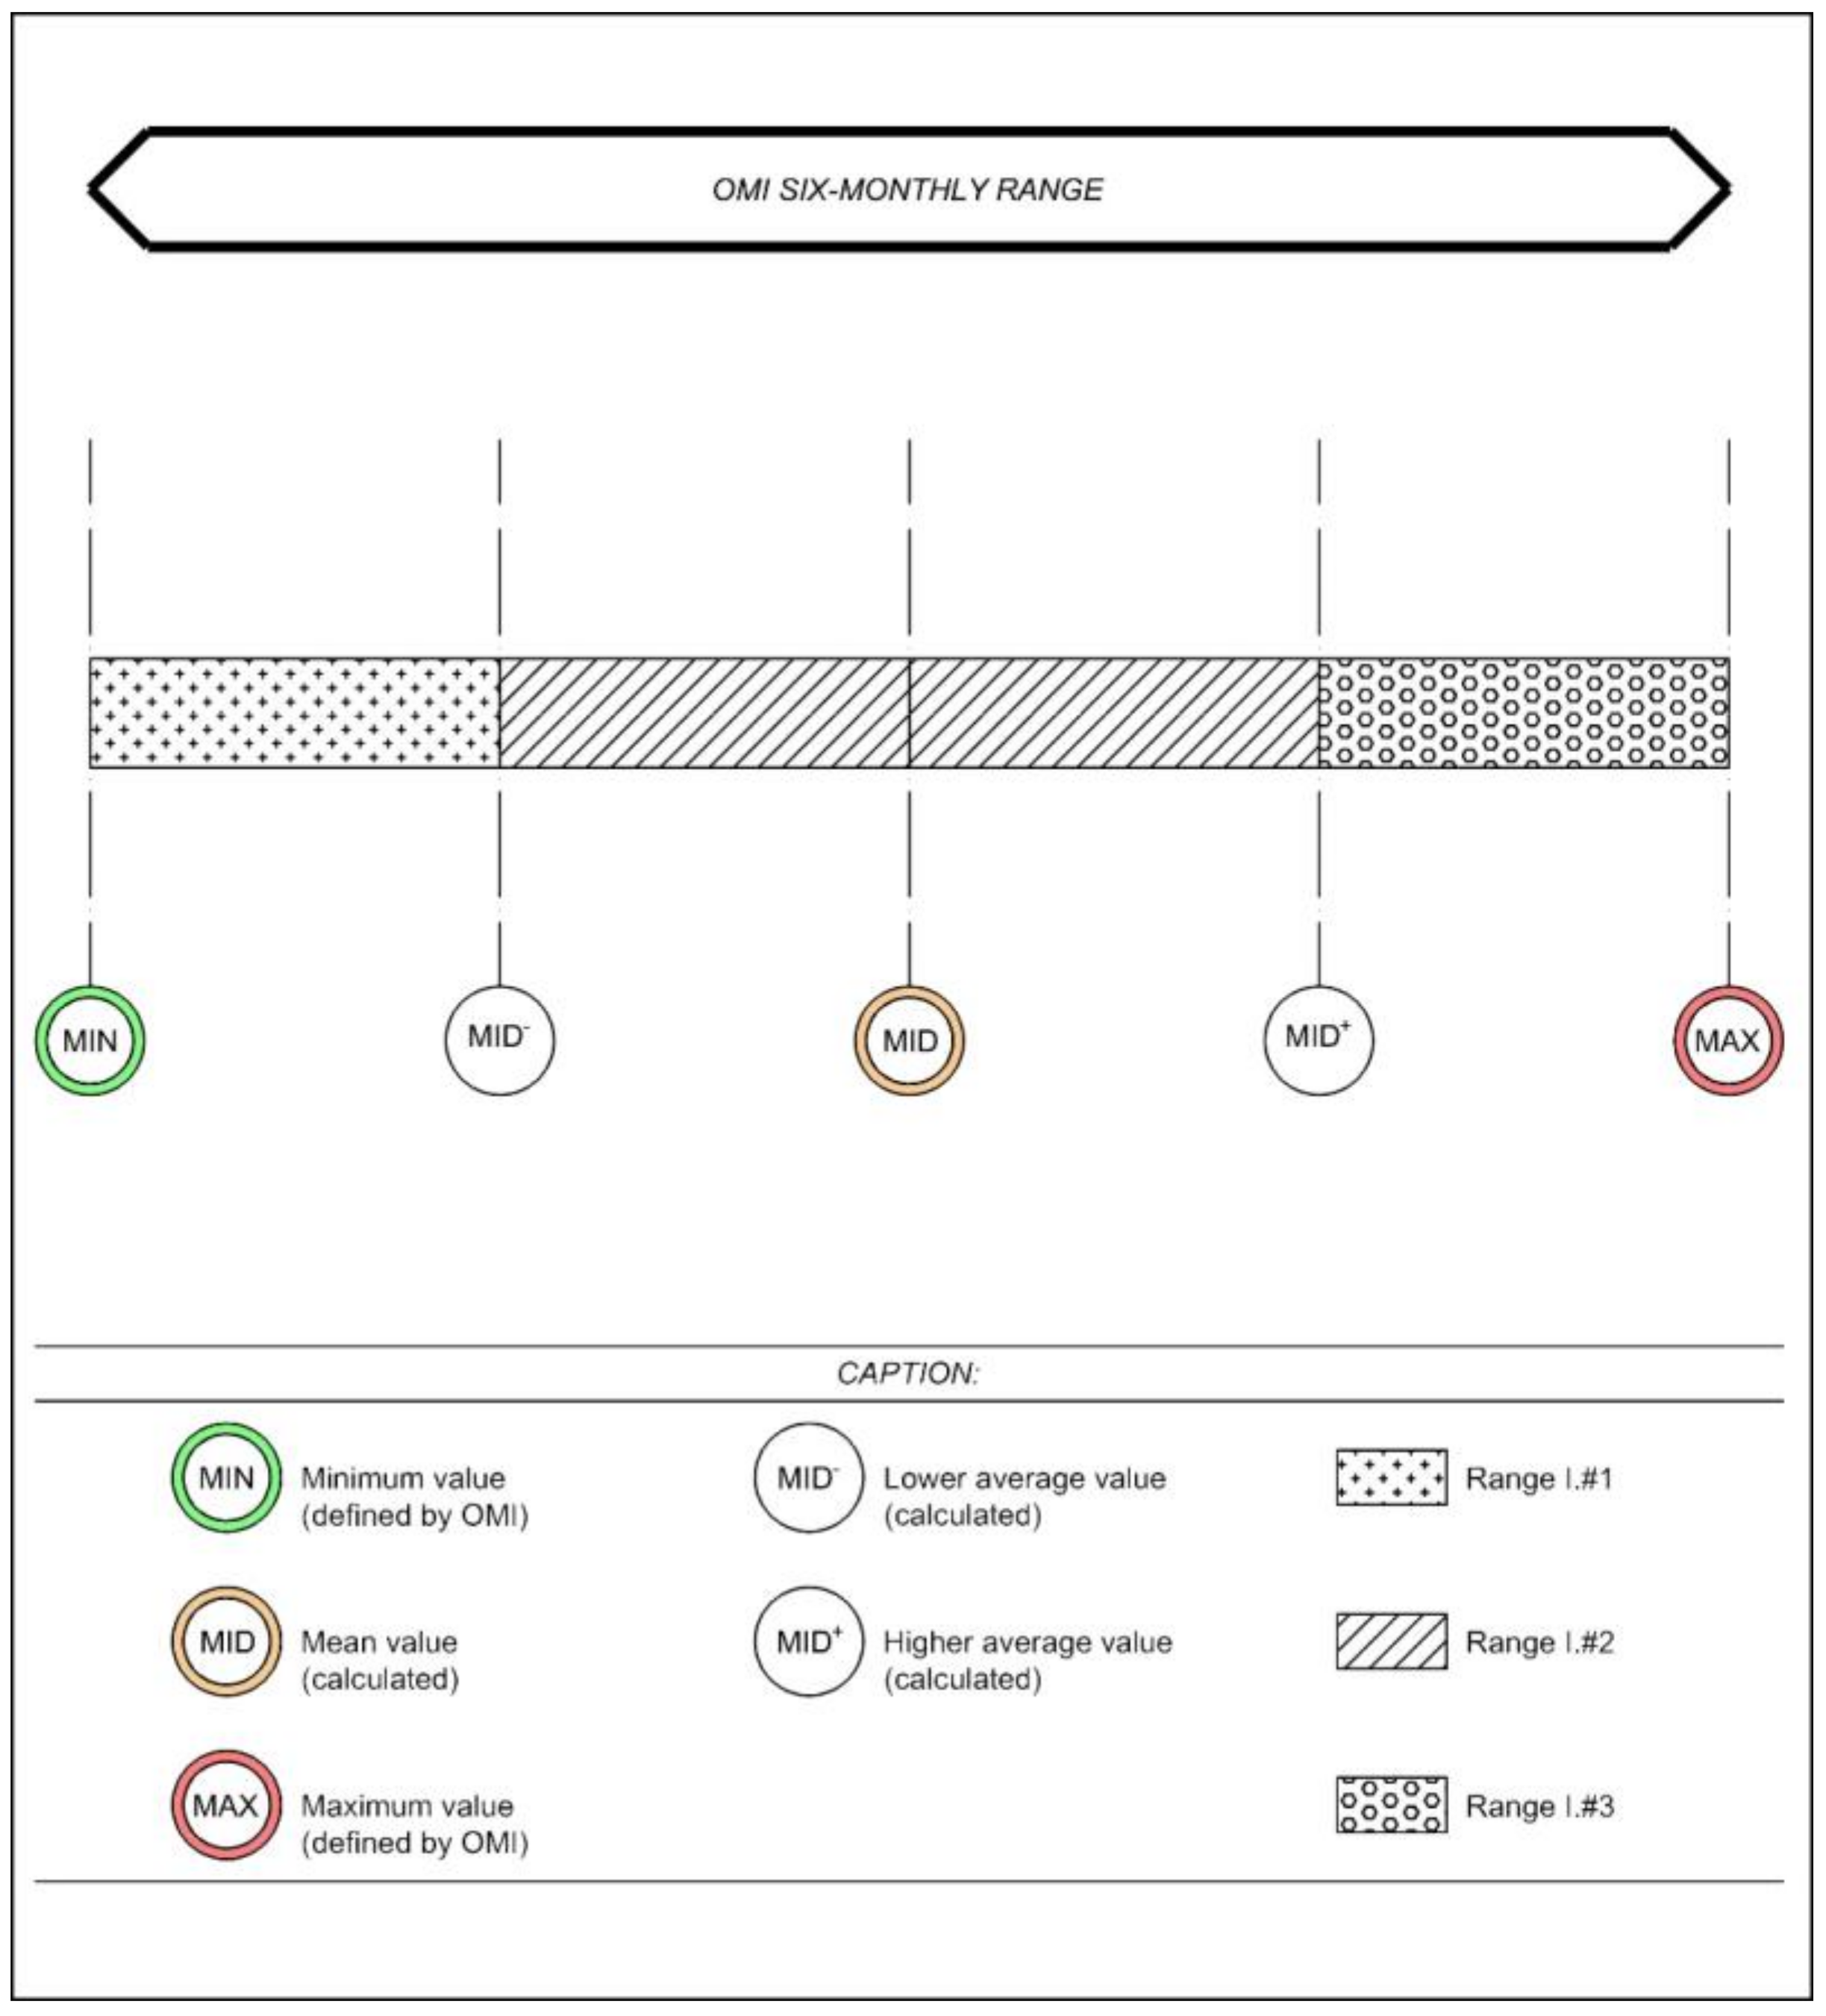
Moreover, as mentioned before, it is expected that planned works will also lead buildings to a preservation and maintenance improvement, which will increase the dwellings’ value. However, since no works inside the flats were planned in this district intervention, it is believed there won’t be any upgrade in land registry category (that generally changes every time there is substantial intervention on internal finishes and facilities) and therefore REMO’s reference class will remain the same (LCD). This class range has been split into three subranges to better estimate the appreciation in value of general conditions of improvement in terms of preservation and maintenance. The first subrange (I#1) has got the same lower limit as the minimum value of REMO’s, while the upper limit corresponds to the average value between the minimum and the average value of the REMO’s range itself. The second subrange (I#2) is the wider one: it has got a central value corresponding to the average of REMO’s range, a lower limit resulting from the average between the minimum value and the average value of REMO’s range itself, while the upper limit is the average between the maximum and the average value of REMO’s range itself. Lastly, the third subrange (I#3) has got an upper limit corresponding to the maximum value of REMO’s range and a lower limit resulting from the average between the average value and the maximum value of REMO’s range (Figure 17).
The survey on buildings’ states of maintenance and preservation was carried out through a virtual inspection via Google Street View tool and two physical inspections in the months of September–October 2019. No relevant signs of significant degradation pathologies on preintervention buildings facades were noticed. Therefore, the right reference subrange (as above defined) would be the second one (I#2). This statement was also validated by the fact the PI-ASP value above calculated remains within this range and is very close to its average value.
As described before, the works will concern mainly façades, doors, and windows in the common parts; the heating systems; and the intercom/video systems. For each flat it can be therefore considered reasonable that there would be an appreciation in value due to an improvement on buildings state and “outer” maintenance. This will at least lead them to have as a reference price the average value of the I#3 subrange. This value increase was added to the one we got from energy rating upgrade to calculate the cluster postintervention average selling price (POI-ASP) per square meter of commercial area.

3. Results

According to the above mentioned hypothesis and methodology, the most likely average after-intervention selling price per unit area was calculated for each cluster. This operation was carried out by increasing the average price of the preintervention sales by 25% for each cluster. As explained, this increase was partly due to the building unit’s energy rating jump; partly to the whole building energy efficiency upgrading; partly to the expected improvement in the look and maintenance status of its facades, specifically, a 10% apartment price increase is due to the energy rating jump (i.e., from F to A rating); and another increase of 15% because of the improvement in the general state of preservation and maintenance in the considered buildings.
The carried out elaborations resulted in the following table (Table 2).
It should be noted that calculated values of clusters are average values, with the exception of cluster 5, for which only one real sell price was provided. Therefore, excluding the cluster n. 5 and balancing out the average values calculated for all the others, average unitary prices for commercial areas pre- and postintervention were calculated considering a generic unit in Fiat Village buildings. These values, which are then independent of the buildings’ morphology, are approximately 1200.00 €/sqm for the preintervention sale price and 1500.00 €/sqm for the postintervention one.

4. Discussion and Conclusions

Analyzing the obtained results, it can be observed the average postintervention price (1500.00 €/sqm) is common among different buildings typologies and it corresponds to the average value of the range provided by QD REMO for the CD category in a normal state of preservation (values updated to the second half of 2018). Therefore, the postintervention reference class of the Land Register, at least concerning REMO, will no longer be the LCD but instead become the CD in a normal state of preservation. This rating change is due to the envelope retrofitting of buildings and it brings a twofold improvement: buildings’ external look enhancement and flats’ energy rating.
As far as construction costs are concerned, a total cost of intervention of about €75,000.00 for each LCD is assumed. However, only nearly 30% of that cost (equal to €22,500.00 per unit) shall be borne by owners thanks to an agreement with the economic operator in charge of carrying out the energy efficiency works; thanks to this, the owners will be allowed to transfer their tax credit to the economic operator (50% deduction in ten years). Hence, assuming an average commercial area of about 85 sqm for each flat and considering the net cost will be about 22,500.00 € each, the expense per area unit is equal to 265.00 €/sqm. Comparing it with the average appreciation in the value of each dwelling (about 300.00 € per sqm, see Table 1), the real convenience in carrying out the intervention is demonstrated. In this case, both the owner and the operator would have an economic profit, thus allowing on the one hand the activation of private capital (collection and investment) and, on the other, a potential support of (even a few) public funds to improve services in the neighborhood with direct effect for owners and citizens [26].
Moreover, it should be underlined that the estimated increase in value for clusters is very precautionary, because not all the direct and indirect benefits brought by intervention were considered. Among the direct ones, there is certainly a decrease in resulting energy bills, for example from installation of photovoltaic with batteries for electricity “storage” and, moreover, from a general revamping of HVAC systems with more sustainable technologies (e.g., solar hot water).
On the other hand, indirect benefits include new spaces for personal services, condominium car sharing service for example in collaboration with FCA, a new e-commerce points to make easier the delivery of users’ orders, a new building ultra-speed Wi-Fi network, the stipulation of a single contract with an energy company to sell the energy produced by photovoltaic panels.
Considering all the analyses carried out, it is concluded that planned district intervention on Fiat Village properties will be able to bring each owner a tangible economic benefit thanks to an increase in the market appeal of the units and an implementation of new services available to residents.

Author Contributions

Conceptualization, F.P. and M.R.; formal analysis, U.M. and M.R.; investigation, U.M.; methodology, P.P. and M.R.; supervision, G.M., P.P., F.P., and A.V.; validation, G.M. and F.P.; writing—original draft, U.M., M.R., and A.V.; writing—review and editing, G.M., P.P., and A.V. All authors have read and agreed to the published version of the manuscript.

Funding

This research received no external funding.

Conflicts of Interest

The authors declare no conflict of interest.

References

  1. Allen, M.R.O.P.; Dube, W.; Solecki, F.; Aragón-Durand, W.; Cramer, S.; Humphreys, M.; Kainuma, J.; Kala, N.; Mahowald, Y.; Mulugetta, R.; et al. 2018: Framing and context. In: Global Warming of 1.5 °C. An IPCC Special Report on the impacts of global warming of 1.5 °C above pre-industrial levels and related global greenhouse gas emission pathways. In Strengthening the Global Response to the Threat of Climate Change, Sustainable Development, and Efforts to Eradicate Poverty; Masson-Delmotte, V.P., Zhai, H.-O., Pörtner, D., Roberts, J., Skea, P.R., Shukla, A., Pirani, W., Moufouma-Okia, C., Péan, R., Pidcock, S., et al., Eds.; IPCC: Geneva, Switzerland, 2018; Available online: https://www.ipcc.ch/sr15 (accessed on 26 June 2020).
  2. United Nation, Paris Agreement, adopted at the Paris climate conference (COP21) in December 2015. Available online: https://unfccc.int/process-and-meetings/the-paris-agreement/the-paris-agreement (accessed on 24 June 2020).
  3. Burck, J.; Hagen, U.; Marten, F.; Höhne, N.; Bals, C. The Climate Change Performance Index 2019, Germanwatch, Bonn. 2019. Available online: https://germanwatch.org/en/16073 (accessed on 22 April 2020).
  4. World Green Building Council. Bringing Embodied Carbon Upfront. Coordinated Action for the Building and Construction Sector to Tackle Embodied Carbon. World Green Building Council: London, UK, 2019. [Google Scholar]
  5. European Commission. Available online: https://ec.europa.eu/energy/eu-buildings-factsheets_en (accessed on 22 April 2020).
  6. Commission Staff Working Document Impact Assessment Accompanying the document Proposal for a Directive of the European Parliament and of the Council amending Directive 2010/31/EU on the Energy Performance of Buildings. SWD/2016/0414 final-2016/0381 (COD). Available online: https://eur-lex.europa.eu/legal-content/EN/TXT/?uri=SWD:2016:414:FIN (accessed on 22 April 2020).
  7. Fantucci, S.; Fenoglio, E.; Serra, V.; Perino, M.; Marino, V. Retrofit of the existing buildings using a novel developed aerogel-based coating: Results from an in-field monitoring. In Proceedings of the Intelligent and Resilient Buildings and Urban Environments, 7th International Building Physics Conference, IBPC2018, Syracuse, NY, USA, 23–26 September 2018; pp. 275–280. [Google Scholar]
  8. Piantanida, P.; Rebaudengo, M. Maintenance of buildings: Italian examples of deviations between planned and incurred costs. In Proceedings of the IOP Conference Series: Materials Science and Engineering; 2017 2nd International Conference on Reliability Engineering, ICRE 2017, Milan, Italy, 20 December 2017; Volume 351. Issue 1, 14 May 2018, Article number 012013. [Google Scholar] [CrossRef] [Green Version]
  9. D.P.R. 6 Giugno 2001, n. 380, in Terms of “Testo Unico Delle Disposizioni Legislative e Regolamentari in Materia Edilizia”. Available online: www.normattiva.it/uri-res/N2Ls?urn:nir:stato:decreto.del.presidente.della.repubblica:2001-06-06;380!vig= (accessed on 24 June 2020).
  10. Sustainable Development Goals. Available online: https://sustainabledevelopment.un.org/?menu=1300 (accessed on 6 May 2020).
  11. Ufficio Rapporti Comunitari ANCE. L’esperienza degli Ecoquartieri per Ispirare la Strutturazione di Misure e Progetti Della nuova Asse Urbana dei Programmi Operativi Regionali 2014 / 2020 (Fondi europei FESR ed FSE); Rapporto ANCE 2013; ANCE: Roma, Italy, 2013. [Google Scholar]
  12. Mecca, U.; Piantanida, P.; Rebaudengo, M.; Vottari, A. Green perspective for Italian buildings façades. In Proceedings of the 19th International Multidisciplinary Scientific GeoConference SGEM 2019, 9. Section Green Buildings Technologies and Materials, Vienna, Austria, 9–11 December 2019; STEF92 Technology: Sofia, Bulgaria, 2019; pp. 293–300. [Google Scholar] [CrossRef]
  13. Decree Law No 34 of 19 May 2020. Misure Urgenti in Materia di Salute, Sostegno al Lavoro e all’economia, nonche’ di Politiche Sociali Connesse All’emergenza Epidemiologica da COVID-19. Available online: www.normattiva.it/uri-res/N2Ls?urn:nir:stato:decreto.legge:2020-05-19;34!vig= (accessed on 28 May 2020).
  14. Legislative Decree No 192 of 19 August 2005, as Amended. Attuazione Della Direttiva 2002/91/CE Relativa al Rendimento Energetico Nell’edilizia. Available online: www.normattiva.it/uri-res/N2Ls?urn:nir:stato:decreto.legislativo:2005-08-19;192!vig= (accessed on 28 May 2020).
  15. Immobiliare.it. Available online: https://www.immobiliare.it/ (accessed on 6 May 2020).
  16. Eurostat. Available online: https://ec.europa.eu/eurostat/web/products-datasets/-/tipsho10 (accessed on 2 April 2020).
  17. Agenzia Entrate. Available online: https://wwwt.agenziaentrate.gov.it/servizi/Consultazione/ricerca.htm (accessed on 6 May 2020).
  18. VV.AA. Istruzioni Tecniche per la Formazione Della Banca Dati Quotazioni OMI. In Manuale Della Banca Dati Quotazioni Dell’osservatorio del Mercato Immobiliare; Osservatorio del Mercato Immobiliare: Italy, 2018. Available online: https://www.agenziaentrate.gov.it/portale/web/guest/schede/fabbricatiterreni/omi/manuali-e-guide (accessed on 6 May 2020).
  19. Catasto. Available online: https://www.catasto.it/abitazione-civile.html (accessed on 6 May 2020).
  20. Catasto. Available online: https://www.catasto.it/abitazione-economica.html (accessed on 6 May 2020).
  21. Wallace, N.E.; Meese, R.A. The construction of residential housing price indices: A comparison of repeat-sales, hedonic-regression, and hybrid approaches. J. Real Estate Financ. Econ. 1997, 14, 51–73. [Google Scholar] [CrossRef]
  22. Sirmans, G.S.; MacDonald, L.; Macpherson, D.A.; Zietz, E.N. The value of housing characteristics: A meta analysis. J. Real Estate Financ. Econ. 2006, 33, 215–240. [Google Scholar] [CrossRef]
  23. Marmolejo, C.; Chen, A.; Bravi, M. Spatial implications of EPC rankings over residential prices. A: “Values and functions for future cities”. Springer Nat. 2020, 51–71. [Google Scholar] [CrossRef]
  24. Cerin, P.; Hassel, L.G.; Semenova, N. Energy performance and housing prices. Sustain. Dev. 2012, 22, 404–419. [Google Scholar] [CrossRef]
  25. Manganelli, B.; Morano, P.; Tajani, F.; Salvo, F. Affordability assessment of energy-efficient building construction in Italy. Sustainability 2019, 11, 249. [Google Scholar] [CrossRef] [Green Version]
  26. Battisti, F.; Campo, O. A methodology for determining the profitability index of real estate initiatives involving public–private partnerships. A case study: The integrated intervention programs in Rome. Sustainability 2019, 11, 1371. [Google Scholar] [CrossRef] [Green Version]
Figure 1. Breakdown of residential building by construction year (2014) [5].
Sustainability 12 05213 g001
Figure 2. State of preservation of the Italian residential building stock [author’s elaboration, data provided by the Italian Central Institute of Statistics (ISTAT)].
Sustainability 12 05213 g002
Figure 3. Some buildings of the Fiat Village [source: Google Street View, April 2020].
Sustainability 12 05213 g003
Figure 4. Identification of the buildings that are part of the Fiat Village [source: author’s elaboration].
Sustainability 12 05213 g004
Figure 5. Graph showing the trend of the deflated price index for the Euro area (Source: Eurostat [16]).
Sustainability 12 05213 g005
Figure 6. Annual deflated house price index (HPI) by member states, rate of change %, 2007–2018 (Source: Eurostat [16]).
Sustainability 12 05213 g006
Figure 7. Market trend of the civil dwellings sold in Torino, both newly built and fully renovated (source: authors’ elaboration).
Sustainability 12 05213 g007
Figure 8. Civil dwelling (CD) and low-cost dwelling (LCD): trend of the selling prices in the semi-central area of Settimo Torinese [Authors’ elaboration].
Sustainability 12 05213 g008
Figure 9. Purchases and sales from 1999 to 2018 (provided by a real estate company) [authors’ elaboration].
Sustainability 12 05213 g009
Figure 10. Average year of sales and purchases [authors’ elaboration].
Sustainability 12 05213 g010
Figure 11. Average number of rooms per dwelling [authors’ elaboration].
Sustainability 12 05213 g011
Figure 12. Average floor level [authors’ elaboration].
Sustainability 12 05213 g012
Figure 13. Average state of conservation [authors’ elaboration].
Sustainability 12 05213 g013
Figure 14. Average commercial area [authors’ elaboration].
Sustainability 12 05213 g014
Figure 15. Average sales price [authors’ elaboration].
Sustainability 12 05213 g015
Figure 16. Comparison between trends based on different data sources [authors’ elaboration].
Sustainability 12 05213 g016
Figure 17. REMO generic range (color) with the proposed subdivision into subranges (b/w) according to the state of preservation and maintenance of buildings in which the dwellings are located [authors’ elaboration].
Sustainability 12 05213 g017
Table 1. Survey form: mandatory fields for each intended use of the different building units (source: authors’ elaboration based on data from Real Estate Market Observatory (REMO) [18]).
TypesGeneral DataWhole BuildingReal Estate UnitEconomic Data
-
Flats
-
Detached house
-
Cottage
-
Surveyor
-
Source denomination
-
Reference date
-
Municipality
-
Type
-
Range
-
REMO’s zoning
-
Relative position in REMO’s zone
-
Public services **
-
Public transportation **
-
Basic commercial services **
-
Overall Maintenance Level
-
Year of construction *
-
Year of renovation *
-
No. of floors above ground
-
No. of lifts
-
Overall maintenance level
-
Plan level *
-
Penthouse *
-
Total area
-
Price *
-
Value *
-
Offer *
-
Garage and assimilated
-
Relative position in REMO’s zone
-
Parking facilities
-
Public transportation
-
Plan level
-
Accessibility
-
Internal headroom
-
Shops
-
Relative position in REMO’s zone
-
Public services
-
Public transport
-
Business location
-
Toilet
-
Plan level
-
Entries
-
Storefront, prevailing street front
-
Warehouses
-
Laboratories
-
Overall maintenance level
-
Toilet
-
Plan level
-
Internal height
-
Offices
-
Relative position in REMO’s zone
-
Public services **
-
Public transportation **
-
Public Green **
-
Parking equipment **
-
Overall maintenance level
-
Year of construction *
-
Year of renovation *
-
No. of floors above ground
-
No. of lifts
-
Plan level
-
No. of floors
-
Overall maintenance level
-
Layout features
-
Typical sheds
-
Road infrastructures **
-
Public transportation **
-
Parking facilities **
-
Overall maintenance level
-
Year of construction *
-
Year of renovation *
* at least one of the starred entries. ** at least two of the double-starred entries.
Table 2. Cluster-organized findings of the research.
ClusterPI-ASP
[€/m2]
Increase Because of Energy Rating Jump
[%]
Increase Because of Building Envelope Improvement
[%]
PO-ASP
[€/m2]
Estimated Price Increase
[€/m2]
1 (Mini-Tower)1327.5410%15%1659.42331.88
2 (Tower)1165.4110%15%1456.77291.35
3 (Line 2 stairs)1321.7010%15%1652.12330.42
4 (Line 3 stairs)1011.4610%15%1264.32252.86
5 (Inclined 2 stairs) *1425.4810%15%1781.84356.37
Average **1206.53 1508.16301.63
* values referred to only one real case of buying and selling and therefore are not reliable. ** average values calculated from those estimated for clusters 1 to 4, excluding the value of cluster No. 5.

