1. Introduction
The ultimate aim of buildings is to sustain human wellbeing in terms of thermal comfort, air quality and the environmental consequences of using energy to condition internal space. Recently, however, a new dimension of sustainability in buildings became apparent—to sustain human health under the threat of airborne transmission of infectious disease.
The first half of the year 2020 saw a rapid worldwide spread of the infectious disease caused by a coronavirus named COVID-19 (
Figure 1), so that the World Health Organization declared this as a pandemic. By the end of April 2020, over 2.7 million people were infected and over 188,000 died, and the infections rose to 6.9 million and deaths to almost 400,000 by the beginning of June 2020 [
1]. There is evidence that, in addition to person to person contact, the disease transmission occurs through airborne droplets/aerosols generated by breathing, speaking, coughing or sneezing. For that reason, building heating, ventilating and air conditioning systems can play an important role, as they may both contribute to as well as reduce the transmission risk. Despite the current research, there is still insufficient understanding of the characteristics and the movement of infectious aerosols in buildings. In response to the pandemic, ASHRAE published a Position Document on Infectious Aerosols [
2], explaining airborne dissemination and practical implications for building owners, operators and engineers.
Various studies investigated the sizes of air droplets and the risk of airborne transmission. Droplets exhaled by normal breathing are 80% within the range of 0.3–1 μm in diameter [
3], whereas the diameter of COVID-19 virus is in the range of 0.12–0.16 μm [
4]. This means that the virus can easily be contained in the exhaled droplets. Exhaled droplets can reach the size of 240 μm [
5]. The expiratory airflow during sneezing is six–seven times higher than that during normal breathing [
6], and droplets are ejected at velocities from 50 [
7] to 100 m/s [
8]. According to published sources, the droplets in the size range of 60–100 μm evaporate and fall on the ground as the droplets nuclei within the distance of 2 m [
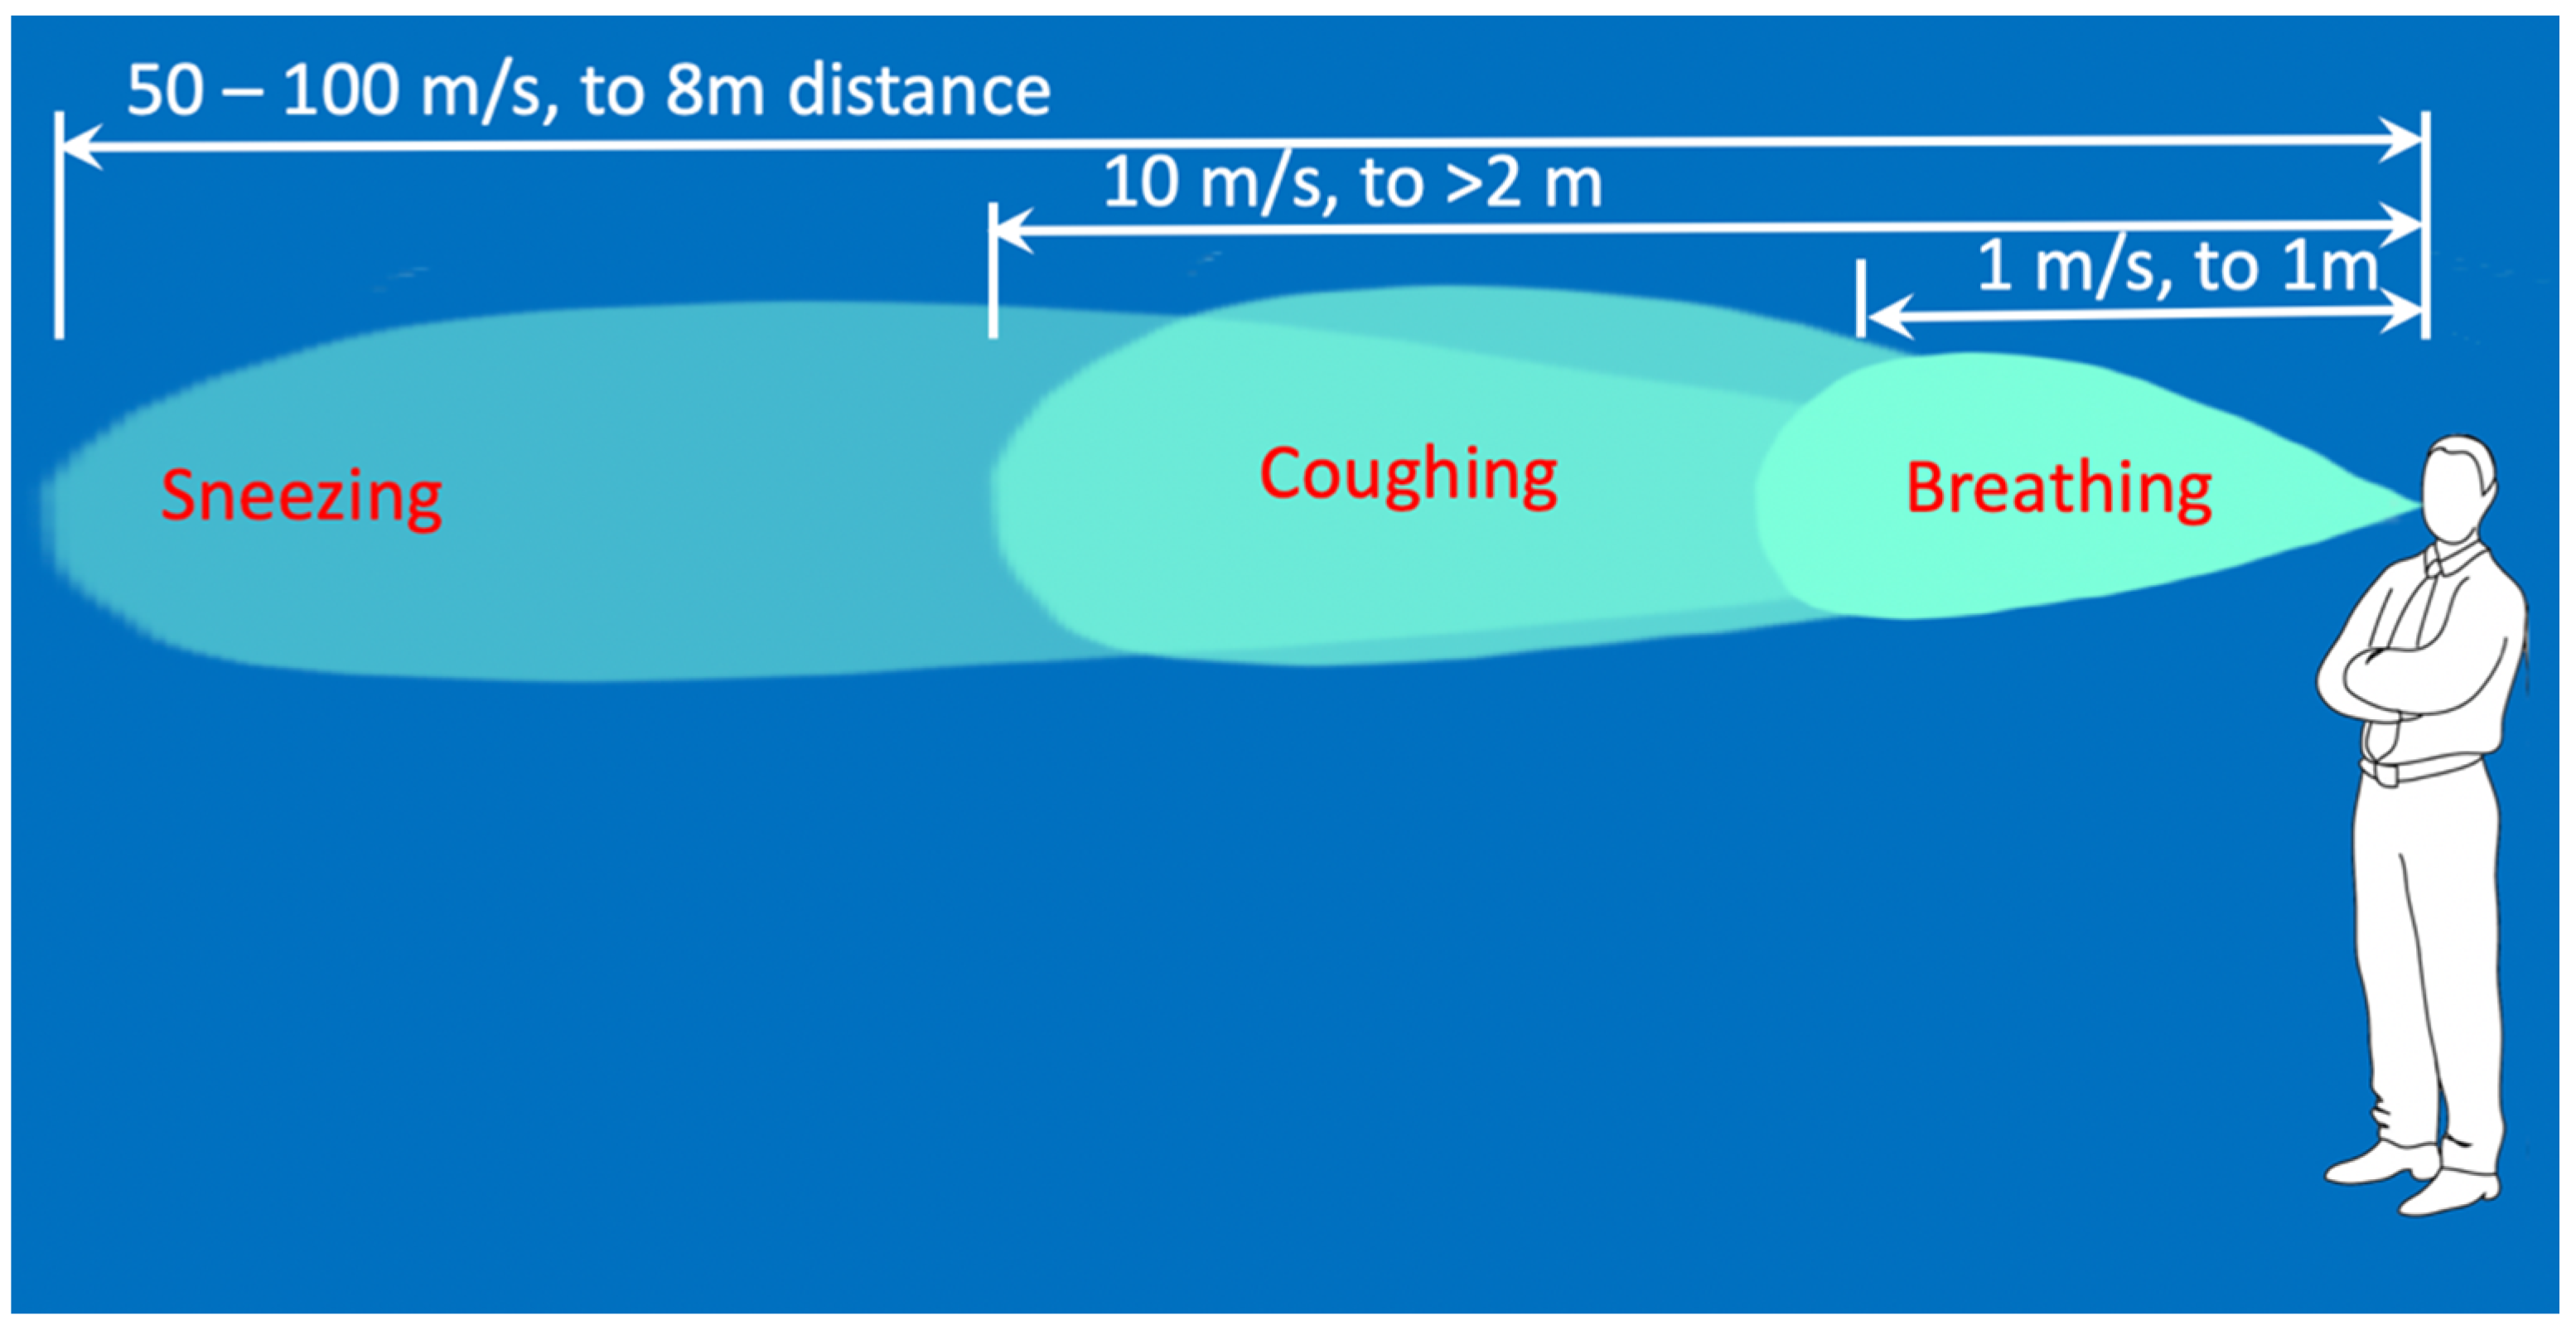
7]. The droplets generated by breathing are exhaled at 1 m/s and are carried to less than 1 m away; the droplets generated by coughing are carried more than 2 m away at velocities of up to 10 m/s; and droplets generated by sneezing are expelled at velocities up to 50 m/s and are carried more than 6 m away [
7]. More recent evidence suggests that an aerosol cloud from a human sneeze can be carried up to 8 m [
9]. The velocity and reach of droplets from these findings are summarised in
Figure 2. There is evidence that there is prolonged suspension of droplets in the air above 60% relative humidity [
5], and that particles of 0.5 μm or less can stay suspended for over 40 h in still air [
10]. There is evidence that the droplet sizes generated by cough can reach up to 1000 μm in diameter [
11].
The mechanism of airborne infection transmission is defined by the Wells–Riley equation [
12,
13]:
where
C—number of new infections;
S—number of people susceptible to infection;
I—number of infectors;
q—number of doses of airborne infection;
p—pulmonary ventilation per person;
t—exposure time; and
Q—volume of fresh or disinfected air.
The exponent Iqpt/Q represents the degree of exposure to infection and the term in brackets represents the probability of a single infection. As it can be seen from
Table 1, a low degree of exposure leads to a low probability of infection, whereas a high degree of exposure significantly increases the probability of infection.
From Equation (1), we can infer that: reducing the density of infectious people (I) decreases exposure to infection; reducing the number of doses of airborne infection (q) decreases exposure to infection; reducing the time spent in high-density areas (t) decreases exposure to infection; and increasing the volume of fresh or disinfected air (Q) decreases exposure to infection.
We can also infer that in the context of buildings, ventilation appears to be one of the primary ways of reducing the transmission of airborne infection.
However, computation fluid dynamics (CFD) simulations that could potentially increase our understanding of airborne disease transmission are still predominantly based on Navier–Stokes equations, developed some 150 years ago, for which there is no complete solution. These equations remain to be one of the open mathematical problems [
14], as the top-down approach to the problem definition requires simplifications to be made to the system of differential equations in order to make them solvable [
15]. Although used widely, this approach is fundamentally flawed: instead of bringing the solution method closer to the problem, it brings the problem closer to the solution method. In a similar way as when we plan to fly to Mars, we cannot bring Mars closer to Earth in order to make the problem easier to solve, we need to apply the same approach to the application of Navier–Stokes equations.
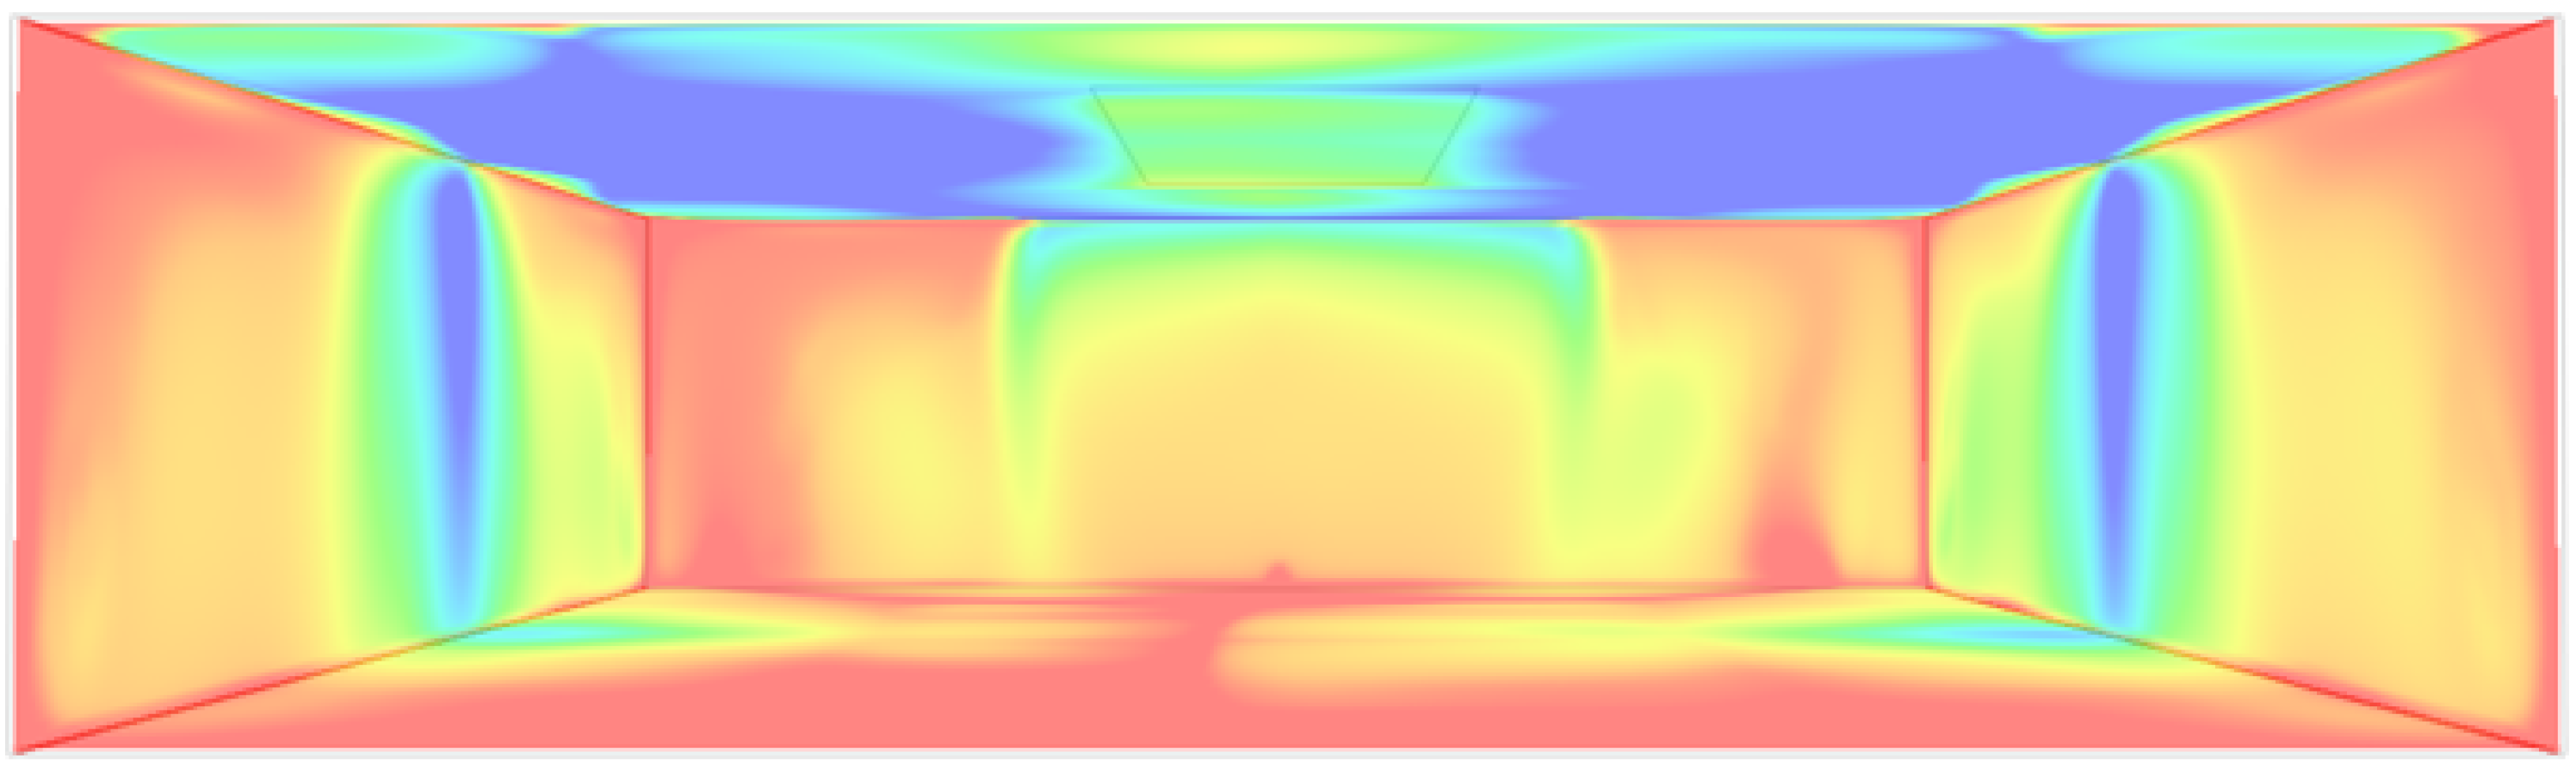
An example of a CFD simulation of air flow in a room using IES Virtual Environment [
16] took 25 min to complete and only to achieve a static pattern (
Figure 3).
This conventional approach is therefore not going to be of much use as an experimental tool, and it is not going to help much with increasing our understanding of the dynamics of infectious aerosols in buildings.
A number of simulation scenarios have emerged in response to the pandemic. Thus, COVID-19 Simulation Solutions [
17] presents different simulation scenarios for social distancing (
Figure 4), exercising, mask wearing, negative pressure rooms, room contamination and others.
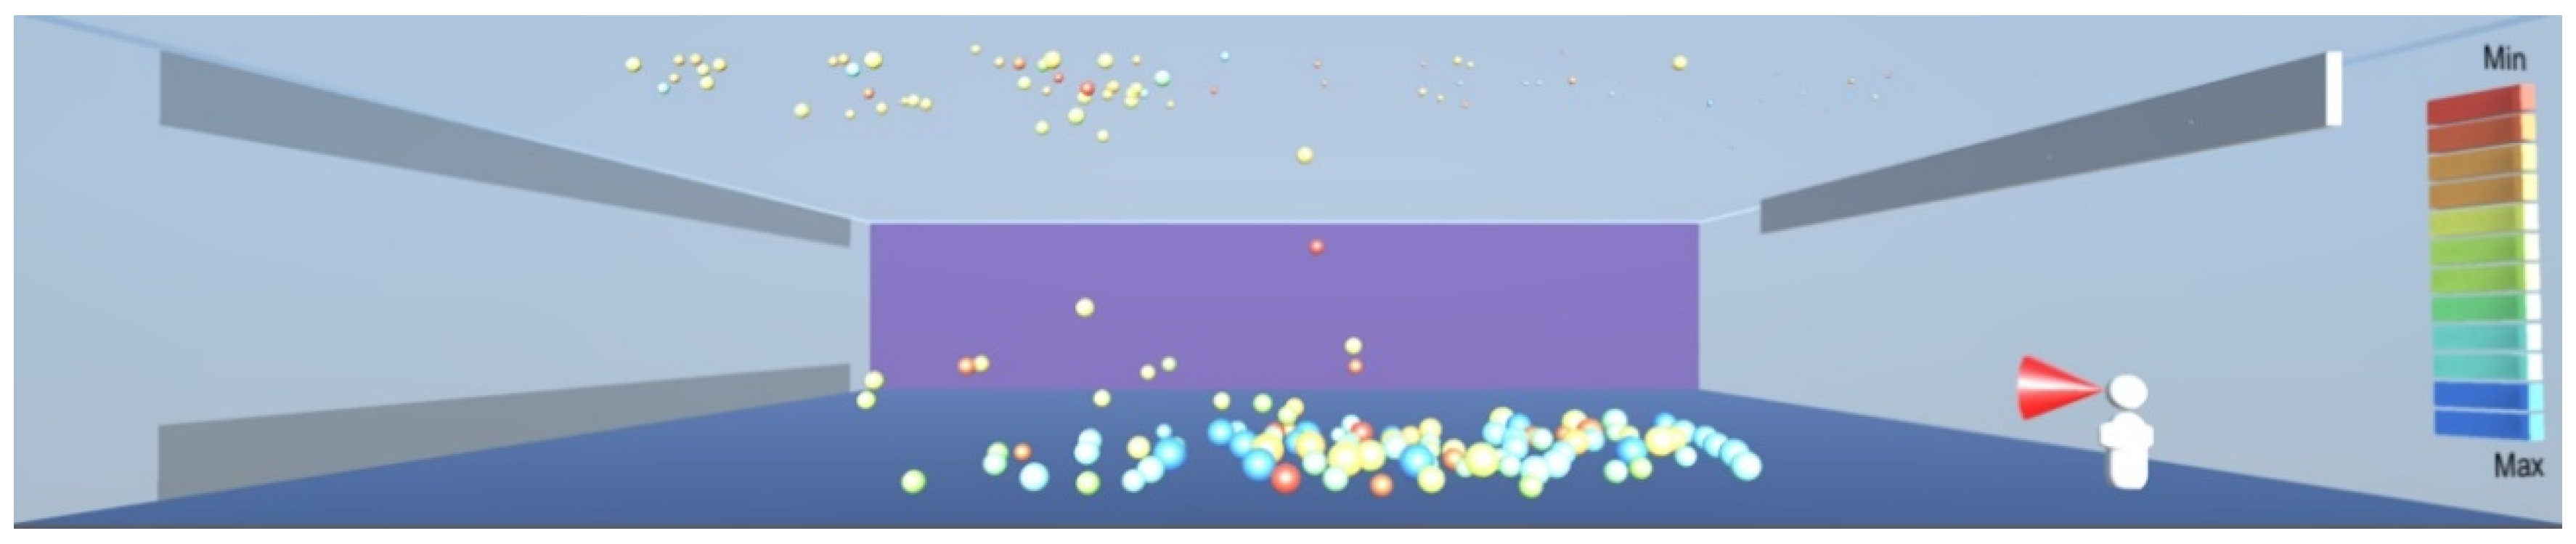
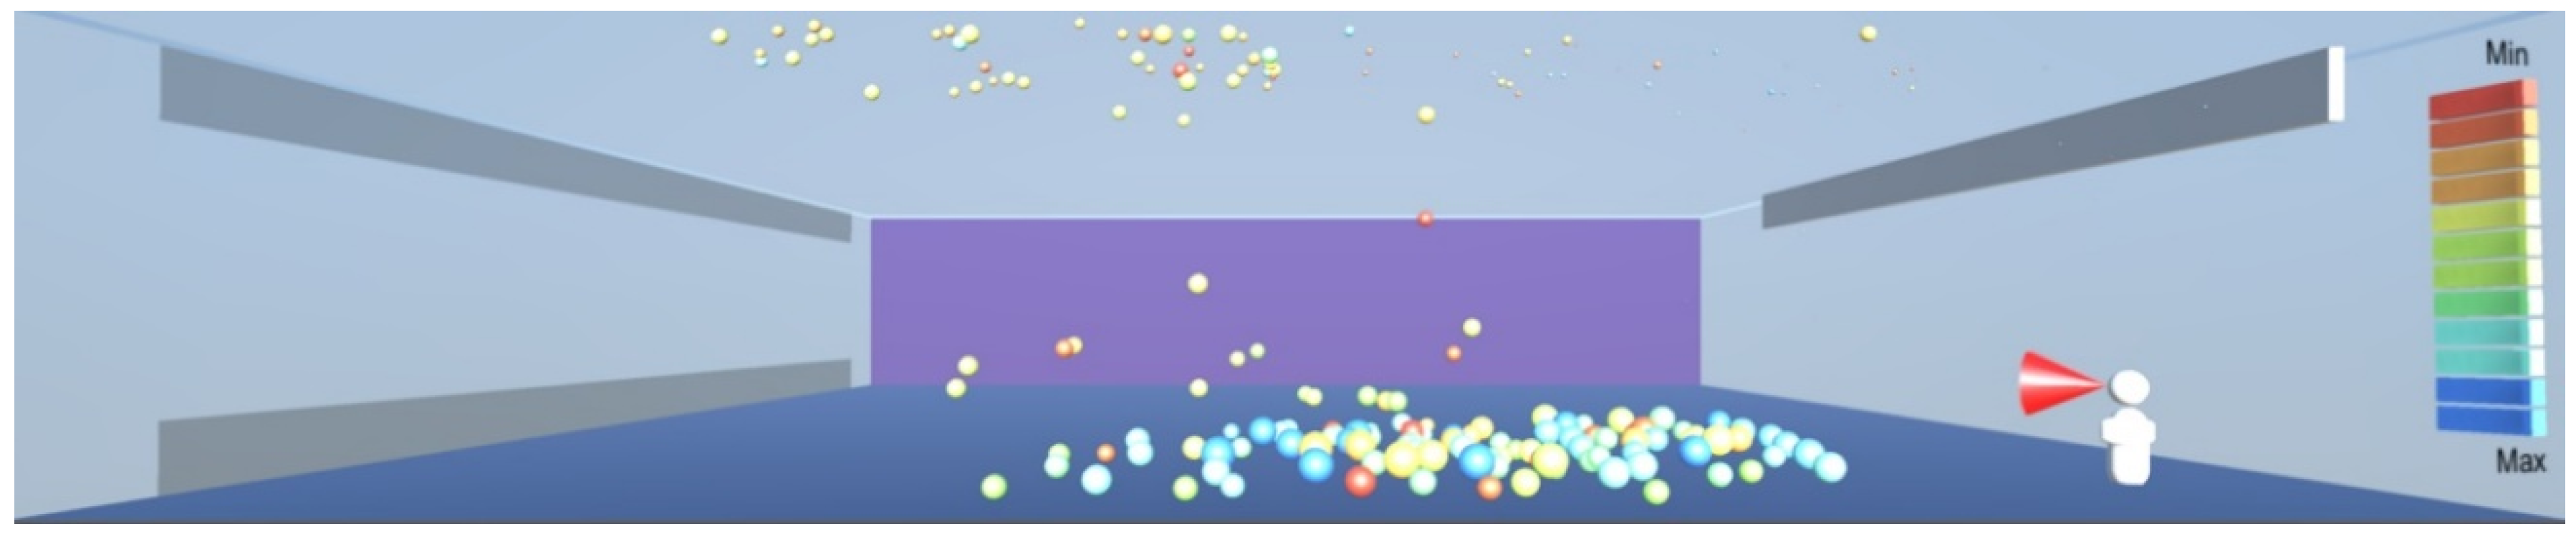
A consortium formed between Aalto University, Finnish Meteorological Institute, VTT Technical Research Centre of Finland and University of Helsinki mobilised 30 researchers and used a super computer to investigate infectious droplet dispersion in buildings [
18]. Their simulation of a person coughing in an indoor environment configured as a grocery store is illustrated in
Figure 5.
They modelled the spread of droplets of sizes up to 15–20 μm, and seemingly using particles of equal size. Their main findings are that the very small particles do not sink on the floor, but remain suspended in the air and move in the air currents.
Therefore, as it can be seen from the previous research, the characterisation of droplets generated by exhalation, coughing and sneezing appears to be well established, and so are the mechanisms of airborne infection transmission. However, the work on simulations of the dynamics of the movement of infectious aerosols in buildings is only emerging (
Figure 4 and
Figure 5), as the existing CFD methods (
Figure 3) cannot be used for dynamic simulations. There is clearly a need for research that can provide a quick simulation capability suitable for experimentation, without an overhead of specialist software [
17] or of large teams of researchers having access to a super-computer [
18].
Hence, this article introduces a method of bottom-up emergent modelling of the movement of infectious aerosols in internal space using the Unity physics engine [
19], in order to provide an experimental simulation research tool for the investigation of the dynamics of infectious aerosols in buildings. Through a self-organised simulation of particle dynamics that responds to user inputs in the real time, this research gives insights into emergence-based aerosol dynamics that have not been explicitly programmed. The overall aim of this research is to inform sustainable design interventions that reduce the infection transmission risk in buildings.
2. Materials and Methods
The method is based on Newtonian physics, applying the sum of forces on each droplet as shown in
Figure 6, and letting the droplets movement self-organise in a room environment. All calculations are based on 3D vector calculus, where the quantities are calculated independently in the x, y, and z directions.
The total force acting on each droplet is defined as
where
A—air flow force;
B—buoyancy force;
D—drag force; and
G—gravitational force.
The air flow force is defined as
where
ρ—air density;
v—air velocity; and
r—droplet radius.
The drag force is defined as the air flow force multiplied by the drag coefficient:
where the drag coefficient C
d is set to 0.47 for the sphere-shaped droplets.
The buoyancy force is defined on the basis of Archimedes’ principle as
which represents the weight of air displaced by the droplet and where
ρ—air density;
r—droplet radius; and
g—gravitational acceleration.
The gravitational force is defined as follows:
where
ρw—water density at human body temperature and all other symbols have already been defined.
The heat balance of each droplet is then calculated as
where
Q—droplet heat balance in the current time step;
Qold—droplet heat balance in the previous time step;
Qa—heat transferred between the droplet and room air;
Qr—heat transferred between the droplet and the right wall of the room;
Ql—heat transferred between the droplet and the left wall of the room;
Qf—heat transferred between the droplet and the front wall of the room;
Qb—heat transferred between the droplet and the back wall of the room;
Qu—heat transferred between the droplet and the ceiling; and
Qd—heat transferred between the droplet and the floor.
All of the above components of heat balance are modelled as convective heat transfers:
where
Qx—heat transferred from source x, where x represents a, r, l, f, b, u, d in the notation from the previous equation; and
Told—droplet temperature in the previous time step.
Droplet temperature T is subsequently calculated as
where
ρw—droplet density;
V—droplet volume = 4 π r3/3; and
c—specific heat of water at human body temperature.
Density and specific heat for each particle are calculated in each time step as temperature-dependent, using standard formulae for moist air at relative humidity as set in the room.
The evaporation of droplets is calculated using the heat required to cause evaporation as
where
q—heat required to cover evaporation;
hwe—heat of evaporation of water, set to 2413.1 kJ/kg; and
gs—amount of evaporated water in kg/s.
From here, the droplet radius as a result of the reduction in the droplet mass due to evaporation is calculated as
where
g—droplet mass in the previous time step; and
ρw—droplet density.
In addition to the simulation of droplet movement determined by the above equations, a simulation of virus neutralisation in the droplets is carried out using the effect of ultraviolet radiation in the UV-C range of 100–280 nm. The surviving fraction of the virus population is defined by ASHRAE [
20] as
where
k—deactivation rate constant, set to k = 0.00377 cm
2/(μWs) for coronavirus [
21];
I—effective irradiance received by microorganism in μW/cm2; and
∆t—exposure time in seconds.
The effective irradiance received by a microorganism is based on the ultraviolet fluence of the radiation source modulated by the inverse square law, using the formulation of a constant quantity:
where
I
s—ultraviolet intensity of the radiation source, set to 6600 μW/cm
2 in order to achieve 10 μW/cm
2 at the distance of 5 m, as per operational parameters for UV systems [
20];
ds—near distance to the radiation source, such as lamp radius; and
d—particle distance from the radiation source.
Thus, the particles closer to the radiation source will receive higher UV irradiance, and particles further from the radiation source will receive lower UV irradiance.
2.1. The Room Simulation Environment
The room which provides the simulation environment is shown in
Figure 7. The critical room dimension is the height, and it is set to 6 m as per design guidelines for retail premises [
22]. The room horizontal dimensions are set to 30 m × 30 m. A non-functional dummy is positioned at the near-right corner of the room.
Droplets are ejected into the room through a cone, positioned at the height of 1.6 m and placed against the dummy’s mouth, as shown in
Figure 7. The temperature of the droplets is set to human body temperature of 37 °C. The sizes of droplets are randomised, up to the maximum size of 1000 μm as per the findings in [
11], and scaled appropriately for a screen display. The ejection speed is limited to 50 m/s as per the findings in [
7].
The room conditions are set to 50% relative humidity, air temperature and floor temperature are set to 21 °C and wall and ceiling temperatures are set to 18 °C. The room dashboard includes entries for air velocity in the x, y, and z directions and the number of droplets per keystroke to be launched into the simulation.
The room is fitted with a wall-installed representation of an ultraviolet radiation panel that can be switched on or off by the user. When the ultraviolet panel is switched on, the airborne particles in the room are exposed to UV radiation, depending on their proximity to the panel, on the basis of Equation (12), and are removed from the room if their individual surviving fraction is calculated to be zero. The wall installation as in this simulation model is typical of UV systems, in order to create a horizontal rather than a vertical downward radiation field. This is to ensure that occupant safety is not compromised from the harmful effects of UV radiation, thus preventing the occupants to exceed the permissible exposure time specified in [
20].
2.2. Software and Hardware
As already referred to in the Introduction, the above method is implemented in the Unity [
19] physics engine, which provides an overall software framework. The specific equations from the Materials and Methods section are coded into a general droplet/particle component prototype, called “prefab” in Unity, using the C# (C-sharp) programming language. The prefabs are instantiated at the run time, ejecting 200 particles at a spacebar keystroke, thus increasing the number of particles gradually, and also providing a mechanism for the interaction of existing and newly ejected particles. The particle sizes can be easily changed by adjusting the scale of the maximum particle size in the simulation, thus enabling the simulation of particles generated by coughing, sneezing or normal breathing.
The simulations were carried out on a MacBook Pro laptop, with a 3.1 GHz Quad-Core Intel Core i7 processor, 16 GB 2133 MHz RAM and with the Radeon Pro 560 4 GB Intel HD Graphics card.
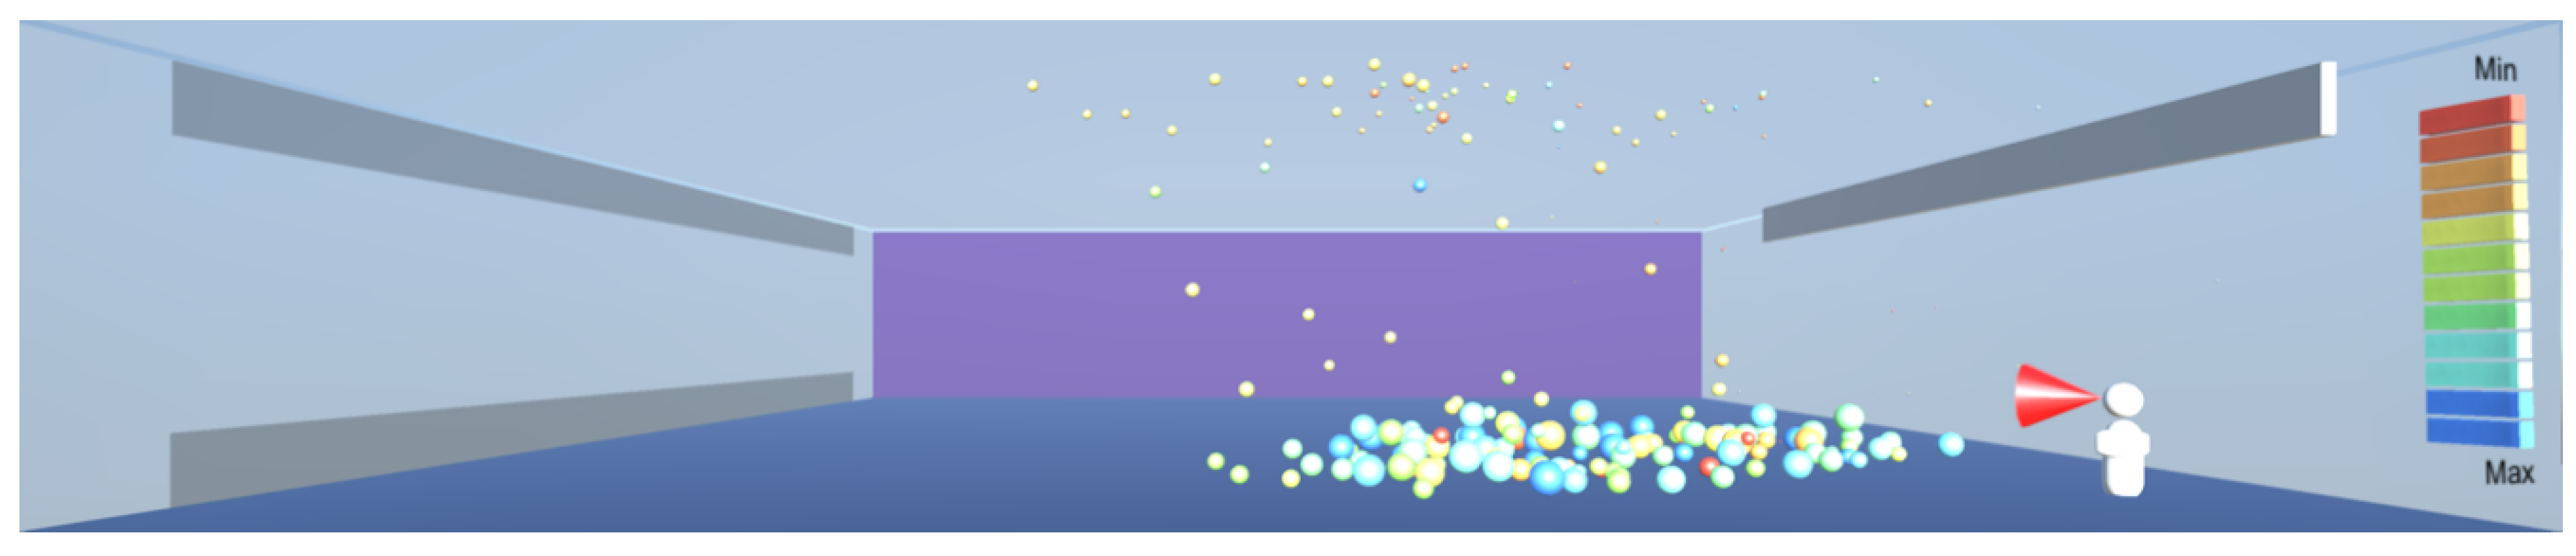
4. Discussion and Lessons for Sustainable Design
As shown in
Figure 8,
Figure 9 and
Figure 10, the droplets suspended in still air reach well beyond the widely used recommendation for social distancing of 2 m. This safety distance recommendation therefore does not work in buildings where there is a risk of infectious aerosols. Additionally, the smaller and lighter droplets are suspended in the air and raise towards the ceiling, and from there they can be carried to any part of the room by the air flow, as shown in
Figure 12,
Figure 13 and
Figure 14. The lesson learnt for sustainable design is therefore to use high-quality filtering of air in buildings, such as HEPA filters that eliminate 99.97% of particles greater than or equal to 0.3 μm [
20].
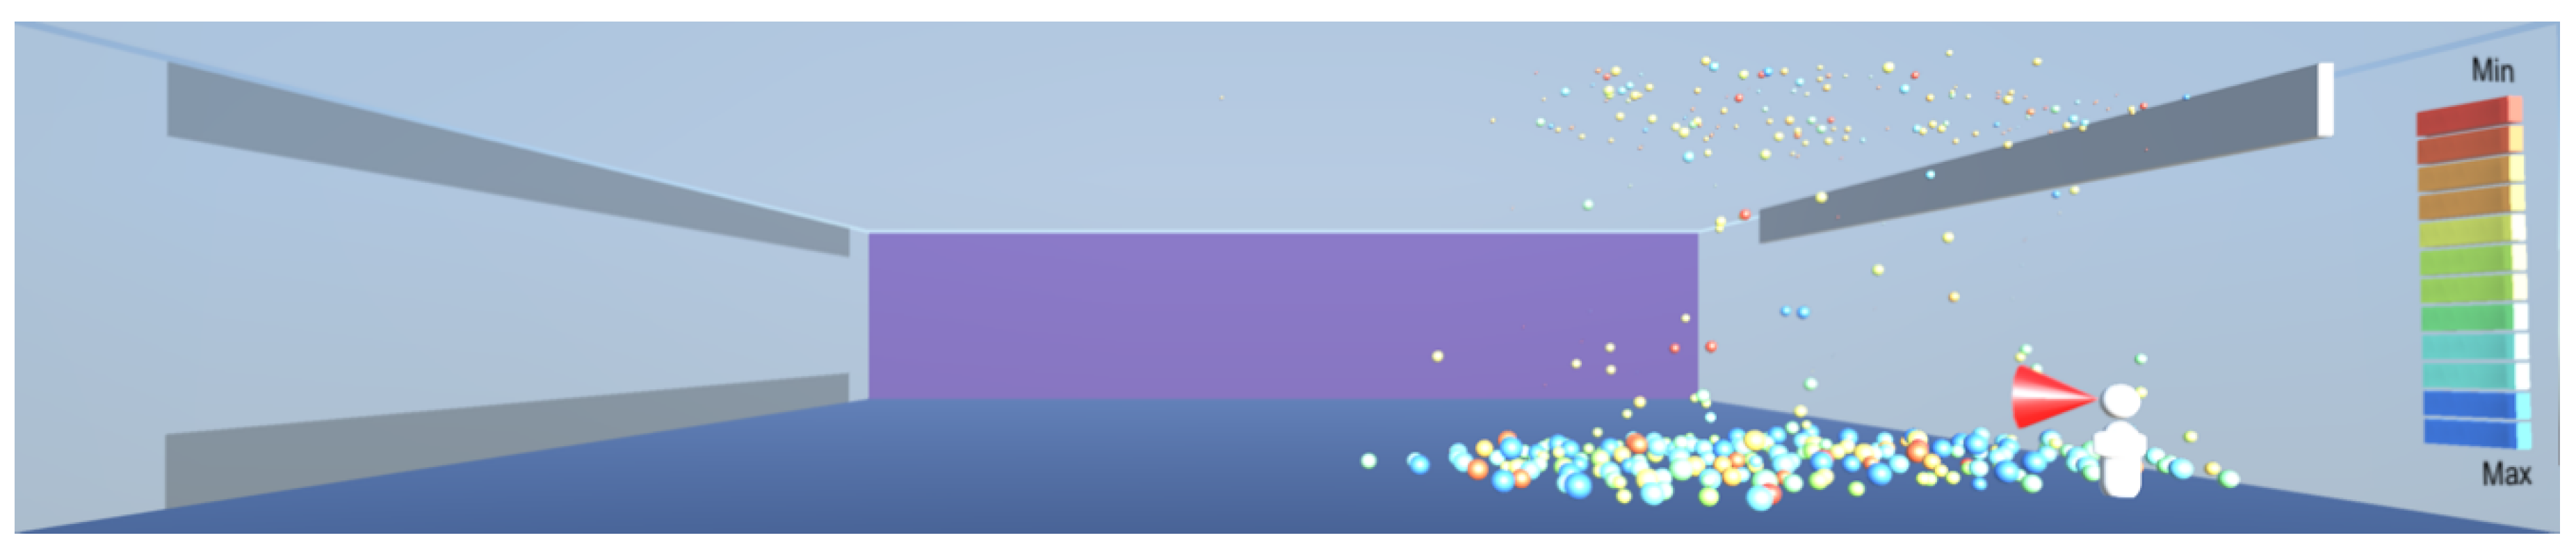
As
Figure 12,
Figure 13 and
Figure 14 show, under random air flow, the droplets linger around the room, especially those of smaller diameters near the ceiling, and thus it is challenging to capture them and eliminate them. However, under a uniform air flow introduced from one side of the room to another, as shown in
Figure 16,
Figure 17 and
Figure 18 both the smaller droplets at high level and larger droplets near the floor level start converging towards one side of the room, from where they can be expelled through high- and low-level vents. Effectively, the uniform air velocity appears to work analogously to a piston in an internal combustion engine, clearing the space in which it operates. The lesson learnt for sustainable design is to use a unidirectional low velocity flow of air, combined with high- and low-level exhaust air vents.
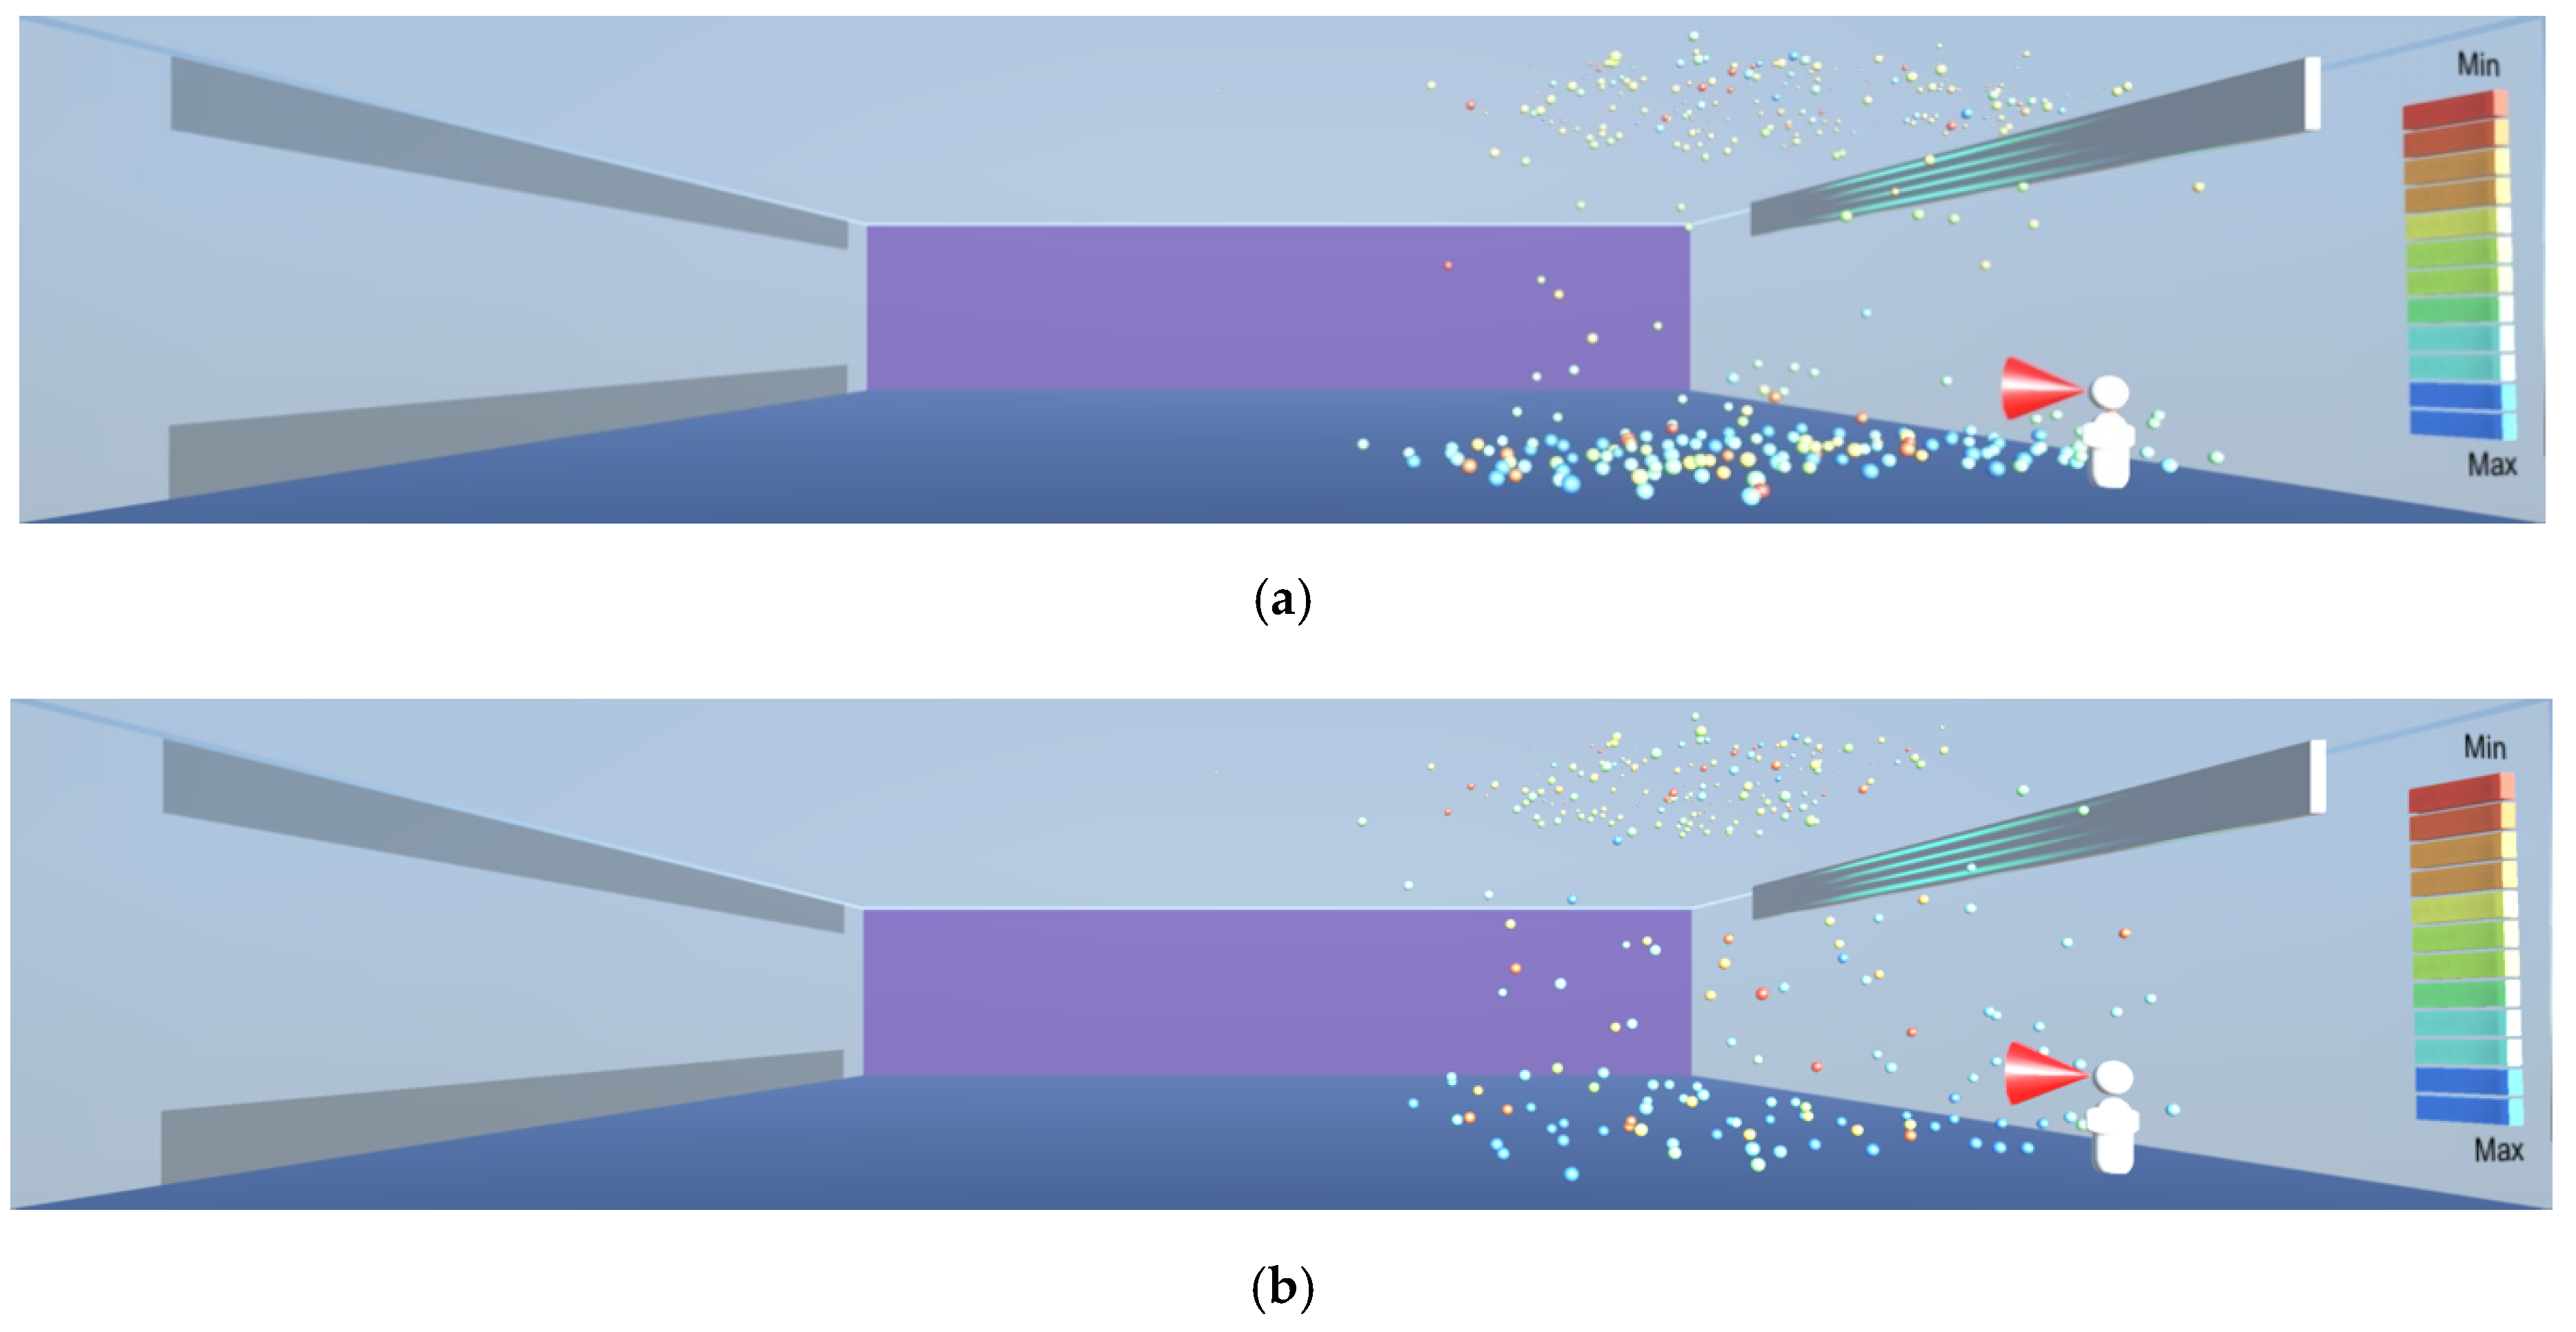
As aerosol droplets gradually lose their mass through evaporation, they become lighter and start rising towards the ceiling, as in the evaporation experiment in
Figure 19,
Figure 20,
Figure 21 and
Figure 22. As the droplets evaporate, they eventually become nuclei that contain the virus which can be 0.12–0.16 μm in diameter [
4]. Contrary to the understanding that the nuclei fall on the floor [
7], they are very likely to rise to higher levels of the room, as demonstrated by the model and shown in
Figure 22. This is consistent with the findings by the consortium of research organisations in Finland, as reported in [
18]. The evaporation and consequent rising of the droplets towards the ceiling result in a continuous presence of the droplets in the breathing zone, as shown in
Figure 23, being of sufficient size to contain the virus, as shown in
Figure 24.
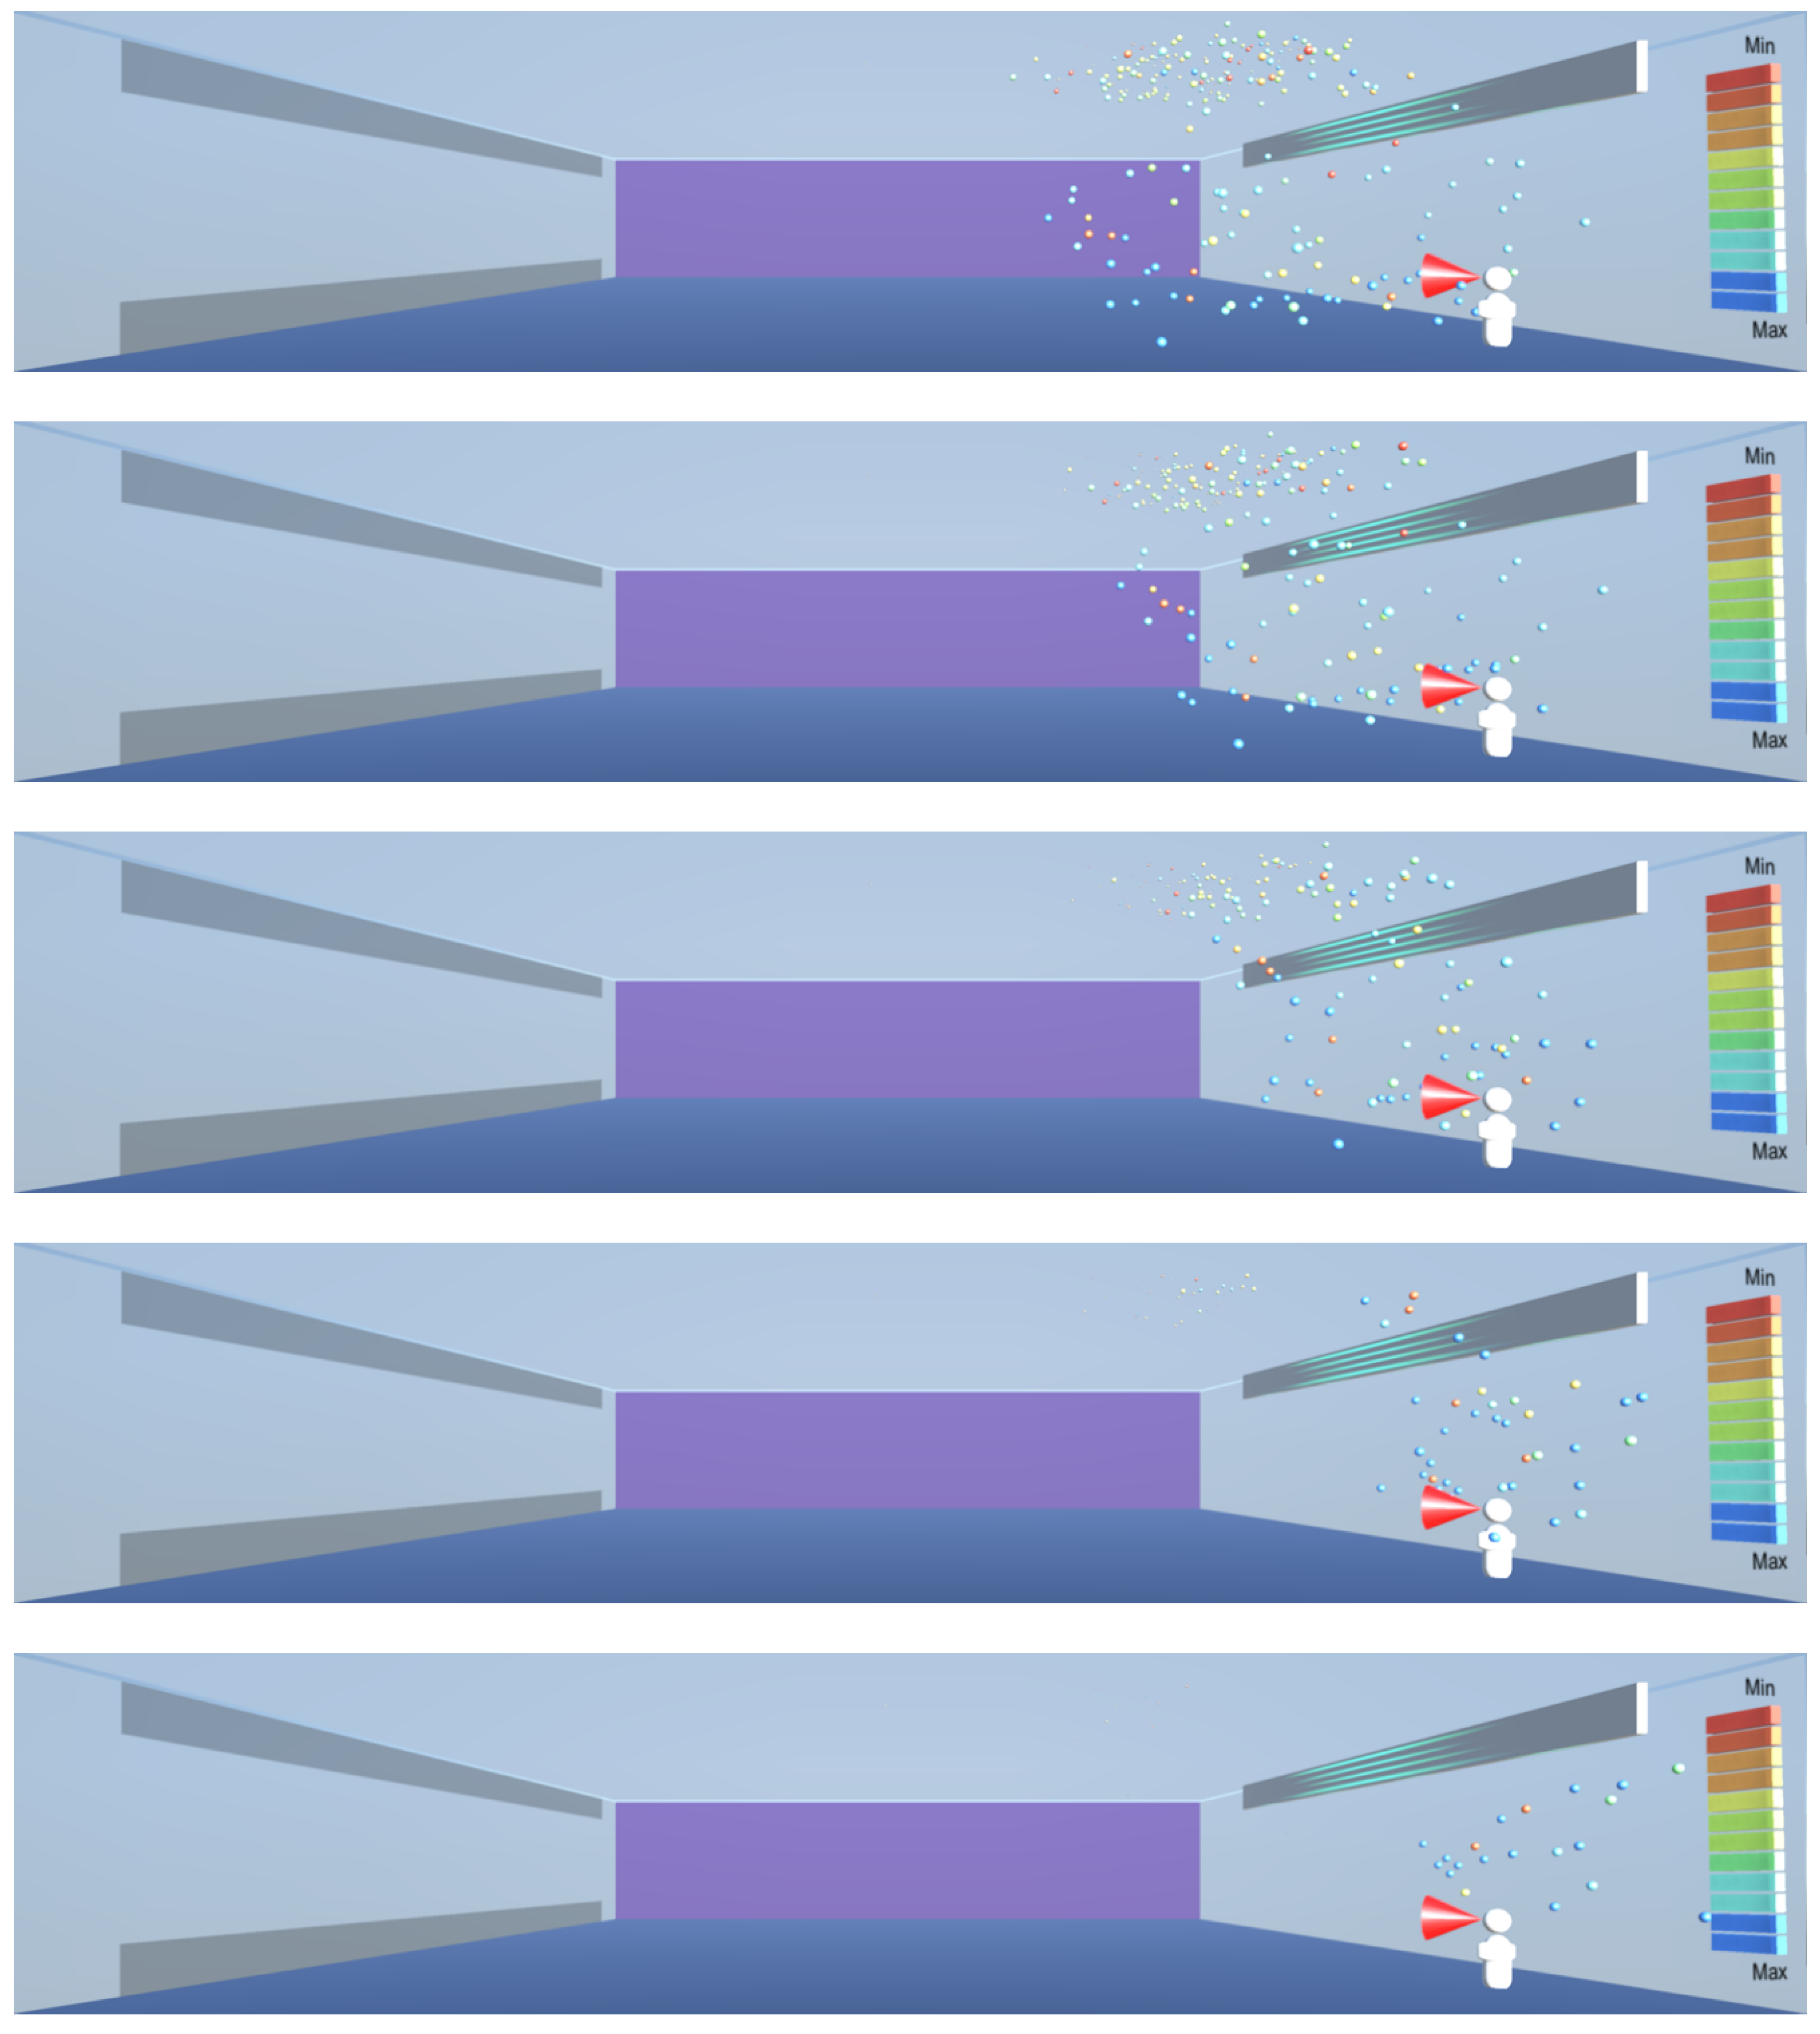
In such cases where there are droplets and particles in the upper part of the room, ultraviolet radiation can be deployed to help with disinfection, as shown in
Figure 25. Radiation in the UV-C spectrum, in the wavelength range between 100 and 280 nm and especially the wavelength of 265 nm commonly available in UV lamps is known to destroy microorganisms by breaking their DNA and RNA chains [
2]. Thus, the lesson learnt for sustainable design is to make a provision for the installation of UV-C radiation devices at a higher level near the ceiling where other infection transmission measures cannot be easily deployed. The virus deactivation can be sped up by introducing uniform air flow towards the ultraviolet source, in order to bring the droplets and particles containing the virus into the range of the ultraviolet source, as shown in
Figure 26.
This article has introduced a proof of concept model, that requires further calibration in order to achieve quantitative results. Hence, no claims are being made in respect to the model’s quantitative accuracy. However, the model has provided several qualitative insights into the behaviour of aerosols of the sizes capable to carry a virus, and has provided useful lessons for sustainable design.
However, can the lack of validation of this work diminish its importance? Validation of any simulation of a real-world phenomenon requires significant funding, significant amount of data and significant amount of time. None of these have been possible due the rapid spread of the COVID-19 pandemic.
Could the results of a non-validated model lead to a wrong interpretation of the recommendations? Although the simulation results are not validated, they are consistent with other simulation studies and with the available literature. Specifically, the results of the current research are consistent with the findings by others that the droplets can travel much further than the social distancing measure of 2 m [
17,
18], that they can be suspended in the air over longer periods of time [
2,
10] and that very small particles do not sink on the floor but remain suspended and move in the air currents [
18].
Can this be considered to be a rushed-up approach that makes claims on the basis of a proof of concept model? The approach introduced in this article is based on solid background research and on physics modelling of the movement of particles of the size equivalent to infectious aerosols. It is the best we can get quickly on an ordinary computing platform, a laptop instead of a super-computer, in the midst of the COVID-19 pandemic, as the validation would take significant funding and considerable time to complete. Although further research is required for making quantitative claims, the qualitative claims are consistent with published sources and can be used for informing the sustainable design of buildings.
The main contribution of this study is that it brings the simulation of the movement of infectious aerosols in buildings to a wider audience, without requiring specialist software such as ANSYS [
17] or a consortium of research organisations with access to a super computer [
18]. The space size and the droplet scale range can be quickly configured, and the model will let the droplets do what they must, through self-organised simulation and governed by the laws of physics, thus giving insights into emergent behaviour of aerosols and enabling us to find something new that has not been explicitly programmed. This work therefore creates an evolving platform for increasing our understanding of the issues for the prevention of airborne infection in buildings.
5. Conclusions
The recent pandemic caused by the COVID-19 outbreak gave an additional new dimension to sustainability in buildings, namely to sustain human health under the threat of airborne disease transmission. This article looked into the limitations of conventional computational fluid dynamics to model air movement, and introduced an emergent, bottom-up modelling of the dynamics of aerosols that can cause disease transmission.
Using a physics approach to modelling individual droplets generated from exhalation, coughing or sneezing, an emergent self-organised model was developed that enabled the investigation of several scenarios. These included the distance of travel of particles, suspension of lighter particles in the air, investigation of the effects of uniform and turbulent air flow, the effects of the evaporative reduction of droplet sizes leading to an increased concentration of airborne particles and the effects of ultraviolet radiation on virus neutralisation.
Although the model introduced in this article is a proof of concept model, and as such could not give quantitative results as it requires calibration with data obtained from the monitoring of buildings, the qualitative outputs provided new insights into the dynamics of aerosols and the interventions that can lead to sustainable design.
The results of the current research show that the droplets can travel much further than the social distancing measure of 2 m, and are consistent with the findings by others [
17,
18]. This research also concurs with [
2,
10] that the droplets can be suspended in the air over longer periods of time. The finding that very small particles do not sink on the floor but remain suspended and move in the air currents, consistent with [
18], introduces a new dimension into the planning for the prevention of disease transmission in buildings. This study brings the simulation of the movement of infectious aerosols in buildings to a wider audience, without the requirement for specialist software [
17], research and computing facilities [
18]. For that reason, it is hoped that this research provides additional information that helps plan for the prevention of disease transmission in buildings.
This research shows that when we let the droplets do what they must, based on physics and self-organisation through the interaction with the other droplets and the environment, we can learn something new that we have not explicitly programmed into the model. It is believed that this approach creates an evolving platform for increasing our understanding of the issues for the prevention of airborne infection transmission in buildings that can help us improve the sustainable design of buildings.


