Development of an Evaluation Framework for Smartness and Sustainability in Cities

 ,
, 
 ,
,
Abstract
:1. Introduction
“A smart sustainable city is an innovative city that uses information and communication technologies (ICTs) and other means to improve quality of life, efficiency of urban operation and services, and competitiveness, while ensuring that it meets the needs of present and future generations with respect to economic, social and environmental as well as cultural aspects”.
2. Contextualization of the Sustainability and Smartness Evaluation Approach
- The first one is to define specific indicators related to technology or ICTs and to include them in the global index [14], defining a “sustainalligence” index, i.e., a “sustainability and intelligence” index.
- The second one is to try to analyze the effect of smartness indicators on the sustainability indicators, taking into account that one specific smartness indicator can affect many different sustainability indicators, and even the effect can be positive or negative from one to another. Besides, this effect is difficult to isolate.
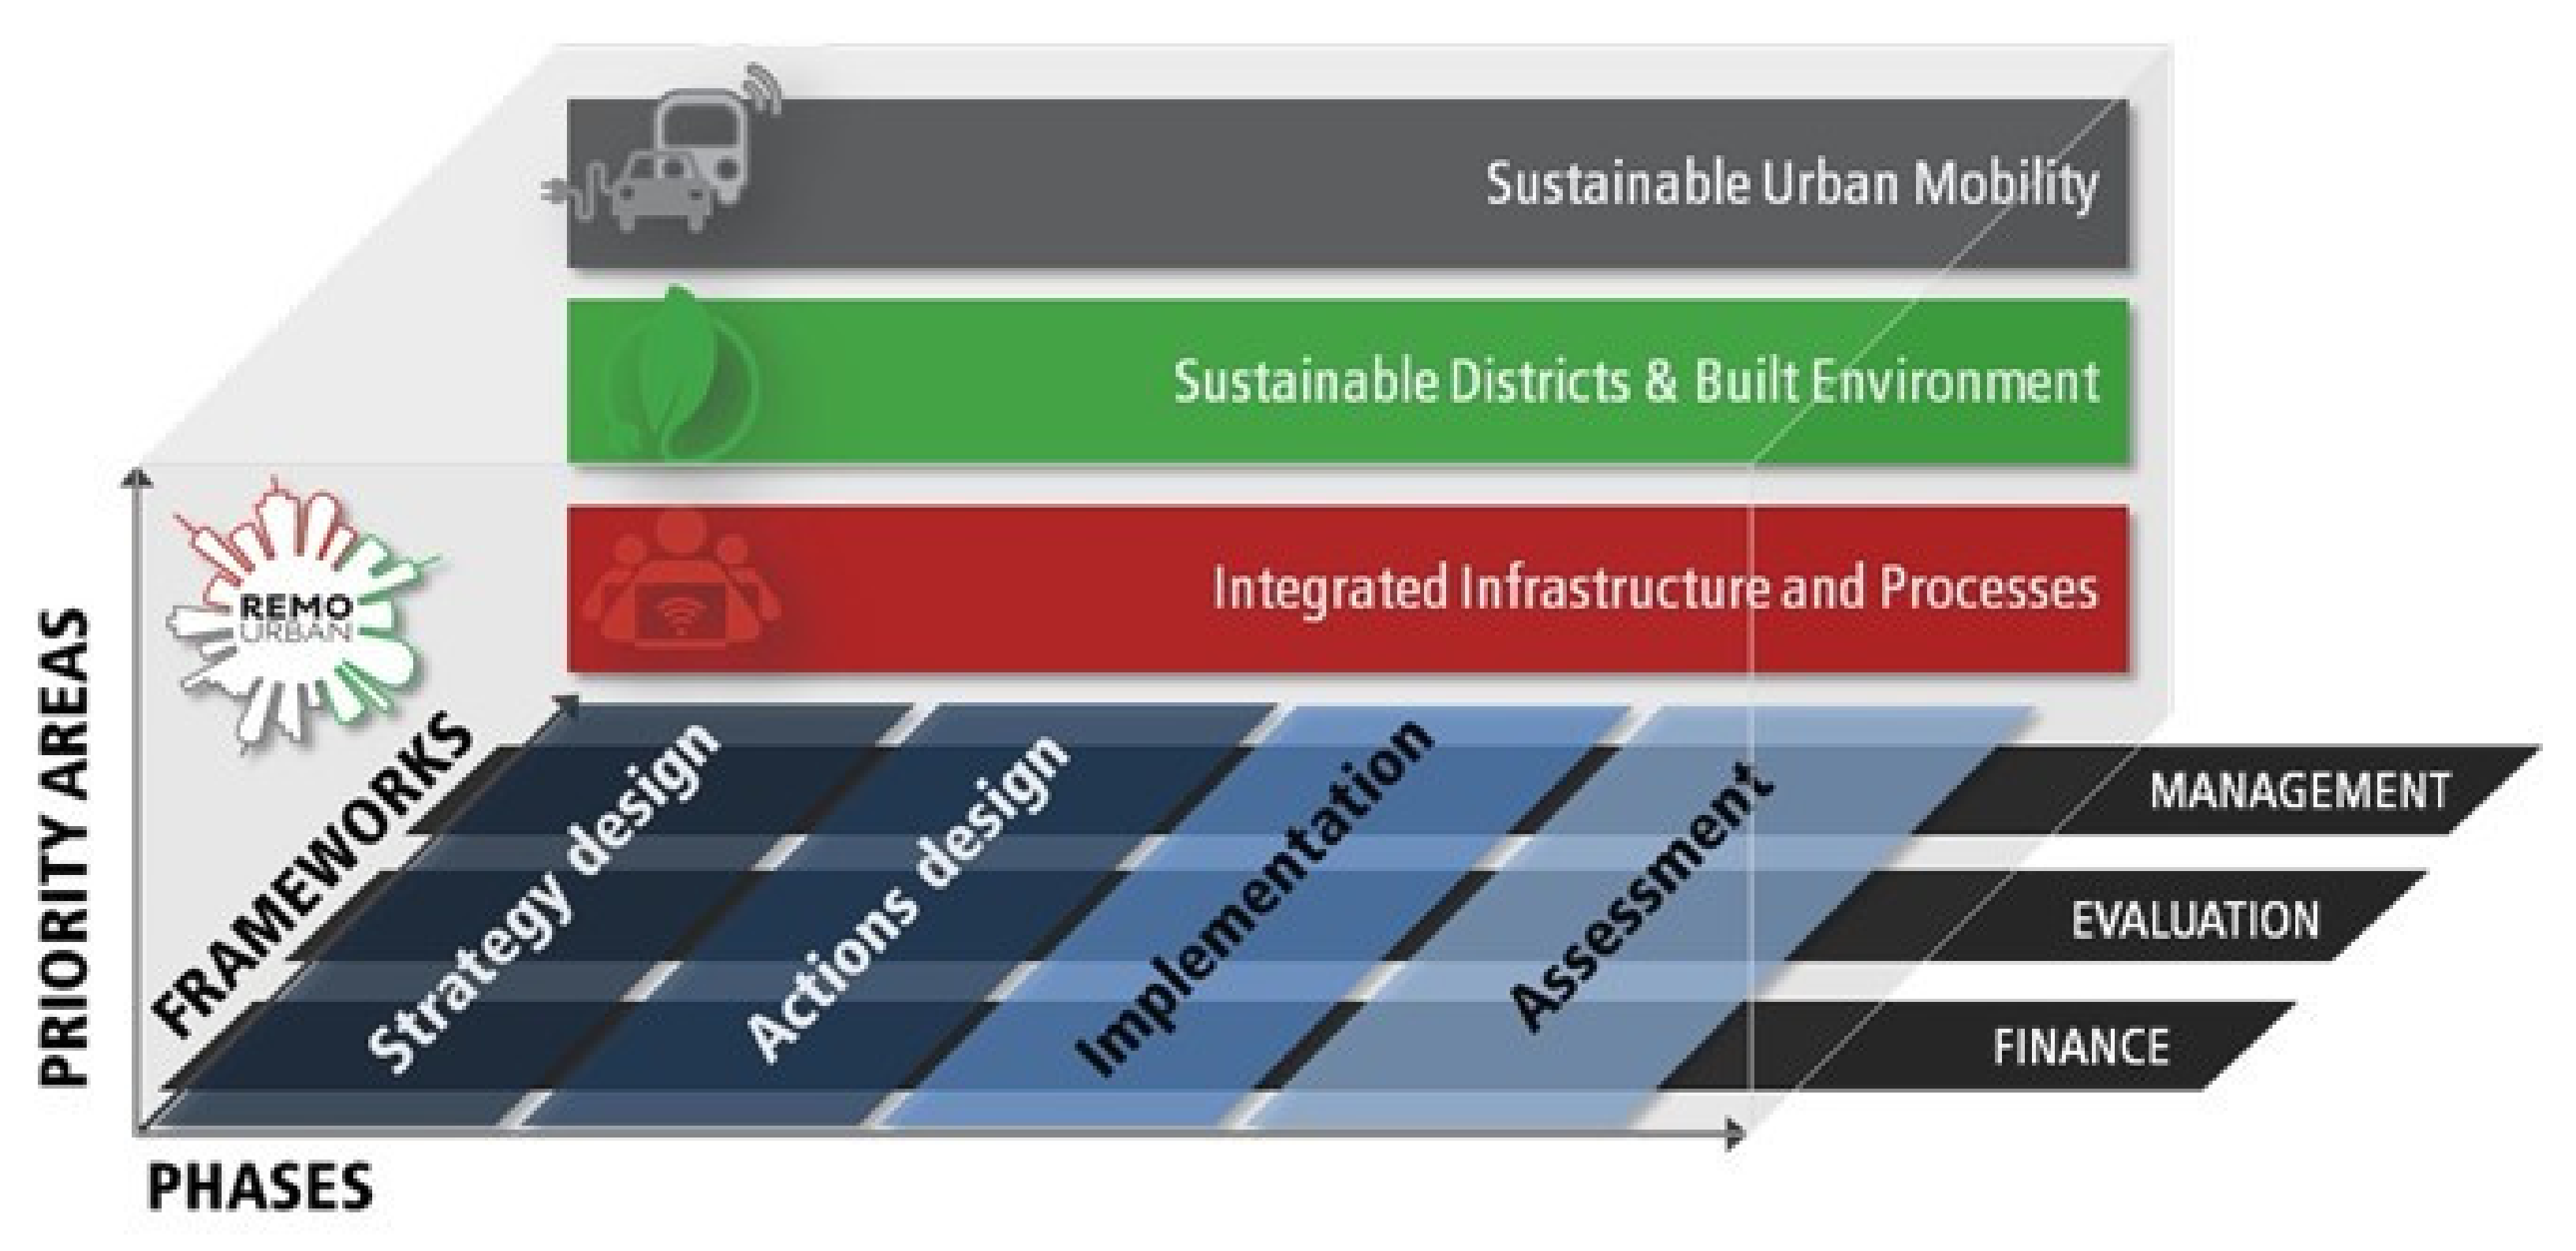
3. Sustainability and Smartness Evaluation Framework
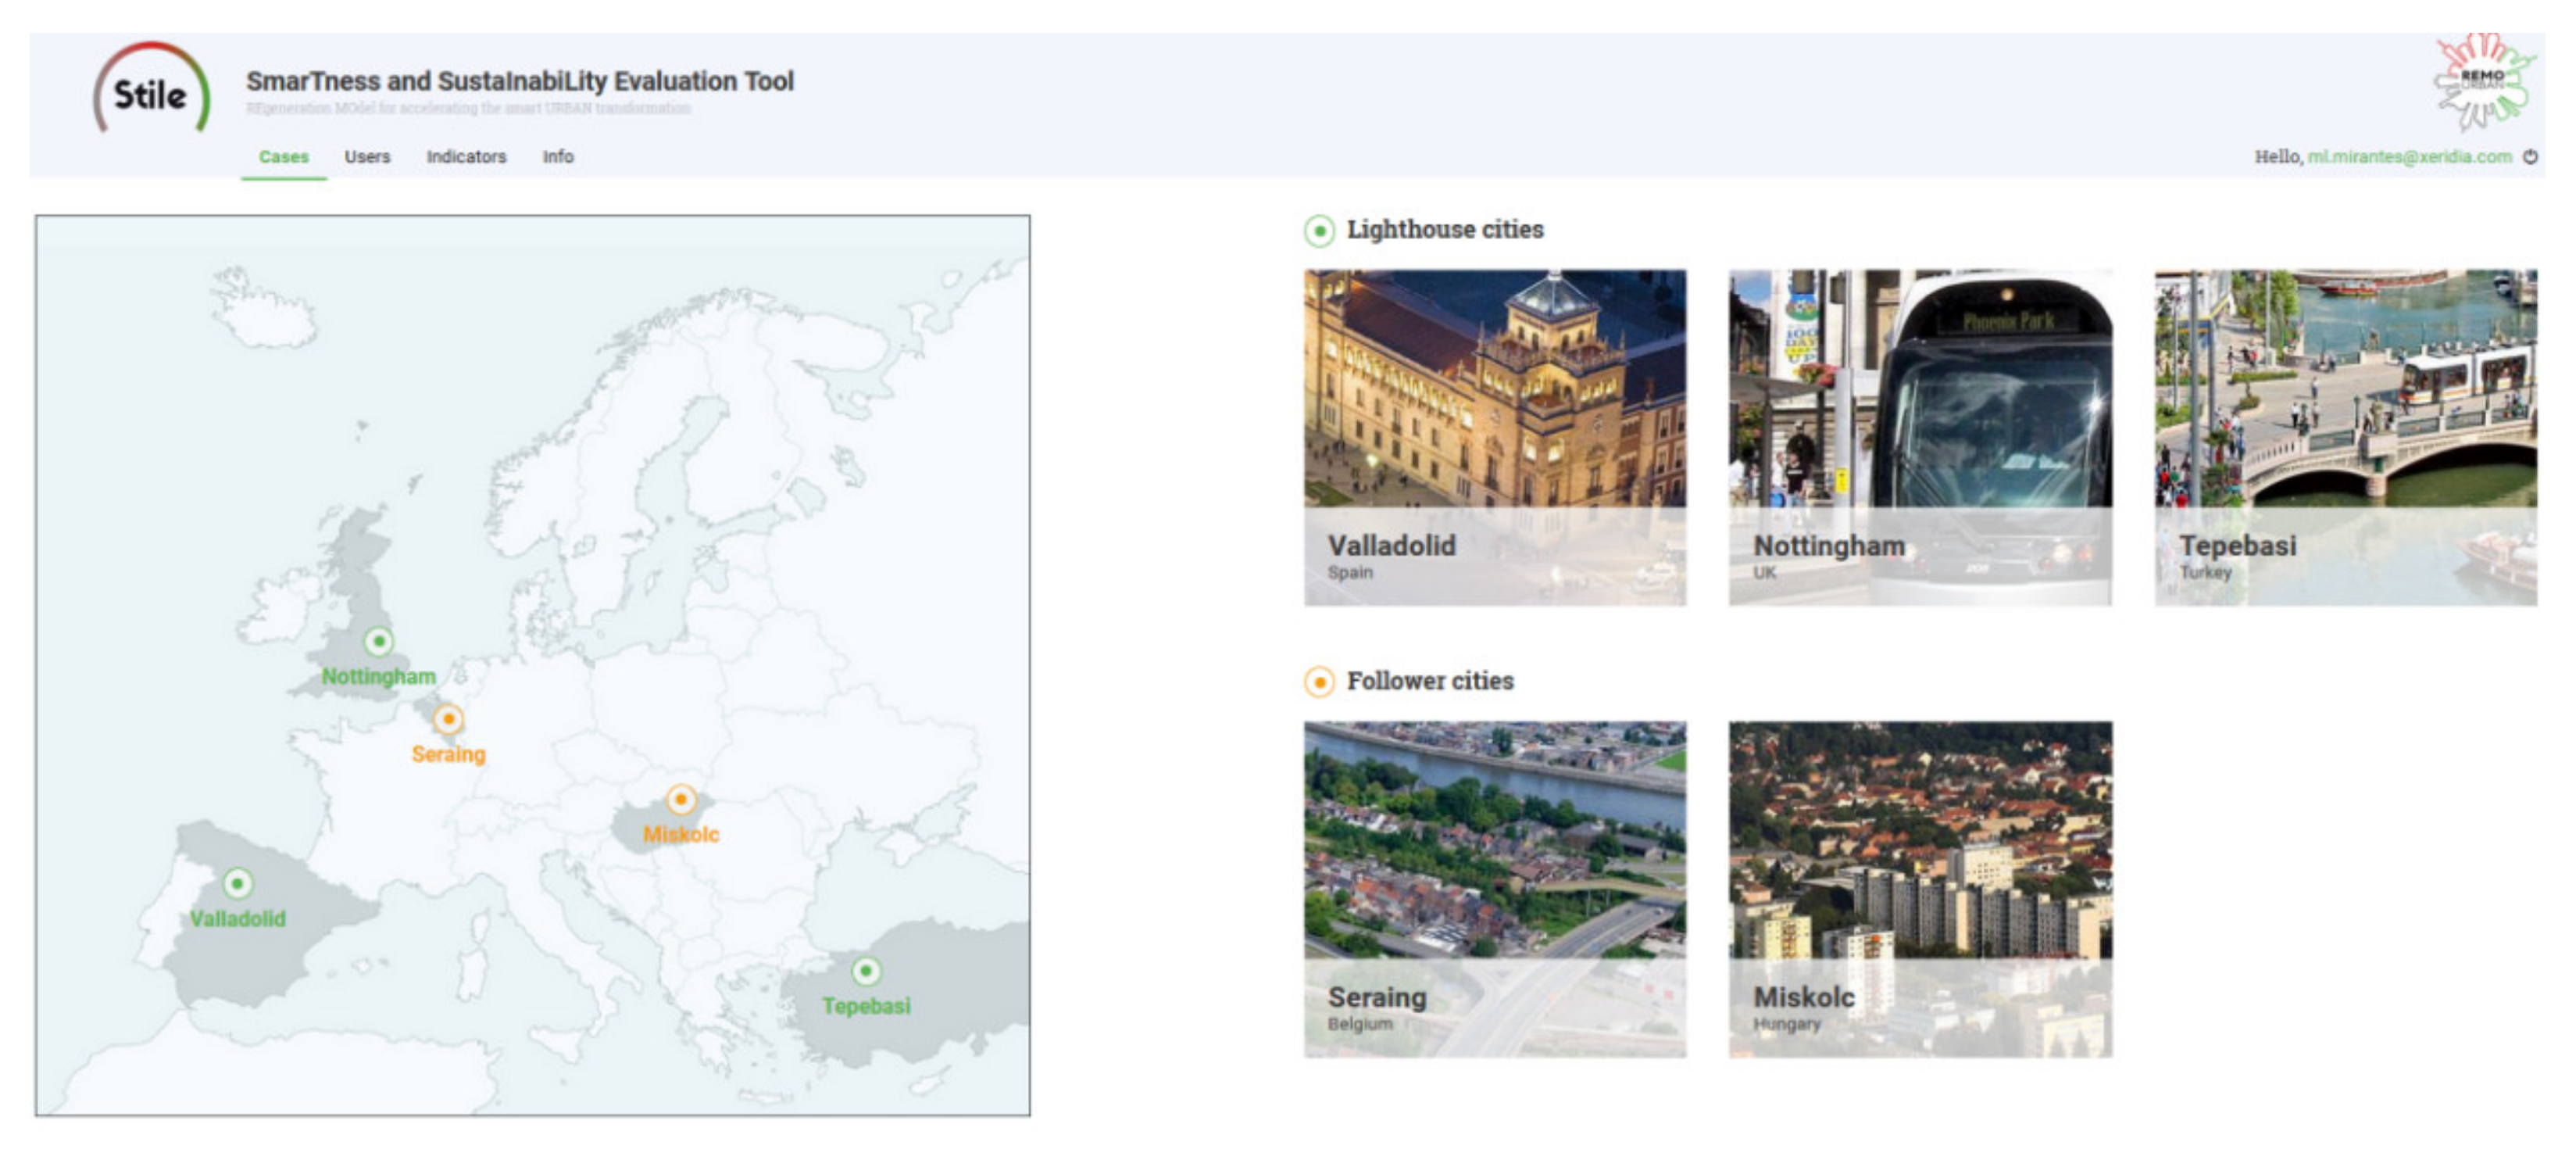
4. Evaluation Supporting Tool: STILE
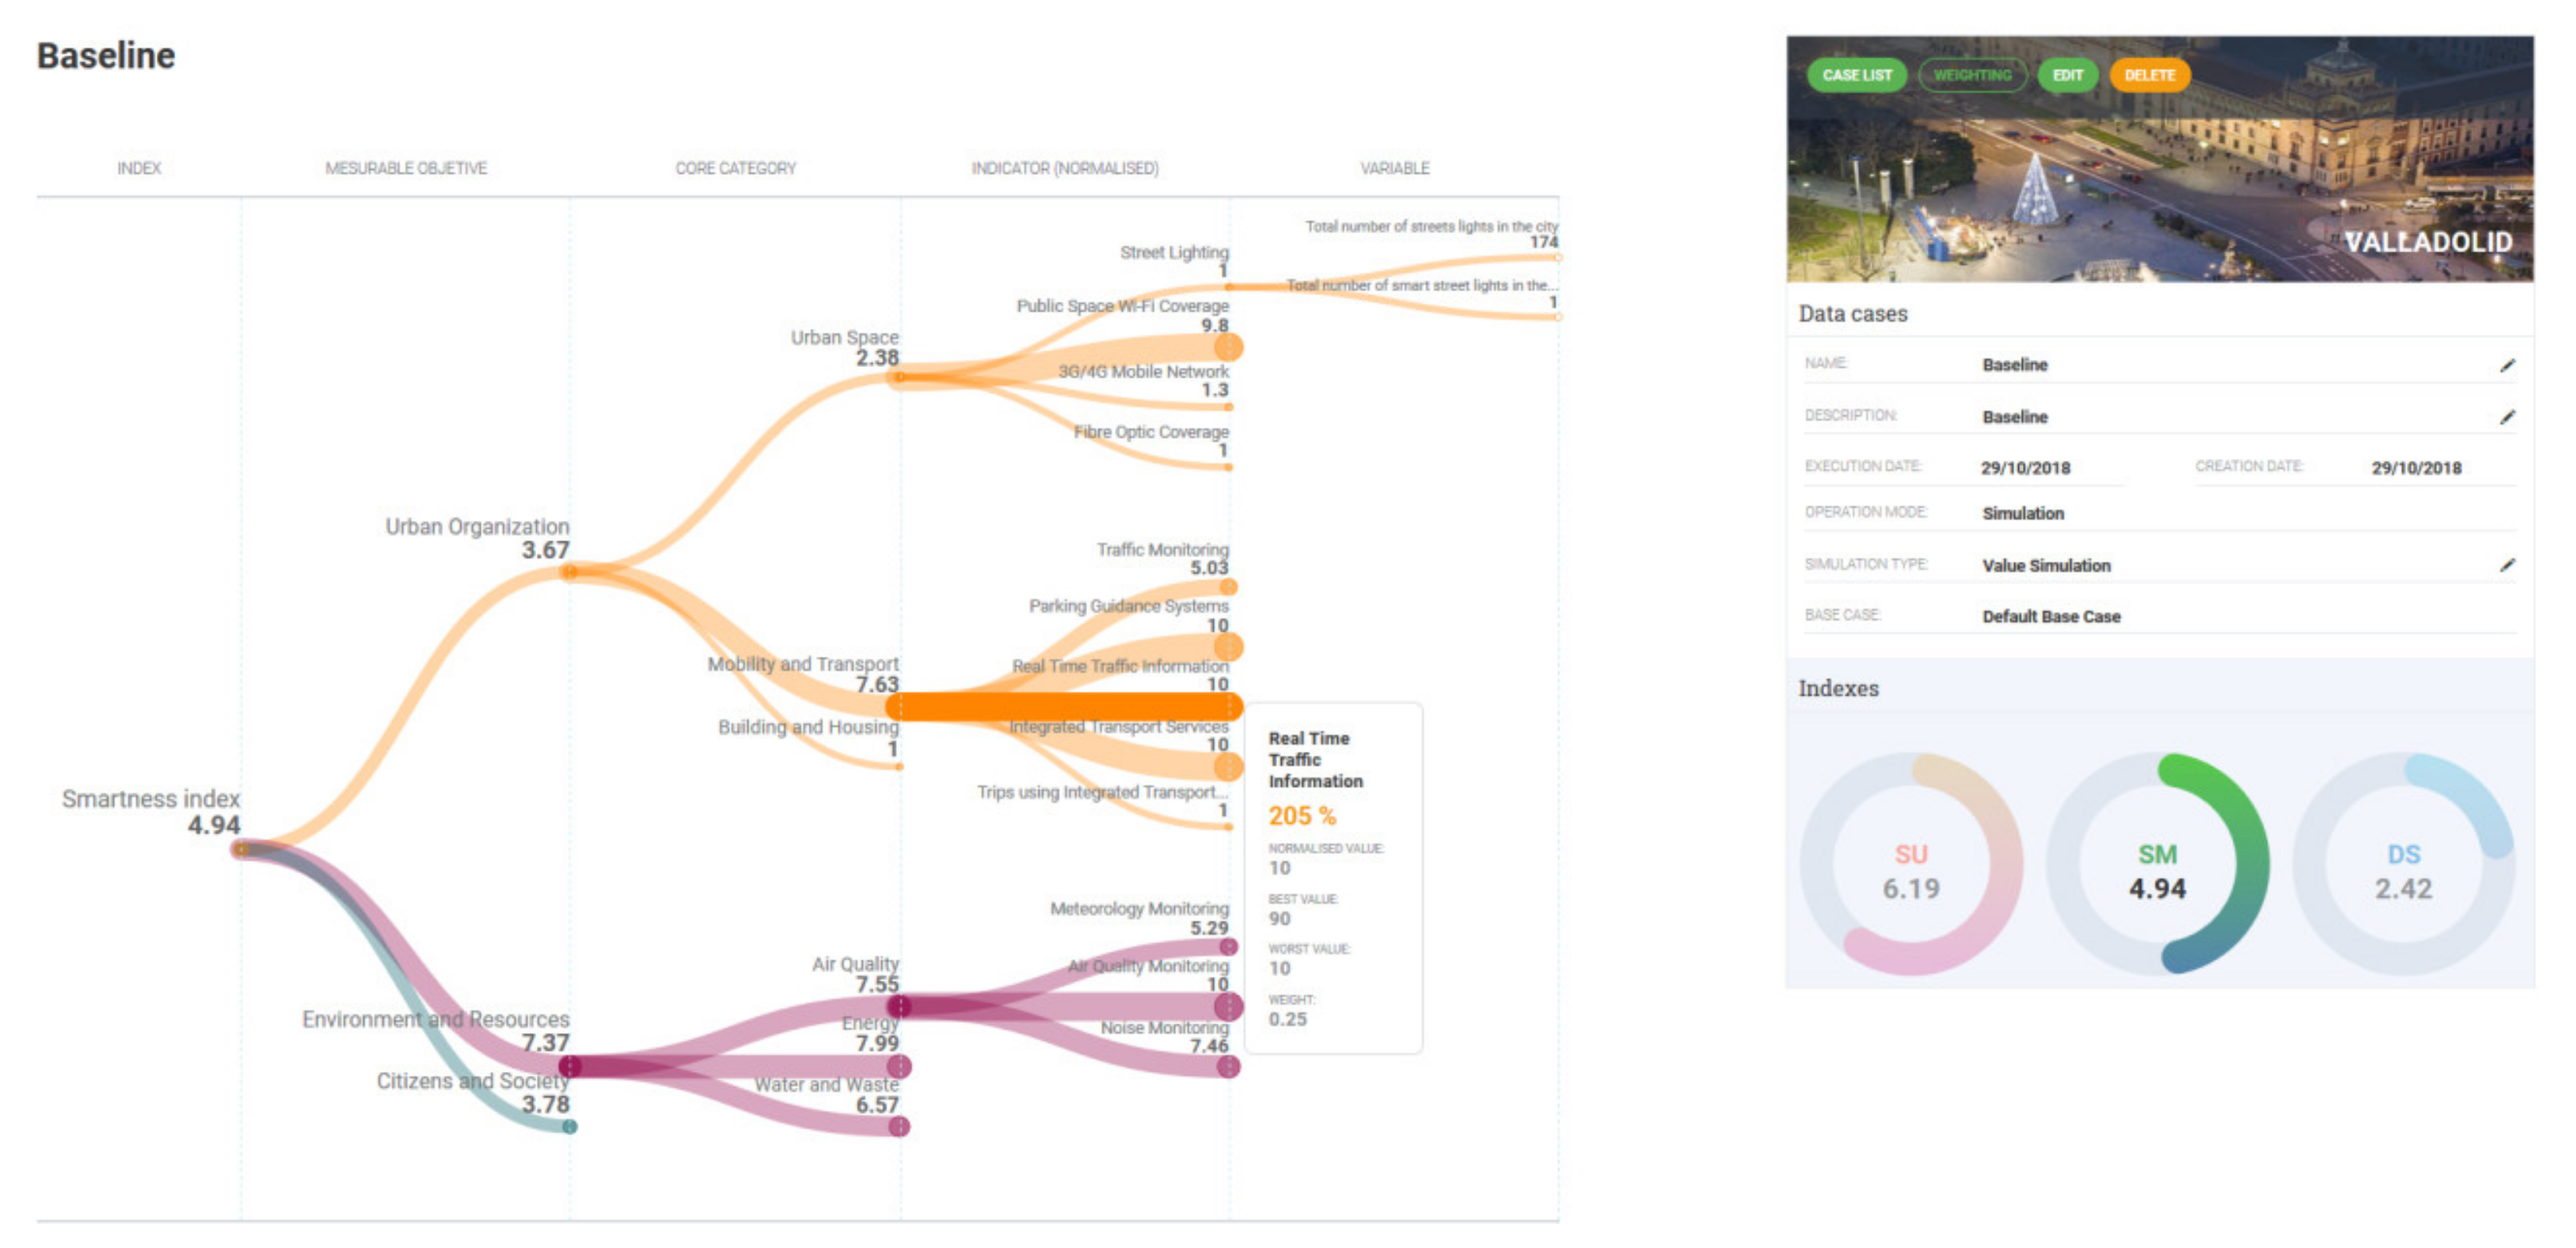
- Progress assessment comparing with baseline situation. In REMOURBAN this is especially useful, since it enables us to compare a city’s situation before REMOURBAN with the situation after the implementation of a project’s interventions, to be able to quantify and evaluate the effects of those interventions. The calculation of the baseline in STILE has two main inputs. On one hand, indicators are calculated over the values gathered for the different variables before REMOURBAN interventions. These values can be requested to the Global ICT Platform if they are already available there, or can be manually provided and entered in STILE through the simulation form. On the other hand, a threshold and weighting scheme to be used in the normalization and aggregation formulas, is required. For this purpose, the hardcoded starting base case was used to run the baseline evaluation. This base case was created with the baseline values for thresholds and weights specified by the evaluation framework.
- Progress assessment in two different timeframes, reinforcing decision-making by providing a clear report on whether interventions are performing as expected or, on the contrary, some improvements or corrective actions should be taken.
5. Sustainability and Smartness Evaluation Methodology
5.1. Scope Definition
5.2. Baseline Definition for the Lighthouse Cities
5.3. Reporting Period for the Lighthouse Cities
5.4. Data Collection and Analysis
- Same value was sought and compared in different data sources and only reliable data was noted.
- Where available, values were compared to reference values from normative, standards or bibliography in order to check the magnitude and identify possible mistakes in the databases.
- Missing values were replaced, where possible and applicable, with regional or country values or standardized values from accepted references. In this respect, it is important to remark that the tool has implemented a missing data imputation algorithm based on reference thresholds coming from proven bibliography or expert opinions which means that all the required datasets are always covered (in case this situation occurs, this is depicted as mentioned before by the red line branch in the STILE tool graphics).
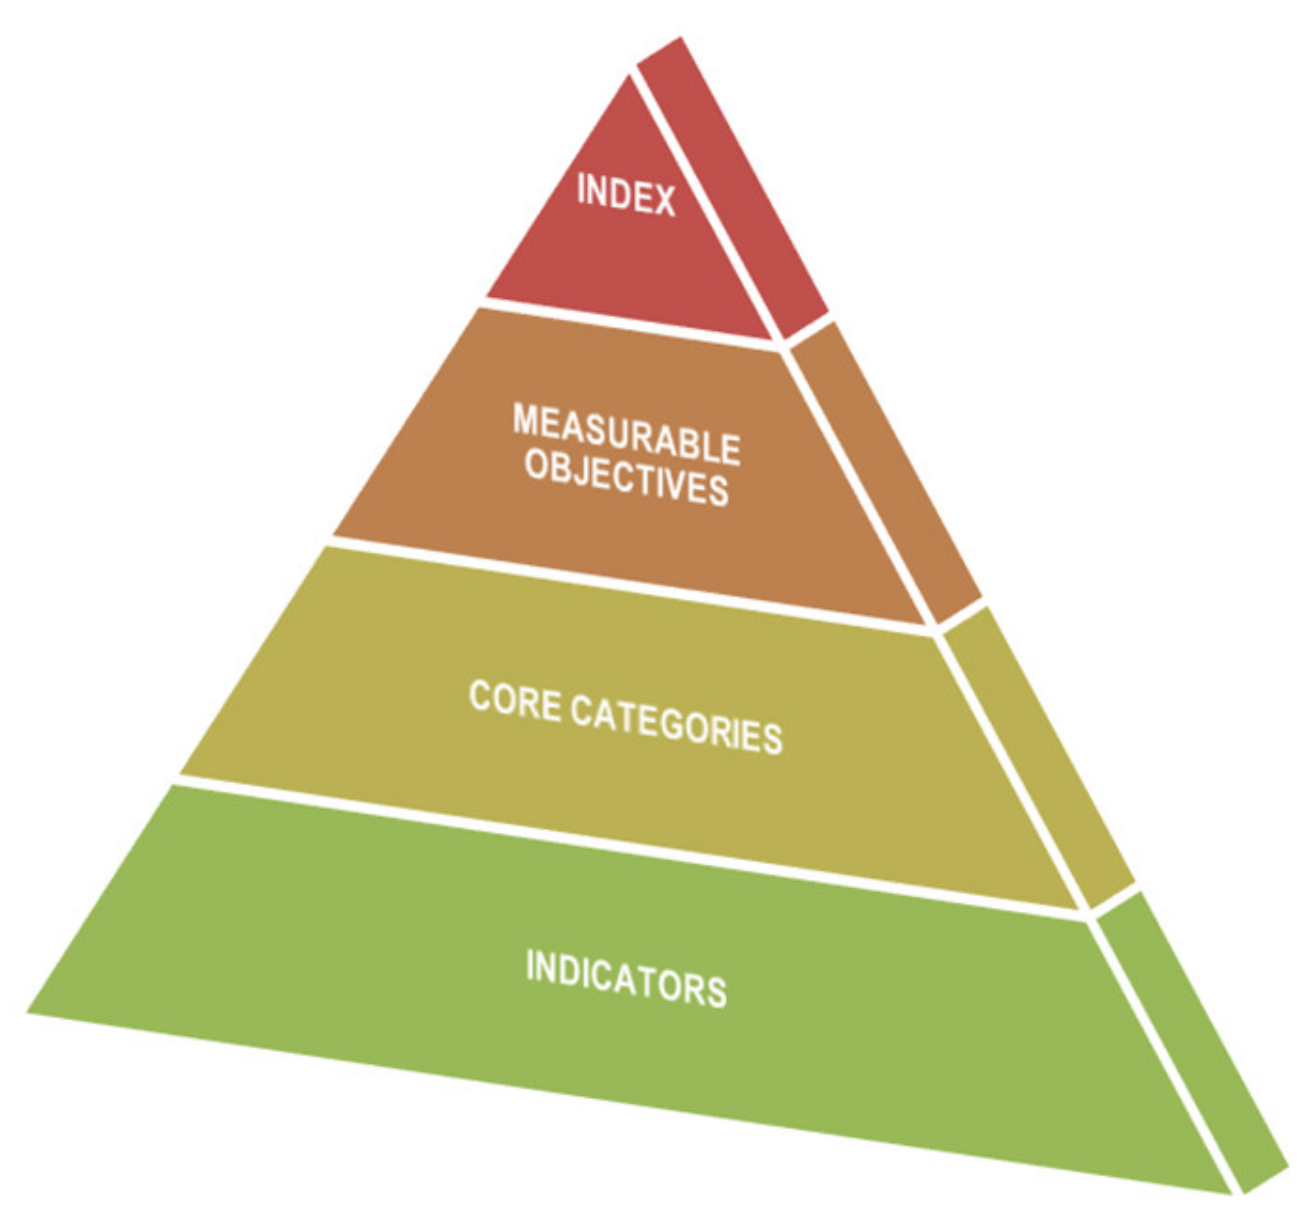
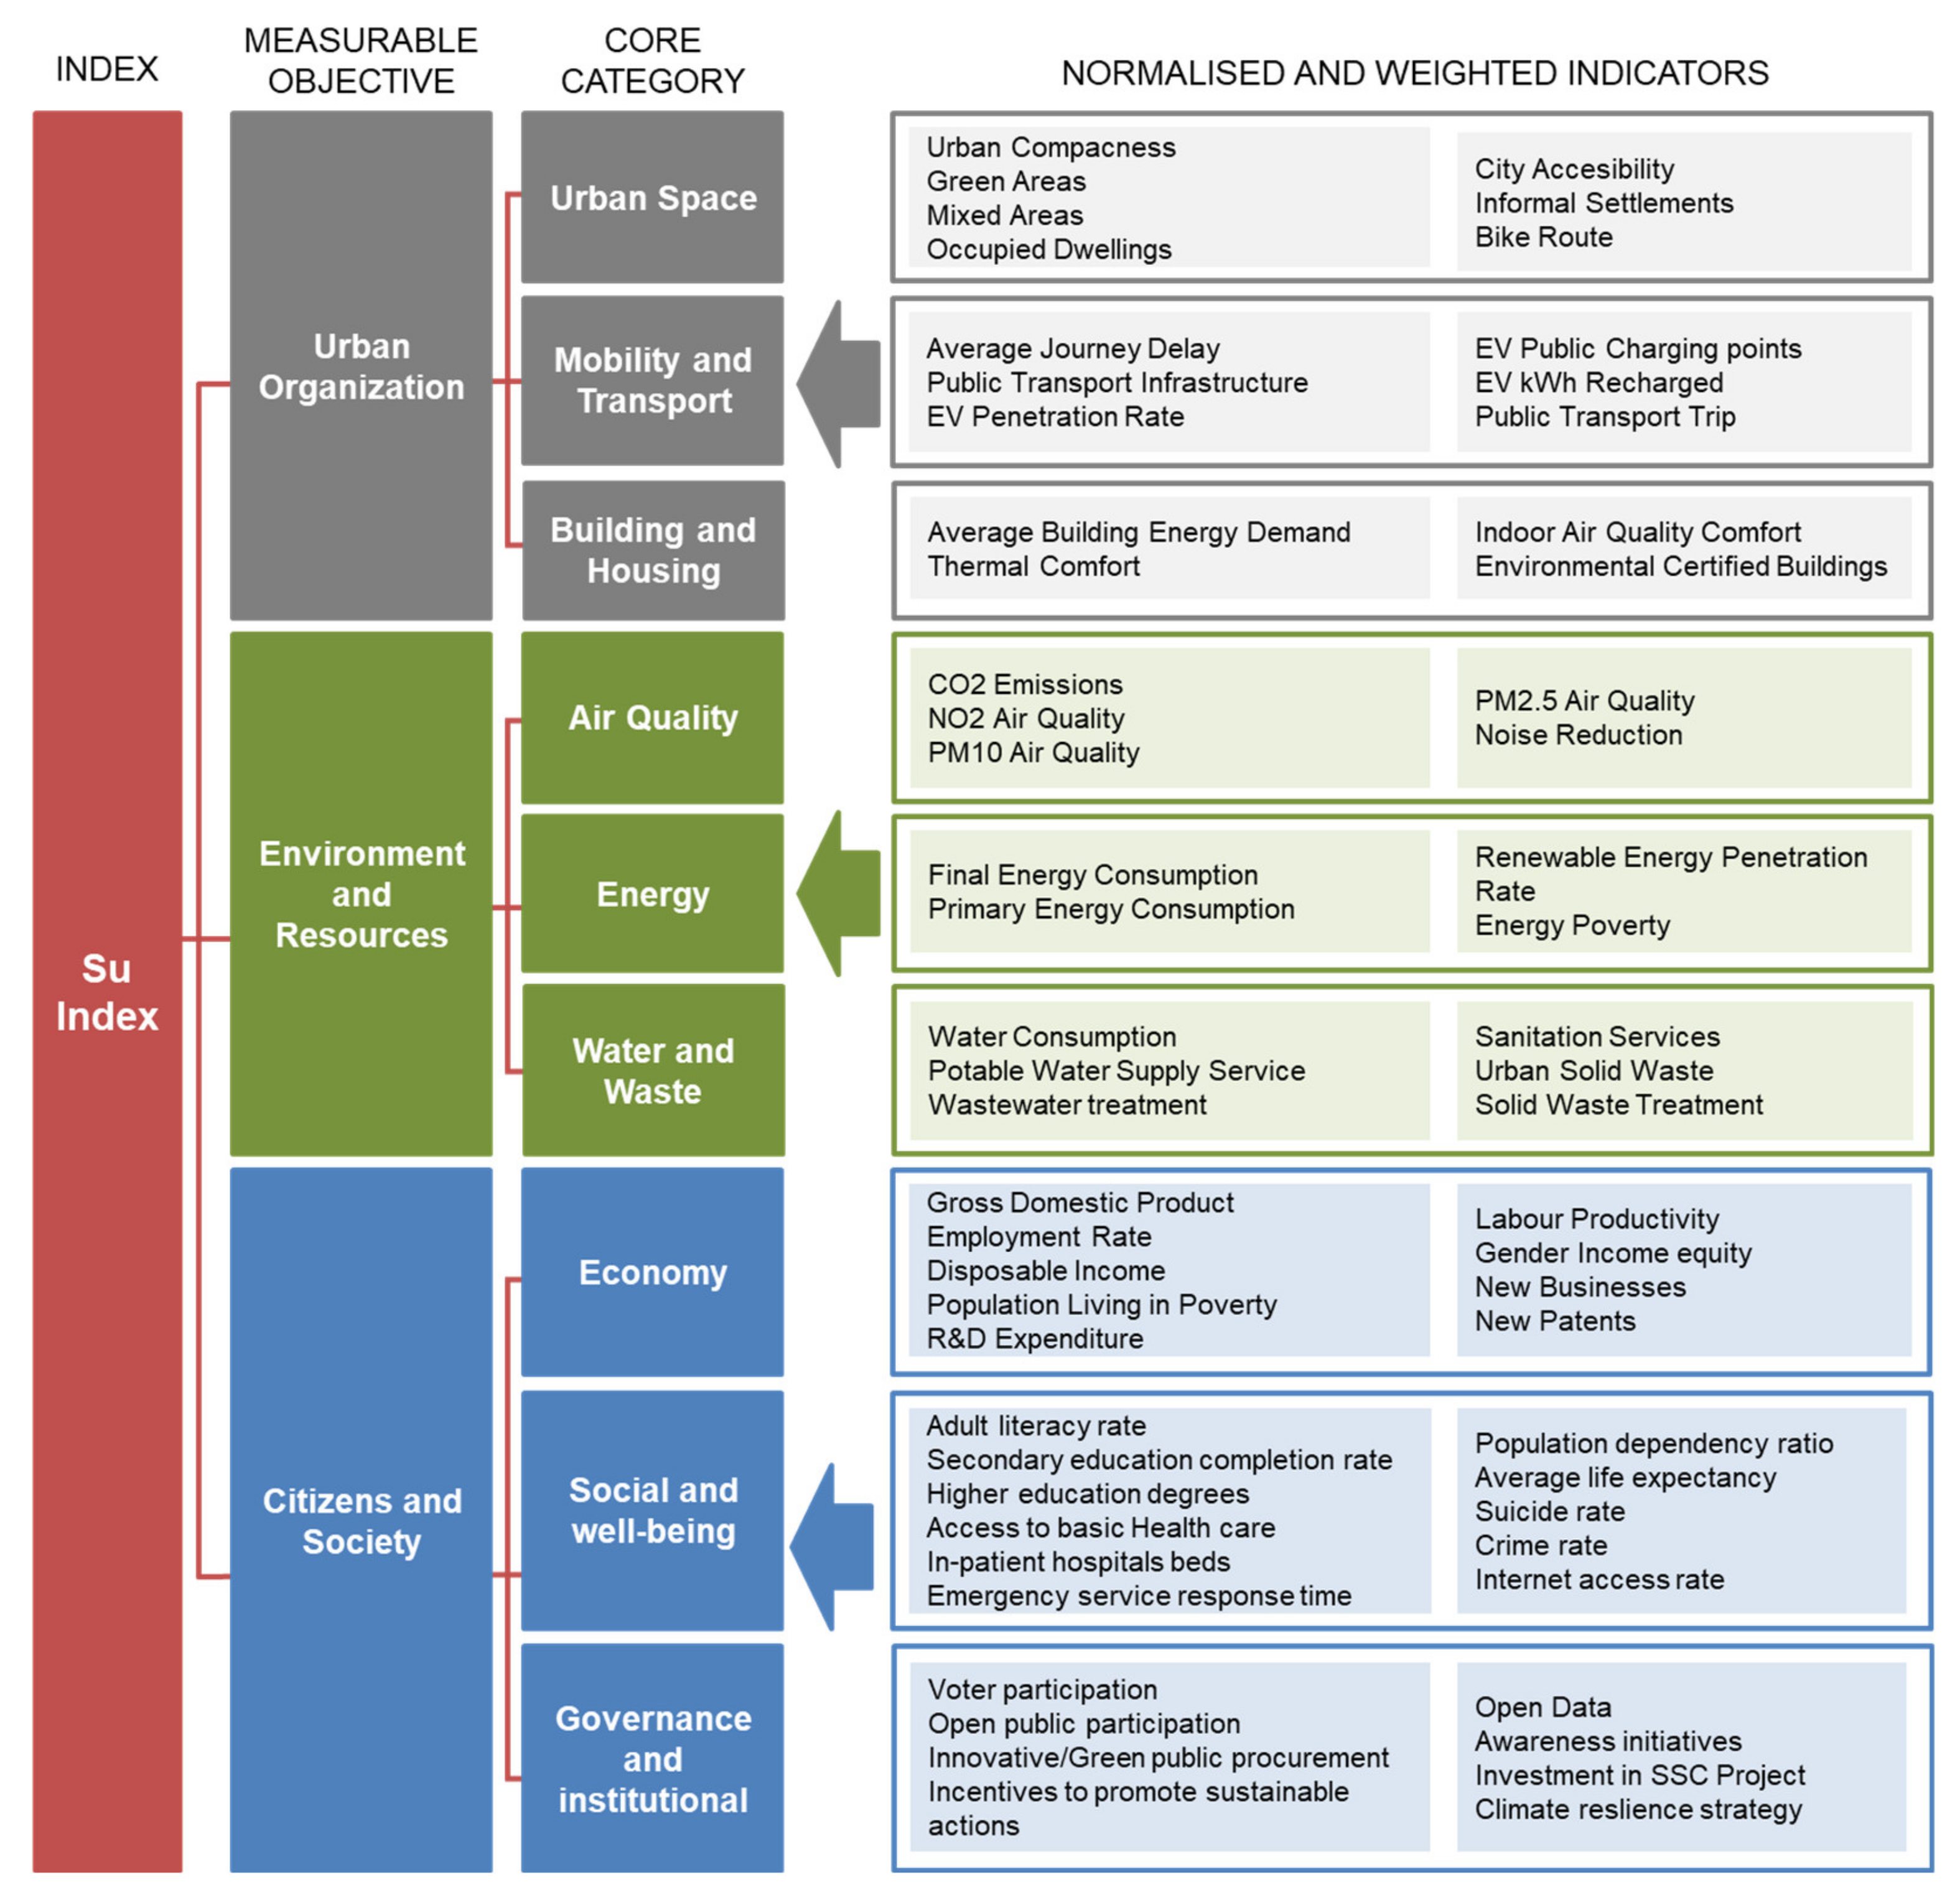
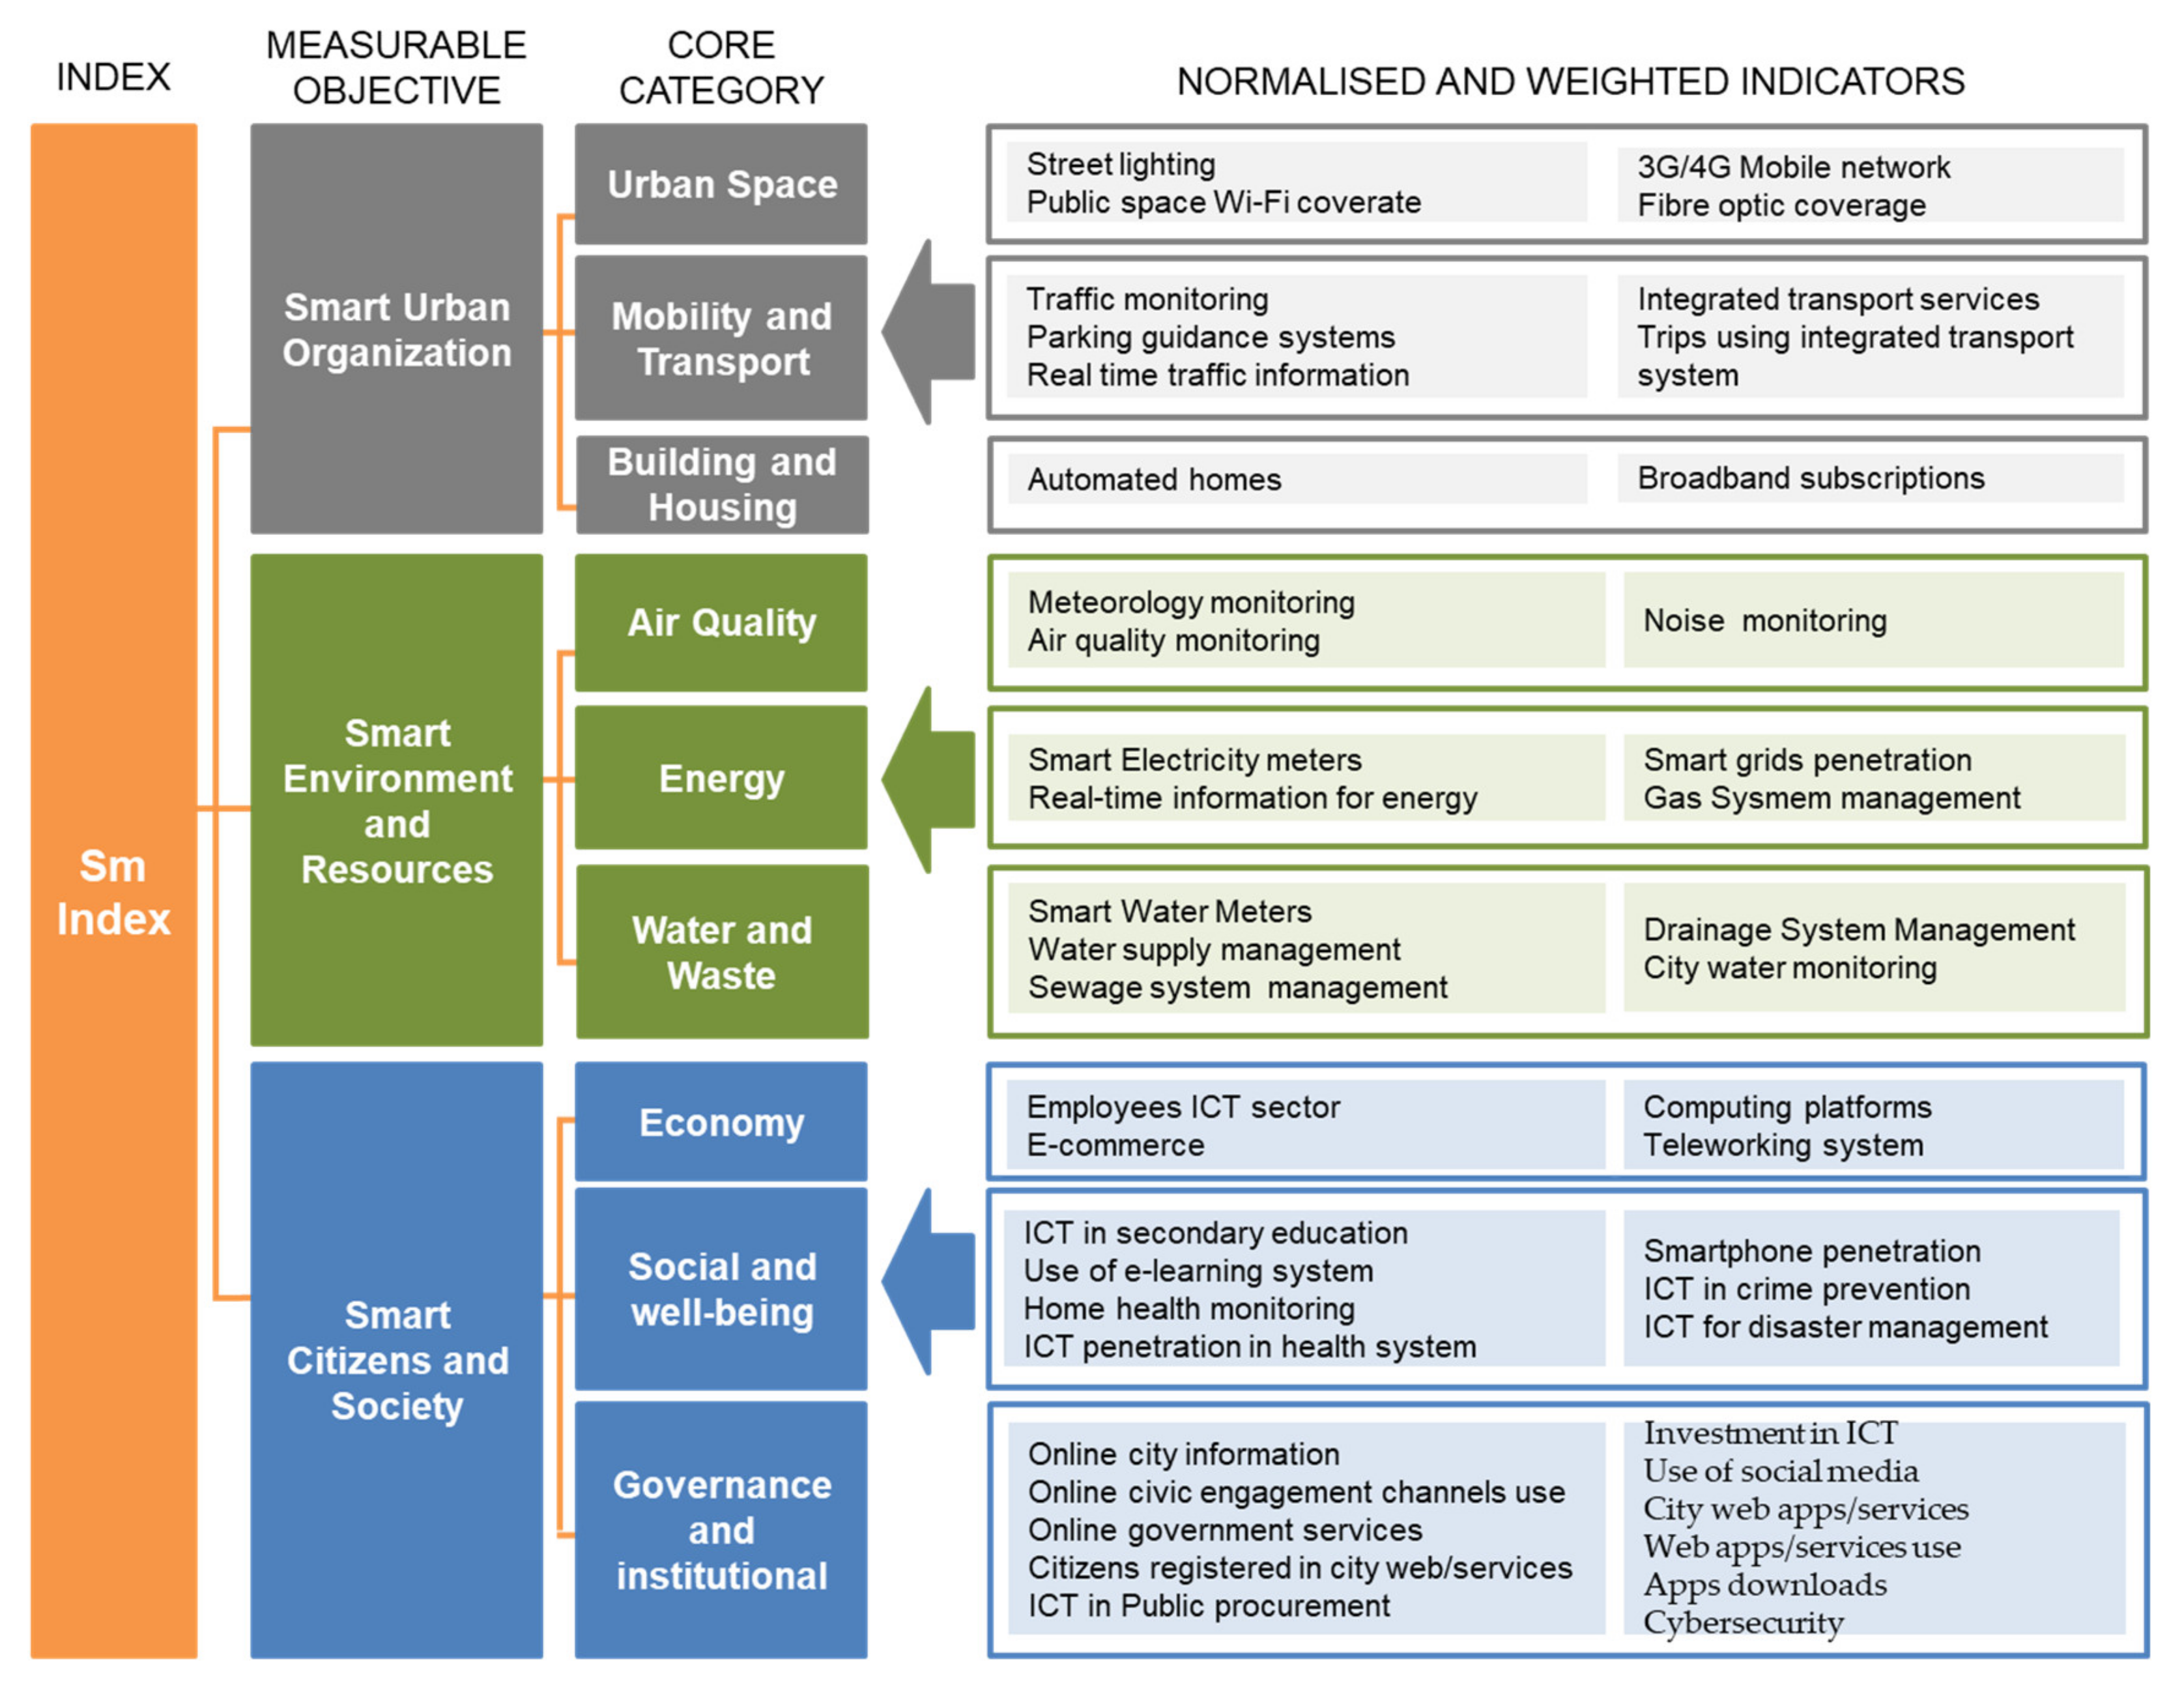
5.5. Calculation of the Indices
5.5.1. Normalization Process
5.5.2. Weighting Process
- Equal weights per indicator in each category: This methodology assumes that all the indicators have the same relevance within their category and the weights are distributed equally in each of the categories. This is the case of the core categories and measurable objectives weights.
- Relevance criteria for each indicator: The way in which indicators are weighted is based on the principle that recognised indicators should be weighted more than the other ones. Indicators are ranked following a relevance criteria which gives scores from 5 to 1 depending on the relevance of the source in which they are found, then based on the scores indicators are weighted as a percentage of importance within the same core category.
5.5.3. Aggregation Process
5.6. Evaluation of the Results
6. Evaluation of Sustainability and Smartness in Valladolid
7. Conclusions
Author Contributions
Funding
Acknowledgments
Conflicts of Interest
References
- Sustainable Development Solution Network. Indicators and a Monitoring Framework for the Sustainable Development Goals: Launching a Data Revolution for the SDGs. 2015. Available online: https://sustainabledevelopment.un.org/content/documents/2013150612-FINAL-SDSN-Indicator-Report1.pdf (accessed on 15 May 2020).
- United Nations Economic Commission for Europe (UNECE); International Telecommunications Union (ITU). Review of the Implementation of the Programme of Work 2014–2015 Sustainable Urban Development. In Proceedings of the Economic Commission for Europe Committee on Housing and Land Management Seventy-Sixth Session, Geneva, Switzerland, 14–15 December 2015. [Google Scholar]
- Marchettini, N.; Brebbia, C.A. How can cities lead the way into a sustainable, competitive, and smart future? In The Sustainable City IX: Urban Regeneration and Sustainability; WIT Press: Southampton, UK, 2014; Volume 2. [Google Scholar]
- Marín, P.; Marín, S. Sustainable Urban Models: Work Methodology and Results; CAT-MED: Change Mediterranean Metropolis Around Time; European Programmes Department, Malaga City Council, Urban Environment Observatory and Mediterranean Institute: Malaga, Spain, 2012. [Google Scholar]
- Available online: www.remourban.eu (accessed on 1 June 2020).
- Agencia de Ecologia Urbana de Barcelona. Plan Especial de Indicadores de Sostenibilidad Ambiental de la Actividad Urbanística de Sevilla; Agencia de Ecologia Urbana de Barcelona: Barcelona, Spain, 2006. [Google Scholar]
- Bosch, P.; Jongeneel, S.; Rover, V.; Neuman, H.M.; Airaksine, M.; Huovi, A. D1.4 Smart City KPIs and Related Methodology. CITYkeys Project. Co-funded by the European Commission within the H2020 Programme; Grant Agreement no: 646440. 2016. Available online: http://nws.eurocities.eu/MediaShell/media/D1.4-CITYkeys_D14_Smart_City_KPIs_Final_20160201.pdf (accessed on 25 May 2020).
- United Nations Economic Commission for Europe (UNECE); International Telecommunications Union (ITU). Draft New Recommendation ITU-T L.1603 (ex L.KPIs-SSC-SDGs) Key Performance Indicators for Smart Sustainable Cities to Assess the Achievement of Sustainable Development Goals; ITU: Geneva, Switzerland, 2016. [Google Scholar]
- Telecommunication Standardization Sector of International Telecommunications Union (ITU). Key Performance Indicators Related to the Use of Information and Communication Technology in Smart Sustainable Cities; ITU-T Focus Group on Smart Sustainable Cities (ITU): Geneva, Switzerland, 2015. [Google Scholar]
- Rademaekers, K.; Yearwood, Y.; Ferreira, A.; Pye, S.; Hamilton, I.; Agnolucci, P.; Grover, D.; Karásek, J.; Anisimova, N. Selecting Indicators to Measure Energy Poverty; DG Energy ENER/B3/2015-507—Under Framework Contract ENER/A4/516-2014; European Commission: Brussels, Belgium, 2014. [Google Scholar]
- International Organization for Standardization. ISO 37120:2014, Sustainable Development of Communities—Indicators for City Services and Quality of Life; ISO: Geneva, Switzerland, 2014. [Google Scholar]
- European Innovation Partnership on Smart Cities and Communities. Strategic Implementation Plan; EIP-SCC: Brussels, Belgium, 2013. [Google Scholar]
- Sharpe, A.; Andrews, B. An Assessment of Weighting Methodologies for Composite Indicators: The Case of the Index of Economic Well-Being; Centre for the Study of Living Standards: Ottawa, ON, Canada, 2012. [Google Scholar]
- Esty, D.C.; Andonov, B.; Kim, C.; Townsend, J.; Srebotnjak, T.; Campbell, K.; Li, Q.; Zhang, B.; Goodall, M.; Gregg, K.; et al. Environmental Sustainability Index: Benchmarking National Environmental Stewardship; Yale Center for Environmental Law and Policy: Washington, DC, USA, 2005. [Google Scholar]
- Focus Group on Smart Sustainable Cities (FG-SSC). Shaping Smarter and More Sustainable Cities: Striving for Sustainable Development Goals; ITU-T’s Technical Reports and Specifications; ITU: Geneva, Switzerland, 2016. [Google Scholar]
- World Commission on Environment and Development; UN. Report of the World Commission on Environment and Development: Our Common Future (Brundtland Commission’s Report); Oxford University Press: Oxford, UK, 1987. [Google Scholar]
- Organization for Economic Co-Operation and Development (OECD); Joint Research Centre (JRC) of the European Commission. Handbook on Constructing Composite Indicators: Methodology and User Guide; OECD: Paris, France; JRC: Ispra, Italy, 2008. [Google Scholar]
- IBM Institute for Business Value. How Smart is Your City? Helping Cities Measure Progress; IBM Institute for Business Value: New York, NY, USA, 2009. [Google Scholar]
- Kean Fong, W.; Sotos, M.; Doust, M.; Schultz, S.; Marques, A.; Deng-Beck, C. Protocol for Community-Scale Greenhouse Gas Emission Inventories; C40 Cities Climate Leadership Group, ICLEI—Local Governments for Sustainability; World Resources Institute: Washington, DC, USA, 2012. [Google Scholar]


| KPI | Unit | Definition | Source |
|---|---|---|---|
| Urban Compactness | Meters | Relation between the usable space of the buildings (volume) and the urban space (area) | Sustainable Urban Model [1] |
| Green Areas | Square meters per inhabitant | Extension of green zones in the city per inhabitant | Sustainable Urban Model [1] ISO 37120:2014 [2] CITYkeys [15] UN-SDG [16] |
| Mixed-Used Development | Square meters per inhabitant | Extension of recreational and commercial areas in the city per inhabitant | Self-defined. Based on Sustainable Urban Models [1] ISO 37120:2014 [2] CITYkeys [15] UN-SDG [16] |
| Occupied Dwellings | % | Percentage of occupied dwellings in the city | ISO 37120:2014 [2] |
| City Accessibility | % | Percentage of public transport and building accessible to disabled people | Self-defined |
| Informal Settlements Area | % | Size of informal settlements as a percentage of city area | ISO 37120:2014 [2] |
| Bike Route Network | % | Length of bicycles and path lanes in relation to the length of city streets | CITYkeys [15] |
| Average Journey Delay | % Minutes delay/vehicle-km | Average delay per vehicle and km by traffic congestion | CITYkeys [15] |
| Public Transport Infrastructure | km/100000 hab | Length of public transport infrastructure (high and light capacity) per inhabitant | ISO 37120:2014 [2] |
| EV (electro-vehicle) Penetration Rate | % | Percentage of EV over total number of vehicles | ITU-L1603 [8] |
| EV Public Charging Points | Number of EV public charging points per square kilometre | Public Charging Points for Electrical Vehicles over the city | Self-defined |
| EV kWh Recharged | Kilowatt hour in a period per 100000 inhabitants | Total kWh recharged by EV in the public EV charging points of the city | Self-defined |
| Sustainable Mobility Share | % | Public transport trips and EV trips per capita | Self-defined. Based on ISO 37120:2014 [2] |
| Average Building Energy Demand | Kilowatt hour per square meter | Average of energy demand of total buildings in the city | EN15643 [7] |
| Thermal Comfort | % | Percentage of number of hours per year inside comfort range in city buildings | ARQ-BIO [4] |
| Indoor Air Quality Comfort | - | Indoor Air Quality (IAQ), referred as the air quality within buildings | EN13779 [3] |
| Environmental Certified Buildings | % | Rate of environmental certified buildings in the city | ITU-L1603 [8] |
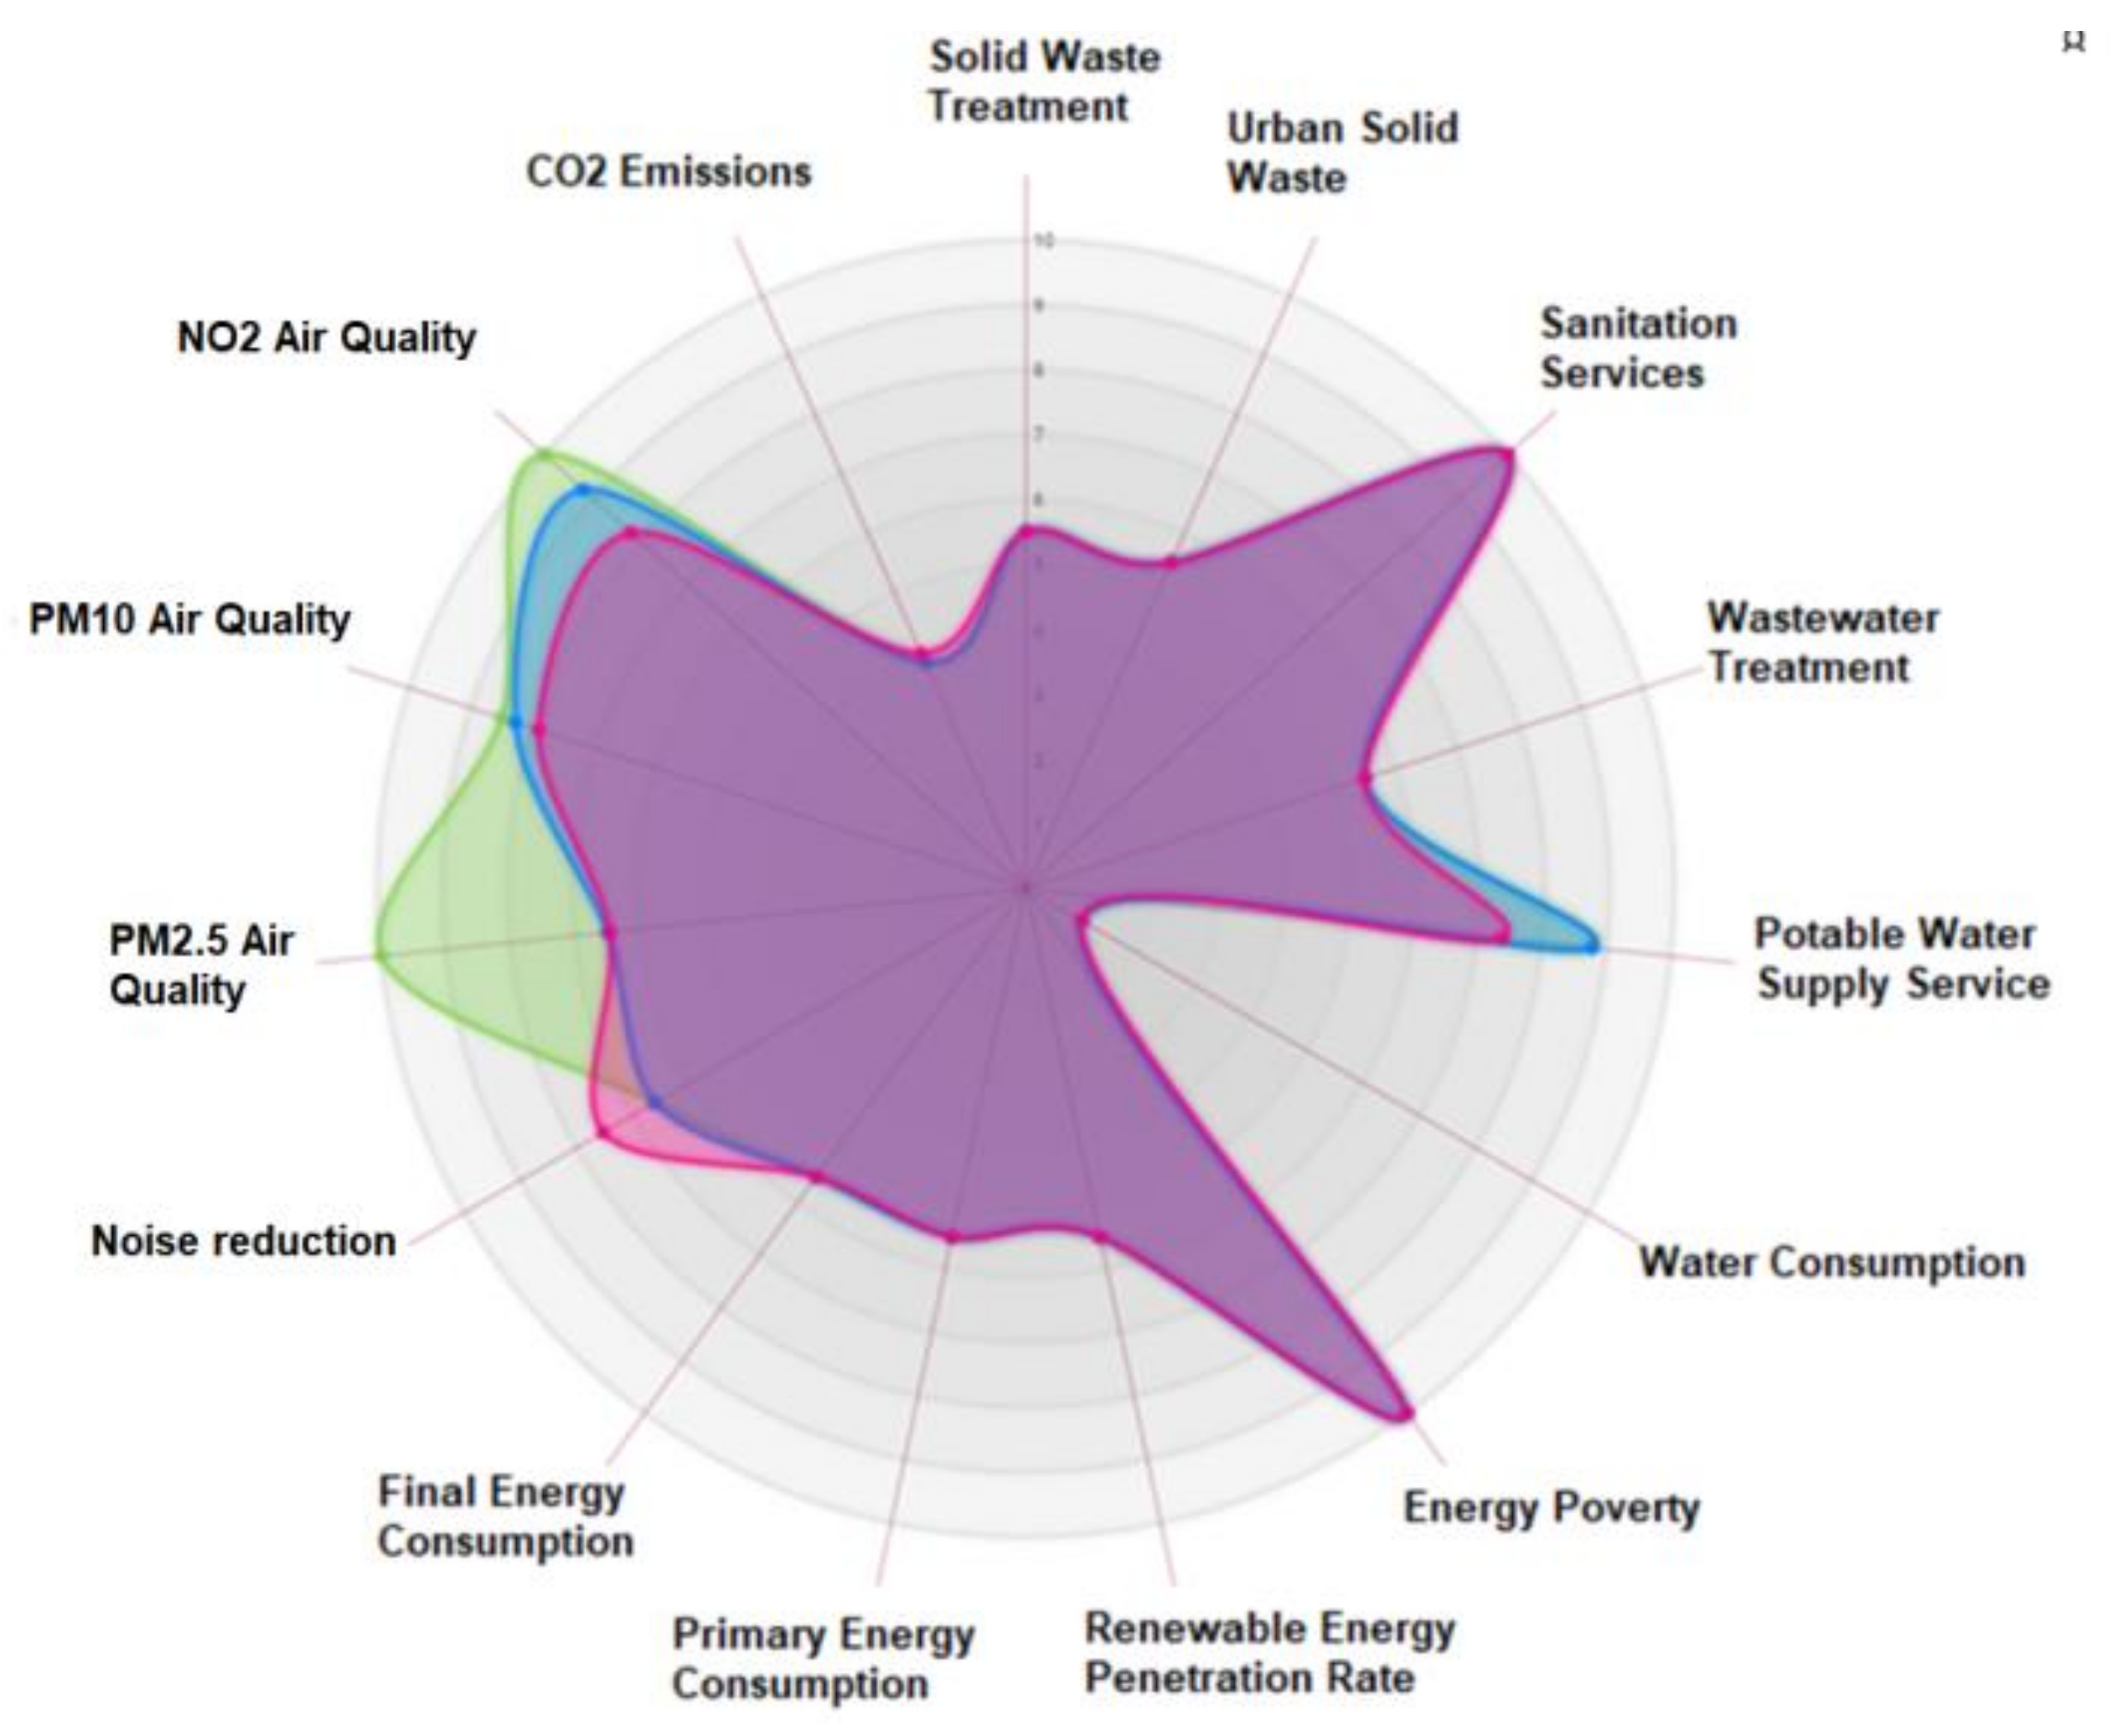
| KPI | Unit | Definition | Source |
|---|---|---|---|
| CO2 Emissions | Tonnes of CO2 per inhabitant | Annual tonnes of CO2 (and CO2 equivalent) emitted per inhabitant | ISO 37120:2014 [2], CITYkeys [15] |
| NO2 Air Quality | μg/m3 | Daily average of NO2 in the city | ISO 37120:2014 [2] |
| PM10 Air Quality | g/m3 | Daily average of particulate matter (PM10) in the city | ISO 37120:2014 [2] |
| PM2.5 Air Quality | g/m3 | Daily average of particulate matter (PM2.5) in the city | ISO 37120:2014 [2] |
| Noise Pollution | % | Rate of population in the city affected by noise pollution | ISO 37120:2014 [2] |
| Final Energy Consumption | Megawatt hour per inhabitant | Final energy consumption in the city | CITYkeys [15] |
| Primary Energy Consumption | Megawatt hour per inhabitant | Primary energy consumption in the city | Self-defined |
| Renewable Energy Penetration Rate | % | Percentage of total energy used generated by renewable sources within the city | CITYkeys [15], ISO 37120:2014 [2] |
| Energy Poverty | % | Percentage of households unable to afford basic energy services in the city | CITYkeys [15], IND-Epoverty [10] |
| Water Consumption | Litres per inhabitant per day | Daily average water consumption per capita | CITYkeys [15] ISO 37120:2014 [2], ITU-L1603 [8] |
| Potable Water Supply Service | % | Percentage of city population with potable water supply service | ISO 37120:2014 [2], ITU-L1603 [8] |
| Wastewater Treatment | % | Percentage of city’s wastewater connected to any wastewater treatment system | ISO 37120:2014 [2] |
| Sanitation services | % | Percentage of the households with access to improved sanitation services | ISO 37120:2014 [2] UN-SDG [16] ITU-L1603 [8] |
| Urban Solid Waste | Tonnes per inhabitant | Solid waste collected | ISO 37120:2014 [2], CITYkeys [15] |
| Solid Waste Treatment | % | Tonnes per inhabitant | ISO 37120:2014 [2], UN-SDG [16] ITU-L1603 [8] |
| KPI | Unit | Description | Source |
|---|---|---|---|
| Gross Domestic Product | € per inhabitant | City Gross Domestic Production per capita | CITYkeys [15] |
| Employment Rate | % | Employment rate | ISO 37120:2014 [2] UN-SDG [16] ITU-L1603 [8] |
| Disposable Income | € per inhabitant | Average money available for spending after taxes | CITYkeys [15] UN-SDG [16] |
| Population Living in Poverty | % | Percentage of people living below the poverty threshold | ISO 37120:2014 [2], UN-SDG [16]) |
| R&D Expenditure | € per inhabitant | R&D expenditure per capita in the city | ITU-L1603 [8] UN-SDG [16] |
| Labour Productivity | € per person employed | Labour productivity as the valued added per person employed | ITU-L1603 [8] UN-SDG [16] |
| Gender income equity | Dimensionless | Ratio of average hourly earnings of female and male employees | ITU-L1603 [8] UN-SDG [16] |
| New Businesses | Number of new businesses per 100000 inhabitants | Number of new businesses created in the city per 100,000 population | ISO 37120:2014 [2] |
| New Patents | Number of new patents per 100000 inhabitants | New patents per 100,000 population | ISO 37120:2014 [2] |
| Adult Literacy Rate | % | Percentage of literacy adults over the total population | ITU-L1603 [8] UN-SDG [16] |
| Secondary Education Completion Rate | % | Percentage of students who complete secondary education over total number of students originally enrolled in secondary education | ISO 37120:2014 [2], ITU-L1603 [8] UN-SDG [16] |
| Higher Education Degrees | Number of city inhabitants with high education degrees per 100000 inhabitants | Number of public universities in the city per 100,000 population | ISO 37120:2014 [2] ITU-L1603 [17] UN-SDG [16] |
| Access to Basic Health Care | % | Percentage of population with access to basic health care services | ITU-L1603 [8] UN-SDG [16] |
| In-patient Hospitals Beds | Number of in-patient hospital beds per 100000 inhabitants | Rate of in-patient hospital beds | ISO 37120:2014 [2] ITU-L1603 [8] |
| Emergency Service Response Time | Minutes and seconds | Average time to respond to emergency calls | ISO 37120:2014 [2] ITU-L1603 [8] |
| Population Dependency Ratio | % | Rate of Population Dependency in the city | CITYkeys [15] |
| Average Life Expectancy | Number of years of average lifetime | Average time an inhabitant is expected to live | ISO 37120:2014 [2] ITU-L1603 [8] |
| Suicide Rate | Number of deaths by suicide per 100000 inhabitants | Suicide rate per 100,000 population | ISO 37120:2014 [2] |
| Crime Rate | Number of reported crimes/100 000 population | Crime rate per 100,000 population | ISO 37120:2014 [2] CITYkeys [15] UN-SDG [16] |
| Internet Access Rate | % | Percentage of households with internet access | ISO 37120:2014 [2] CITYkeys [15] UN-SDG [16] ITU-L1603 [8] |
| Voter Participation | % | Voter participation level in the city | ISO 37120:2014 [2] CITYkeys [15] |
| Open Public Participation | Checklist | Promotion of inhabitants’ participation in public affairs | ITU-L1603 [8] |
| Innovative/Green Public Procurement | % | Percentage procurement using innovative and environmental criteria | CITYkeys [15] |
| Open Data | % | Percentage of available open data of cities | CITYkeys [15] ITU-L1603 [8] |
| Incentives to Promote Sustainable Actions | Number of incentives per period | Program of Incentives for Sustainable Development | Self-defined |
| Awareness Initiatives | Number of awareness initiatives per 100 inhabitants | Number of awareness initiatives | Self-defined |
| Investment in Smart Cities and Communities Projects | Million € | Investment in Smart Sustainable City Projects | Self-defined |
| Climate Resilience Strategy | - | Resilience strategy in cities | CITYkeys [15] UN-SDG [16] |
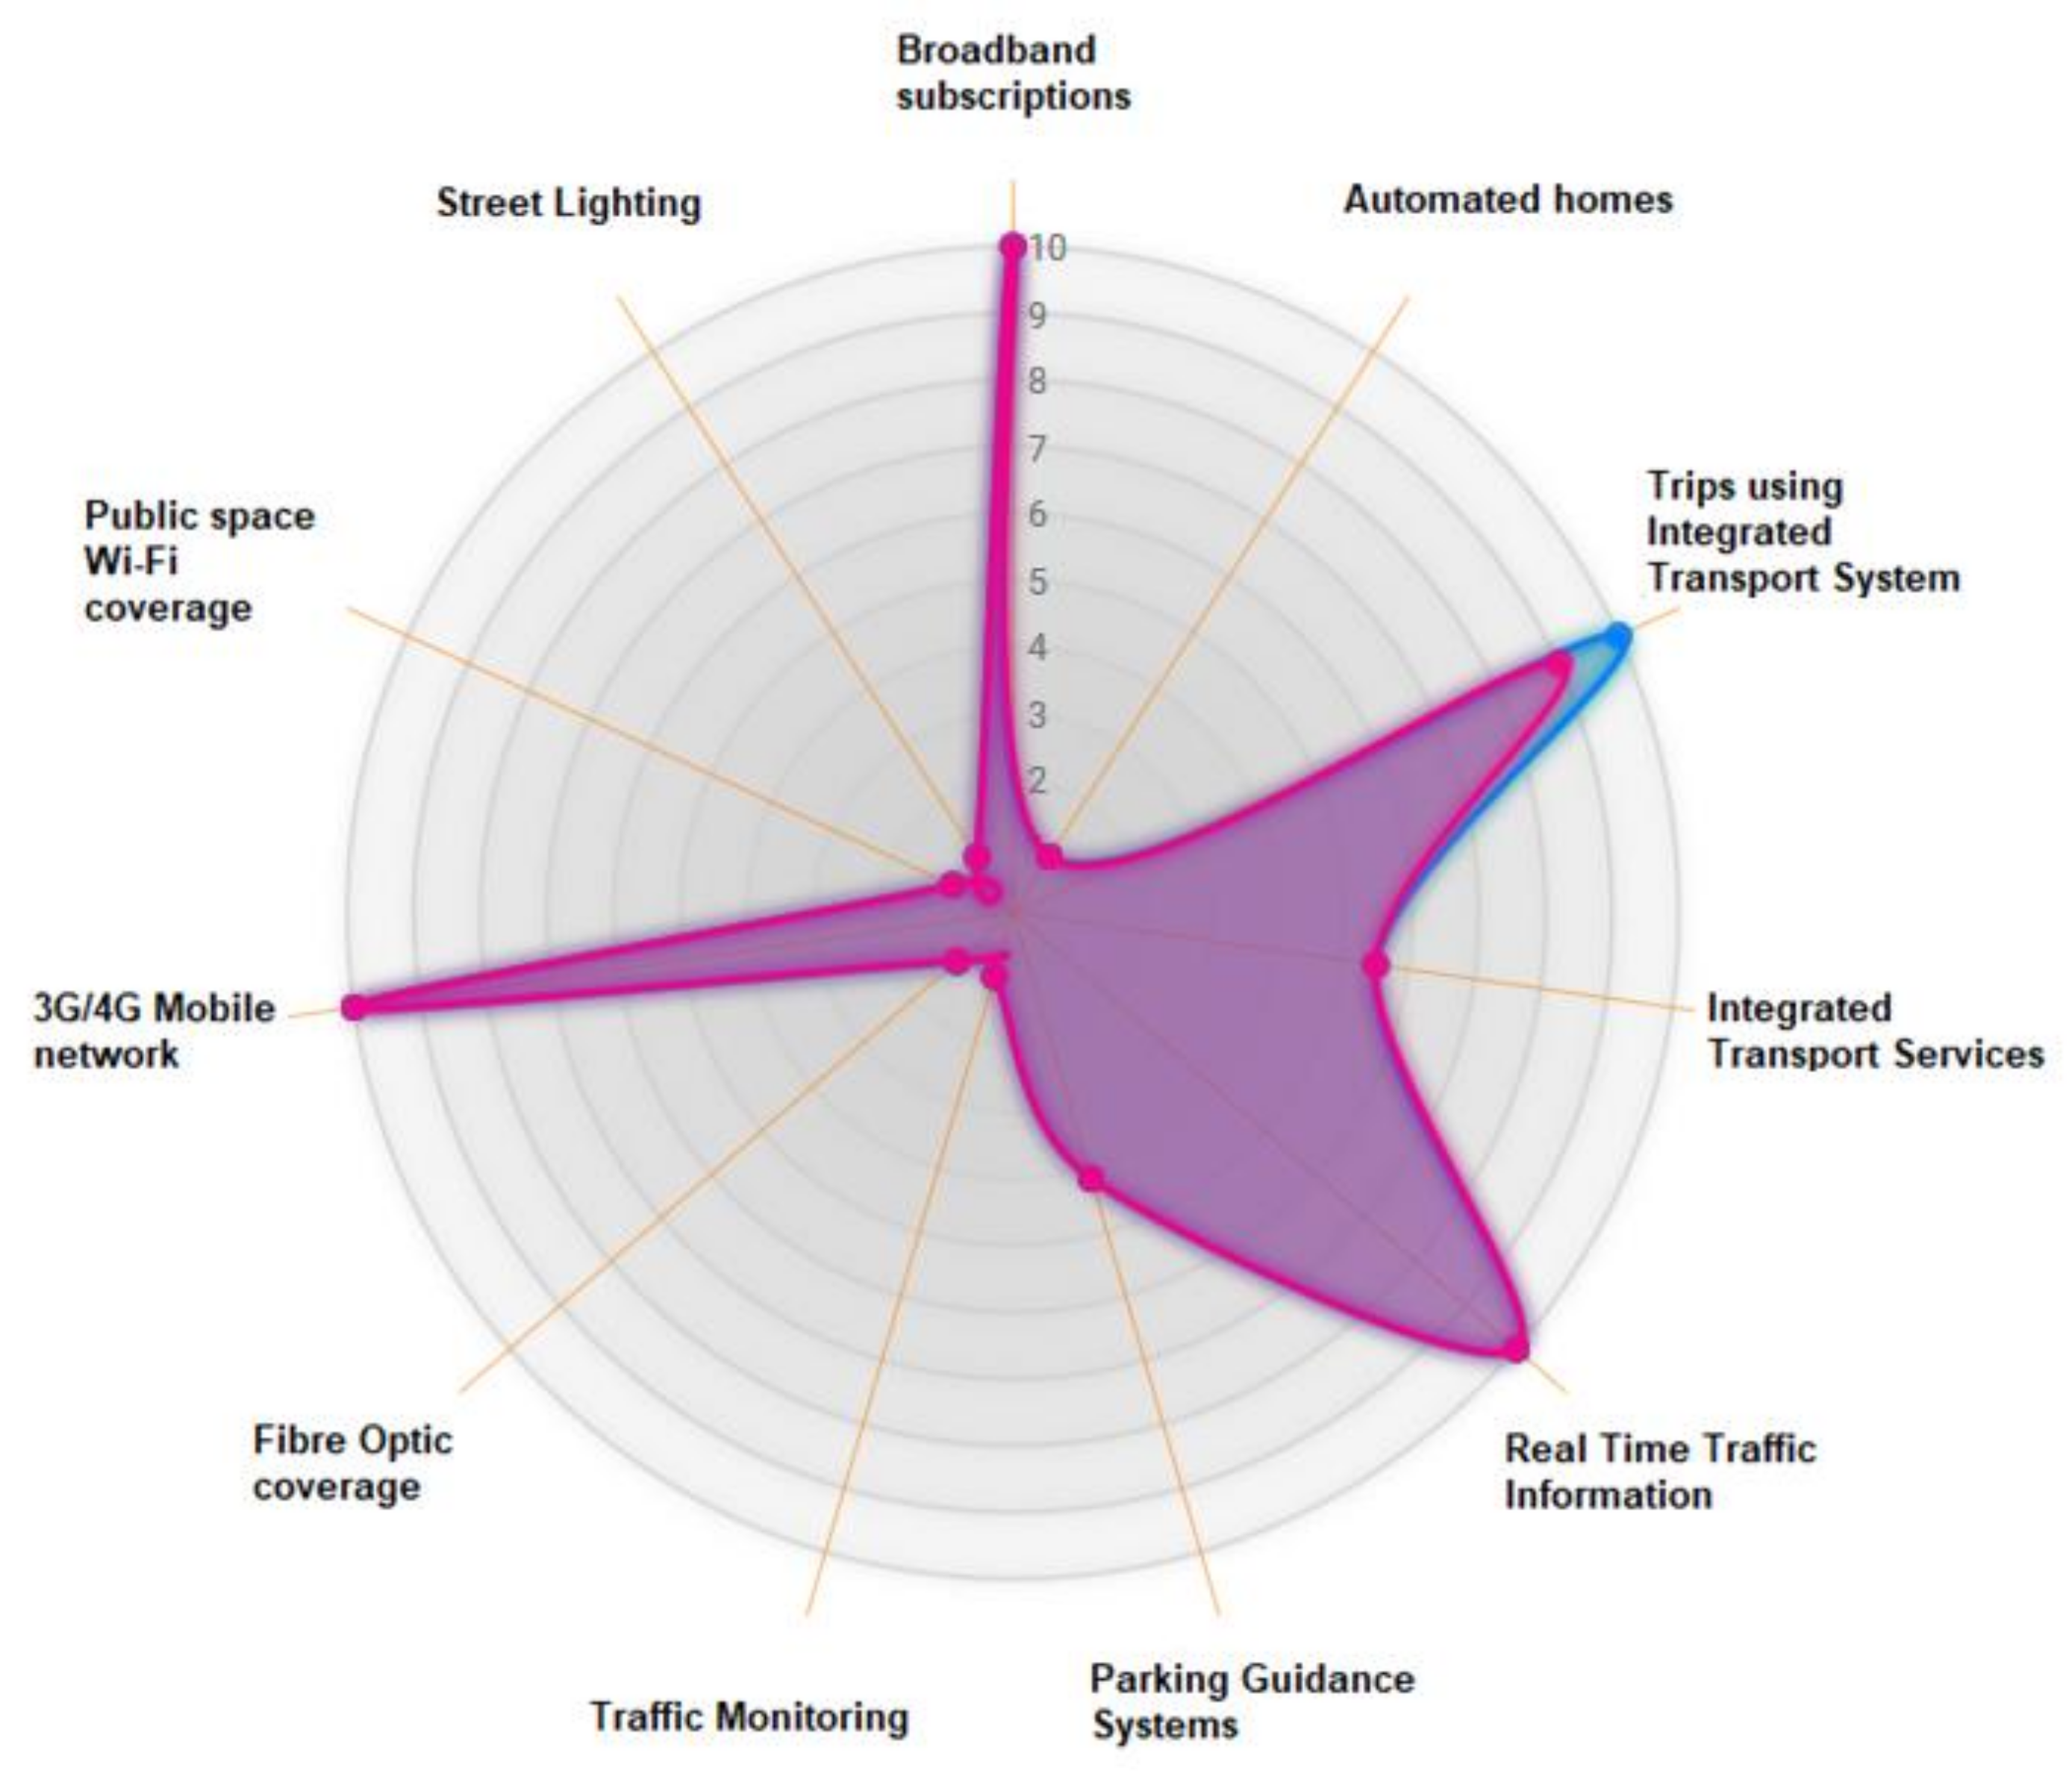
| KPI | Unit | Definition | Source |
|---|---|---|---|
| Street lighting | % | Street lighting management using ICT | ICT-ITU [18] |
| Public space WiFi Coverage | % | Percentage of Public Space with free access to wireless local area network (Wi-Fi) | CITYkeys [15] |
| 3G/4G Mobile network | % | Percentage of the city covered by at least a 3G mobile network | Self-defined |
| Fibre optic coverage | % | Fibre optic coverage in the city | Self-defined |
| Traffic monitoring | % | Availability of traffic monitoring using ICT | ICT-ITU [18] |
| Parking guidance systems | % | Availability of parking guidance systems | ICT-ITU [18] |
| Real-time traffic information | % | Availability of real-time traffic information | ICT-ITU [18] |
| Integrated transport services | Dimensionless | Number of different modes of public transport integrated in a smart card | Self-defined. Based on SMCITY-IND [6] |
| Trips using integrated transport system | % | Number of trips made using the integrated system for public transport | Self-defined |
| Automated homes | % | Percentage of automated dwellings in the city | Self-defined. Based on KPI-ITU [19] |
| Broadband subscriptions | Number of broadband subscriptions per 100 inhabitants | Availability of broadband subscriptions | ICT-ITU [18] |
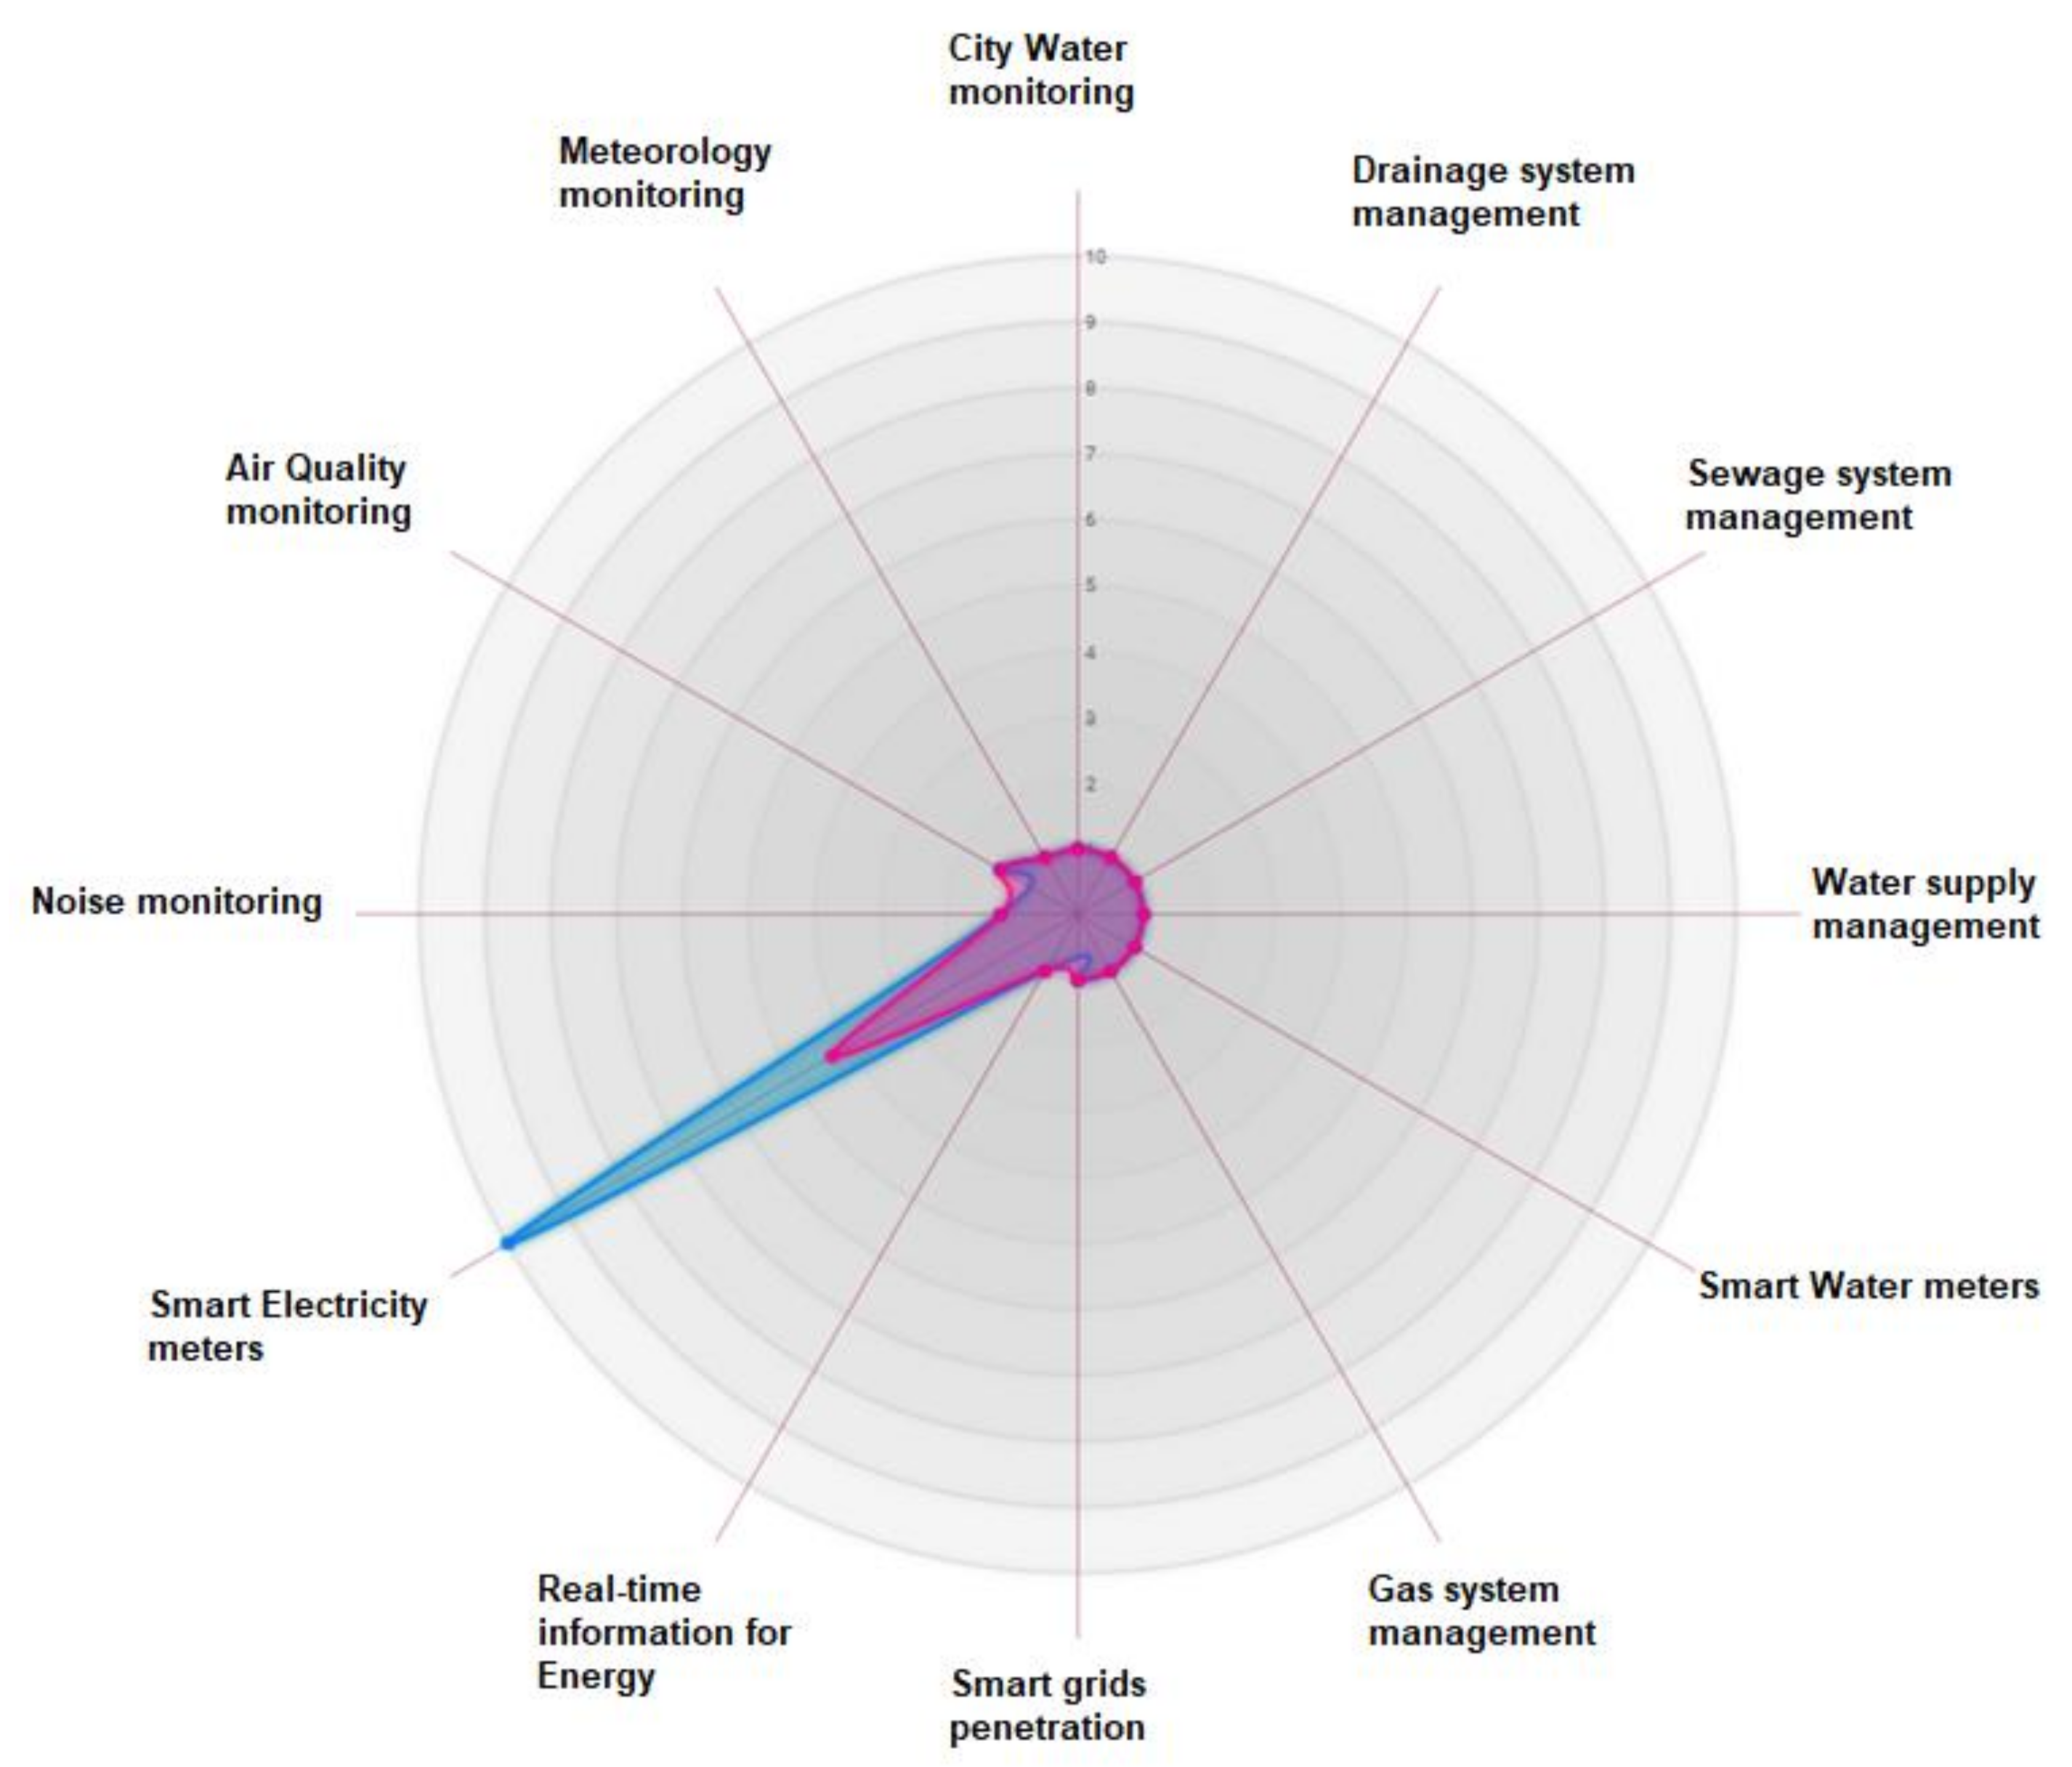
| KPI | Unit | Definition | Source |
|---|---|---|---|
| Meteorology monitoring | Number of ICT weather monitoring stations per square kilometre | Application of ICT based monitoring system for weather stations | Self-defined |
| Air quality monitoring | Number of ICT air quality monitoring stations per square kilometre | Application of ICT based monitoring system for air pollutants | ICT-ITU [18] |
| Noise monitoring | Number of ICT noise monitoring stations per square kilometre | Application of ICT based noise monitoring | ICT-ITU [18] |
| Smart electricity meters | % | Availability of smart electricity meters | ICT-ITU [18] |
| Real-time information for energy | % | Proportion of households provided with energy real-time information system | Self-defined |
| Smart grids penetration | % | Percentage of total energy demand served by advanced meters | SMCITY-IND [6] ICT-ITU [18] |
| Gas system management | % | Gas system management using ICT | ICT-ITU [18] |
| Smart water meters | % | Availability of smart water meters | ICT-ITU [18] |
| Water supply management | % | Water supply system management using ICT | ICT-ITU [18] |
| Sewage system management | % | Sewage system management using ICT | ICT-ITU [18] |
| Drainage system management | % | Drainage system management using ICT | ICT-ITU [18] |
| City water monitoring | % | Application of city water monitoring through ICT | ICT-ITU [18] |
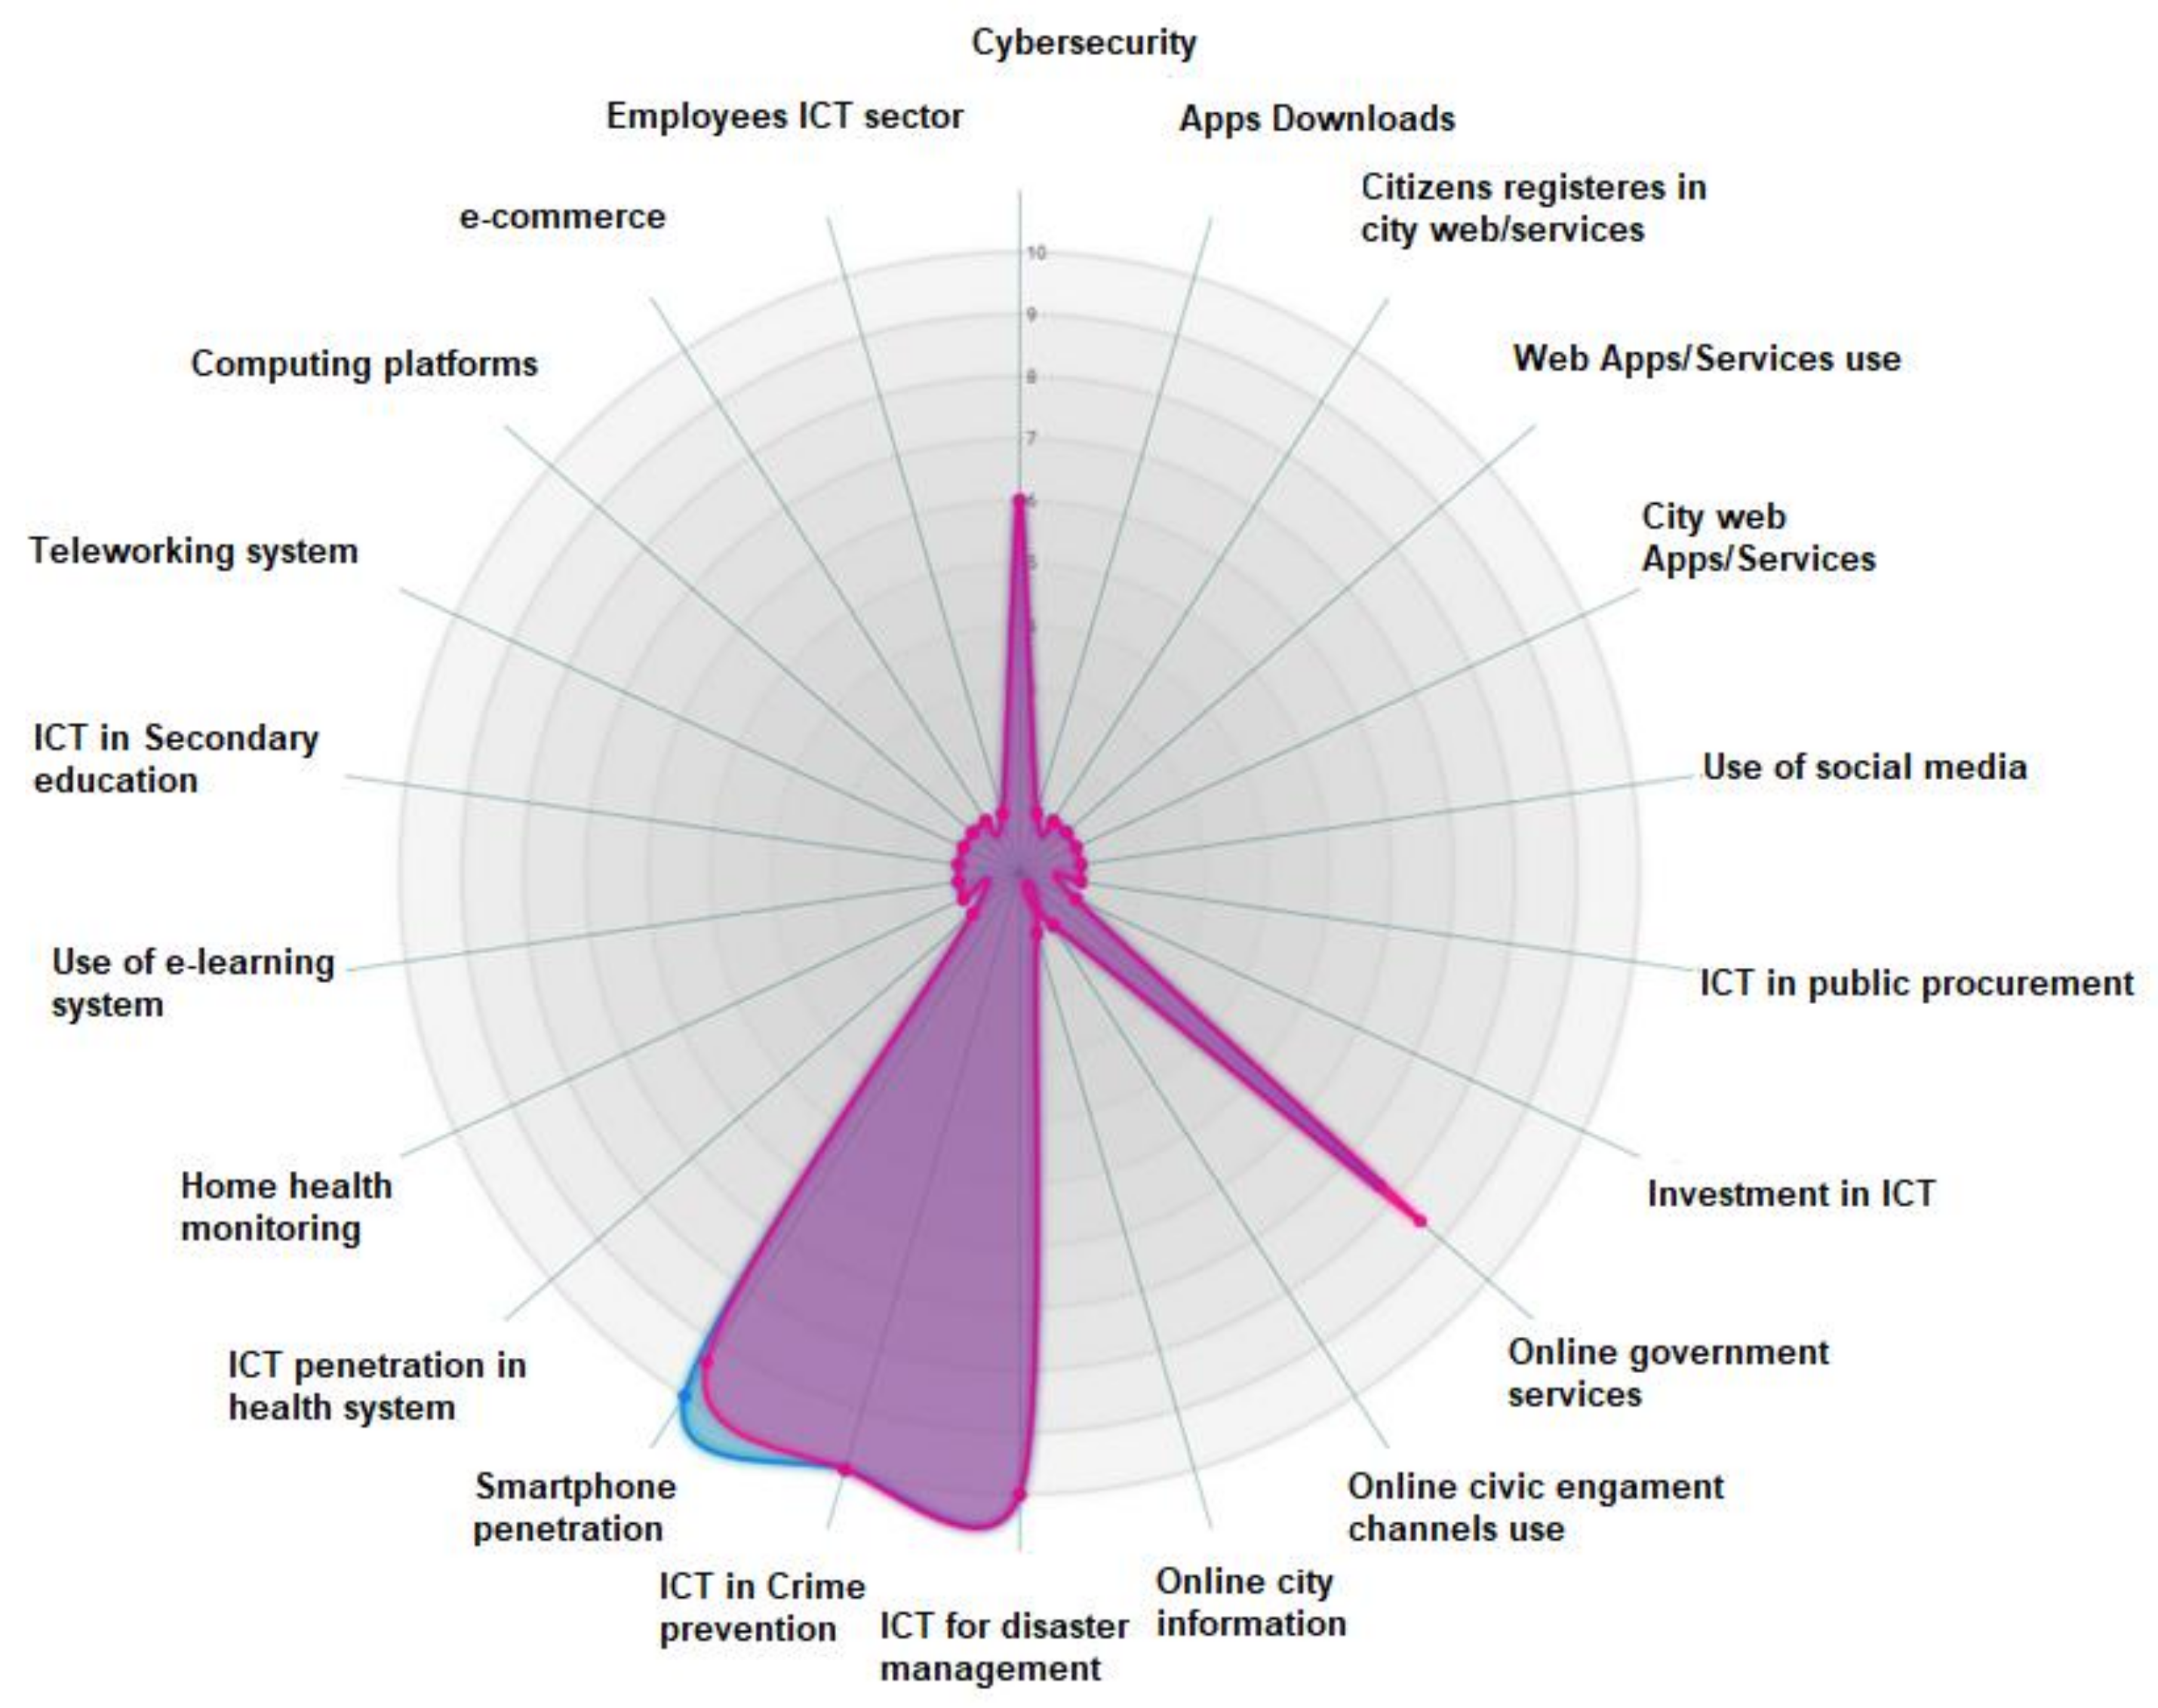
| KPI | Unit | Definition | Source |
|---|---|---|---|
| Employees ICT Sector | % | Employees belonging to ICT sector | ICT-ITU [18] |
| E-commerce | Number of transaction per 100 inhabitants | Application of e-commerce transactions | ITU-L1603 [8] ICT-ITU [18] |
| Computing Platforms | % | Application of computing platforms | ICT-ITU [18] |
| Teleworking System | Number of people using teleworking system per 1000 workers | Penetration of teleworking system | ICT-ITU [18] |
| ICT in Secondary Education | % | Application of ICT in secondary education | ITU-L1603 [8] UN-SDG [16] |
| Use of e-learning System | % | Use of e-learning system | ICT-ITU [18] |
| Home Health Monitoring | % | Percentage of patients with Home Health Monitoring Systems | Self-defined |
| ICT Penetration in Health System | % | Percentage of hospitals using ICT based Health Monitoring Systems | Self-defined |
| Smartphone Penetration | % | Availability of Smartphones in households | ITU-L1603 [8] |
| ICT in Crime Prevention | YES/NO | Availability of ICT based systems to prevent crime in the city | SMCITY-IND [6] |
| ICT for Disaster Management | YES/NO | Availability of ICT based systems to manage disasters | Self-defined |
| Online City Information | % | Availability of online city information and feedback mechanisms | ICT-ITU [18] |
| Online Civic Engagement Channels Use | % | Online civic engagement | ICT-ITU [18] |
| Online Government Services | % | Percentage of government services that can be accessed via web | Self-defined |
| Investment in ICT | % | Amount of city investments in ICT issues | ICT-ITU [18] |
| ICT in Public Procurement | % | Availability of ICT systems in Public Procurement purchases | Self-defined |
| Use of Social Media | Number of municipality links in social media channels per 100 inhabitants | Total number of municipality links in social media channels | ICT-ITU [18] |
| City Web Apps/Services | Number of government city apps/services per 100 inhabitants | Number of government web applications/services | Self-defined |
| Web Apps/Services Use | Number of visits of city app/services per 100,000 inhabitants | Number of visits to government applications for city services | Self-defined |
| Citizens Registered in City Web/Services | % | Percentage of citizens registered in government applications | Self-defined |
| Apps Downloads | % | Percentage of apps downloads | Self-defined |
© 2020 by the authors. Licensee MDPI, Basel, Switzerland. This article is an open access article distributed under the terms and conditions of the Creative Commons Attribution (CC BY) license (http://creativecommons.org/licenses/by/4.0/).
Share and Cite
Antolín, J.; de Torre, C.; García-Fuentes, M.Á.; Pérez, A.; Tomé, I.; Mirantes, M.L.; Hoyos, E. Development of an Evaluation Framework for Smartness and Sustainability in Cities. Sustainability 2020, 12, 5193. https://doi.org/10.3390/su12125193
Antolín J, de Torre C, García-Fuentes MÁ, Pérez A, Tomé I, Mirantes ML, Hoyos E. Development of an Evaluation Framework for Smartness and Sustainability in Cities. Sustainability. 2020; 12(12):5193. https://doi.org/10.3390/su12125193
Chicago/Turabian StyleAntolín, Javier, Cristina de Torre, Miguel Á. García-Fuentes, Ana Pérez, Isabel Tomé, María L. Mirantes, and Elena Hoyos. 2020. "Development of an Evaluation Framework for Smartness and Sustainability in Cities" Sustainability 12, no. 12: 5193. https://doi.org/10.3390/su12125193
APA StyleAntolín, J., de Torre, C., García-Fuentes, M. Á., Pérez, A., Tomé, I., Mirantes, M. L., & Hoyos, E. (2020). Development of an Evaluation Framework for Smartness and Sustainability in Cities. Sustainability, 12(12), 5193. https://doi.org/10.3390/su12125193