Article

Optimal Operation of Multi-Carrier Energy Networks Considering Uncertain Parameters and Thermal Energy Storage

by
Morteza Nazari-Heris
1,2,
Behnam Mohammadi-Ivatloo
1,3,* and
Somayeh Asadi
2
1
Faculty of Electrical and Computer Engineering, University of Tabriz, Tabriz 5166616471, Iran; [email protected]
2
Department of Architectural Engineering, Pennsylvania State University,104 Engineering Unit A, State College, PA 16802, USA; [email protected]
3
Institute of Research and Development, Duy Tan University, Da Nang 550000, Vietnam
*
Author to whom correspondence should be addressed.
Sustainability 2020, 12(12), 5158; https://doi.org/10.3390/su12125158
Submission received: 19 May 2020 / Revised: 11 June 2020 / Accepted: 13 June 2020 / Published: 24 June 2020
(This article belongs to the Special Issue Energy Storage Technologies in Future Energy Systems)

Abstract

:
The coordination of energy carriers in energy systems has significant benefits in enhancing the flexibility, efficiency, and sustainability characteristics of energy networks. These benefits are of great importance for multi-carrier energy networks due to the complexity of obtaining optimal dispatch, considering the non-convex nature of their energy conversion. The current study proposes a robust operation model for the coordination of multi-carrier systems, including electricity, gas, heat, and water carriers concerning thermal energy storage technology. Thermal energy storage is for storing extra heat generated by combined heat and power (CHP) plants and boilers in time intervals with low heat demand on the system and discharging it when required. Energy network operators should have the capability to manage uncertain energy loads to study the impact of load variation on the decision-making process in network operation. Accordingly, this study employs an information gap decision theory (IGDT) method to model the uncertainty of the power demand in optimal system operation. By applying the IGDT approach, the operator of the energy system can use the appropriate methodology to obtain a robust optimal operation. Such a modeling approach helps the operator to make suitable decisions about probable variations in power load. The introduced model is applied in a test system for evaluating the performance and effectiveness of the introduced scheme.

1. Introduction

In 2013, Presidential Policy Directive 21 (PPD-21) introduced the energy section as a critical element, considering its role in supplying necessary functions across all fundamental infrastructures. The importance and complexity of the interdependencies between energy carriers have long been established. As there are untapped synergies and complementary characteristics of different energy carriers, these energy networks are physically interconnected and they can be studied as an integrated network. However, energy networks have been studied with de-coupled characteristics in traditional models from both planning and operational perspectives, and only narrow interactions among energy networks have been considered in recent studies. The integration of energy systems has a positive impact on high efficiency rates and minimizing operating costs. Combined heat and power (CHP) plants can produce heat and power, simultaneously, and increase the power and heat supply efficiency to up to 90%. CHP plants can also reduce the emissions of pollutant gases by almost 13–18%. Obtaining optimal operating setpoints of the generation plants in energy systems is of great importance and has been studied in several studies [1,2,3].
Recent literature in the area of integrated energy networks can be divided into two categories. First, researchers have investigated the role of disruptions and uncertainties in integrated networks. Some studies have introduced security-constrained models for gas and power networks to investigate the influence of interruptions in gas/power systems [4,5] or robust models to analyze the adjustment of the power load considering uncertainties associated with the power output of renewable energy sources [6,7]. In [8], a unit commitment (UC) is presented for CHP networks and district heating networks (DHN) in existing CHP plants, where the effect of heat storage is evaluated. A risk investigation of integrated heat and power networks is performed to determine the uncertainties of power market price and wind power output in [9]. In [10], the authors have used the robust model to evaluate the uncertainty of load on the scheduling of multi-chiller systems, where a day-ahead scheduling scheme is proposed to satisfy the cooling load. In [11], an optimal robust energy management scheme for such systems has been introduced to handle the uncertain parameters of the problem, including the market price and the load of the system.
In other work, researchers concentrated on studying the beneficial/environmental challenges in integrated networks. In integrated gas and power networks, some studies have proposed bi-level programming to deal with the benefits of gas/power systems in one of the levels [12,13,14]. A bi-level framework is presented in [12], where the upper/lower levels have focused on handling the constraints of power and gas systems. In [13], the researchers considered two conflicting aims for the operation of power and gas systems, including reductions in cost and pollutant gas emission. A bi-level model that studies the planning and operation of such networks in upper/lower levels has been proposed in [14]. The authors in [15] have proposed a robust model for dealing with the uncertainty of power market prices when managing CHP networks. A bi-level model for these systems is presented in [16] to maximize the benefit for operators/CHP owners in the upper/lower levels. In [17], a deterministic network-constrained optimal generation schedule of integrated heat and power systems is investigated. The authors in [18] have proposed a methodological scheme for investigating multi-carrier energy grid designs systematically by involving stakeholders and technical and economic viewpoints. The effect of storage capacity and prediction horizon on the operation cost of these systems is analyzed for a single-family house and a system of houses in [19].
The authors have proposed a steady-state energy flow for multi-carrier networks, including integrated power and gas systems in [20]; interconnected power and heating systems in [21]; and combined power, gas, and heating systems in [22]. An approximated flow scheme is proposed in [23] to obtain the optimal setpoints of the energy system units. The characteristics and advantages of the energy hub concept, which is only capable of handling energy hubs with the same number of inputs and outputs, and the solution to optimal energy flow in multi-carrier systems are studied in [24]. To overcome the shortage of such methods in handling irregular equations in the optimal operation of the multi-carrier system, the authors have presented a scheme using dummy variables and virtual units in [25], which also causes a complex optimization problem due to the additional variables and various complementary constraints. In [26,27], a novel methodology based on the suitable set selection of state-variables for the optimal operation of such a system is proposed with the ability to stop the increase in new variables when converting irregular equations into regular equations. The authors implemented an information gap decision theory (IGDT)-based uncertainty-handling method to handle load uncertainty in the optimal operation of an energy hub with batteries, photovoltaic cells, and fuel cells in [28]. The authors in [29] proposed a multi-objective scheme for the two-stage optimal operation of combined power and gas systems with emerging technologies, such as power to gas plants and demand-side management.
Table 1 compares the contributions of the presented robust operation model with models from the literature. To the best knowledge of the authors, none of the studied papers have investigated an uncertainty study of multi-carrier networks with gas, power heating, and water energy carriers using a robust model. The main drawbacks of the reviewed studies are that a robust operation model for systems with all of these carriers is not accomplished and the performance of the whole network is not studied. This study presents an IGDT-based robust operation model for multi-carrier energy networks that considers the role of thermal storage facilities in managing the heat generation schedule of the CHP plant, and the heat load supply of the system is investigated. By using the proposed robust model, the energy network operator should be able to manage the uncertain electrical energy load. Therefore, the IGDT approach is applied in this paper to model the uncertainty of the power demand in multi-carrier networks based on opportunity and robustness functions. The introduced robust model has been implemented in test multi-carrier networks for the evaluation of the performance of the presented scheme.

2. Materials and Methods

The framework of the presented robust scheduling of the multi-carrier energy systems is demonstrated in Figure 1, which is based on using the IGDT approach to deal with the uncertainty of the power load. The presented model is for a system with gas, power, heat, and water demands, for which a case study will be selected for evaluating the presented model. The main methodology of the proposed model is considering the uncertainty of power load when scheduling the generation of plants and the charge/discharge operation of the storage units based on the IGDT method. Hence, the total minimized operation cost of the whole energy system based on the optimal set points of the units will be determined. The problem formulation of the system operation in deterministic conditions and with an uncertain status is provided in this section using the IGDT approach.

2.1. Objective Function

The objective of the optimal operation of multi-carrier networks considering power, gas, heat, and water carriers is minimizing the total cost of the supplying energy loads, which is formulated in (1). The first and second terms of (1) are the operation cost of non-gas-fired units considering power supply and start/shut-down and the purchased gas cost from suppliers. The operation cost of the gas storage is given as the third term of (1). It is worth mentioning that the operation cost of gas-fueled units is considered in the second term of (1), since they consume gas to produce electrical energy. Nomenclature is given in Table A1.
O = M i n t = 1 T [ n = 1 N E [ F ( P n , t ) + S U n , t + S D n , t ] + g = 1 N G W ρ g a s G W g , t + g s = 1 N G S C s G S g s , t o u t ]

2.2. Power Network Constraints

The unit commitment constraints of the generation units in the multi-carrier network are discussed in this sub-section. The CHP plant has been considered for supplying power and heat demands, for which the generated heat and power have a mutual dependency, known as the feasible operation region (FOR), as demonstrated in Figure 2. Linear equations of the FOR of the CHP plant are used to limit the generated power and heat by the CHP plant [31].
P n min I n , t P n , t P n max I n , t
P n , t P n A P n A P n B H n A H n B × ( H n , t H n A ) 0   n N C
P n , t P n B P n B P n C H n B H n C × ( H n , t H n B ) ( 1 I n , t ) × M   n N C
P n , t P n C P n C P n D H n C H n D × ( H n , t H n C ) ( 1 I n , t ) × M   n N C
0 H n , t H n A × I n , t   n N C .
To consider the ramp rates of the power generation plants, the ramp-up/down limitations are studied as (8) and (9). Additionally, the minimum up/down-time constraints of the plants are considered as (10) and (11).
P n , t P n , t 1 R n u p
P n , t 1 P n , t R n d n
I i , t I i , t 1 I i , t + T U i , u
T U i , u = { u u M U T i 0 u > M U T i
I i , t 1 I i , t 1 I i , t + T D i , u
T D i , u = { u u M D T i 0 u > M D T i
The start-up/shut-down costs of the plants, which should be considered for both gas-fueled and non-gas-fueled plants, are studied in the model. Such costs for the non-gas-fueled units are as (14)–(15), and the costs for gas-fired plants are as (16) and (17).
S U n , t s u n ( I n , t I n , t 1 )   n N E
S D n , t s d n ( I n , t 1 I n , t )   n N E
S U G n , t s u g n ( I n , t I n , t 1 )   n N G C
S D G n , t s d g n ( I n , t 1 I n , t )   n N G C
The power balance of the multi-carrier system should be considered for ensuring the balance between the power generation of the CHP plant and conventional power generation systems as well as the power load of the system. Such balance can be formulated as (18). Moreover, the power transmission losses and the limitations of power flow through the system can be presented as (19) and (20), respectively.
n = 1 N U b P n , t + e = 1 N E S b ( P e , t D P e , t C ) + w f = 1 N W f b P w f , t j = 1 N J b D j , t = L = 1 N L b P F L , t
P F L , t = δ b , t δ b , t x L
P F L max P F L , t P F L max

2.3. Gas System Constraints

The flow of gas through the gas pipelines with and without considering compressors can be formulated as (21)–(22) and (23), respectively. As is observable from these equations, the gas pipeline stream capacity will be improved using a compressor in the gas system. Equations (24) and (25) limit the gas pressure at each gas node and the gas load of suppliers, respectively. The minimum and maximum limits of the gas loads and the gas balance are denoted by (26) and (27), respectively [32].
F p l , t = sgn ( π m , t , π n , t ) C m , n | π m , t 2 π n , t 2 |
sgn ( π m , t , π n , t ) = { 1 π m , t π n , t 1 π m , t π n , t
F p l , t sgn ( π m , t , π n , t ) C m , n | π m , t 2 π n , t 2 |
π m min π m , t π m max
G W g min G W g , t G W g max
G L l min G L l , t G L l max
g = 1 N G W m G W g , t + g s = 1 N G S m ( G S g s , t o u t G S g s , t i n ) g l = 1 N G L m G L g l , t = p l = 1 N P L m F p l , t

2.4. Thermal Storage Constraint

The studied multi-carrier energy system has considered thermal energy storage technology for investigating the possibility of storing thermal energy at some time intervals, and consuming it when required. The heat stored in the thermal energy storage can be formulated as (28) considering the thermal charge/discharge rates at each time and their associated efficiency, as well as the thermal losses of the storage and the latest level of thermal energy stored in the storage. The minimum and maximum capacities of the thermal energy storage system should be considered for the system (29). The rate of thermal energy charge and discharge should be limited to their maximum values as (30) and (31), respectively [33].
B h s , t = ( 1 η h s ) B h s , t 1 + η h s c h H S h s , t c h H S h s , t d i s η h s d i s β loss S U h s , t + β gain S D h s , t
B h s Min B h s , t , s B h s Max
B h s , t B h s , t 1 B h s Max , charge
B h s , t 1 B h s , t B h s Max , discharge

2.5. Systems Interconnection Constraints

The gas usage of each CHP is a function of the generated power and heat that can be stated as (32). Similarly, the gas usage of the power-only unit is associated with the electrical energy generated by the plant, which can be stated as (33). The value of the gas supply in providing plants’ fuel is a demand for the gas system (34). CHP, G1, and G2 are the demands of the gas system, as (35)–(36).
F n , t C H P = c n + b n P n , t + a n ( P n , t ) 2 + d n H n , t + e n ( H n , t ) 2 + f n H n , t P n , t + S U G n , t + S D G n , t   n N C
F n , t G = c n + b n P n , t + a n ( P n , t ) 2 + S U G n , t + S D G n , t   n N G
F e , t = H R e P e , t D
G L g l , t = F i , t C H P g l = i , , N C
G L g l , t = F i , t G g l = i , , N G
Water desalination is added to the studied system to provide water demand. Such a system interconnects the water carrier to the power network by using electrical energy to generate drinkable water. The power usage of the water stated desalination system can be formulated based on the water supply and efficiency as follows:
P d e s a , t = Q d e s a , t × η d e s a
The power usage of the in providing the water load of the network includes the power used by the desalination plant, water well pump, and water source pump, which can be represented by:
P w a t e r , t = P d e s a , t + P p u , w , t + P p u , s t , t
The water generated by the desalination system should satisfy the water demand of the whole system.
W L t = W d e s a , t

3. Optimal Operation of the System Based on IGDT

3.1. Modeling of the Uncertainty

A fractional info-gap uncertainty modeling is performed as (40) for studying the uncertainty parameter in the multi-carrier energy networks, which is considered as the power load [34].
U ( α , | l ˜ m , h | ) = { l m , h : l m . h l ˜ m , h l ˜ m , h α } ,   α 0
where l m , h and l ˜ m , h are the real and predicted load, and the uncertain parameter is defined by α . The introduced scheme in (40) is an envelope-bound info-gap scheme, where the gap scale is in the proportion of the predicted amount.

3.2. Background of IGDT

In the energy networks, modeling the uncertainty of important input parameters is essential, concerning their variable characteristics such as demand. The IGDT approach is an effective tool for modeling the robustness and opportunity functions of the energy systems against variations in system parameters [34]. In this study, the authors have studied the uncertain nature of power load, which is defined by l. Additionally, the decision variable is defined by q.
The need for the optimal operation of the multi-carrier network describes the objectives anticipated from the network, which can be in cost function type or other forms. The evaluation of such requirements can be performed concerning robustness and opportunity functions as follows:
α = max α { α : maximum   total   cost   which   is   is   not   higher   than   a   specified   cost }
β ^ = min β { α : minimum   total   cost   which   is   less   than   a   specified   cost }
The role of the robustness function is the evaluation of the robustness of the multi-carrier energy network against the probable increment of power demand and the immunity level of the network against the whole operation cost. In other words, the robustness function defines the maximum uncertainty value that the uncertain parameter can attain. Such a definition can be described as the risk-aversion capability of the IGDT. The robustness function can be formulated as [34]:
α ^ ( C r ) = max α { α : max ( C ( q , l ) ) C r }
where α ^ ( C r ) defines the resistance rate of the optimal energy management schedule against the uncertainty of the parameter. It is worth noting that the resistance of the decision for the system energy management can be increased by taking higher amounts of α ^ ( C r ) .
The opportunity function measures the profit value, which can be attained from the uncertain nature of loads. Such a function describes the opportunity of receiving benefits from the desired deviation of uncertain parameters.
β ^ is the minimum amount of α that makes up the minimum whole operation cost. A small amount of β ^ defines the status that minimum cost is attained in the existence of limited uncertainty, which can be stated as:
β ^ ( C o ) = min β { α : min ( C ( q , l ) ) C o }

3.3. Robustness Function

Robust decision-making for the operation of a multi-carrier network can be attained using the following problem:
α ^ ( C r ) = max { α : ( min l U ( α , l ˜ m , h ) cost t o t a l C r ) = ( 1 + ω ) C b }
where α ^ ( C r ) is the highest rate of uncertainty where the whole operation cost of the multi-carrier system cannot surpass a critical amount, C r . C b is the lowest bound of the operation cost of the multi-carrier network that is predicted to pay, and the cost change factor for modeling the growth cost of the network is indicated by w. For a risk-averse multi-carrier network, the robustness function of the presented IGDT scheme is maximizing the uncertain parameter whenever the needed operation cost is met.
α ^ ( C r ) = max α
{ t = 1 T [ n = 1 N E [ F ( P n , t ) + S U n , t + S D n , t ] + g = 1 N G W ρ g a s G W g , t + g s = 1 N G S C s G S g s , t o u t ] } C r
l m , h ( 1 + α ) l ˜ m , h
l m , h ( 1 α ) l ˜ m , h
Concerning the uncertainty rate of α , the system operation cost will be in the upper bound if the greatest value of demand permitted by the IGDT is loaded at the uncertainty region α—that is, l m , h ( 1 + α ) l ˜ m , h . Accordingly, the robustness function in (47), which considers the negative effect of the uncertain parameter variation on the objective function, can be simplified as the following:
α ^ ( C r ) = max α ,
{ t = 1 T [ n = 1 N E [ F ( P n , t ) + S U n , t + S D n , t ] + g = 1 N G W ρ g a s G W g , t + g s = 1 N G S C s G S g s , t o u t ] } C r ,
l m , h = ( 1 + α ) l ˜ m , h .
All the equality and inequality constraints of the system elements should be satisfied so that the optimal value of the objective function can be attained. The optimal solution of (50) guarantees that if the uncertainty rate of demand ( α ) is lower than its upper bound ( α ^ ) , the whole system operation cost will not surpass the critical cost ( C r ) .

3.4. Opportunity Function

Generally, the demand uncertainty means the increase or decrease in demand due to forecasting error. The former sub-section introduced robustness against a decrease in the demand. In this sub-section, the positive effect of the decrease in load is explained based on introducing an opportunity function.
The opportunity function for the whole system operation can be found by studying the following problem:
β ^ ( C o ) = min { α : max l U ( α , l ˜ m , h ) cost t o t a l C o = ( 1 ψ ) C b }
where β ^ ( C o ) is the lowest rate of uncertainty where the total operation cost of the system cannot surpass a critical amount, Cr. Cb is the lowest bound of the operation cost of the multi-carrier system predicted to pay, and the cost change factor for modeling the decreased cost of the network is indicated by ψ. For a risk-averse multi-carrier network, the robustness function of the presented IGDT is maximizing the uncertain parameter whenever the needed operation cost is met.
β ^ ( C o ) = min α
{ t = 1 T [ n = 1 N E [ F ( P n , t ) + S U n , t + S D n , t ] + g = 1 N G W ρ g a s G W g , t + g s = 1 N G S C s G S g s , t o u t ] } C o
l m , h ( 1 + α ) l ˜ m , h
l m , h ( 1 α ) l ˜ m , h
Concerning the uncertainty rate of α, the network operation cost will be minimum if the lowest value of demand permitted by the IGDT is demanded at the uncertainty zone, α, equal to l m , h ( 1 α ) l ˜ m , h . Accordingly, the opportunity function, which considers the positive effect of the uncertain parameter variation on the objective function, can be simplified as:
β ^ ( C o ) = min α
{ t = 1 T [ n = 1 N E [ F ( P n , t ) + S U n , t + S D n , t ] + g = 1 N G W ρ g a s G W g , t + g s = 1 N G S C s G S g s , t o u t ] } C o
l m , h = ( 1 α ) l ˜ m , h
Similar to the robustness function, the optimal amount of the objective function will be obtained considering all the equality and inequality constraints of the system elements.

4. Case Study and Simulation Results

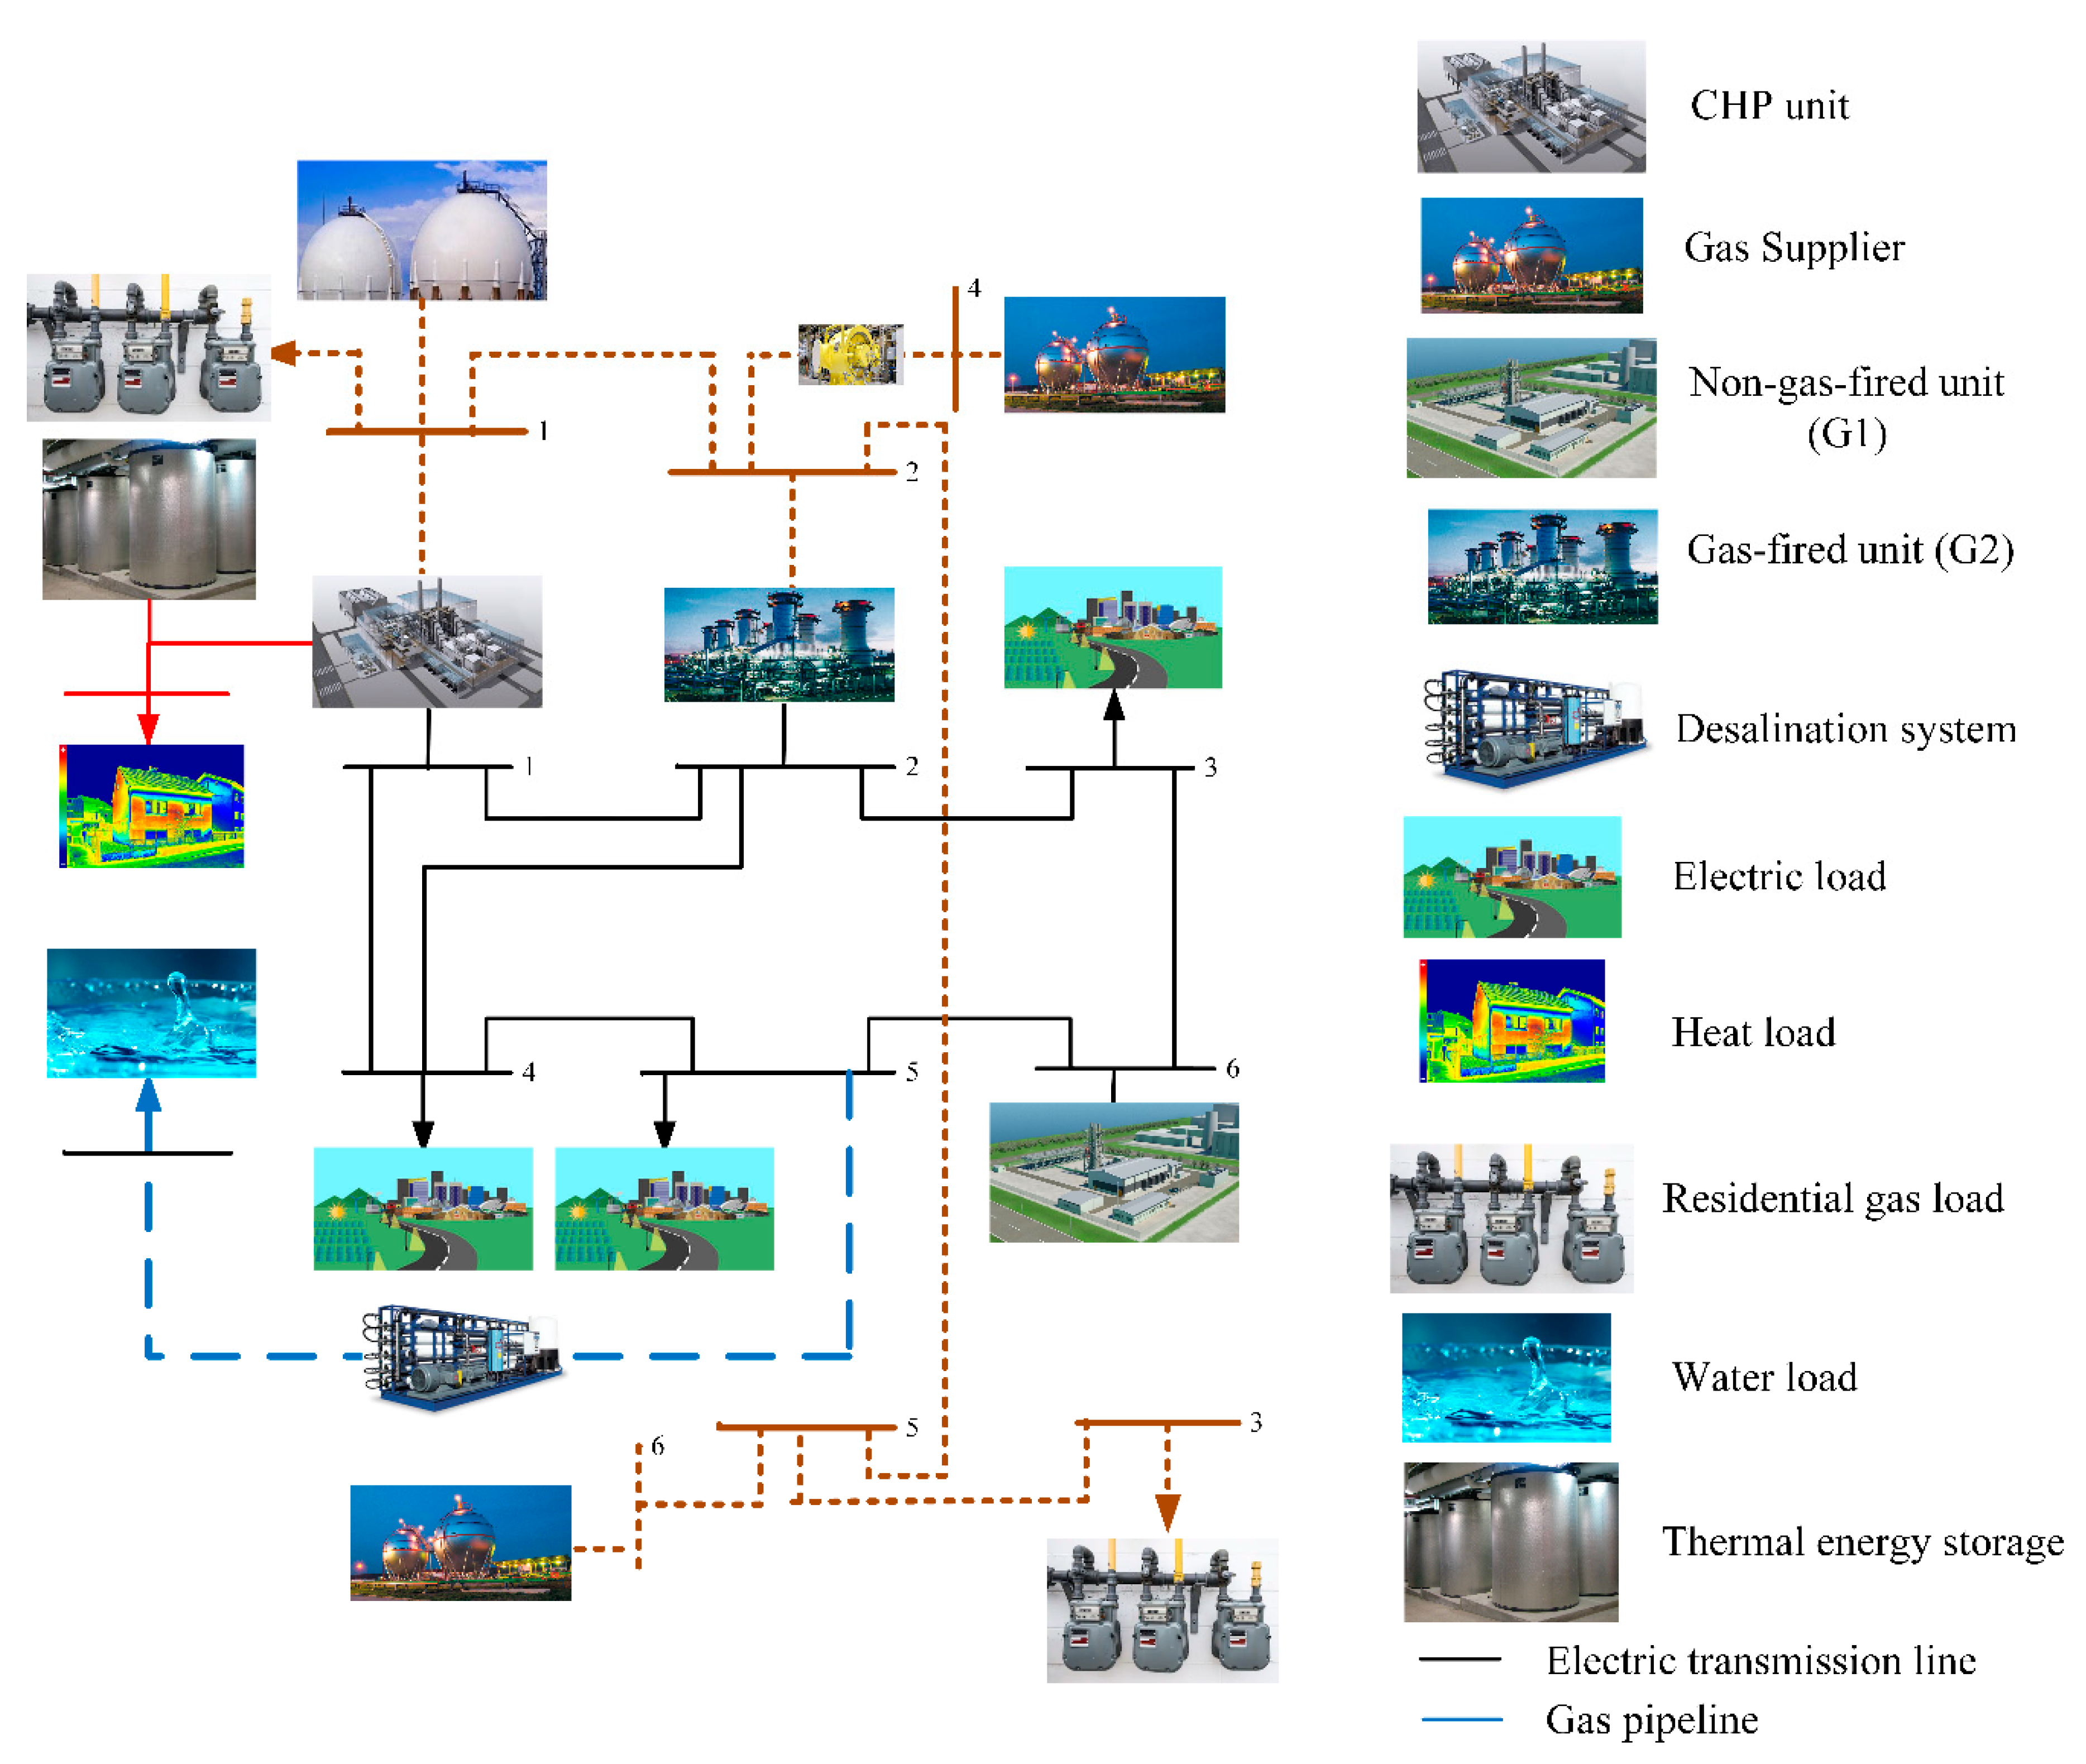
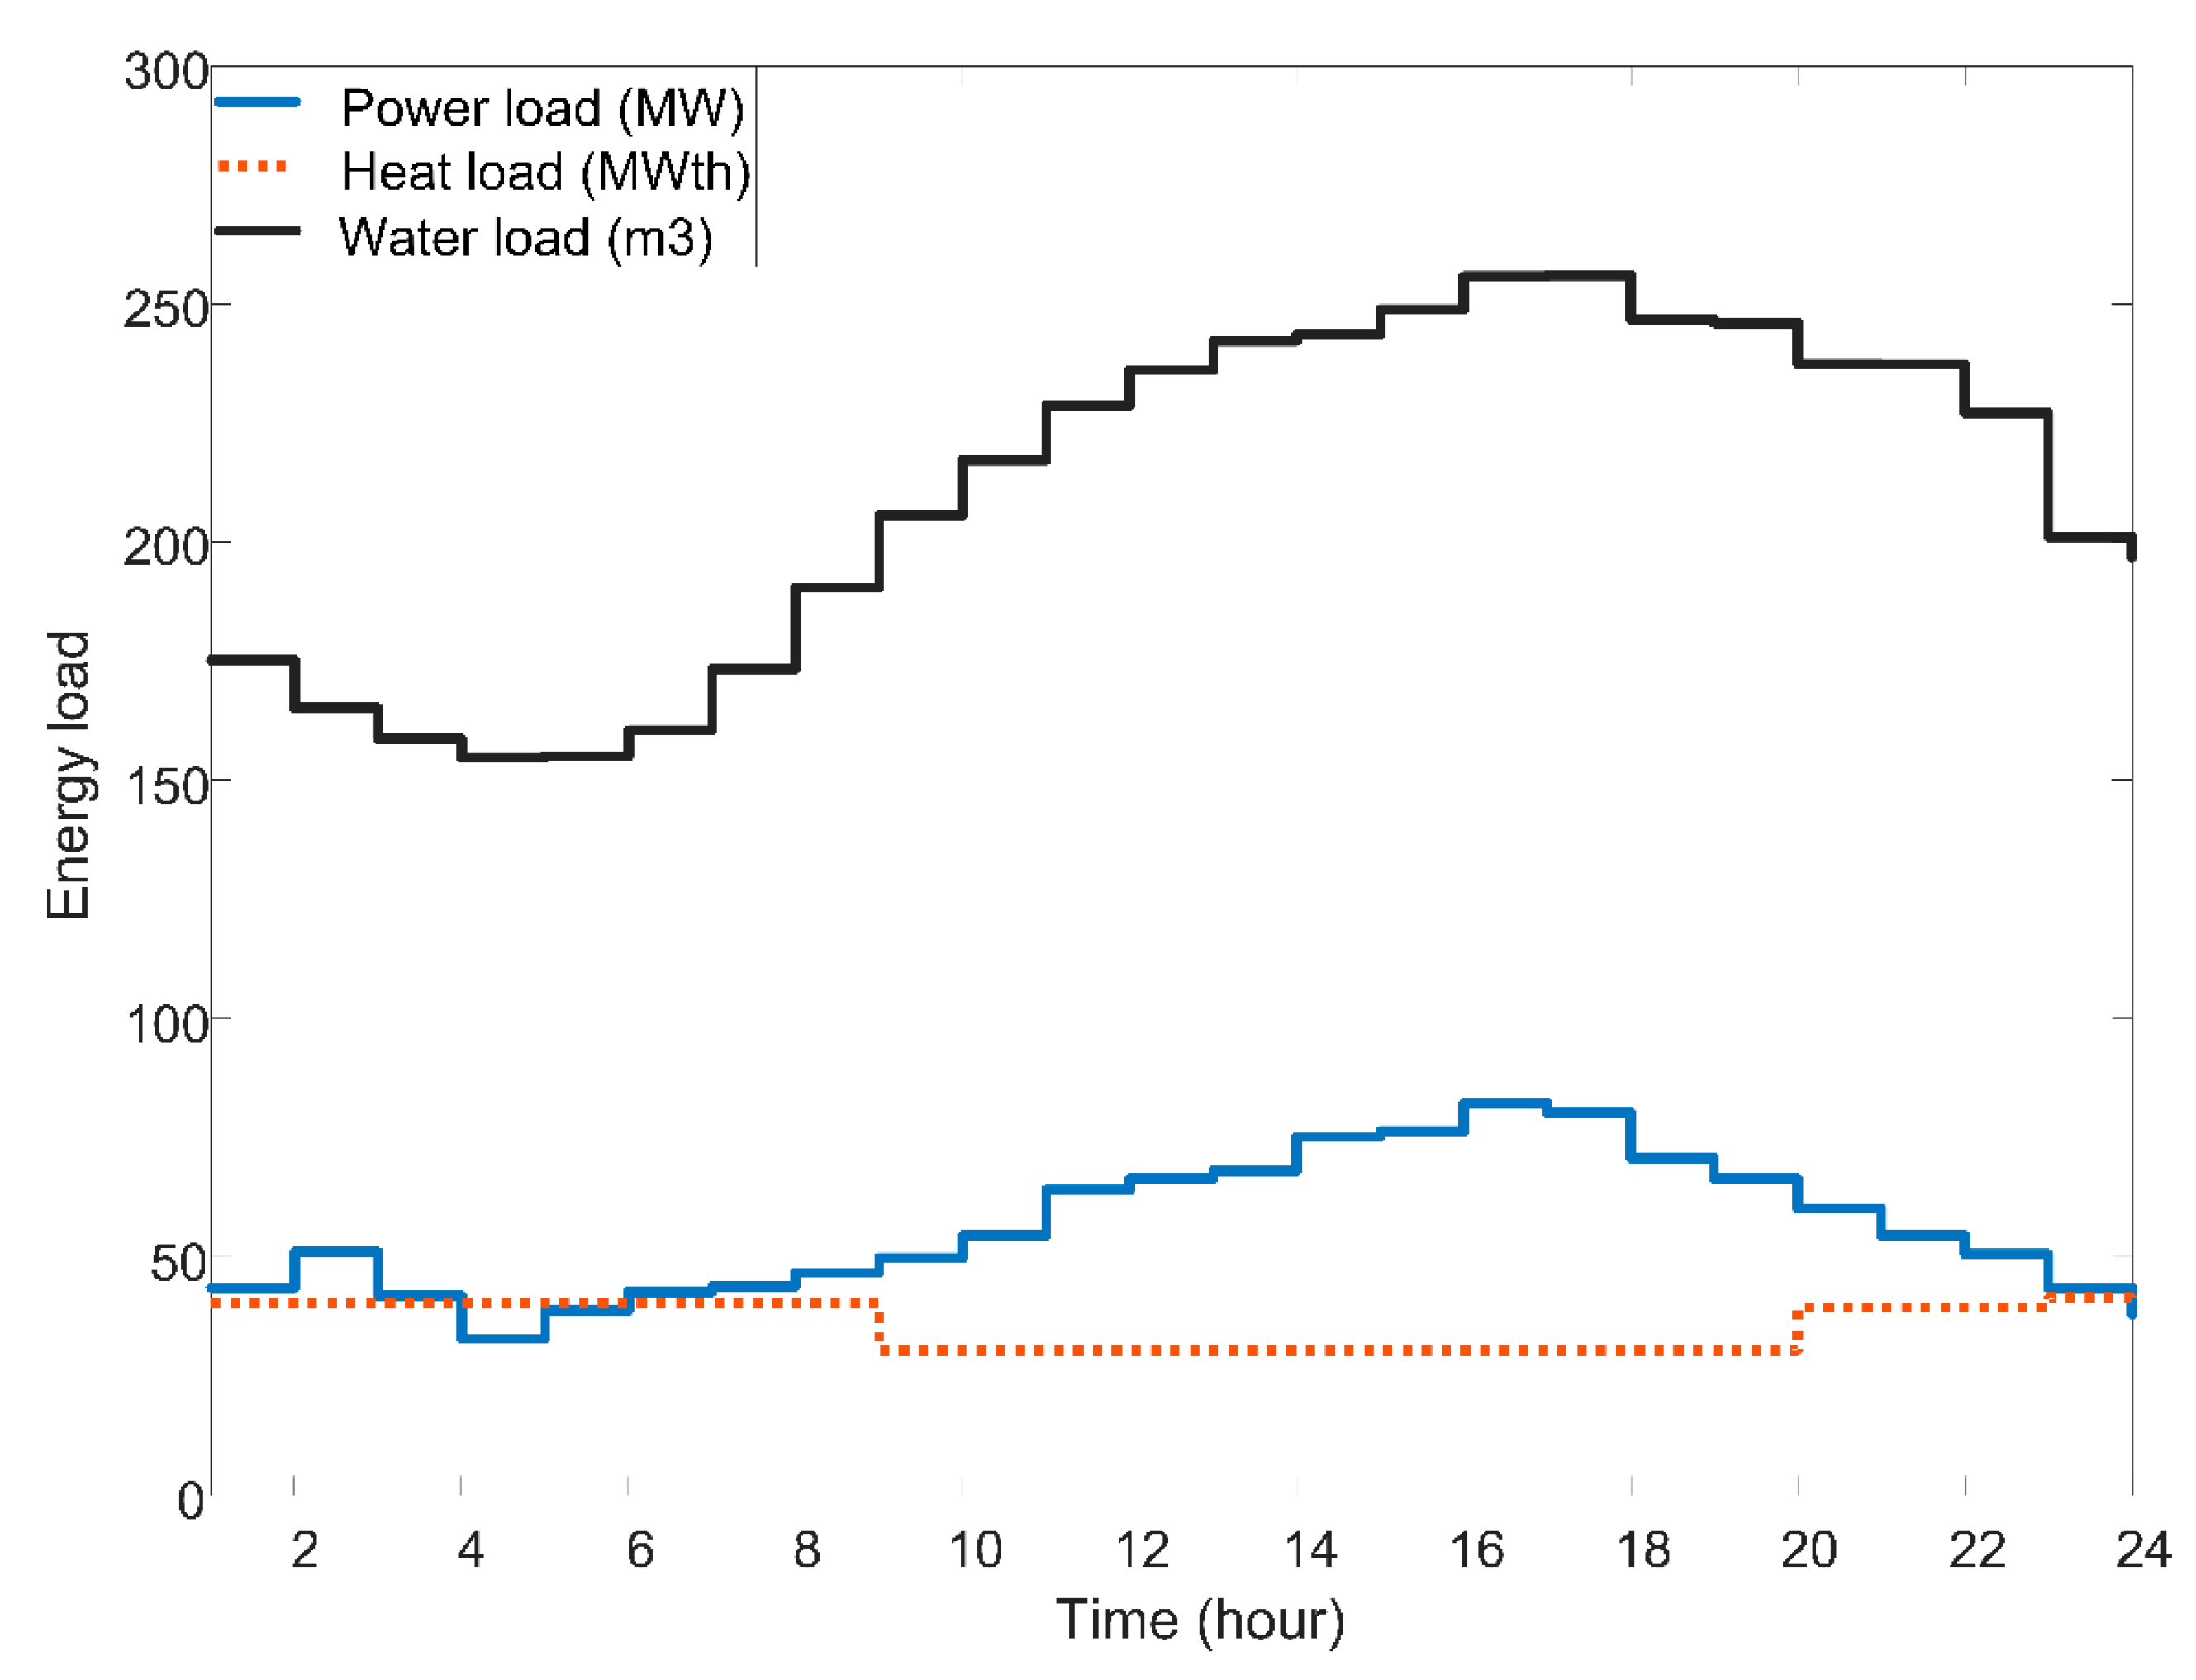
A multi-carrier system with gas, power, heat, and water carriers is selected for testing the proposed robust operation modeling of such systems based on the IGDT approach. The studied multi-carrier network, which is demonstrated in Figure 3, consists of a 6-bus electrical energy network, a 6-node natural gas network, a heat node, and a water node. Thermal energy storage technology is connected to the heat node and can store/release thermal energy based on the optimal operation strategy of the system. The data of the multi-carrier network consisting of the power, heating, gas, and water supply plants as well as the thermal energy storage technology are given from [33,34,35,36]. Table 2 consists of the characteristics of the thermal energy storage technology. The demands for the energy carriers, including electrical energy, heating, and water, are demonstrated in Figure 4. The price of gas in the simulation results is considered as 2 $/kcf.

4.1. The Analysis of Robustness Solution

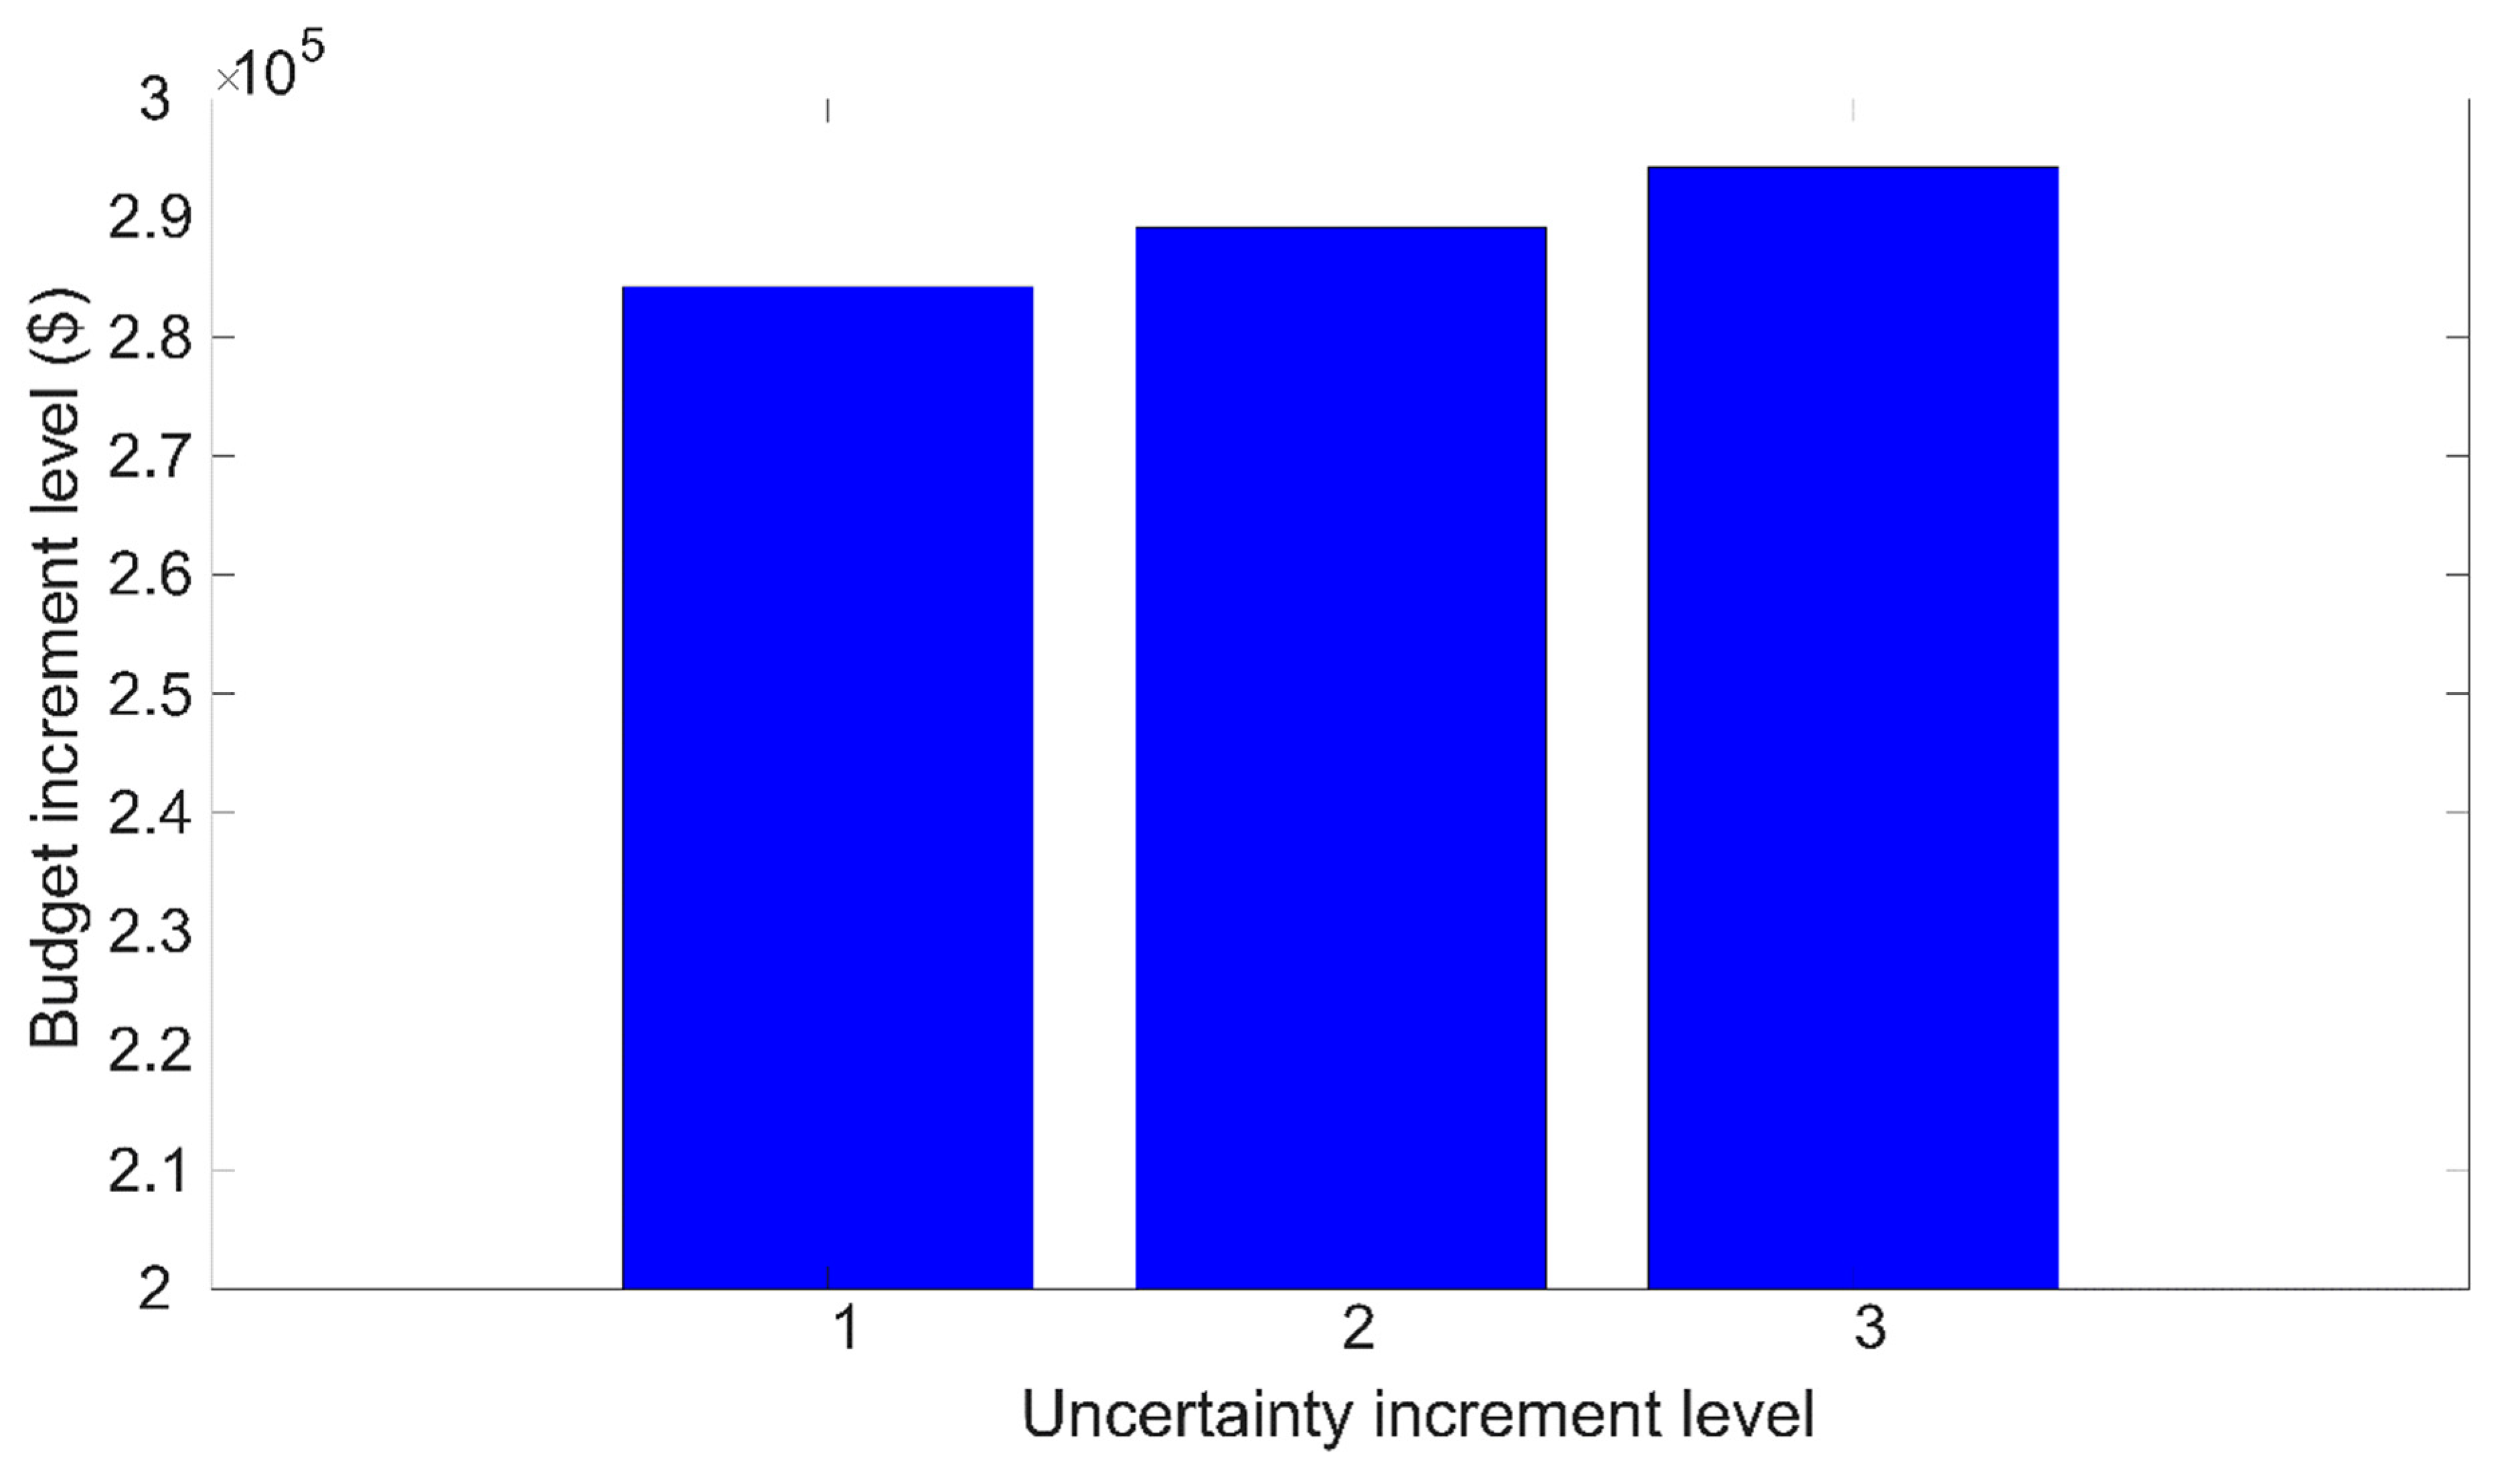
A robustness analysis is performed based on the solution of the robustness function (39) and constraints (40)–(42), for which Figure 5 is provided. The robustness cost is the optimal value of the objective function considering the negative effect of the uncertain parameter variation on the objective function. The robustness function is provided as (50)–(52) and considers the negative effect of variation in the uncertain parameters on the objective function. Figure 5 demonstrates the relationship between robustness cost and robustness function. As can be observed in this figure, the operation cost of the multi-carrier network is increased by the increment of the robustness function. In other words, the multi-carrier system operator spends more money to attain a robust operation strategy for the system against the probable increment of the demand. The numerical results show that a $5000 greater cost for the system operation is effective in overcoming a 4% variation in the electrical energy demand. Additionally, by increasing the operation cost by $10,000, a 6% uncertainty in the electrical energy load can be handled by the presented robust model. It should be highlighted that the operation cost of the multi-carrier energy system increases with steps of $5000 in the robustness function.

4.2. The Analysis of Opportunity Solution

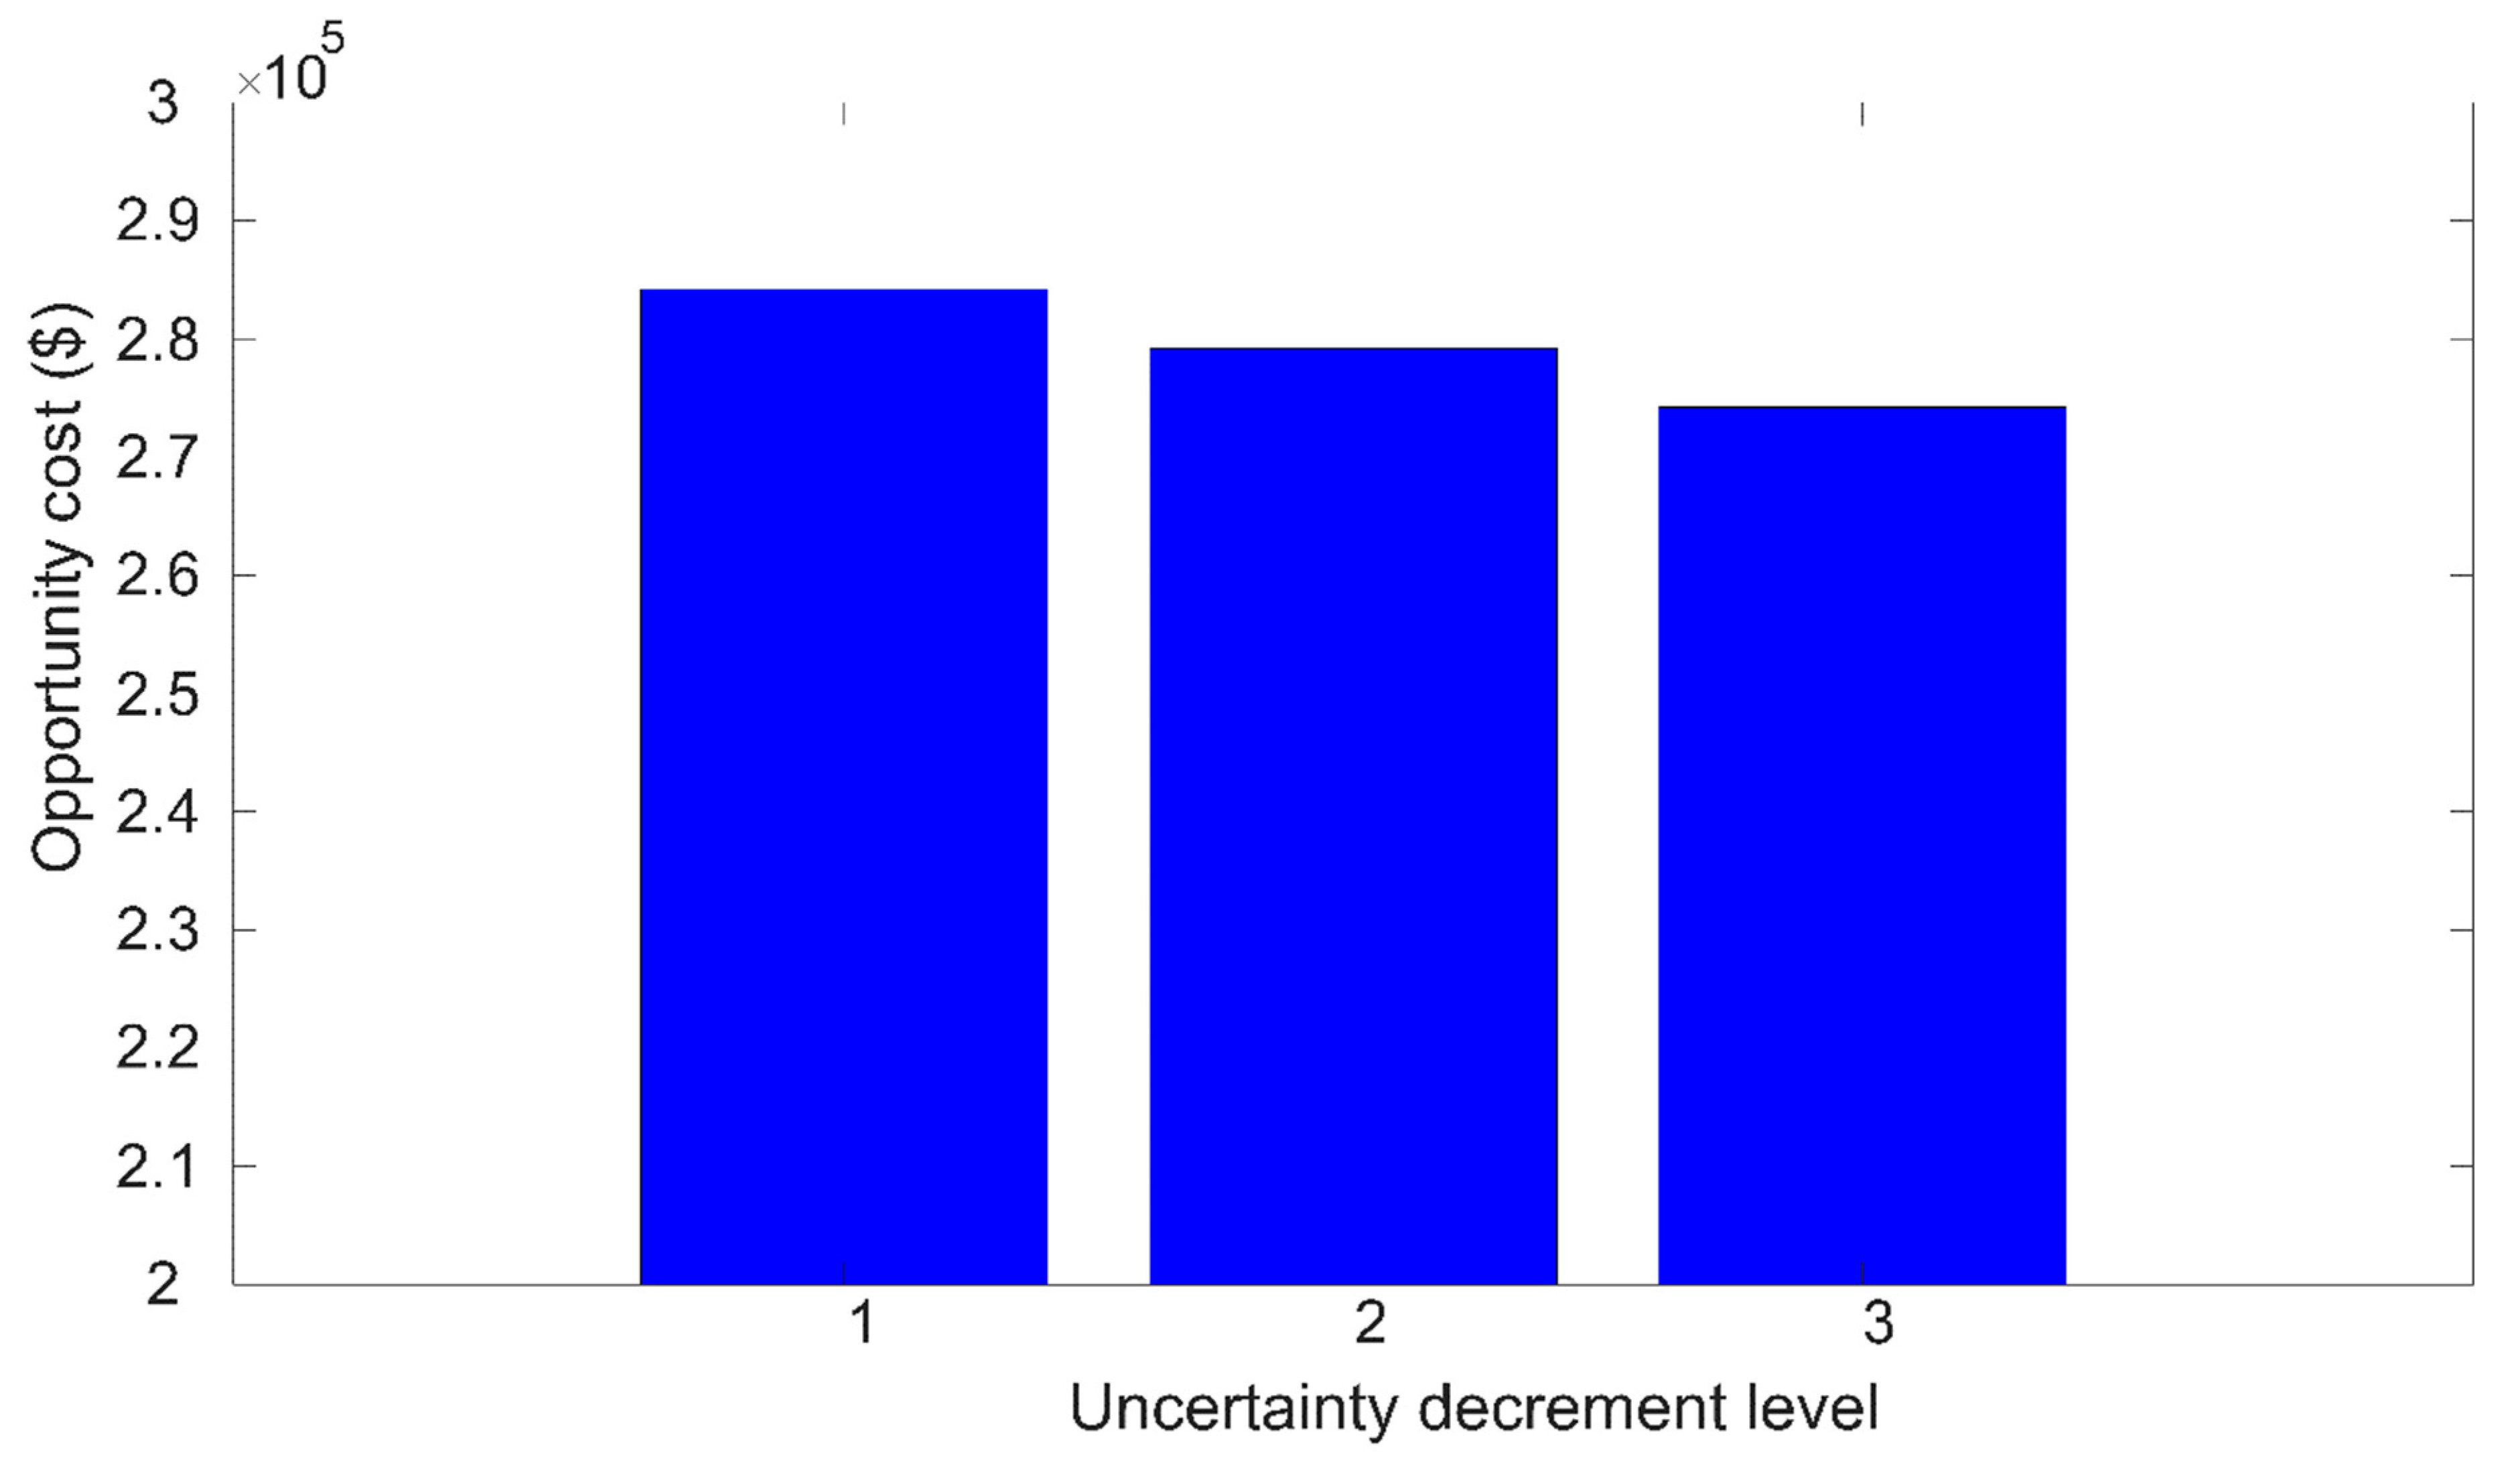
The opportunity function is investigated considering the solution of the opportunity function (47) and constraints (48)–(50), for which Figure 6 is provided. The opportunity cost is the optimal amount of the objective function regarding the positive impact of the uncertain parameter variation on the objective function. The opportunity function is as (53)–(55), which is based on the positive influence of variation in the uncertain parameter on the objective function. Figure 6 demonstrates the relationship between the opportunity cost and opportunity function. The analysis shows that the operation cost of the multi-carrier network is decreased by the reduction in the robustness function. In other words, the whole network operator spends lower money to achieve a robust scheduling of the system. The numerical results report that the cost is reduced by $5000 for the system operator by a 3.9% decrease in the power load. Additionally, a reduction of $10,000 is attained for the operator by an 8.1% decrement of the power demand. It is worth noting that the operation cost of the multi-carrier energy system increases with steps of $2000 in the opportunity function.

4.3. IGDT-Based Robust Operation of the Multi-Carrier Network

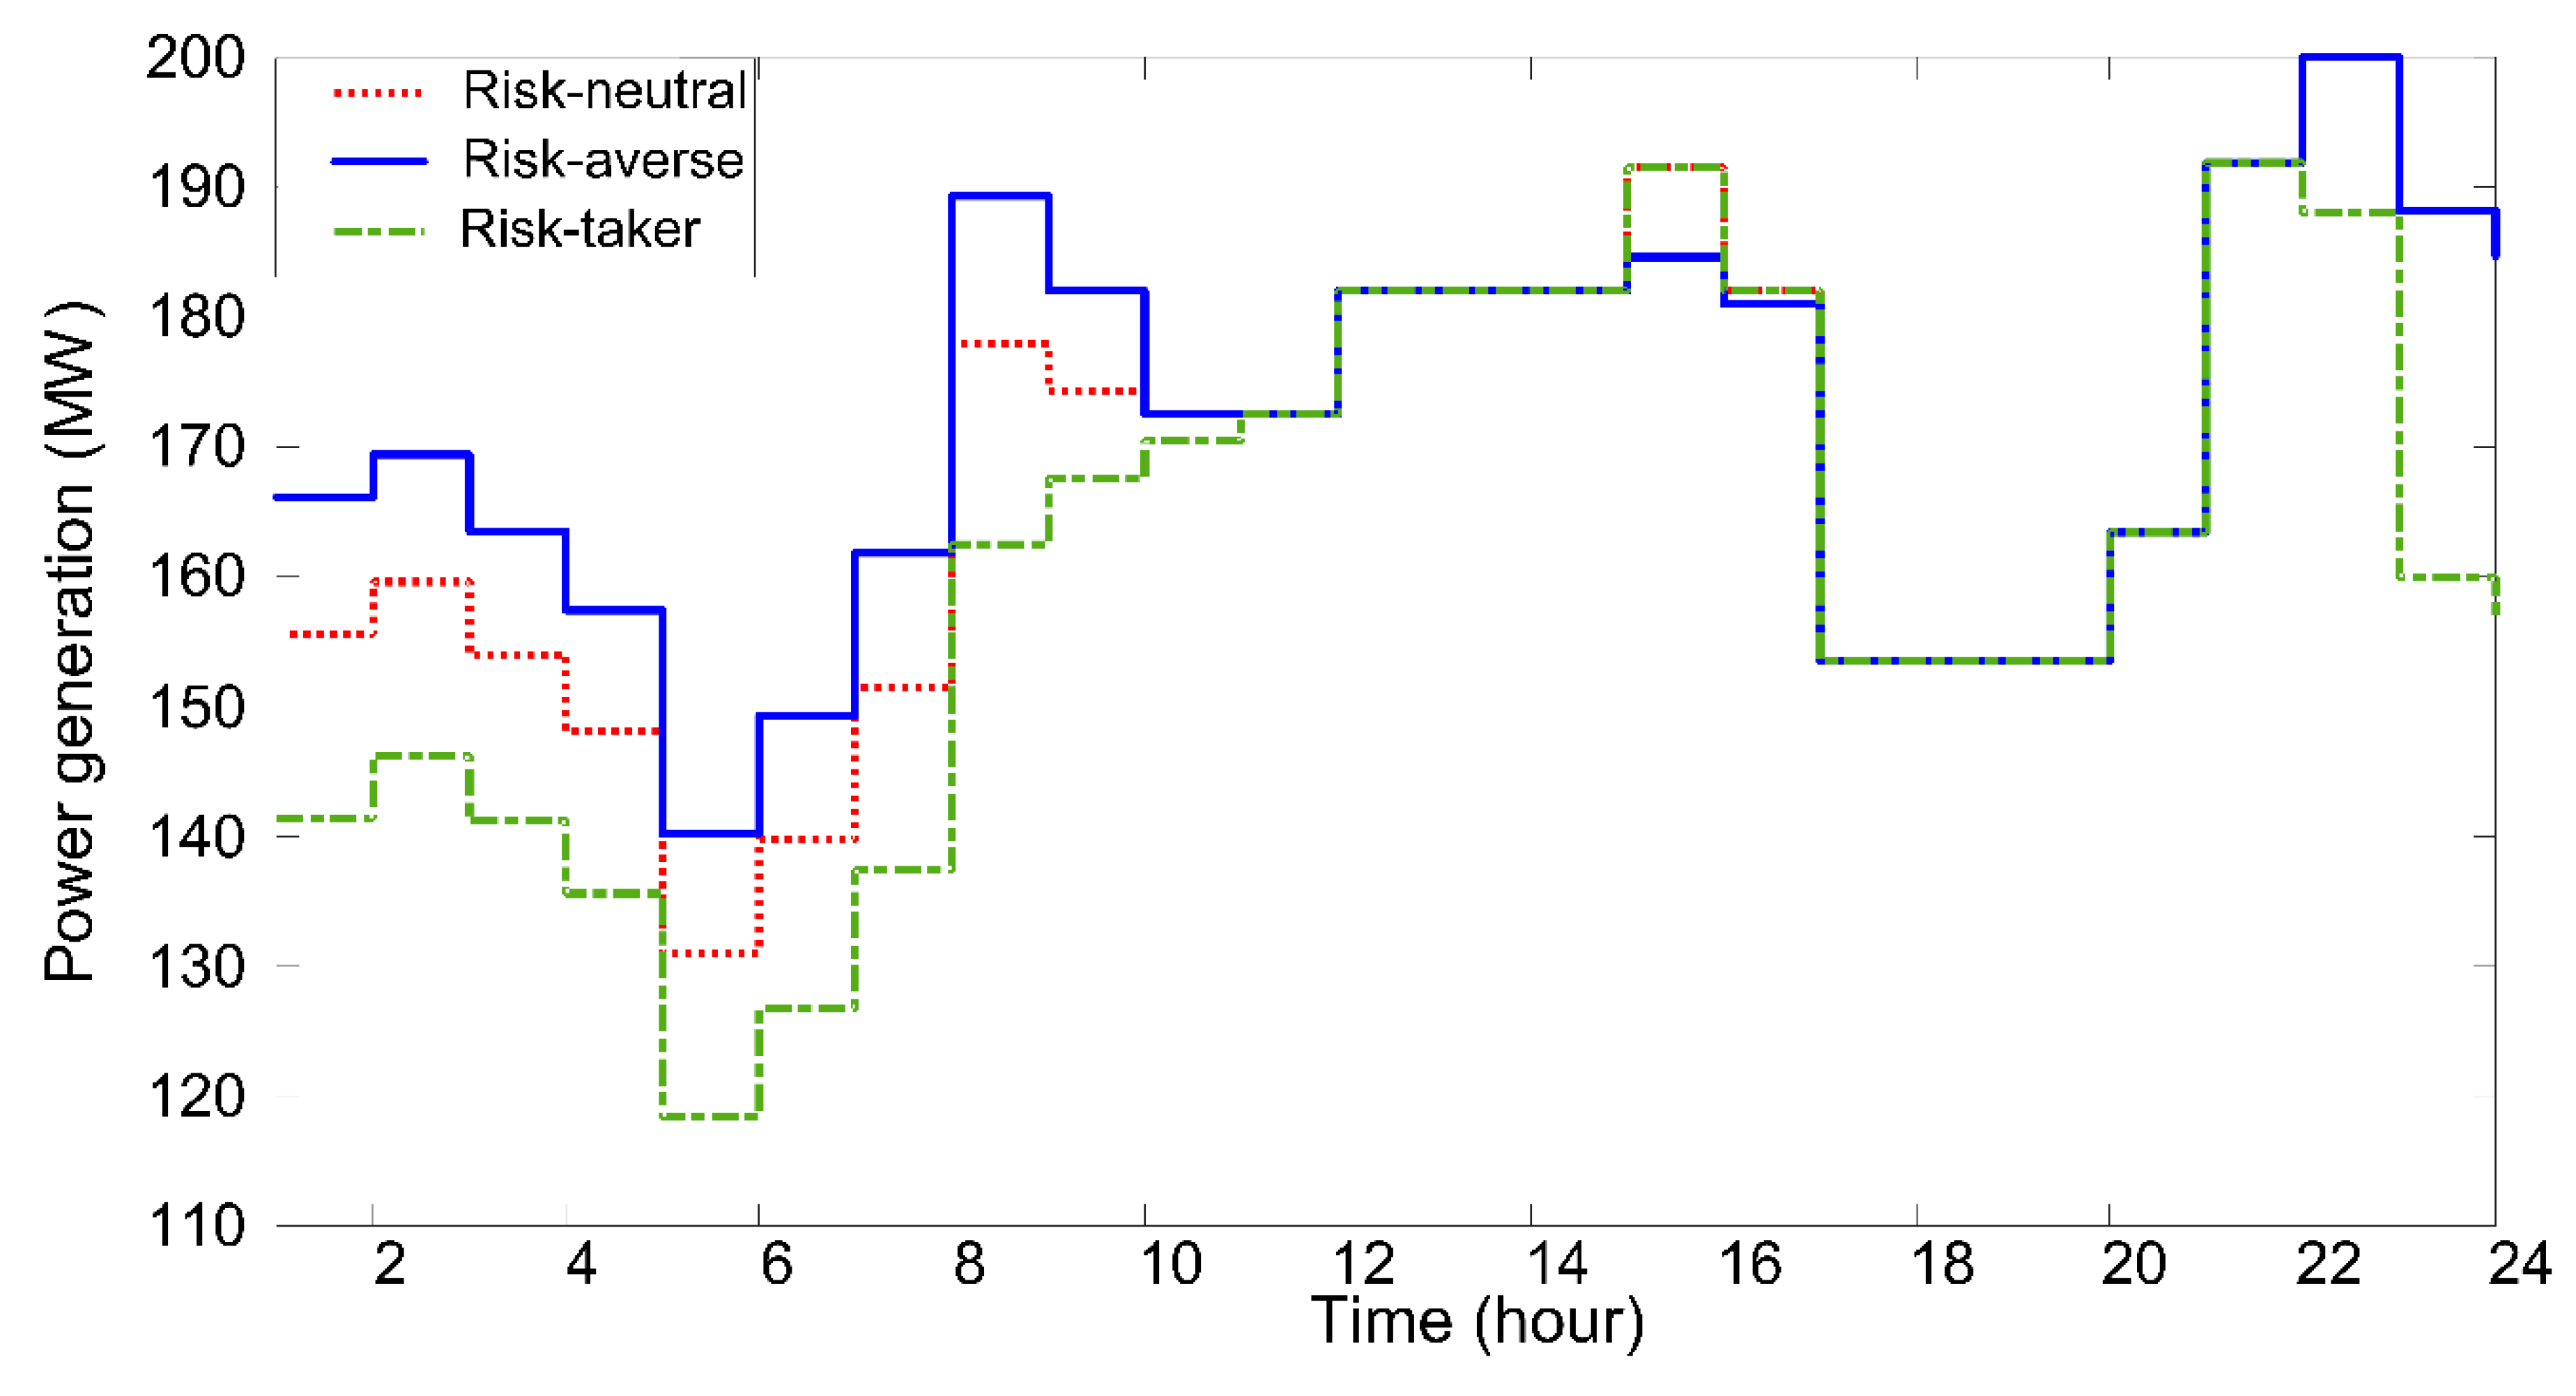
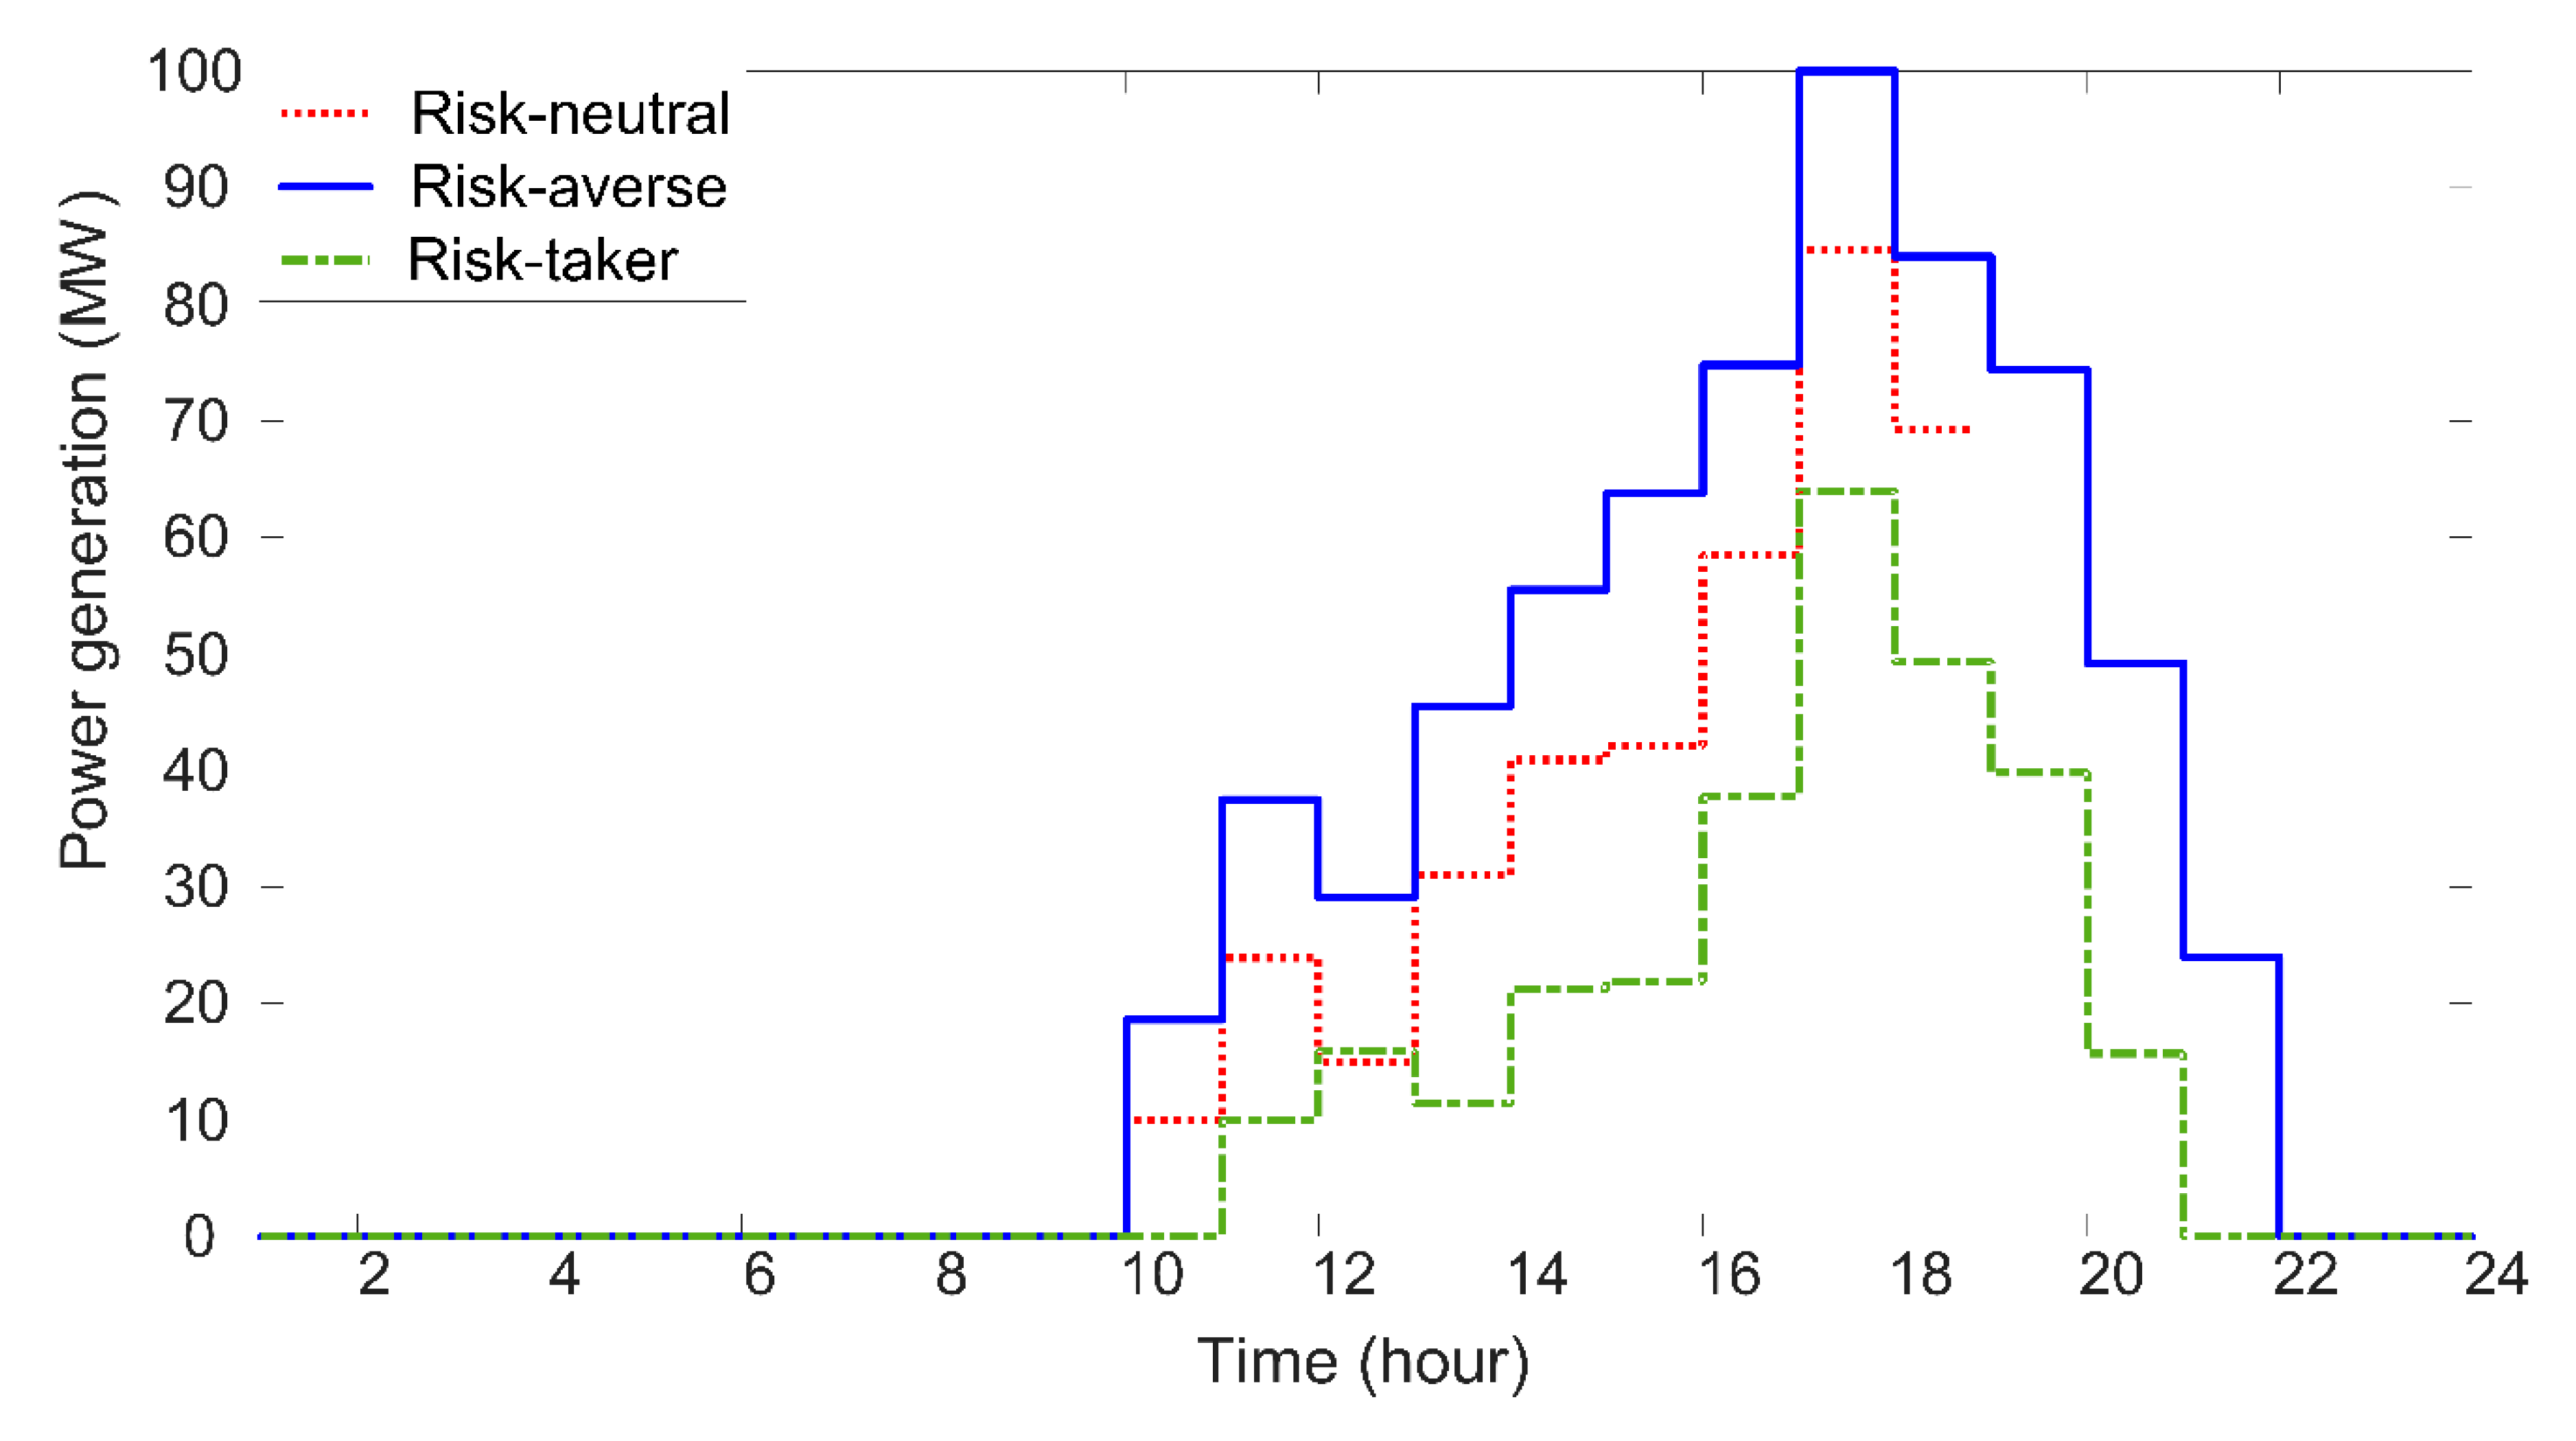
This sub-section studies the IGDT-based operation of the multi-carrier system elements. The optimal generation scheduling of three power supply plants in three risk-seeker, risk-neutral, and risk-averse scenarios considering the uncertainty of electrical energy demand has been demonstrated in Figure 7, Figure 8 and Figure 9. It can be seen from the reported results that the consideration of the risk-taker strategy results in producing less power, because the power load is reduced. Additionally, the consideration of the risk-averse strategy is effective in increasing the generation of electrical energy according to an increment in the electrical energy demand.
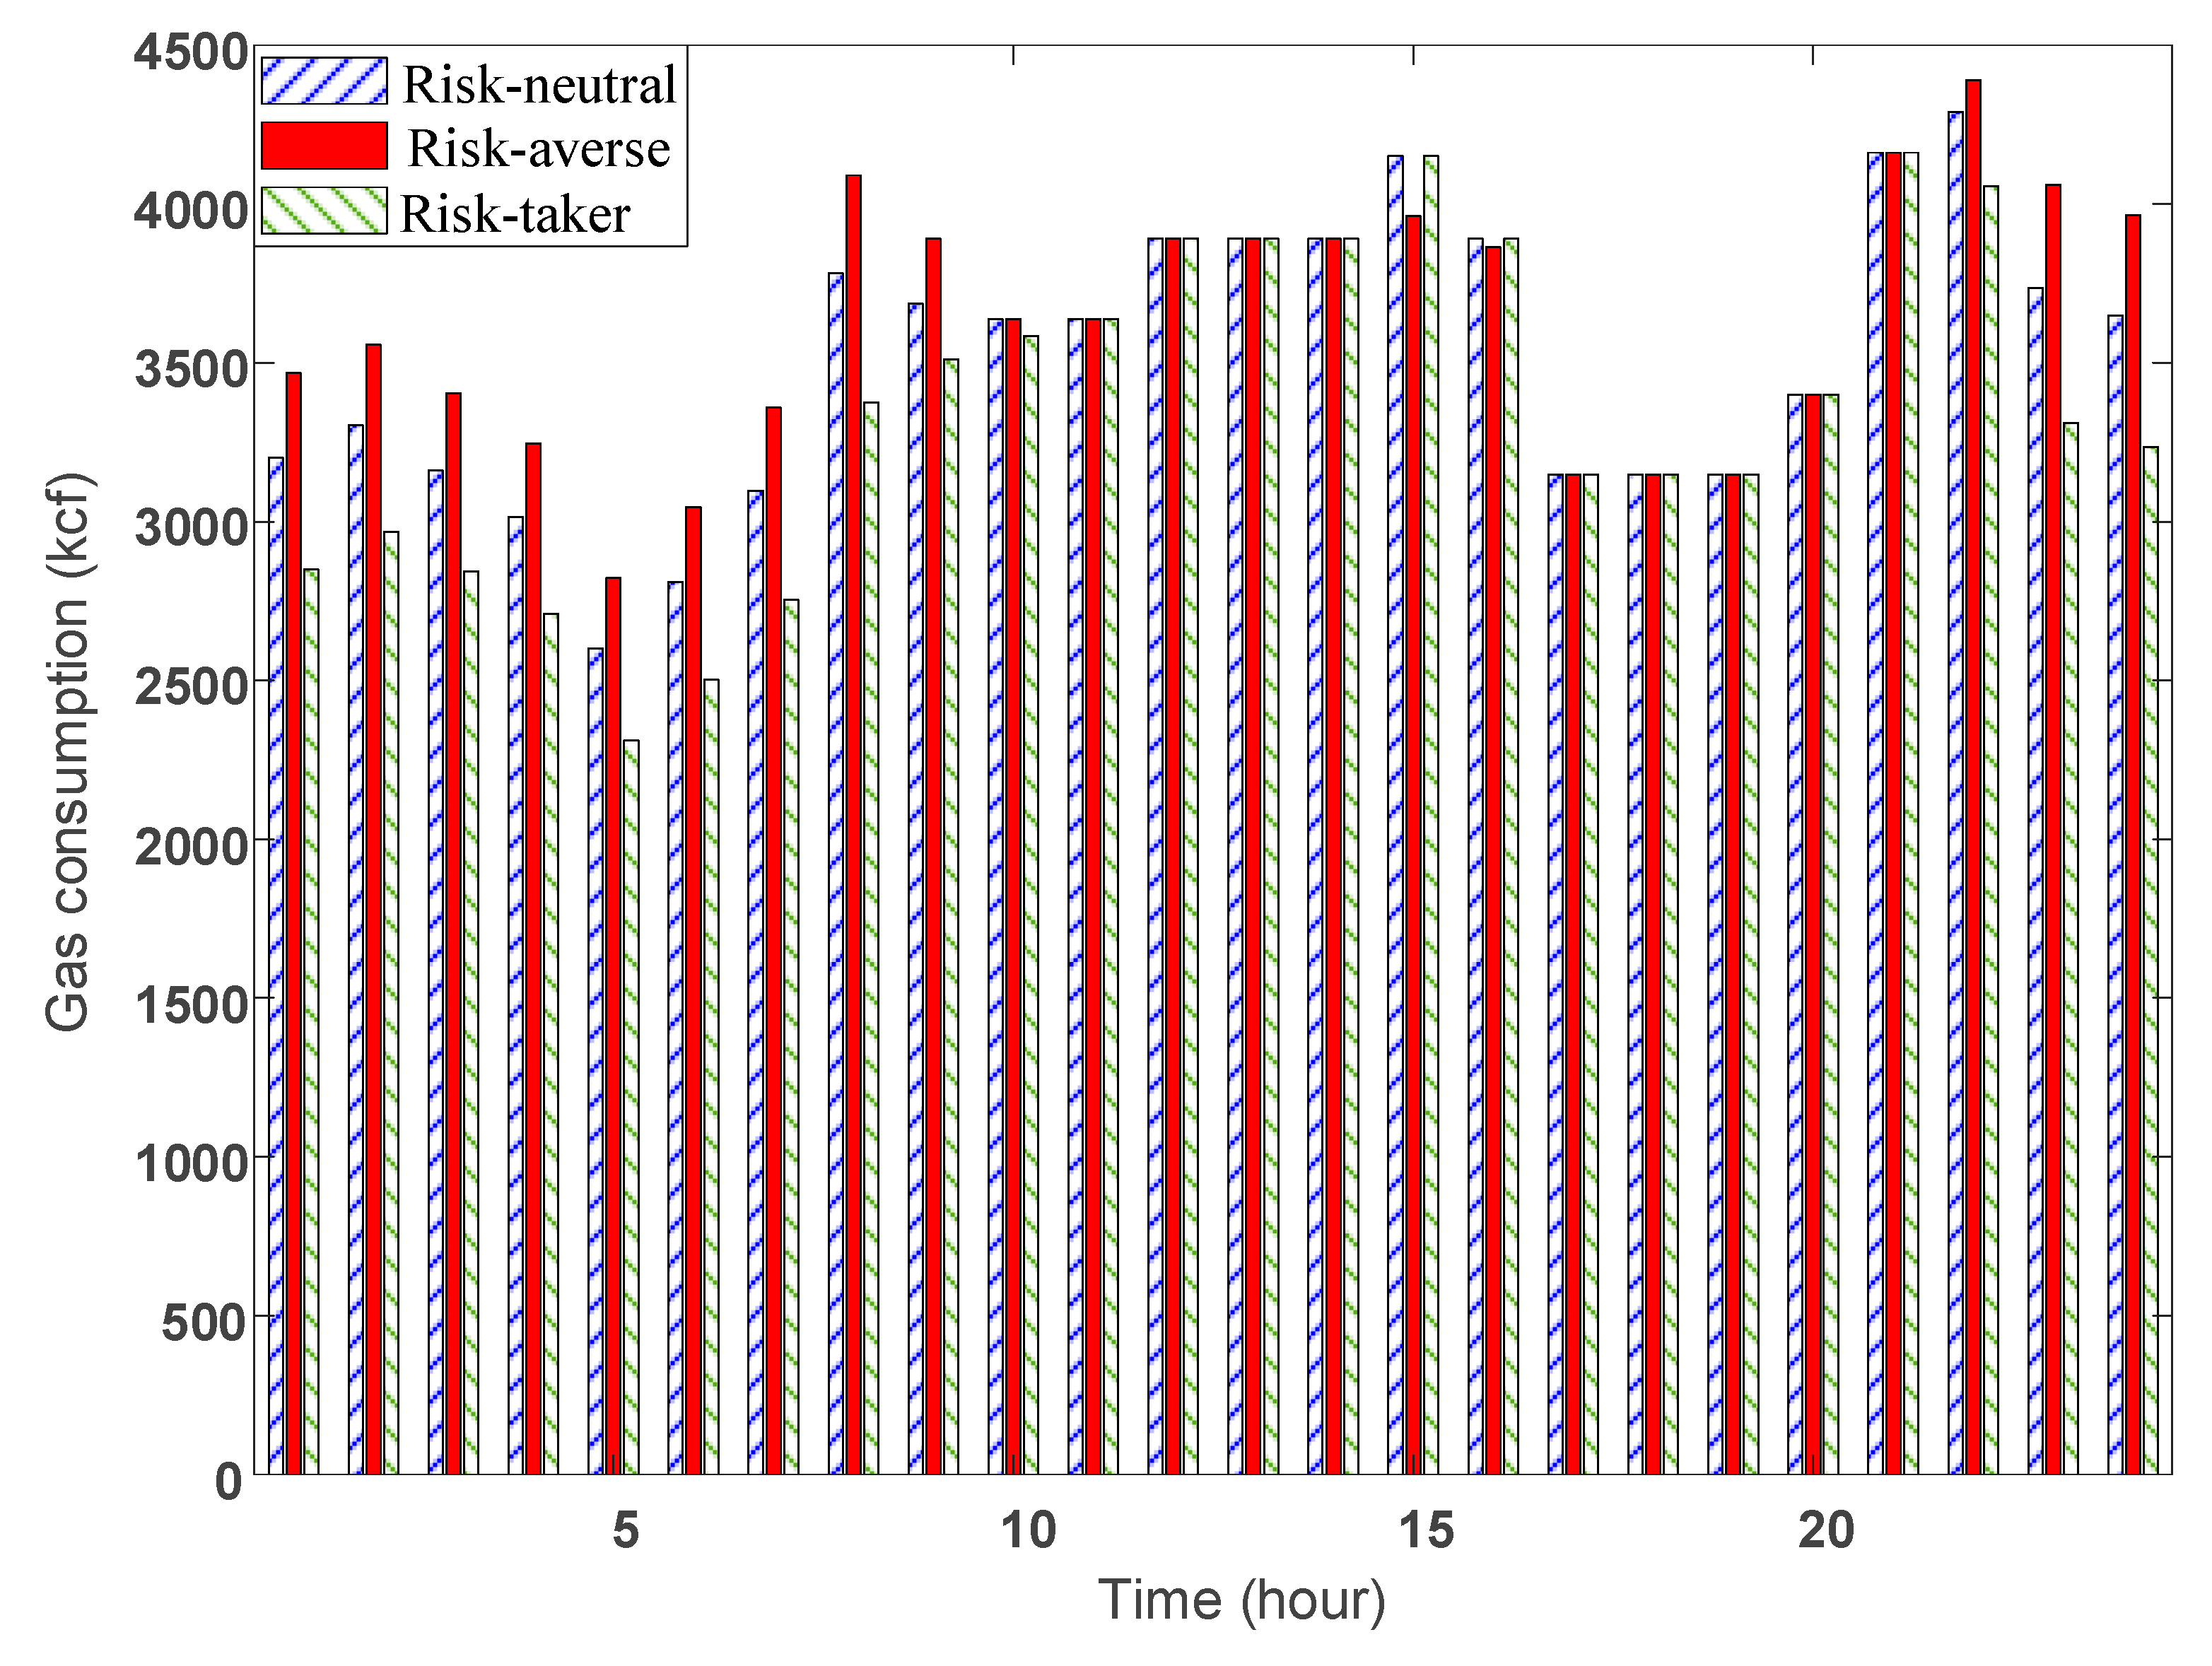
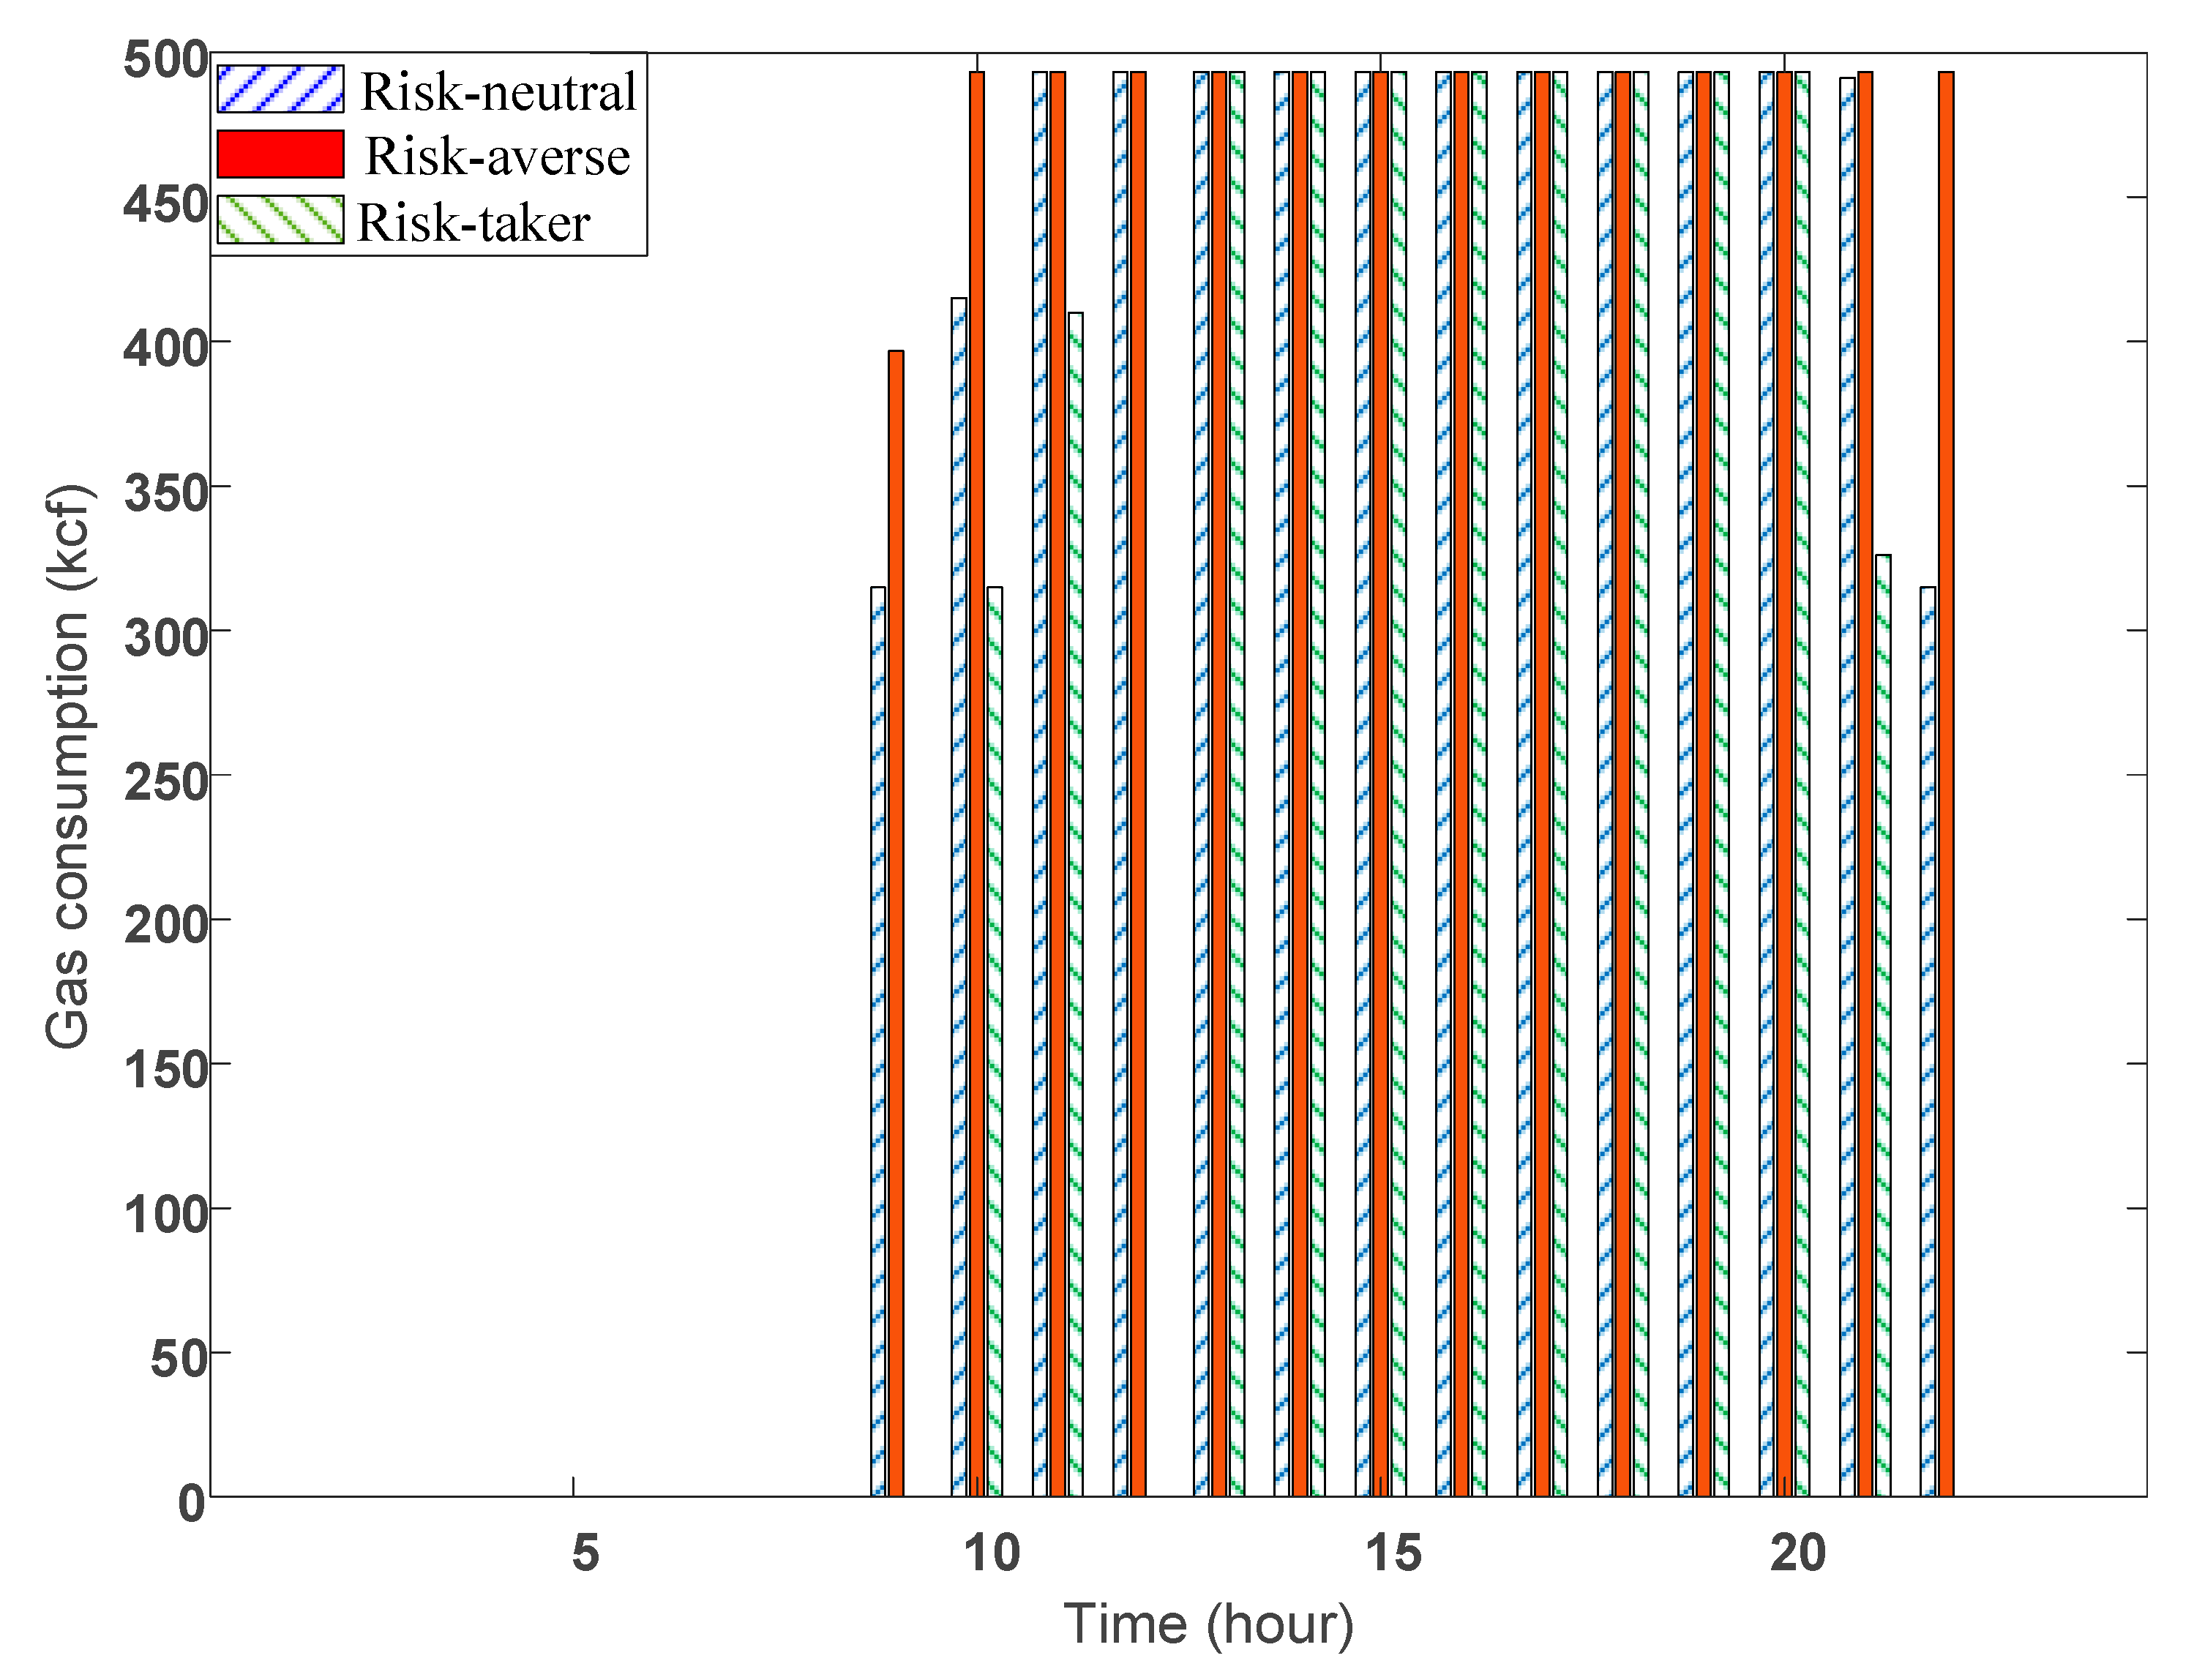
The optimal gas usage of the gas-fired power supply units CHP and G2 in three risk-seeker, risk-neutral, and risk-averse scenarios have been depicted in Figure 10 and Figure 11, respectively. It is obvious that the risk-taker strategy is effective as less natural gas is consumed by both of the plants CHP and G2 since the power load is decreased. Additionally, the consideration of the risk-averse strategy results in growing the usage of natural gas considering the increase in the electrical energy demand of the whole system.
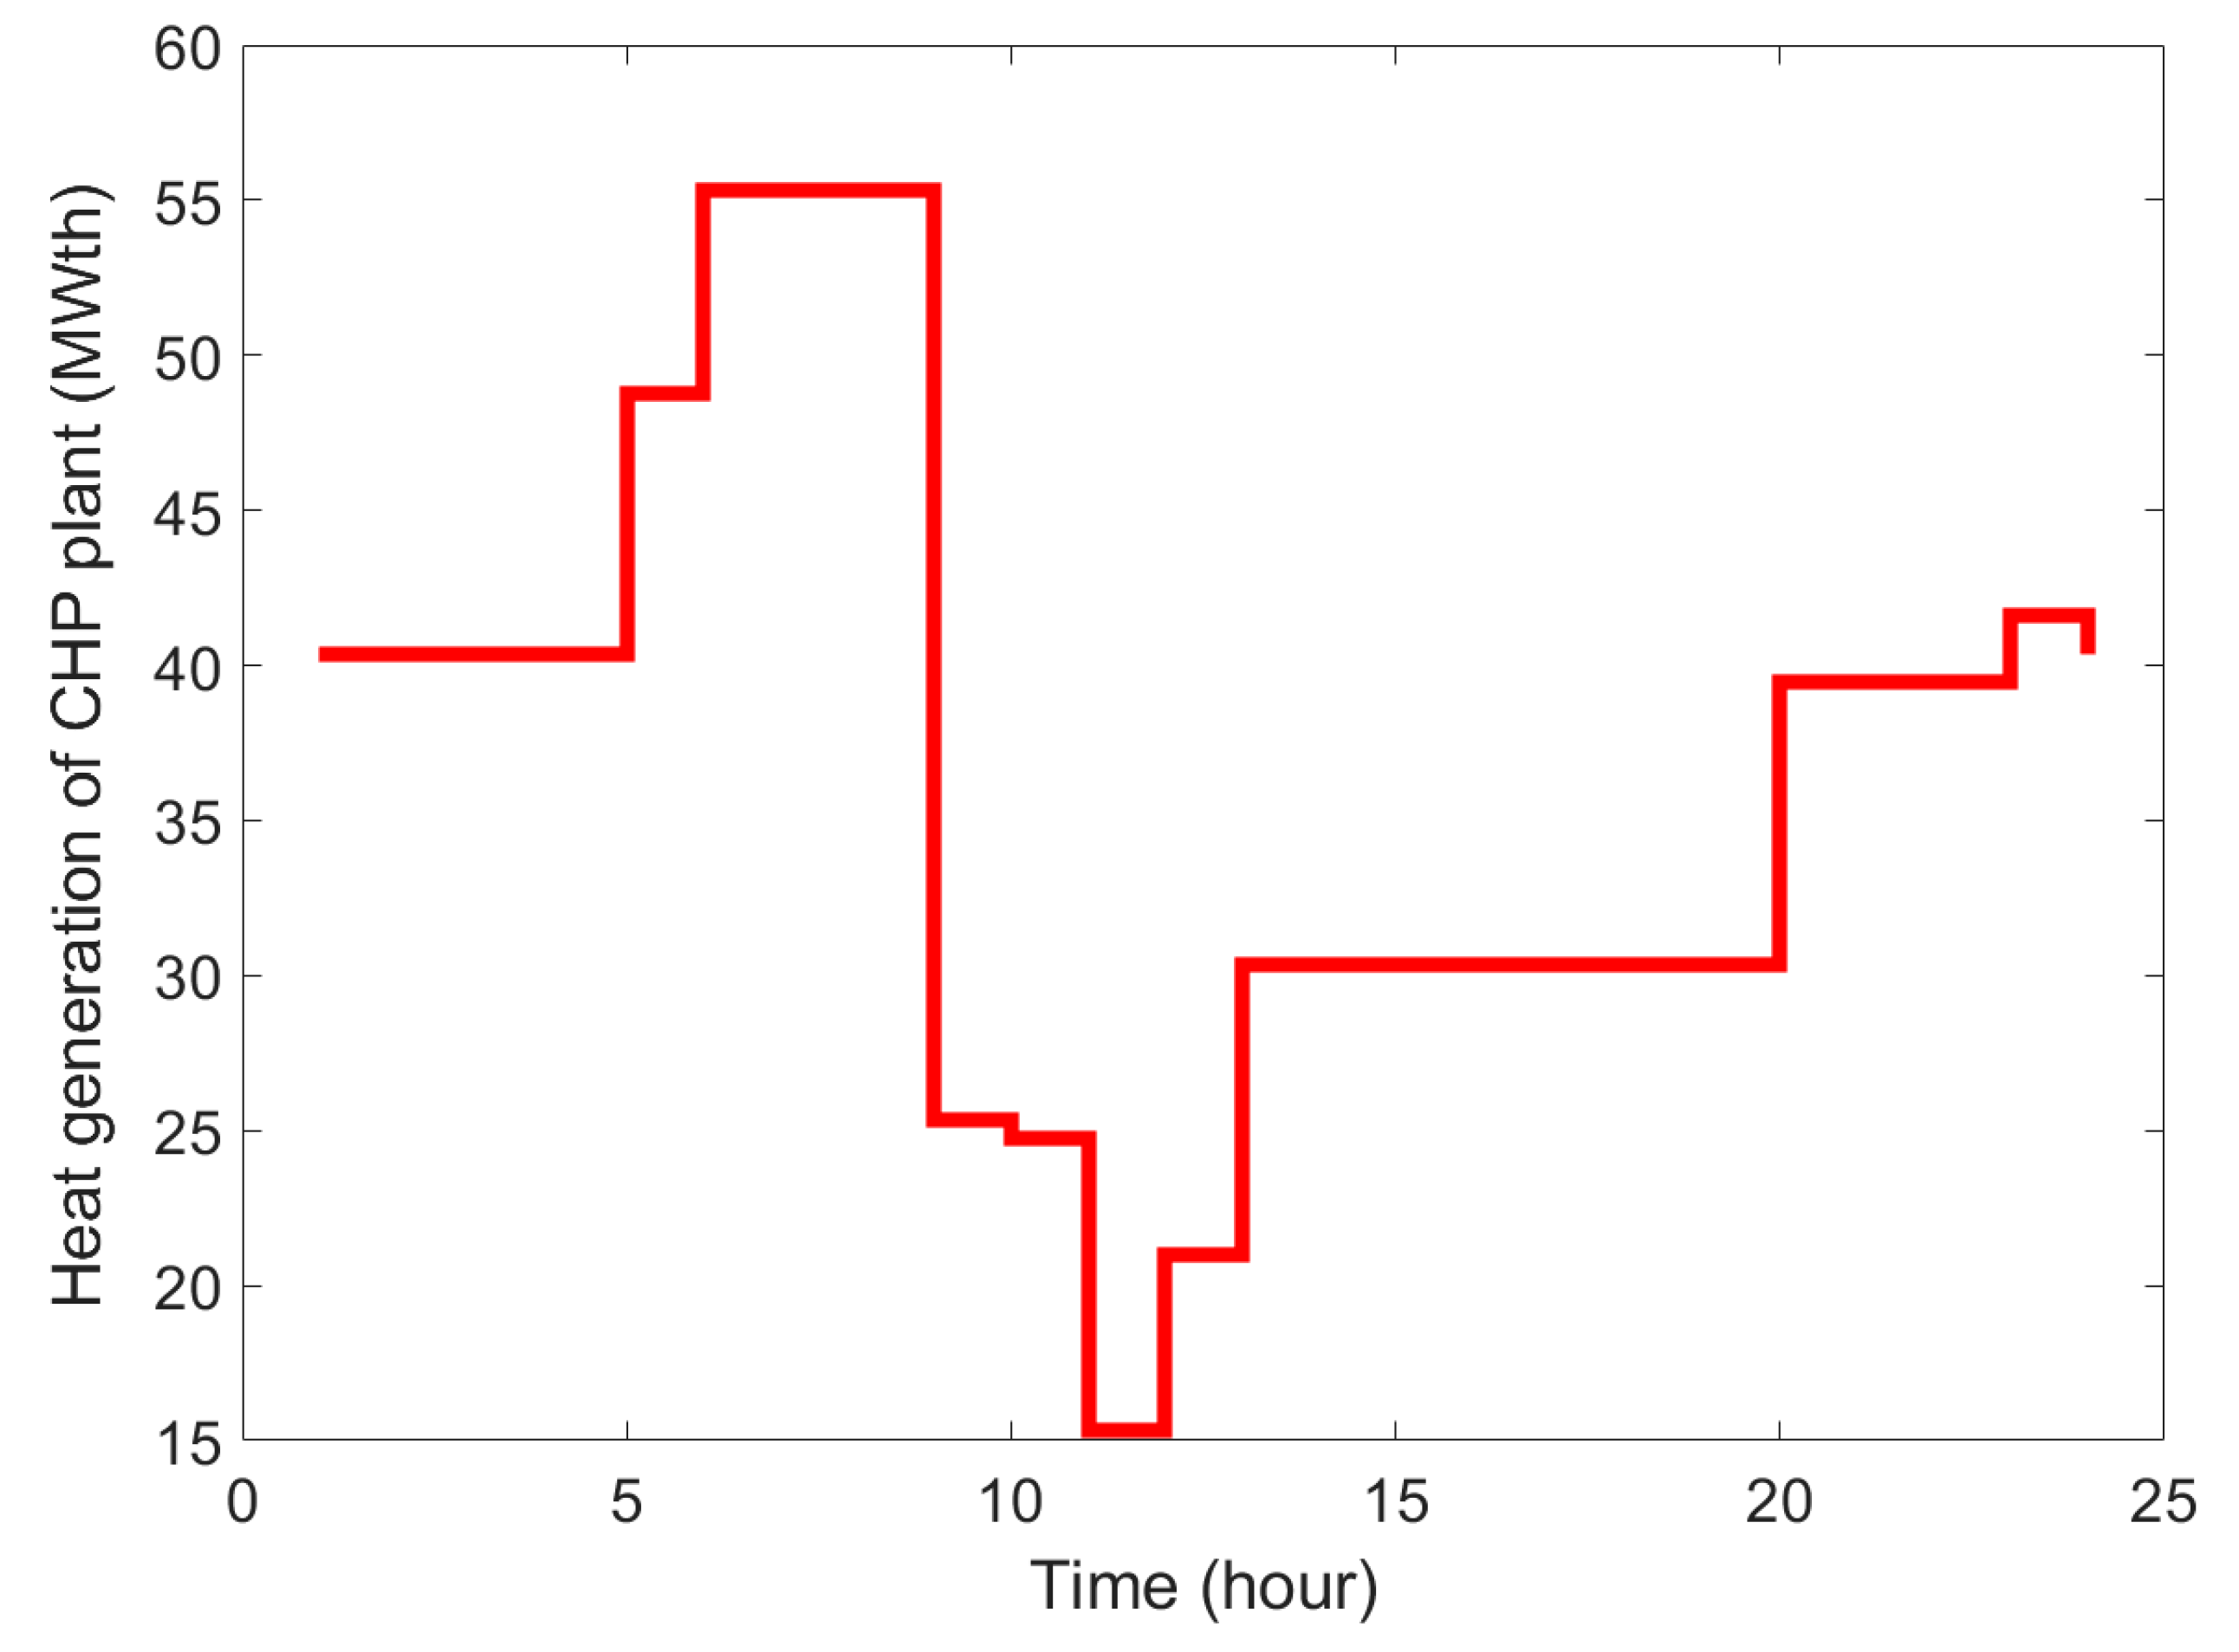
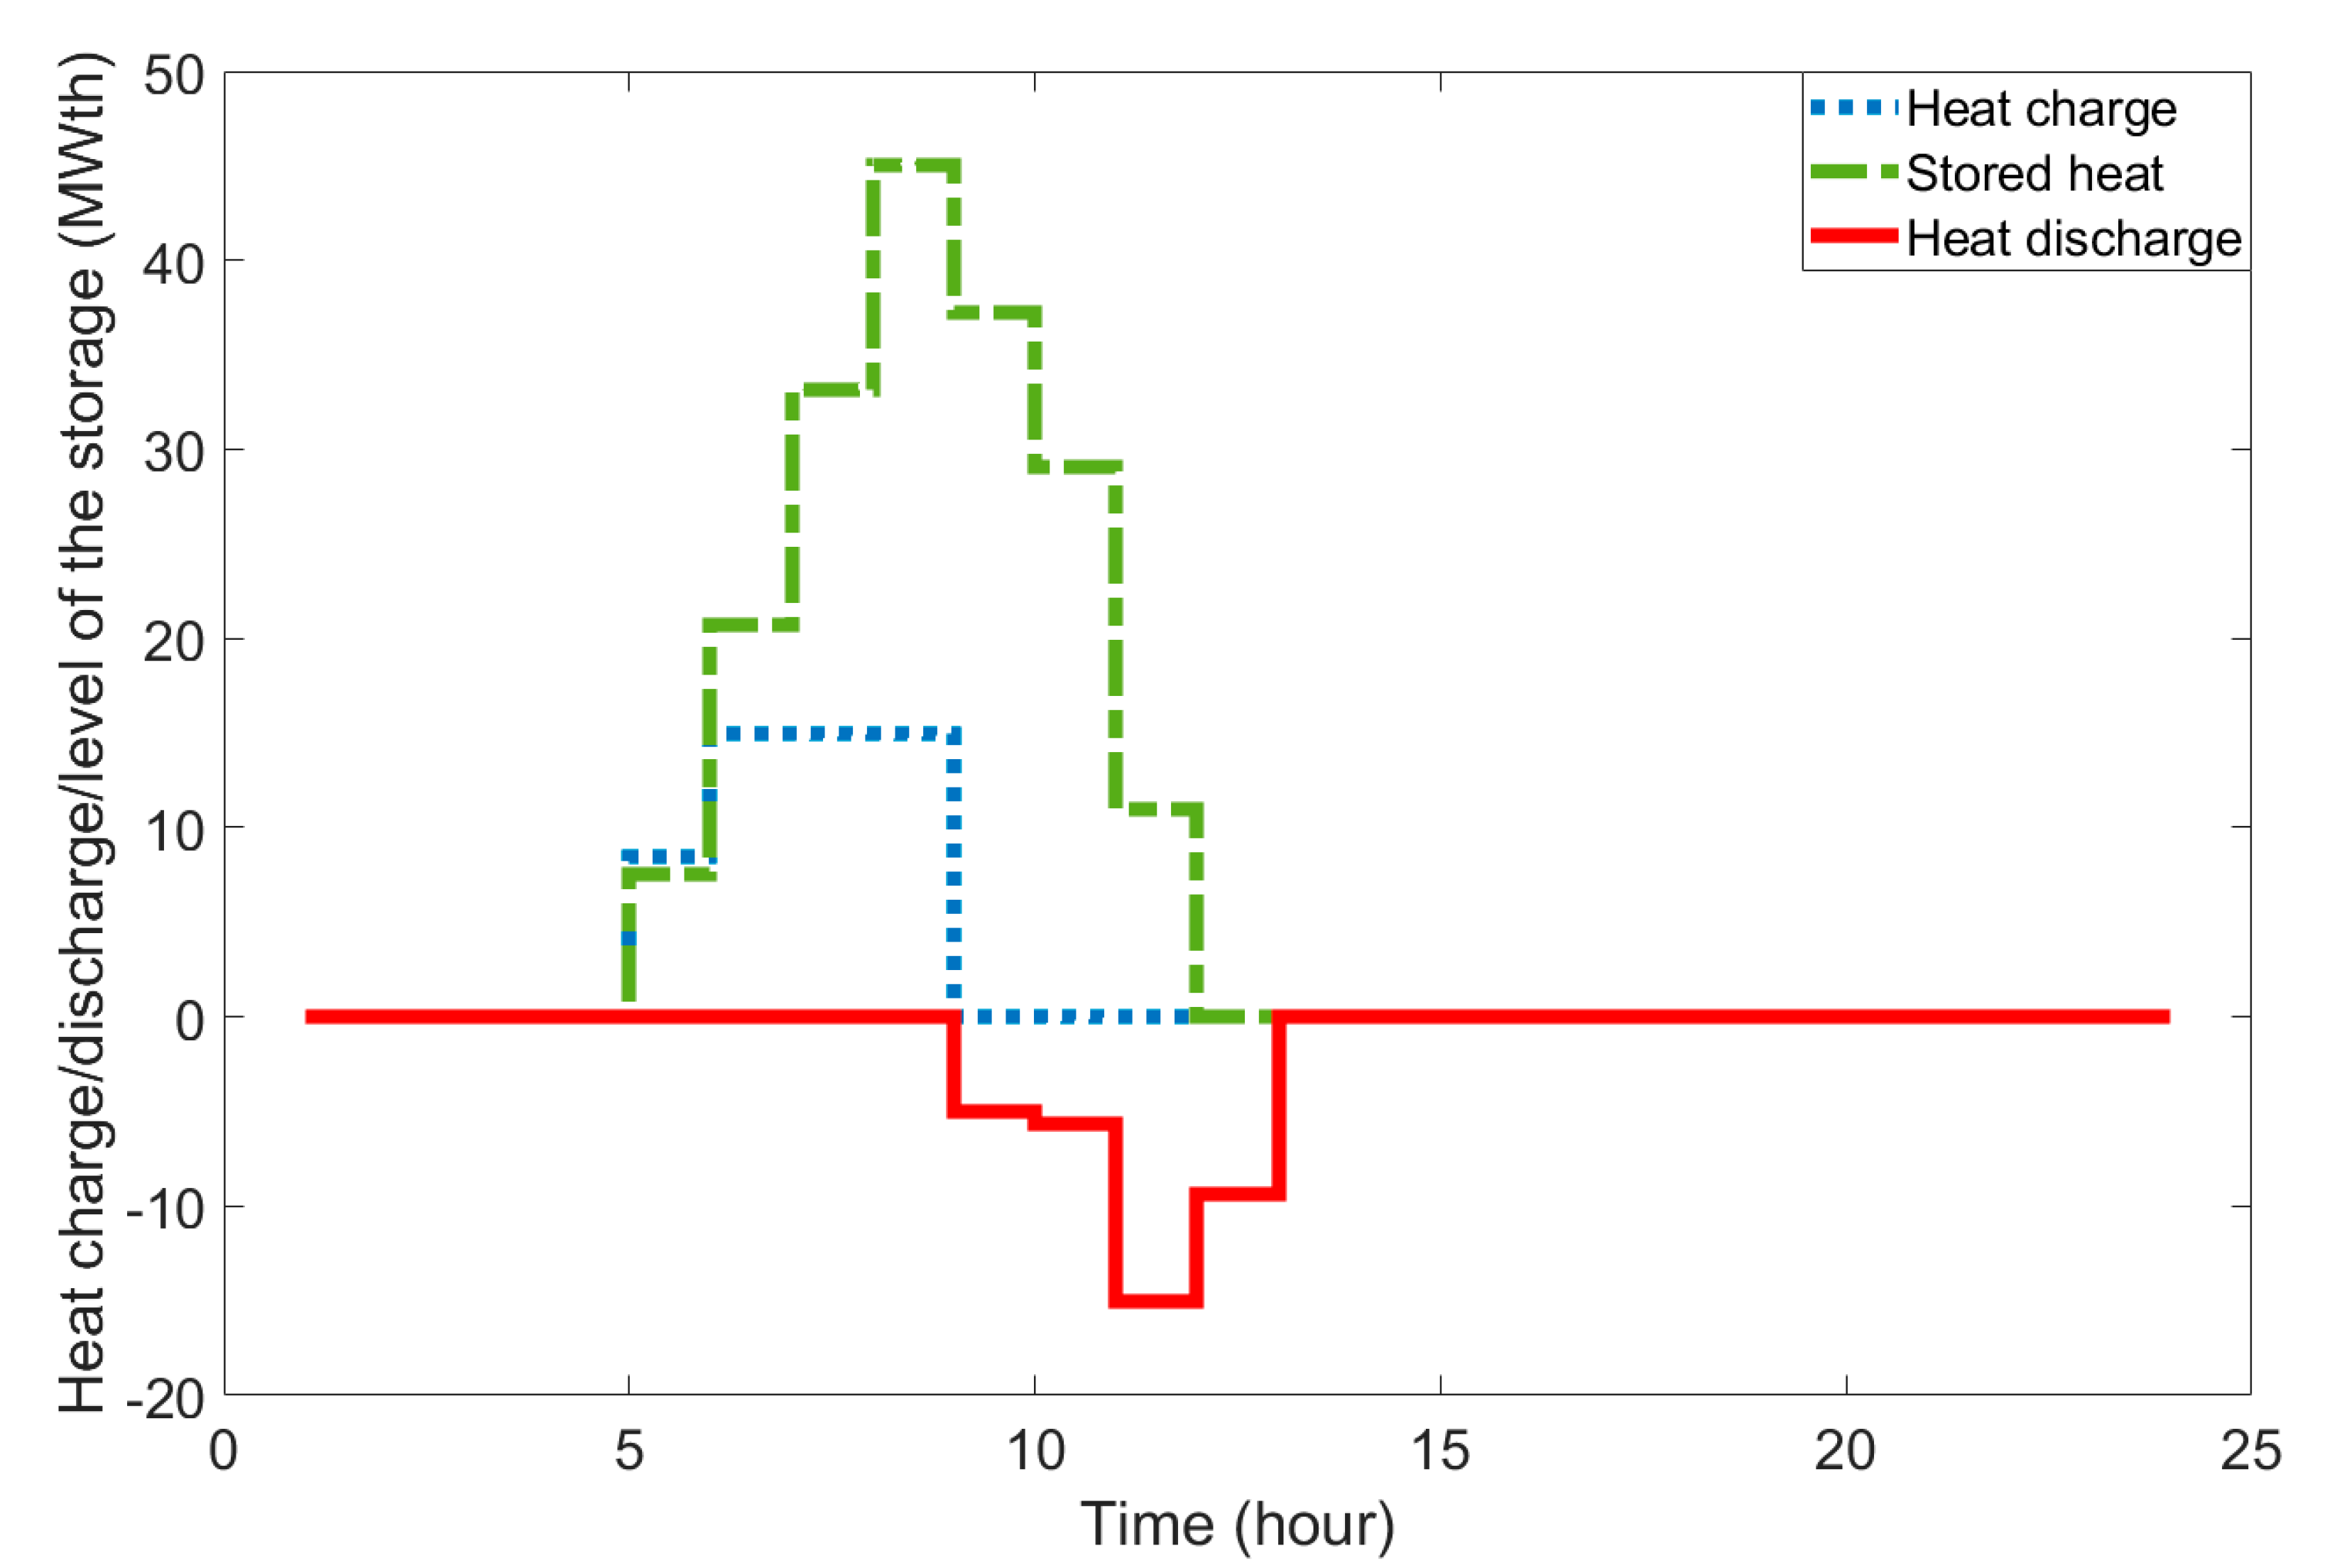
The CHP plant supplies the total heat demand of the system, which has an interdependency with the power supply of the plant. The heat generation of the CHP unit during the 24-h scheduling time horizon is shown in Figure 12, which shows that the heat supply of the plant is more than the heat load that is shown in Figure 4 at the time interval from t = 5 h to t = 8 h and when the heat supply is less than the heat load at a time duration from t = 9 h to t = 12 h, which highlights the role of the thermal energy storage system. The heat charge/discharge of the thermal energy storage technology as well as the scheduling for thermal energy stored in this storage is depicted in Figure 13 based on (26)–(29), which helps the system to store excess heat at off-peak time intervals and discharge it at on-peak time intervals. The optimal set points of the thermal energy storage are selected using the optimization solver to minimize the operation cost of the system.
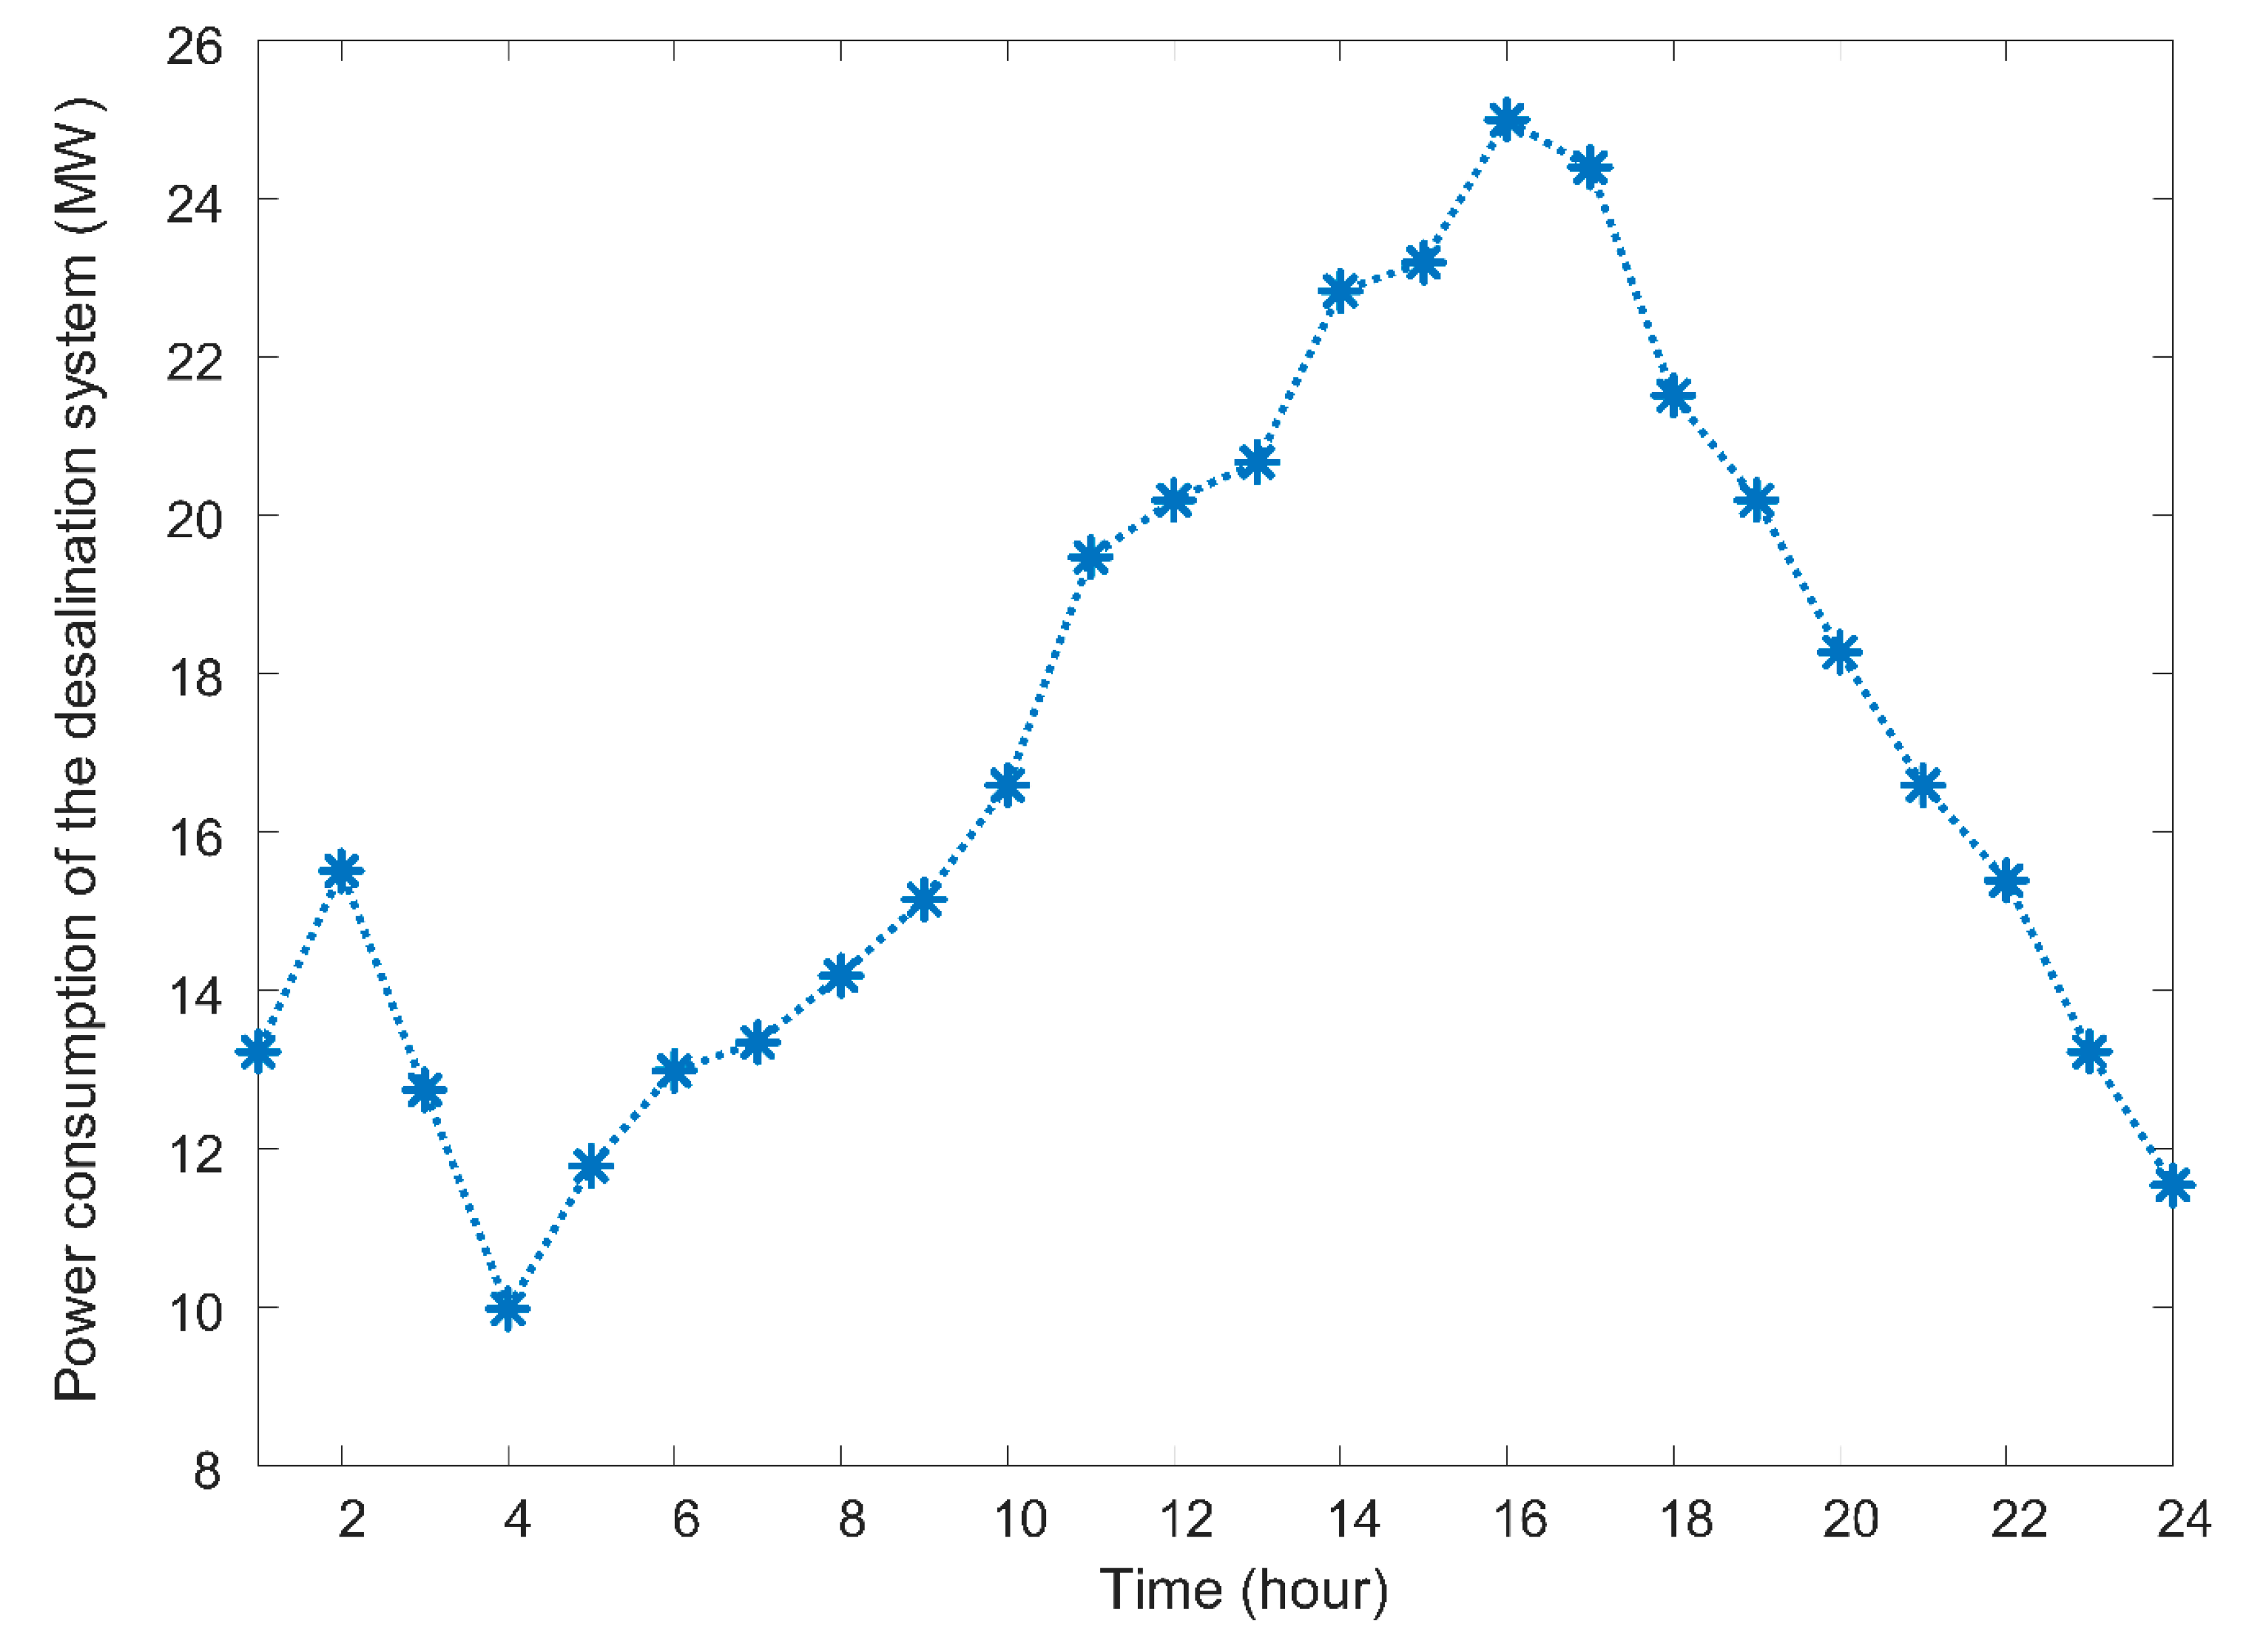
The power consumption of the water desalination system to satisfy the shown water demand is obtained as shown in Figure 14, which is based on (31) and (32). The desalination plant has consumed a total electrical energy of 405.17 MW from bus 5 of the power system within the 24-h scheduled time interval. The power supply of the wind turbine during the studied time horizon is shown in Figure 15, which is injected to bus 5 of the power network. The total power supply of the wind turbines installed in the system is attained as 713.92 MW.

5. Conclusions

This study presented an IGDT-based robust operation of multi-carrier energy networks with power, gas, heating, and water carriers considering the thermal energy storage system. In the proposed model, the network operator is responsible for managing an uncertain electrical energy load and analyzing the role of load variation in the optimal operation strategy of the whole energy system. Accordingly, the robustness and opportunity functions for the multi-carrier network based on the IGDT method are presented to be used by the system operator in making proper decisions on the system operation, considering the electrical energy load. The results for the multi-carrier energy system elements are reported for three scenarios, including risk-neutral, risk-averse, and risk-taker according to positive, negative, and neutral aspects of the uncertain parameter. Considering the risk-averse strategy, the multi-carrier energy system operator decides to pay more money for generating sufficient electrical energy to be more robust against power demand uncertainty. On the other hand, considering the risk-taker strategy, the operator attains benefits within the probable decrement of power demand according to the dependency of the operation cost of the multi-carrier network on the whole used power. The role of the thermal energy storage system in the operation of the multi-carrier energy system was also analyzed by reporting the heat charge/discharge of the thermal energy storage technology as well as the scheduling for thermal energy stored, which verified the optimal scheduling of the thermal energy storage in managing the heat load of the system. Future works will be focused on the investigation of new demand, consisting of an air-conditioning and battery system with the penetration of solar cells as well as considering the uncertainty associated with weather prediction [39]. Additionally, resilience is of great importance in the operation of a multi-carrier energy system and can be concentrated on in a future study.

Author Contributions

Conceptualization, M.N.-H.; methodology, M.N.-H.; software, M.N.-H.; validation, M.N.-H., B.M.-I., S.A.; formal analysis, B.M.-I., S.A.; investigation, M.N.-H., B.M.-I., S.A.; resources, M.N.-H., B.M.-I., S.A.; data curation, M.N.-H.; writing—original draft preparation, M.N.-H.; writing—review and editing, B.M.-I., S.A.; visualization, M.N.-H.; supervision, B.M.-I., S.A.; project administration, M.N.-H.; supervision, B.M.-I., S.A.; funding acquisition, M.N.-H.; supervision, B.M.-I., S.A. All authors have read and agreed to the published version of the manuscript.

Funding

This research is supported by Iran National Science Foundation (INSF) under grant No. 97016932.

Conflicts of Interest

The authors declare no conflict of interest.

Appendix A

Table A1. Nomenclature.
TTotal time duration
NENumber of power plants
NGWNumber of gas suppliers
tTime interval
nPower plant
S U n , t / S D n , t Start-up/shut-down cost of the non-gas-fueled power unit at each time interval
s u n / s d n Start-up/shut-down price of non-gas- fueled power unit
S U G n , t / S D G n , t Start-up/shut-down gas consumption of gas-fired power plant at each time interval
s u g n / s d g n Start-up/shut-down gas usage rate of gas-fueled power unit
P n , t The power supply of plant
FThe operation cost of plants
OObjective function
P n min / P n max Min/max power limit of plants
R n u p / R n d n Ramp up/down of generation units
I n , t On/off status of power plant
P w f , t The power output of the wind turbine
D j , t Electrical energy load of the system
P F L , t Power flow through the system lines
δ b , t Voltage angle of the bus of the electrical energy system
x L Power system line reactance
P F L max Power transmission capacity of the power system line
F p l , t Gas transmission through the gas pipeline
π m , t The gas pressure of the gas system node
π m min / π m max Min/max gas pressure of gas system node
G W g , t Supplied gas by the gas supplier
G L l , t Gas load
G W g min / G W g max Min/max gas supply
G L l min / G L l max Min/max gas load
an, bn, cn, dn, en, fnGas consumption/operation cost coefficients of the power unit
P w a t e r , t Power usage of the water carrier
P d e s a , t Power usage of the desalination system
P p u , w , t Power usage of the water well pump
P p u , s t , t Power usage of the water source pump
B h s , t The thermal energy level of the thermal storage system
H S h s , t c h Thermal energy charge of the thermal storage system
H S h s , t d i s Thermal energy discharge of the thermal storage system
η h s c h Thermal energy charging efficiency of the thermal storage system
η h s d i s Thermal energy discharging efficiency of the thermal storage system
η h s Thermal storage efficiency
B h s Min / B h s Max Min/max heat storage capacity of the thermal storage system
B h s Max , charge / B h s Max , discharge Maximum charge/discharge rate of the thermal storage system
W L t Water load at each time
W d e s a , t Water generation of the desalination system
C ( q , l ) System model
lUncertain nature of energy loads
qDecision variable
α ^ ( C r ) Resistance rate of the optimal energy management schedule
β ^ Minimum amount of α
l m , h , l ^ m , h Real and predicted load
C r Critical amount
C b Lowest bound of the operation cost
αUncertainty rate
β ^ ( C 0 ) The lowest rate of uncertainty that network operation cost cannot surpass a critical amount Cr

References

  1. Tan, S.; Wang, X.; Jiang, C. Optimal Scheduling of Hydro–PV–Wind Hybrid System Considering CHP and BESS Coordination. Appl. Sci. 2019, 9, 892. [Google Scholar] [CrossRef] [Green Version]
  2. Nazari-Heris, M.; Mehdinejad, M.; Mohammadi-Ivatloo, B.; Babamalek-Gharehpetian, G. Combined heat and power economic dispatch problem solution by implementation of whale optimization method. Neural Comput. Appl. 2019, 31, 421–436. [Google Scholar] [CrossRef]
  3. Tang, J.; Yu, T.; Zhang, X.; Li, Z.; Chen, J. Multi-Searcher Optimization for the Optimal Energy Dispatch of Combined Heat and Power-Thermal-Wind-Photovoltaic Systems. Appl. Sci. 2019, 9, 537. [Google Scholar] [CrossRef] [Green Version]
  4. Zeng, Q.; Fang, J.; Li, J.; Chen, Z. Steady-state analysis of the integrated natural gas and electric power system with bi-directional energy conversion. Appl. Energy 2016, 184, 1483–1492. [Google Scholar] [CrossRef]
  5. Liu, J.; Sun, W.; Harrison, G.P. The economic and environmental impact of power to hydrogen/power to methane facilities on hybrid power-natural gas energy systems. Int. J. Hydrog. Energy 2019, in press. [Google Scholar] [CrossRef]
  6. Bai, L.; Li, F.; Cui, H.; Jiang, T.; Sun, H.; Zhu, J. Interval optimization based operating strategy for gas-electricity integrated energy systems considering demand response and wind uncertainty. Appl. Energy 2016, 167, 270–279. [Google Scholar] [CrossRef] [Green Version]
  7. Maggio, G.; Nicita, A.; Squadrito, G. How the hydrogen production from RES could change energy and fuel markets: A review of recent literature. Int. J. Hydrog. Energy 2019, in press. [Google Scholar]
  8. Li, Z.; Wu, W.; Wang, J.; Zhang, B.; Zheng, T. Transmission-constrained unit commitment considering combined electricity and district heating networks. IEEE Trans. Sustain. Energy 2015, 7, 480–492. [Google Scholar] [CrossRef]
  9. Ali Shaabani, Y.; Seifi, A.R.; Kouhanjani, M.J. Stochastic multi-objective optimization of combined heat and power economic/emission dispatch. Energy 2017, 141, 1892–1904. [Google Scholar] [CrossRef]
  10. Sadat-Mohammadi, M.; Asadi, S.; Habibnezhad, M.; Jebelli, H. Robust scheduling of multi-chiller system with chilled-water storage under hourly electricity pricing. Energy Build. 2020, 218, 110058. [Google Scholar] [CrossRef]
  11. Nazari-Heris, M.; Mohammadi-Ivatloo, B.; Gharehpetian, G.B.; Shahidehpour, M. Robust short-term scheduling of integrated heat and power microgrids. IEEE Syst. J. 2018, 13, 3295–3303. [Google Scholar] [CrossRef]
  12. Li, G.; Zhang, R.; Jiang, T.; Chen, H.; Bai, L.; Li, X. Security-constrained bi-level economic dispatch model for integrated natural gas and electricity systems considering wind power and power-to-gas process. Appl. Energy 2017, 194, 696–704. [Google Scholar] [CrossRef]
  13. Alabdulwahab, A.; Abusorrah, A.; Zhang, X.; Shahidehpour, M. Coordination of interdependent natural gas and electricity infrastructures for firming the variability of wind energy in stochastic day-ahead scheduling. IEEE Trans. Sustain. Energy 2015, 6, 606–615. [Google Scholar] [CrossRef]
  14. Zeng, Q.; Zhang, B.; Fang, J.; Chen, Z. A bi-level programming for multistage co-expansion planning of the integrated gas and electricity system. Appl. Energy 2017, 200, 192–203. [Google Scholar] [CrossRef]
  15. Nazari-Heris, M.; Sadat-Mohammadi, M.; Mirzaei, M.A.; Asadi, S.; Mohammadi-Ivatloo, B.; Jebelli, H. Robust Energy Management of Integrated Power Infrastructure and Gas Networks with High Penetration of Renewable Energy Sources; CRC: Tempe, AZ, USA, 2020. [Google Scholar]
  16. Alipour, M.; Zare, K.; Seyedi, H. A multi-follower bilevel stochastic programming approach for energy management of combined heat and power micro-grids. Energy 2018, 149, 135–146. [Google Scholar] [CrossRef]
  17. Lu, S.; Gu, W.; Zhou, J.; Zhang, X.; Wu, C. Coordinated dispatch of multi-energy system with district heating network: Modeling and solution strategy. Energy 2018, 152, 358–370. [Google Scholar] [CrossRef] [Green Version]
  18. Widl, E.; Jacobs, T.; Schwabeneder, D.; Nicolas, S.; Basciotti, D.; Henein, S.; Noh, T.G.; Terreros, O.; Schuelke, A.; Auer, H. Studying the potential of multi-carrier energy distribution grids: A holistic approach. Energy 2018, 153, 519–529. [Google Scholar] [CrossRef]
  19. Adamek, F.; Arnold, M.; Andersson, G. On decisive storage parameters for minimizing energy supply costs in multicarrier energy systems. IEEE Trans. Sustain. Energy 2013, 5, 102–109. [Google Scholar] [CrossRef]
  20. Martinez-Mares, A.; Fuerte-Esquivel, C.R. A unified gas and power flow analysis in natural gas and electricity coupled networks. IEEE Trans. Power Syst. 2012, 27, 2156–2166. [Google Scholar] [CrossRef]
  21. Liu, X. Combined Analysis of Electricity and Heat Networks. Ph.D. Thesis, Cardiff University, Cardiff, UK, 2013. [Google Scholar]
  22. Shabanpour-Haghighi, A.; Seifi, A.R. An integrated steady-state operation assessment of electrical, natural gas, and district heating networks. IEEE Trans. Power Syst. 2015, 31, 3636–3647. [Google Scholar] [CrossRef]
  23. Bouwmans, I.; Hemmes, K. Optimising energy systems: Hydrogen and distributed generation. In Proceedings of the Second International Symposium on Distributed Generation: Power System and Market Aspects, Stockholm, Sweden, 2–4 October 2002; pp. 1L–7L. [Google Scholar]
  24. Geidl, M.; Andersson, G. Optimal power flow of multiple energy carriers. IEEE Trans. Power Syst. 2007, 22, 145–155. [Google Scholar] [CrossRef]
  25. Moeini-Aghtaie, M.; Abbaspour, A.; Fotuhi-Firuzabad, M.; Hajipour, E. A decomposed solution to multiple-energy carriers optimal power flow. IEEE Trans. Power Syst. 2013, 29, 707–716. [Google Scholar] [CrossRef]
  26. Shabanpour-Haghighi, A.; Seifi, A.R. Simultaneous integrated optimal energy flow of electricity, gas, and heat. Energy Convers. Manag. 2015, 101, 579–591. [Google Scholar] [CrossRef]
  27. Shabanpour-Haghighi, A.; Seifi, A.R. Multi-objective operation management of a multi-carrier energy system. Energy 2015, 88, 430–442. [Google Scholar] [CrossRef]
  28. Nojavan, S.; Majidi, M.; Zare, K. Performance improvement of a battery/PV/fuel cell/grid hybrid energy system considering load uncertainty modeling using IGDT. Energy Convers. Manag. 2017, 147, 29–39. [Google Scholar] [CrossRef]
  29. Nazari-Heris, M.; Mirzaei, M.A.; Mohammadi-Ivatloo, B.; Marzband, M.; Asadi, S. Economic-environmental effect of power to gas technology in coupled electricity and gas systems with price-responsive shiftable loads. J. Clean. Prod. 2020, 244, 118769. [Google Scholar] [CrossRef]
  30. Mirzaei, M.A.; Yazdankhah, A.S.; Mohammadi-Ivatloo, B.; Marzband, M.; Shafie-khah, M.; Catalão, J.P. Stochastic network-constrained co-optimization of energy and reserve products in renewable energy integrated power and gas networks with energy storage system. J. Clean. Prod. 2019, 223, 747–758. [Google Scholar] [CrossRef] [Green Version]
  31. Moradi-Dalvand, M.; Nazari-Heris, M.; Mohammadi-ivatloo, B.; Galavani, S.; Rabiee, A. A Two-Stage Mathematical Programming Approach for the Solution of Combined Heat and Power Economic Dispatch. IEEE Syst. J. 2019, in press. [Google Scholar] [CrossRef]
  32. Fan, H.; Lu, J.; Li, Z.; Shahidehpour, M.; Zhang, S. Optimal Planning of Integrated Electricity-Gas System with Demand Side Management. IEEE Access 2019, 7, 176790–176798. [Google Scholar] [CrossRef]
  33. Nazari-Heris, M.; Abapour, S.; Mohammadi-Ivatloo, B. Optimal economic dispatch of FC-CHP based heat and power micro-grids. Appl. Therm. Eng. 2017, 114, 756–769. [Google Scholar] [CrossRef]
  34. Zare, K.; Moghaddam, M.P.; El Eslami, M.K.S. Demand bidding construction for a large consumer through a hybrid IGDT-probability methodology. Energy 2010, 35, 2999–3007. [Google Scholar] [CrossRef]
  35. Mirzaei, M.A.; Yazdankhah, A.S.; Mohammadi-Ivatloo, B. Stochastic security-constrained operation of wind and hydrogen energy storage systems integrated with price-based demand response. Int. J. Hydrog. Energy 2019, 44, 14217–14227. [Google Scholar] [CrossRef]
  36. Li, J.; Fang, J.; Zeng, Q.; Chen, Z. Optimal operation of the integrated electrical and heating systems to accommodate the intermittent renewable sources. Appl. Energy 2016, 167, 244–254. [Google Scholar] [CrossRef]
  37. Nazari-Heris, M.; Mohammadi-Ivatloo, B.; Gharehpetian, G.B. A comprehensive review of heuristic optimization algorithms for optimal combined heat and power dispatch from economic and environmental perspectives. Renew. Sustain. Energy Rev. 2018, 81, 2128–2143. [Google Scholar] [CrossRef]
  38. Alabdulwahab, A.; Abusorrah, A.; Zhang, X.; Shahidehpour, M. Stochastic security-constrained scheduling of coordinated electricity and natural gas infrastructures. IEEE Syst. J. 2015, 11, 1674–1683. [Google Scholar] [CrossRef]
  39. Wang, D.; Wu, R.; Li, X.; Lai, C.S.; Wu, X.; Wei, J.; Xu, Y.; Wu, W.; Lai, L.L. Two-stage optimal scheduling of air conditioning resources with high photovoltaic penetrations. J. Clean. Prod. 2019, 241, 118407. [Google Scholar] [CrossRef]
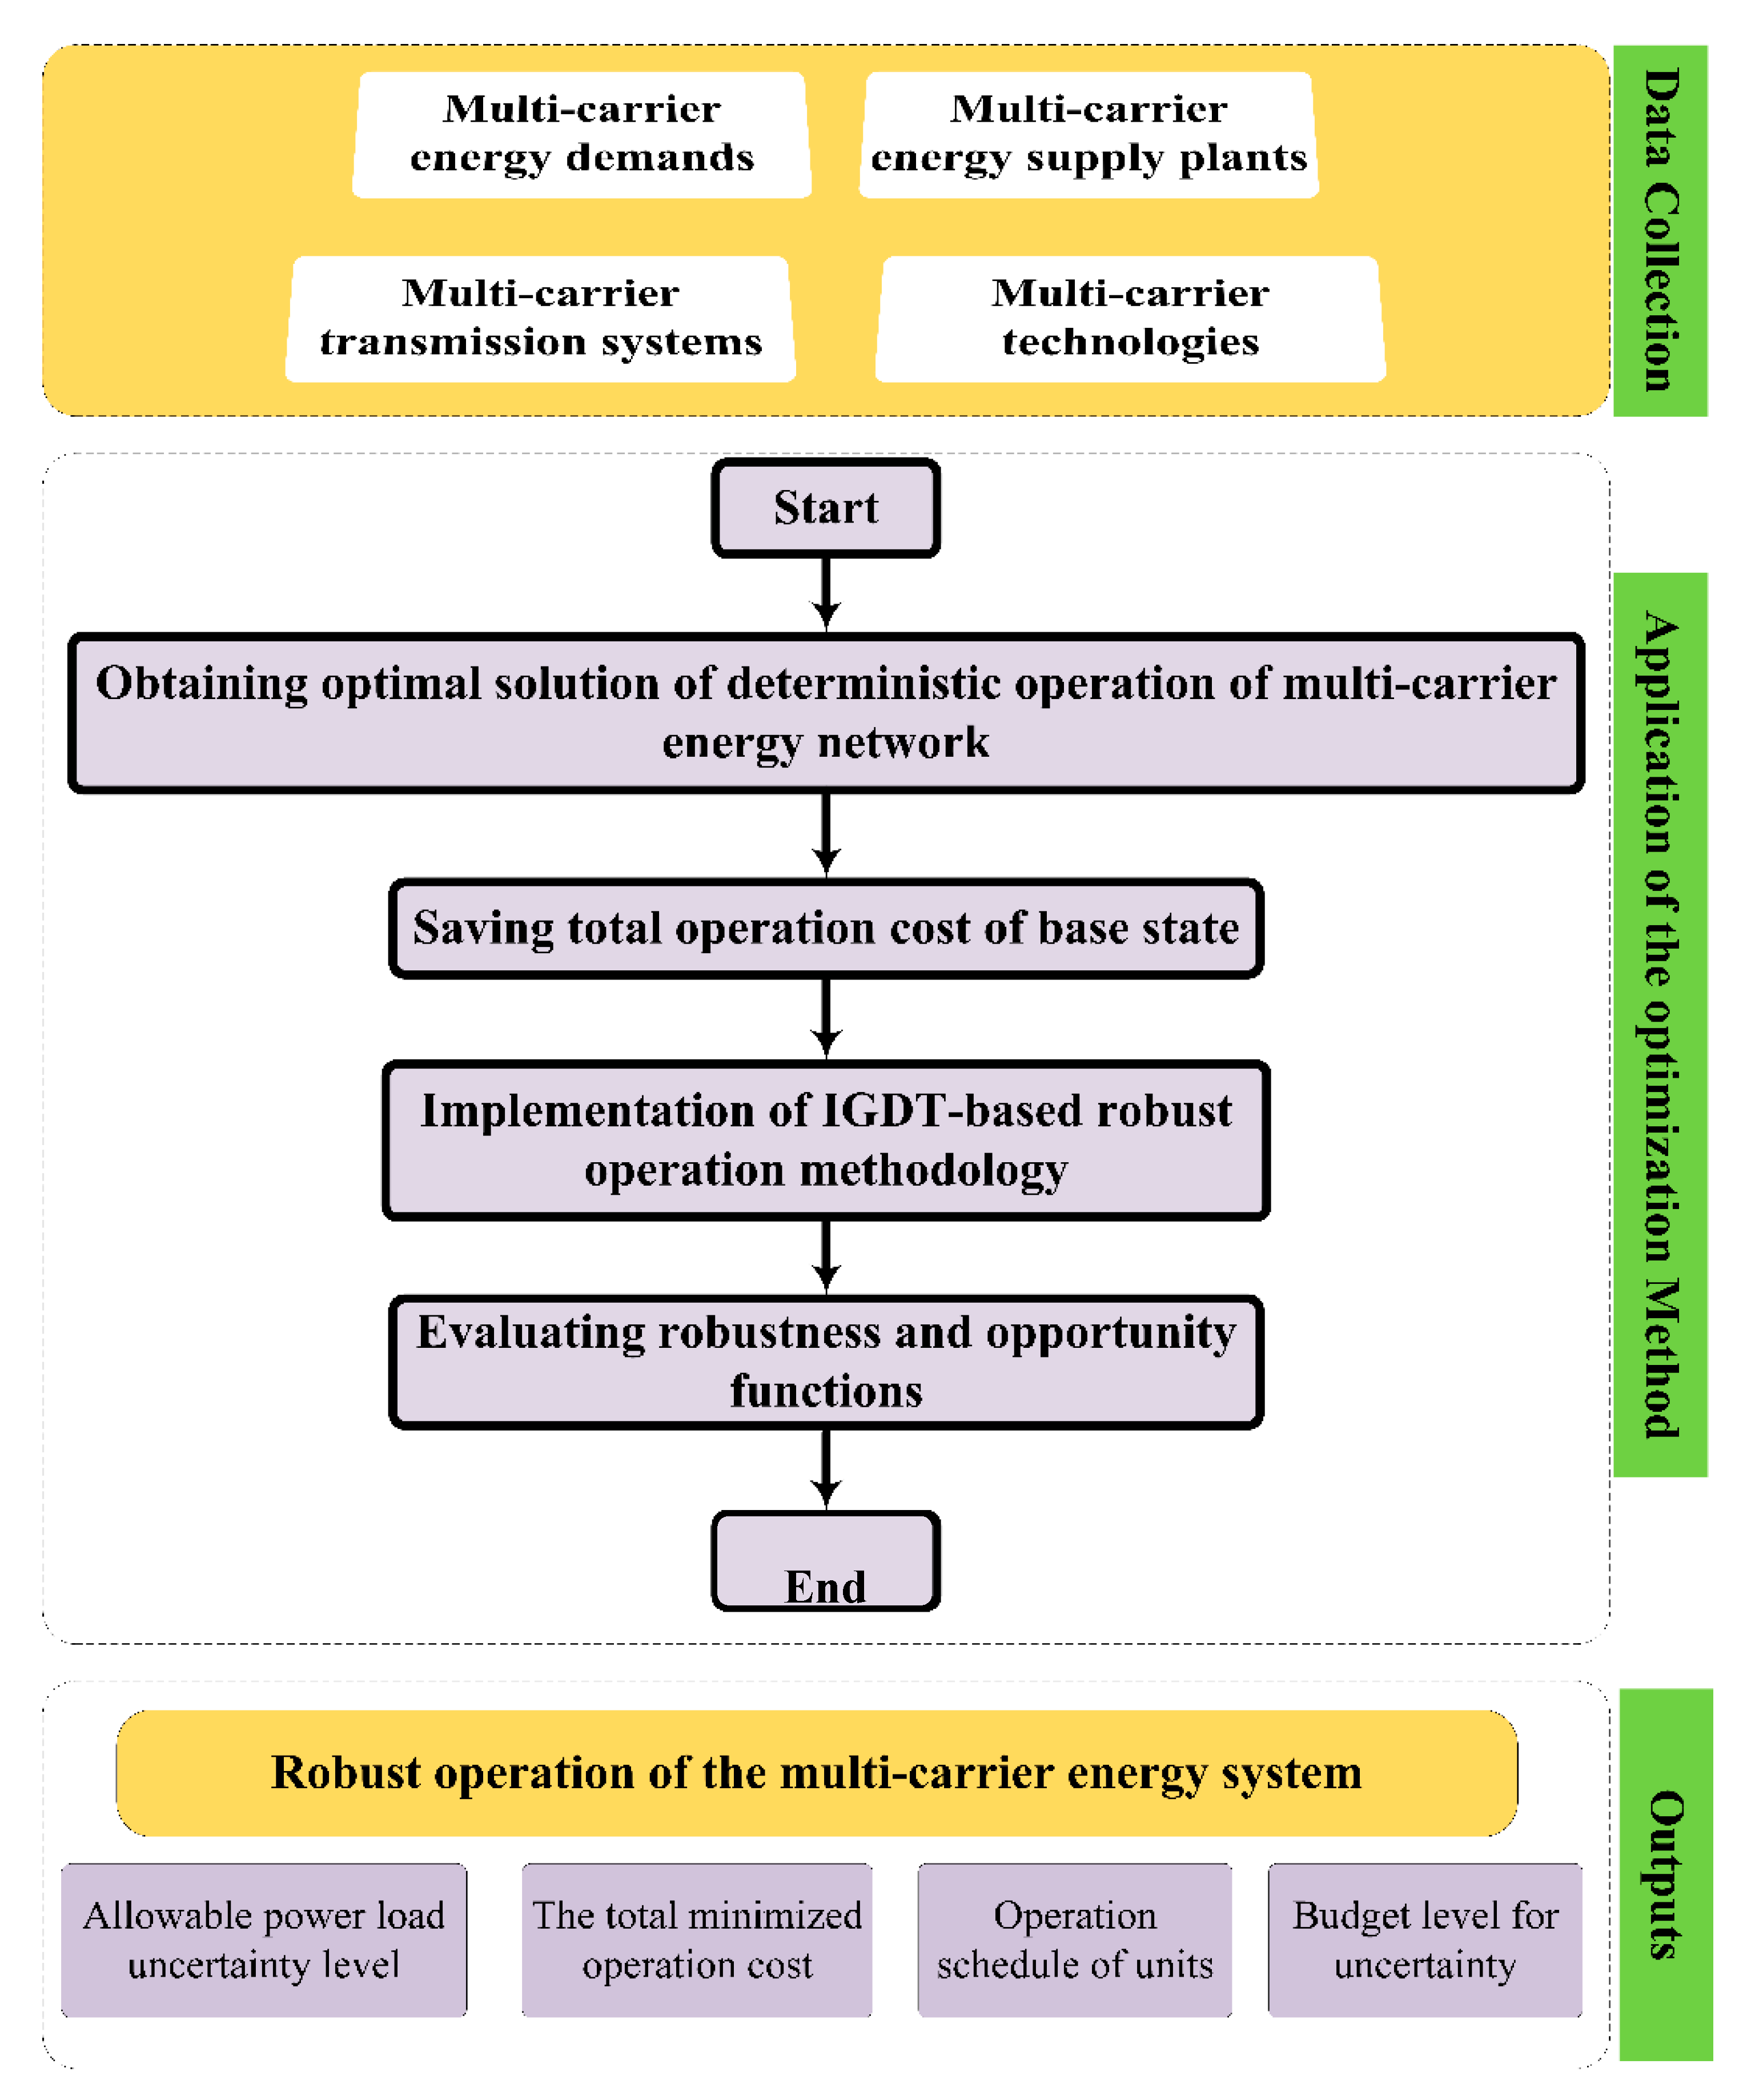
Figure 1. The presented framework for the robust scheduling of multi-carrier energy networks.
Sustainability 12 05158 g001
Figure 2. Feasible operation region (FOR) of the combined heat and power (CHP) plant.
Sustainability 12 05158 g002
Figure 3. The studied multi-carrier energy network.
Sustainability 12 05158 g003
Figure 4. The energy loads of the studied multi-carrier energy system.
Sustainability 12 05158 g004
Figure 5. The relationship between operation cost and robustness function.
Sustainability 12 05158 g005
Figure 6. The relation between the operation cost and the opportunity function.
Sustainability 12 05158 g006
Figure 7. The power production schedule of the CHP plant.
Sustainability 12 05158 g007
Figure 8. The power production schedule of the gas-fired G1 plant.
Sustainability 12 05158 g008
Figure 9. The power production schedule of the non-gas-fueled G2 plant.
Sustainability 12 05158 g009
Figure 10. The gas consumption of the CHP plant.
Sustainability 12 05158 g010
Figure 11. The gas usage of the gas-fueled plant, G2.
Sustainability 12 05158 g011
Figure 12. The heat generation of the CHP plant.
Sustainability 12 05158 g012
Figure 13. The schedule of thermal storage.
Sustainability 12 05158 g013
Figure 14. The power usage of the water desalination unit.
Sustainability 12 05158 g014
Figure 15. The power production of the wind turbines.
Sustainability 12 05158 g015
Table 1. Comparison of the proposed robust operation model and other studies.
ReferenceType of Energy CarriersUC ProblemModeling Networks ConstraintsModeling Uncertain ParameterThe Implemented Uncertainty-Handling Method
[8]Power and heat--
[9]Power and heat---Stochastic
[10]Power and heat--Robust-stochastic
[11]Power and gas---
[12]Power and gas---
[30]Power and gasStochastic
[17]Power, gas, and heating---
[22]Power, gas, and heating---
[28]Power, gas, and heating--IGDT
[29]Power, gas, and heatingTwo-stage stochastic
Proposed modelPower, gas, water, and heatingIGDT
Table 2. Characteristics of the thermal energy storage [35,36,37,38].
Data of the Thermal Energy Storage Technology
B h s Max (MWth) B h s Min (MWth) B h s Max , charge (MWth) B h s Max , discharge (MWth) B h s Min , charge B h s Min , discharge (MWth) η h s η h s c h , η h s d i s
6001515095%90%