Article

Measuring the Gaps in the Projected Image and Perceived Image of Rural Tourism Destinations in China’s Yangtze River Delta

1
Faculty of International Tourism Management, City University of Macau, Avenida Padre Tomás Pereira Taipa, Macau, China
2
Department of Geography and Resource Management, The Chinese University of Hong Kong, Shatin, N.T., Hong Kong, China
3
School of Geography, University of Leeds, Woodhouse, Leeds LS2 9JT, UK
4
Department of Social Sciences, Education University of Hong Kong, 10 Lo Ping Rd, Tai Po, N.T. Hong Kong, China
*
Author to whom correspondence should be addressed.
Sustainability 2020, 12(12), 5121; https://doi.org/10.3390/su12125121
Submission received: 24 May 2020 / Revised: 11 June 2020 / Accepted: 20 June 2020 / Published: 23 June 2020
(This article belongs to the Section Sustainable Urban and Rural Development)

Abstract

:
Destination Marketing Organizations (DMOs) at all levels have an ultimate goal of building strong and positive images for their destinations. However, the projected image from the supply side is not necessarily the mirror of the perceived image from the demand side. This study adopted the content analysis method to evaluate the projected image and perceived image of rural destinations in China to see whether there is any discrepancy between and within the two categories. Comparative analysis of different information sources including web contents and on-site visitor interviews were processed. The evaluation of image congruency demonstrates that official websites focus more on cognitive image elements (knowledge and beliefs of the place). Besides promoting attractions, it provides information on geography background and promotes local culture. Business web content promotes attractions, package tour, and activities which can generate revenue. The perceived image includes more sentiment contents: on-site visitors expressed more negative attitude, but social media comments are relatively positive.

1. Introduction

Rural tourism has been a popular trend in China since the end of the 20th century [1,2]. However, rural tourism has a particularly weak image, and there is relatively limited research on destination image in the rural destination [3,4,5,6,7]. Prior studies on destination image have seldom focused on rural destinations and, in particular, comparing rural destination images from different information sources. Although rural tourism is becoming increasingly popular among urban residents, there is an apparent lack of research on rural tourism destination images in the context of the online environment in China [8,9].
Numerous studies have categorized the tourism destination image into the projected image and the perceived image [10,11,12]. From the supply side, which consists of Destination Marketing Organizations (DMOs) and commercial entrepreneurs, the image that they try to promote and show to tourists is called the projected image, while from the demand side, the image of a destination formed inside the tourists’ mind, which includes both cognitions and feelings, is called the perceived image [10,13,14,15,16,17,18]. Previous scholars have argued that the projected image and perceived image of tourism destinations have a significant influence on tourists’ choice of destination and their satisfaction [19,20,21,22].
Koltringer and Dickinger [23] reported that a critical criterion for testing whether destination image construction is successful involves observing whether the projected image is identical to the perceived image. Since there are varied information sources, it is difficult to measure the gaps between the projected image and perceived image in the process of destination image construction [10]. Although a number of studies have compared the gaps between the projected image and perceived image [12,24,25,26], few studies have attempted to discover the gaps within the projected image and within the perceived image due to different sources of information. Moreover, limited research in this regard has been conducted in the context of rural tourism destinations. Therefore, this study measures the image congruency within and between the projected image and perceived image of rural tourism destinations based on different information sources, taking rural destinations in China’s Yangtze River Delta as a case study.
This study has three main objectives. First, it identifies the image gaps within the projected image from the supply side of rural tourism. Second, it examines the image gaps from the perspective of rural tourists, who represent the demand side. Finally, this study tests the image congruency between the projected image and perceived image of rural destinations in the Yangtze River Delta and provides implications for rural tourism practitioners.

2. Literature Review

2.1. Rural Destination Image and Rurality

Previous researches stated that rurality is “imaged rural idyll” with a unique set of cultural meanings attached to the rural place [27,28]. Most of the rural tourism destinations focus on the concept of “rurality” in the process of image building because it is the main attraction to tourists [9]. Existing literature has generated three theoretical concepts for rurality, which are in terms of area, social production of existence, and regulation [29]. With the impact of globalization, nowadays, rurality is always materialized and presented commercially [27]. It could be viewed as a tourist imaginary on a rural destination, which significantly influences tourist motivation and behavior. Therefore, it is crucial to develop an appropriate rural image to meet the needs of tourists seeking “rurality” and promote rural tourism development. Currently, rural areas are involved in the process of globalization, and rural economies are experiencing a transformation. The traditional livelihood is being transformed from agriculture to a new economy based on the commercialization of rural space [30]. Woods [30] points out that it is fundamentally essential to utilize marketing techniques to avoid homogenization of rural spaces. Vik and Villa [31] believe that rural communities can transform pessimism into optimism through active image construction; therefore, they support “image-based rural development.” It has also been suggested that the rural image should be flexible and that marketers should carefully consider the impact of the image since it can alter reality.

2.2. Projected and Perceived Destination Image

The image projected by DMOs and commercial entrepreneurs plays an essential part in promoting a destination. Many destinations spend large amounts of money on developing an appealing image to attract more visitors [20,32,33,34,35]. Since an image can be an asset for a place, destinations should develop promotional materials to create, reinforce, or alter the destination to attract visitors [36,37]. Tasci and Gartner [36] mentioned that if destination management authorities create an unrealistic image of a destination, the image of that place will ultimately be damaged. Therefore, projecting the appropriate image to visitors is highly important.
Tourists develop organic images of destinations based on various information sources, such as books, TV, radio programs, and the opinions of family or friends [36,38]. Currently, the Internet is the primary source of information, and it influences people’s general impression of a destination [39].
An induced image is altered based on an organic image. It emerges when people are interested in visiting a place and thus look for more information from multiple approaches, such as promotions and advertisements by travel agencies and tourism websites [40].
Fakeye and Crompton [41] described the formation of the perceived image in a model summarizing different image types and components, as well as its function in forming the image of a place. At the very beginning, there is an organic image [42,43,44]. When motivated to travel, people seek more information and develop an induced image [45,46]. By evaluating and comparing the images of alternative destinations, people make decisions on where to go [47,48,49]. Finally, after visiting a destination, people form a more complex and comprehensive image. This image generated from their trip helps them make decisions and select travel destinations in the future [39,50,51]. This model interprets the formation of tourists’ perceived image of a destination. The projected image and the perceived image function together and form the destination image, which can affect tourist behavior [52,53]. Tasci and Gartner [36] described this process as a “dynamic and reciprocal system.” In this system, the authors characterized image formation factors as controllable (supply side), semi-controllable (independent), and uncontrollable (demand side). Controllable and semi-controllable factors are also regarded as image capital. All of these factors have bi-directional impacts on destination image in terms of both image types and image components. Koltringer and Dickinger [23] argued that “strong destination brand images occur when a DMO’s projected image is similar to stories reported by other information sources.” Therefore, it is necessary to study both the projected image and perceived image of a destination and observe the image congruency between the two sides.

2.3. Destination Image Components

Along with the rapid development of technology, “creating destination image is no longer a one-way ‘push’ process of mass communication but a dynamic one of selecting, reflecting, sharing, and experiencing” [16] (p. 165). At present, the Internet has not only reshaped the way tourism information is distributed but also the way people plan to travel [54,55,56,57]; thus, it has become a significant destination image determinant. The abundance and variety of websites have provided online platforms for both tourism authorities and tourists to share information. However, the images created based on diverse information sources are not necessarily the same. Scholars have begun to draw attention to the image gaps between the official destination images promoted by DMOs and user-generated content (UGC) online [10,26,39,58]. Online destination images have become the focus of research and powerful tools for destination management and marketing [16,17,59,60]. However, online images of rural destinations have scarcely been studied. In general, it is widely accepted that destination image is mainly composed of cognitive and affective attributes, which means that visitors’ impression of a place contains both “beliefs” and “feelings”: the cognitive components are the beliefs and knowledge related to the physical aspects of a destination, while the affective components are evaluations of the emotional feelings towards the place [50,61,62,63]. The following research gaps are identified in this study. First, limited research has focused on the image gaps within the projected image and the perceived image. Different sources of information have not been compared. Second, most previous studies on destination image have been at the country, region, or city scale, while limited studies have been conducted at a much smaller scale, such as that of rural destinations. Furthermore, previous studies have mainly focused on one specific destination instead of investigating from a broader perspective. Therefore, this study aims to fill these research gaps.

3. Methodology

In this study, the projected image and perceived image are further categorized based on different information sources, including both online information and on-site respondents. Projected images are obtained online from the websites of DMOs and entrepreneurs. The destination image that they projected is a major source for potential tourists to gain information about the destination [23,38]. For the perceived image, online comments about a destination can be viewed by potential tourists and thus influence visit intentions [64]. Further information on the perceived image is obtained from on-site visitors; such information is also important due to the influential power of word-of-mouth.
Accordingly, three hypotheses are proposed (Figure 1):
Hypothesis 1 (H1).
On the tourism supply side, there is a gap between the projected image from DMOs and the projected image from tourism entrepreneurs.
Hypothesis 2 (H2).
On the tourism demand side, there is a gap between the perceived image from on-site visitors and the perceived image from UGC.
Hypothesis 3 (H3).
In general, there is a gap between the projected image from the tourism supply side and the perceived image from the tourism demand side.
Three sites were selected for this study: the Yaxi, Dongping, and Moganshan towns in the Yangtze River Delta. The three sites share many common characteristics. First, all of them are located near urban centers; second, they share similar economic development levels, areas, and population sizes; third, they are all designated “unique towns” in terms of tourism development in China.

3.1. Data Collection and Cleaning

Data selection is the first step. The data set was obtained from both website contents and on-site interviews. For projected images, official websites and business websites were used, while for perceived images, on-site interviews and online comments were collected. The samples include the three official websites of the three study sites, i.e., Cittaslow China (www.chinacittaslow.com/), Mogan Mountain (www.mogan-mountain.com), and Chongming Travel (www.cmtravel.com.cn); the five most popular online travel agencies (OTAs), i.e., Mafengwo (http://www.mafengwo.cn), Ctrip (http://www.ctrip.com/), Elong (www.elong.com), Qunar (www.qunar.com), and TripAdvisor (www.tripadvisor.com); and interviews from on-site respondents. Relevant documents were collected by a web crawling application that can help capture the contents of webpages from the selected websites.
The web crawling process was conducted from January to June 2018. All text posted on the selected websites related to the three study sites was collected during that period. For projected images, articles on official websites and business websites were downloaded. For perceived images, comments posted on the selected websites were collected.
The final data set collected was divided into four categories: DMO websites (165 articles), business websites (178 articles), UGC (310 online comments), and interviews (127 on-site respondents). These text contents were documented separately, and the documents were transformed into plain text for content analysis. To better analyze the text, data cleaning was conducted after data collection. Redundant paragraphs and headings were removed to avoid bias in the results [65]. In this research, NVivo 11 Pro, which is a text-mining software program based on artificial neural networks, was used for content analysis.

3.2. Semi-Structured Interviews

Interviews were conducted with on-site visitors in the Yaxi, Dongping, and Moganshan towns. Interview questions were semi-structured and are designed based on the components of destination image: first, the overall image of the place; second, the most important factors of this place (cognitive evaluations); third, the emotions towards the place (affective evaluations). Convenient sampling was adopted for visitor interviews. Booth [66] argued that, for visitor questionnaire surveys, researchers could not select samples from a list of survey population since “no such lists exist for on-site visitor surveys.” It was further suggested that on-site visitor surveys should be conducted based on survey days and locations [67]. Therefore, in this research, 30 survey days are divided evenly in the 3 study sites, which means ten days for each site. The ten survey days cover both peak season and low season in a year. Three days in July (summer holiday) and three days in early October (National Day holiday) were chosen as peak season, and four days in September were selected as low season. The interviews were conducted on July 10–18, September 1–12, and October 1–9 of 2018 at the three sites. In this research, 141 on-site visitors were interviewed, and 127 valid replies were collected at the three study sites; 59% of the interviewees are male, and 68% are female. Over 40% of the respondents are in the age group of 21–30. Most of them are visitors within the province (97%), and a small percent of them are from other provinces in China (20.5%) and other countries (3.1%). The demographic profile of the interviewees is shown in Table 1.

3.3. Content Analysis

3.3.1. Node Building and Data Coding

Previous studies [16,17,60,68] have tended to use computer-aided text analysis tools, such as CATPAC II, to analyze the most frequently used words. However, this approach is limited because it often generates a list of meaningless words [23,60]. To avoid this result, coding is necessary before analysis. Coding specific words and sentences into nodes will help to understand better the content of text since “many words of text can be classified into much fewer content categories” [69] (p. 7).
The coding process was conducted by the author and two research assistants who were fluent in both Chinese and English since the data coding was based on Chinese texts. First, the author and the research assistants conducted coding individually by placing the texts into the image categories and creating new nodes. Second, the results were compared and discussed together. Finally, all the text was coded into specific nodes based on the consensus of all three coders. In this way, the data accuracy was improved.
After the coding process, 27 nodes were developed and further categorized into four categories: two cognitive image factors (tourism products and tourism infrastructure) and four dimensions of affective image factors (pleasant-unpleasant, arousing-sleepy, exciting-gloomy, and relaxing-distressing). The list of nodes is presented in Table 2. The sources indicate the number of documents that contain the nodes. The references are the sentences that reflect the specific nodes in the documents.

3.3.2. Cluster Analysis

Cluster analysis was conducted after building the nodes [60,70]. NVivo helped generate a diagram that clusters selected sources if they are coded by many of the same nodes. The clusters were based on coding similarity. Cluster analysis was conducted to determine whether images from different information sources are congruent. Instead of merely using qualitative analysis, using cluster analysis to measure the gap in the rural destination images from different information sources represents a relevant methodological contribution of this study.

4. Results

4.1. Discrepancy in the Projected Image: DMO Websites versus Business Websites (Entrepreneurs) (Gap 1)

Table 3 shows that the top 10 most frequent nodes of the projected image on official websites are the geographical context, attractions, social and cultural elements, activities, biodiversity, rurality, environment quality, transportation, rural cuisine, and rural souvenir. This table demonstrates that official DMO websites exert more effort to promote the destination and to provide background information to tourists, especially regarding the top three aspects: the geographical context, attractions, and social and cultural elements. Example 1 is retrieved from a paragraph on the official website of Moganshan. It introduces the geographical context of the mountain, enriching the geological knowledge of website visitors.
Example 1.
The projected image on official websites.
“Moganshan was formed in the Late Jurassic movement of the Mesozoic and, later, the Himalayan movement. This period was accompanied by strong volcanic eruptions and magmatic intrusion activities, as well as the unbalanced rise and fall of the landscape, resulting in a volcanic uplift structure dominated by volcanic rocks. The main peak is 719 meters above sea level. The mountain body is oriented from north to east. The western part is characterized by low mountain erosion and eroded tectonic features, and the eastern part is characterized by erosion-piedmont plain features.” (adopted from the Moganshan official website)
The nodes of the projected image on business websites (Table 4) show that the top 10 most frequent nodes are attractions, the choice of accommodations, package tours, activities, the quality of accommodations, the price of accommodations, social and cultural elements, rurality, the geographical context, and transportation. From this list, we see that business websites mostly focus on promoting tourism products, such as attractions, accommodations, and package tours. Example 2 is obtained from the travel guide on Mafengwo, a popular travel website in China. The fact that it highlights the accommodations in Moganshan reflects the profit-oriented nature of entrepreneurs.
Example 2.
The projected image on business websites.
“Moganshan is most famous for its homestays. Some people say that even if you miss Moganshan Mountain, you should never miss the homestays in Moganshan. They are not traditional homestays. Instead, they integrate the elements of a boutique hotel. In general, it is suggested that you stay in Moganshan for at least two or three days, and during the stay, the local homestay is an indispensable quality experience.” (adopted from Mafengwo)
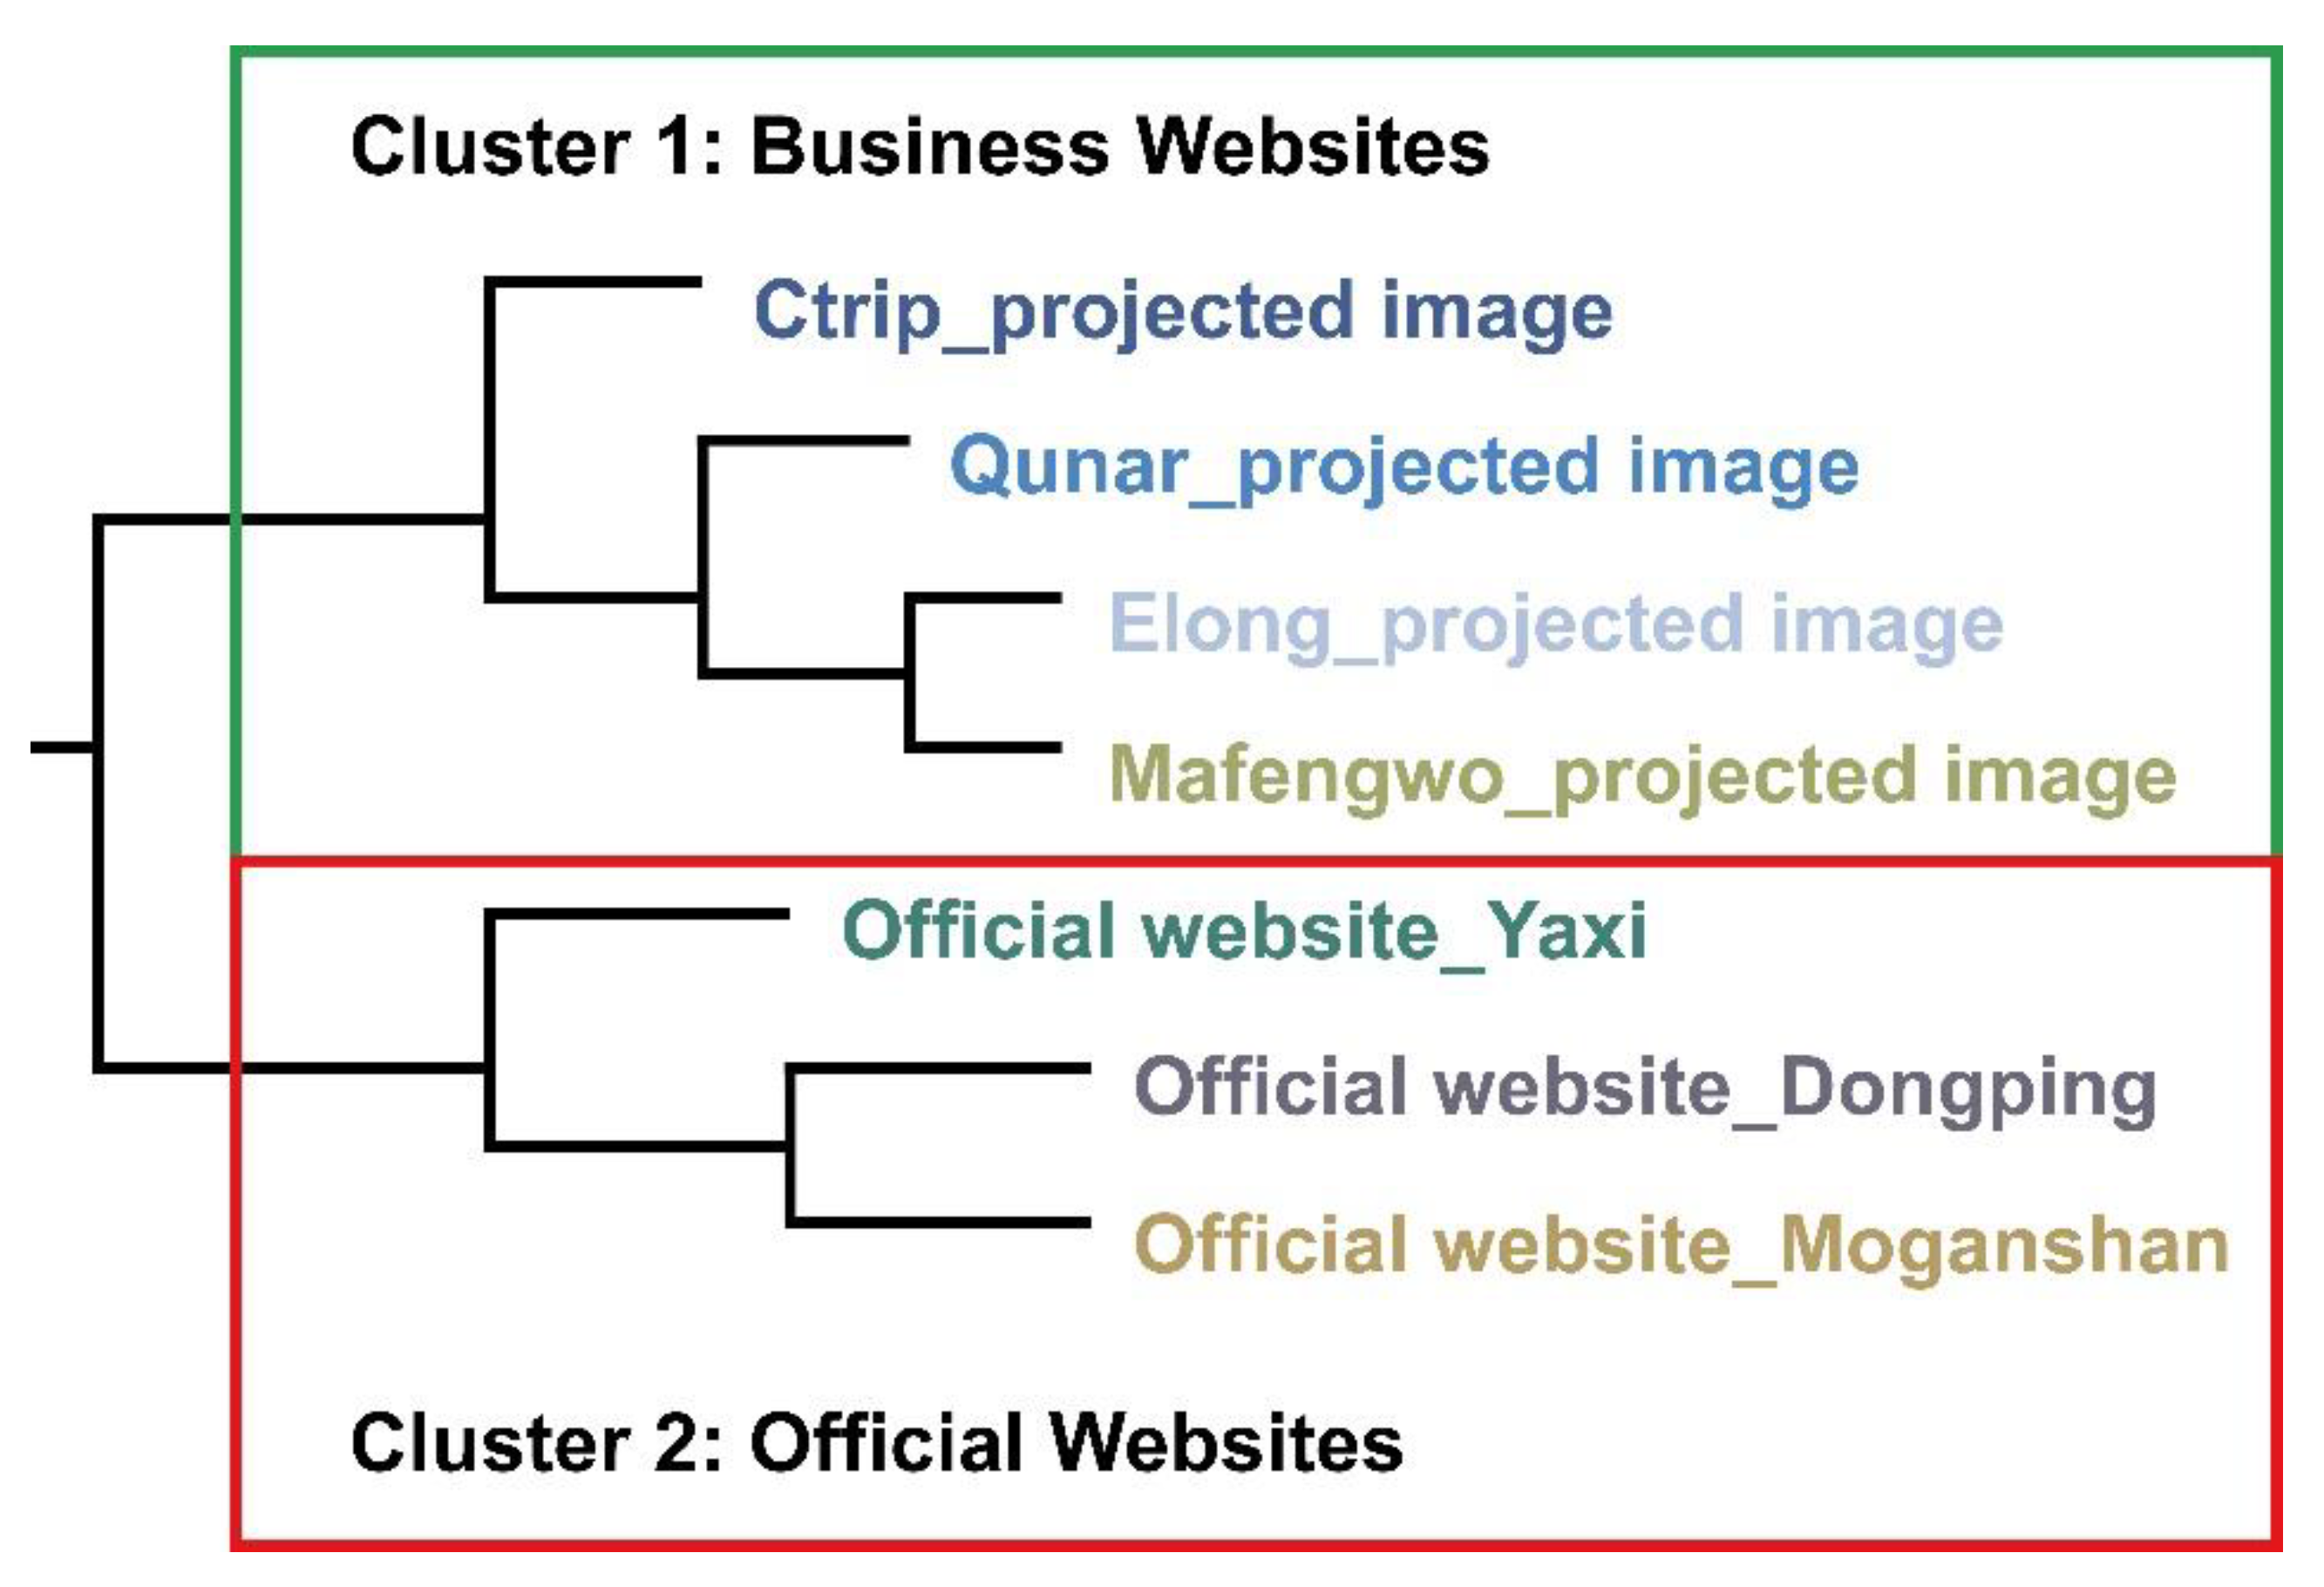
Cluster analysis confirms the gap and generates two major clusters (Figure 2), partitioning the official websites and the business websites. The dendrogram shows two main clusters, demonstrating that the business websites share more common nodes, while the official websites of DMOs show more similarities in terms of nodes. Therefore, the first hypothesis, which proposes that there is a gap between the projected image from DMOs and the projected image from tourism entrepreneurs, is accepted.
The cluster analysis shows that differences exist between the projected images on official websites and business websites. The texts on official websites provide more background information, including information on the geographical context, attractions, and social and cultural elements. From the texts, it can be inferred that DMOs aim to introduce and promote the destination. On the other hand, regarding business websites, we find that most of the information concerns attractions, accommodations, and package tours, which can directly generate revenue. This finding reflects the profit-oriented nature of business websites.

4.2. Discrepancy in the Perceived Image: UGC versus On-Site Interviews (Gap 2)

The nodes of comments on social media are presented in Table 5. The top 10 most frequent nodes are attractions, transportation, rurality, the destination is relaxing, activities, biodiversity, the destination is pleasant, the destination is arousing, geographical context, and social and cultural elements. The social media comments include not only information about the destination but also content related to sentiment. Many of the comments report that visitors feel that the place is relaxing and pleasant (Example 3), based on which we see that the majority of the sentiment content is positive. Previous scholars have found that affective image factors exert a more powerful influence on tourists’ behavioral intentions [71,72]. Thus, rural tourism proponents need to focus on online marketing to highlight contents that express positive sentiments, which may attract visitors to revisit and recommend destinations to others.
Example 3.
The perceived image from online comments.
“The Cittaslow is very close to Nanjing and takes more than an hour to drive to. When I went, there was a light rain. It would definitely be a nice choice to go on a sunny day. There are a lot of rape fields, and the village covers a large area. You can take a tour bus or rent a bike for excursions. I personally recommend cycling when the weather is good because it will be very relaxing! In short, it is a good destination for children and elderly people to visit.” (a comment about Yaxi town on the Ctrip website)
Regarding on-site visitors, there are both negative and positive sentiment contents (Table 6). A large proportion (7.39%) of the comments by on-site visitors indicate that the destination is sleepy, while 1.71% of the comments show that the destination is pleasant. On-site visitors were more concerned about rurality (1.76%). The other cognitive contents in the list of the top 10 most frequent nodes are environment quality, rural cuisine, attractions, activities, accommodation quality, and choices of accommodation. Interestingly, the sentiment component is the opposite of that in the perceived image from UGC. This finding shows that the satisfaction level of on-site rural visitors is lower than that obtained from online comments (Example 4).
Example 4.
The perceived image from on-site visitors.
“The environment of the Dongping Forest Park is not bad, but there are no entertainment facilities in the surrounding areas, and there are not many things to do. The homestay rural tourism conditions on Chongming Island are also not very good, and overall, it is a bit disappointing.” (comment from an on-site visitor in Dongping Town).
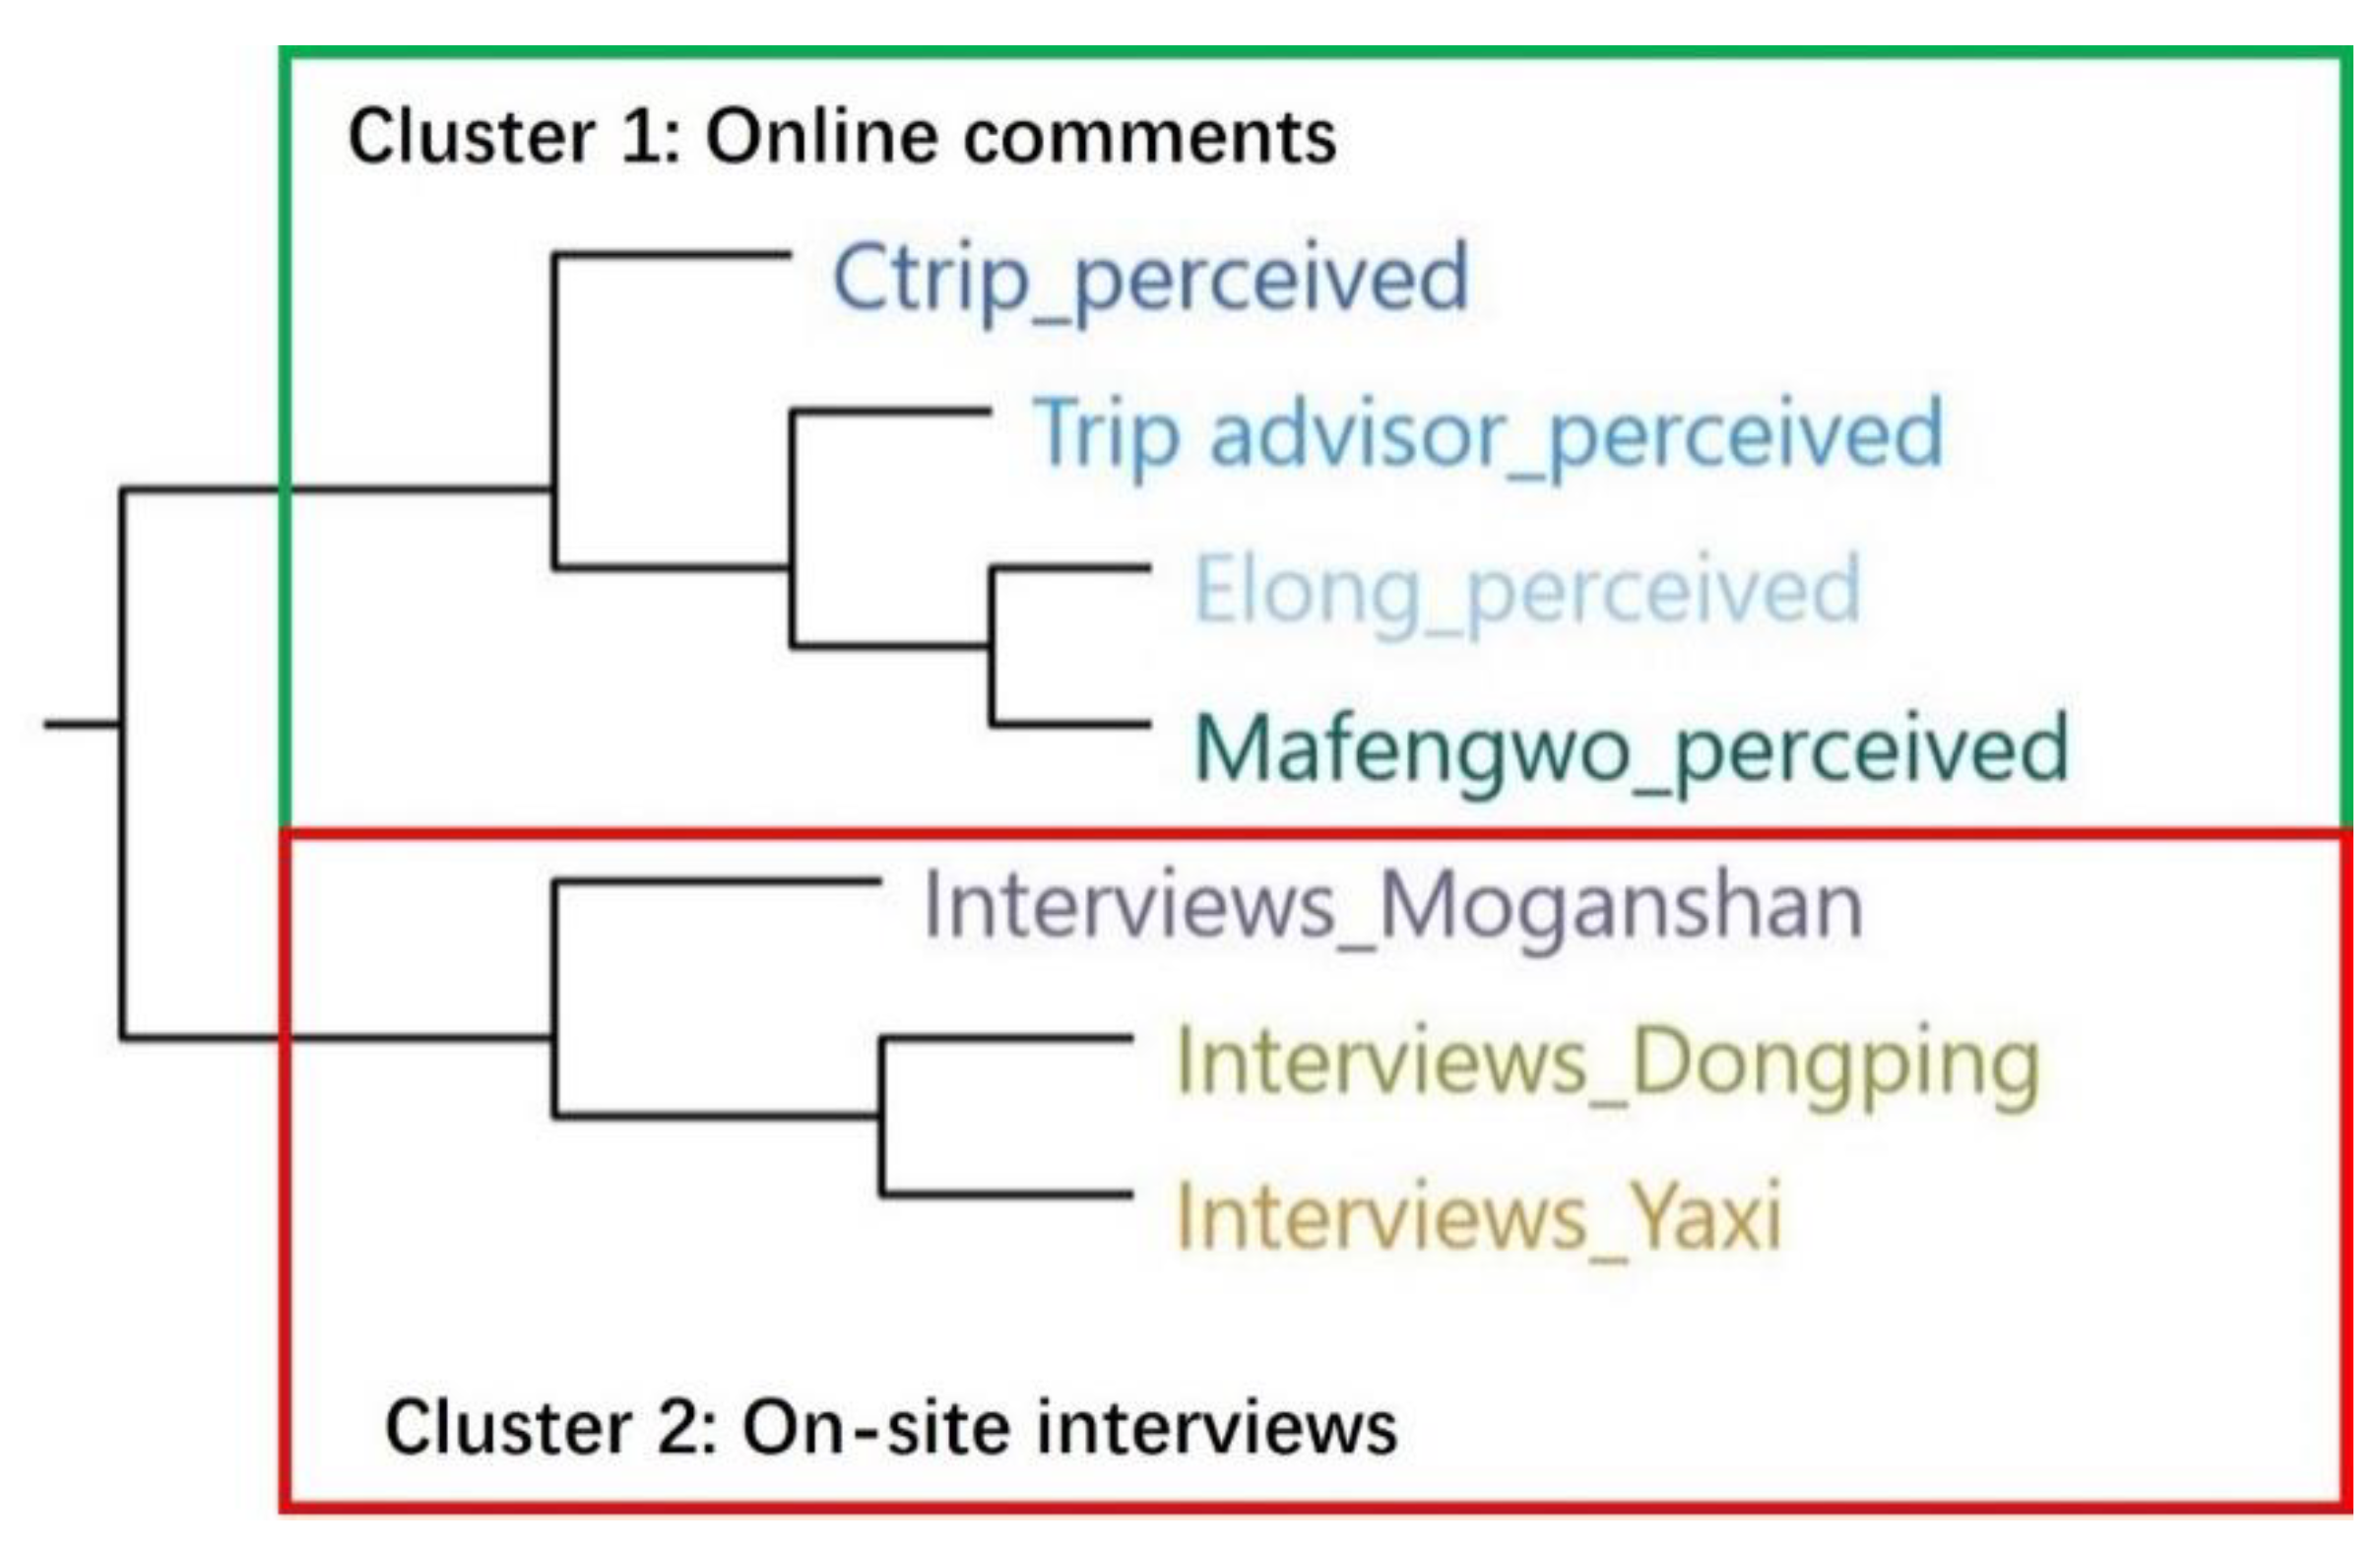
The cluster analysis results (Figure 3) visualize the differences, clearly partitioning the social media contents and on-site interviews. The results demonstrate that, on the tourism demand side, there is a gap between the perceived image from on-site visitors and the perceived image from UGC. Thus, the second hypothesis is also accepted. Examples 3 and 4 show that the online comments about a destination are usually more positive and more detailed than the comments by on-site visitors.

4.3. Discrepancy between the Projected Image and Perceived Image (Gap 3)

The overall projected image of rural tourism is illustrated in Table 7. Most of the projected image focuses on transportation, attractions, package tours, the choice of accommodations, the geographical context, social and cultural elements, activities, the quality of accommodations, rurality, and the price of accommodations. Cognitive image factors are dominant in the projected image. More descriptive words and informative content appear in the projected image from both official websites and business websites. In the list of the top 10 most frequent nodes, there are no sentiment or affective images involved.
Regarding the perceived image from both visitors online and on-site, more affective image and sentiment contents exist. The list of the top 10 most frequent nodes in Table 8 shows that rurality is the most frequently mentioned node, which indicates that the image of rurality is a crucial part of the rural tourism destination image. In addition to the cognitive image components, the perceived image from online and on-site visitors always contains personal feelings towards a destination. Both positive and negative contents are shown, while there are more positive contents than negative contents. Three affective image factors are included in the top 10 most frequent nodes, and two of them are positive: the destination is pleasant” and “the destination is relaxing.” The negative affective image factor is “the destination is sleepy.”
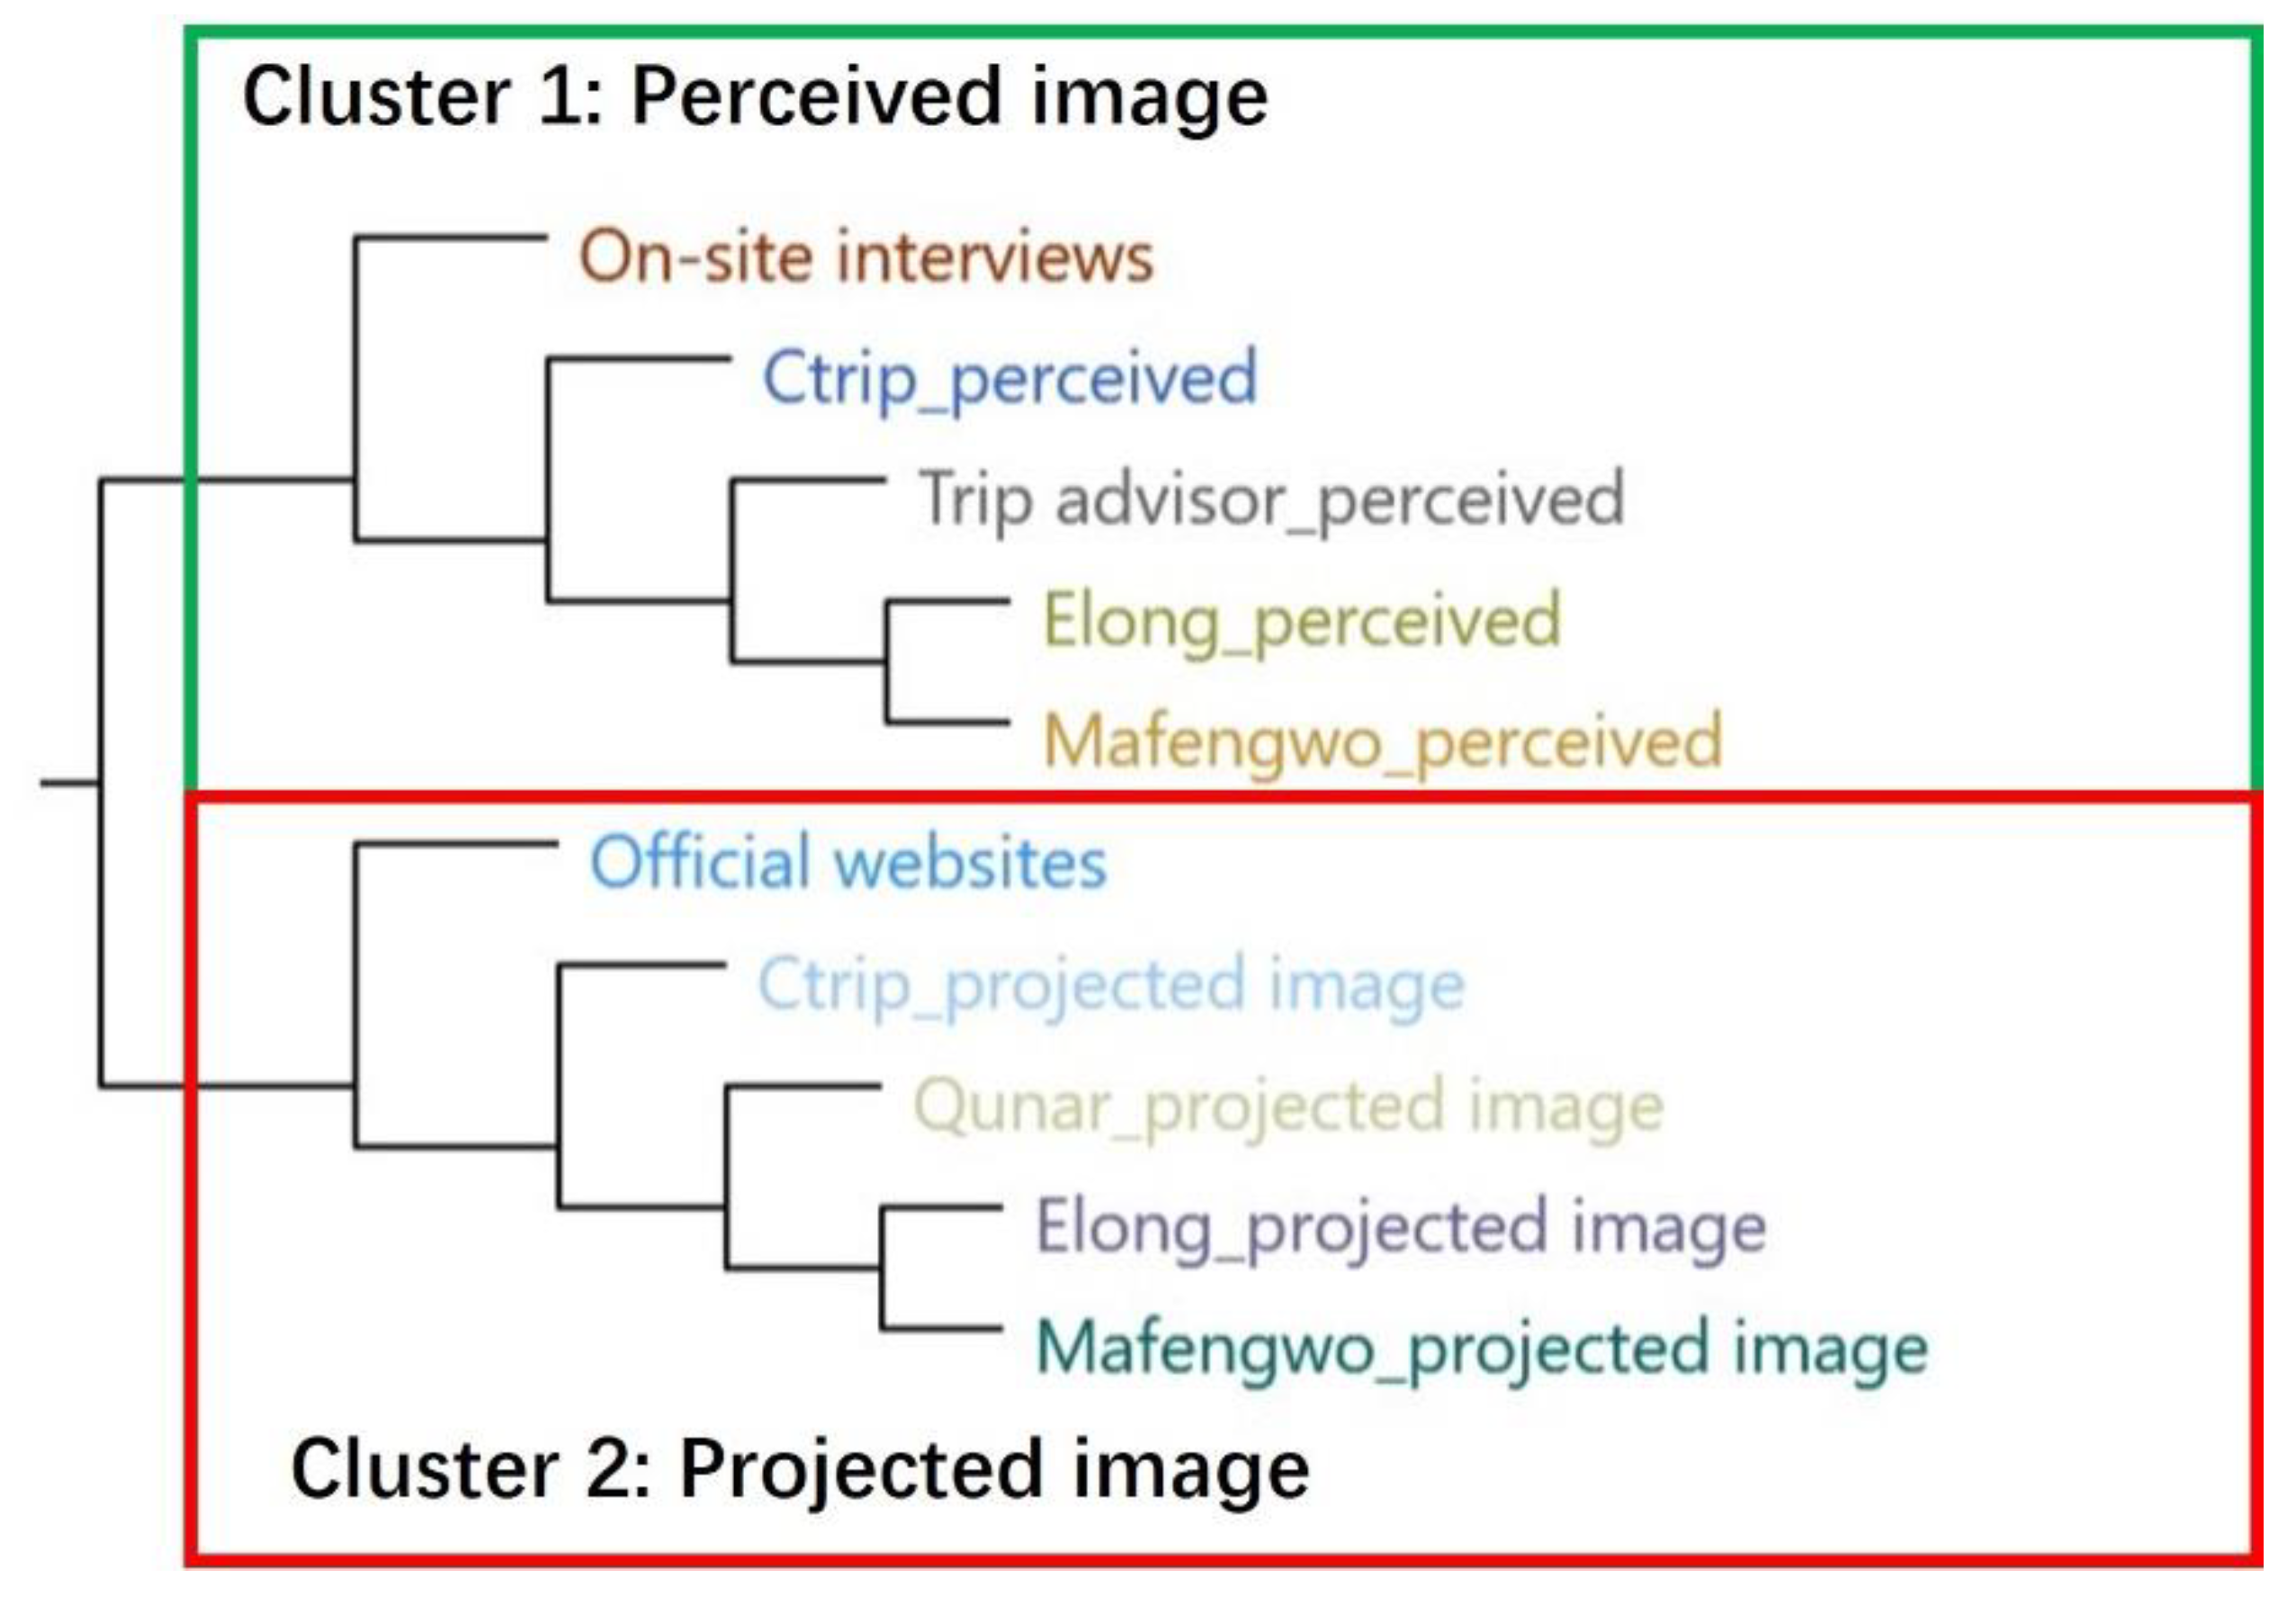
The cluster analysis (Figure 4) proves that there are differences between the overall projected image and perceived image of rural destinations in China, which shows that the third hypothesis is accepted. The contents obtained from online comments and on-site interviews contain more affective components, while the contents projected online from official websites and business websites emphasize cognitive components, such as the destination background, itinerary, transportation, and accommodations. Thus, there is a gap between the projected image from the tourism supply side and the perceived image from the tourism demand side.

5. Discussion and Conclusions

This paper studied rural destination image by using content analysis, and it assessed the congruency of the projected image and perceived image from different information sources. The study results demonstrate that our three research hypotheses are accepted. First, on the tourism supply side, there is a gap between the projected image from DMOs and the projected image from business websites. The different natures of the two groups result in the discrepancy within the projected image. As organizations that function to promote tourism destinations to potential tourists [73], DMOs tend to present a well-rounded image [74]. Therefore, the projected image contains more cognitive information, such as information on the geographical context, attractions, and social and cultural elements. However, DMOs are not the only organizations that project the image of a tourism destination. In contrast to the information provided by DMOs, the information provided on business websites focuses more on the services at destinations. Different from the information on DMO websites, business websites contain more information related to travel experience sharing, allowing potential customers to use these websites as a reference when selecting various tourism-related services or products at destinations. Such information can therefore exert a greater influence on tourists’ purchasing behavior than the information listed on DMO websites. This research also confirms with Echtner and Ritchie [75] that, although an organic image is not easily affected, the induced image of a destination can be manipulated by marketers through different promotional approaches. Therefore, the discrepancy between a different projected image may affect the induced image of potential visitors, and further influence on travel decisions.
Second, on the tourism demand side, there is a gap between the perceived image from on-site visitors and the perceived image from UGC. We find that online comments are generally more positive than comments from on-site respondents. This finding is consistent with previous studies indicating that people tend to leave online comments when they are satisfied [76,77]. It has been argued that blogs are perceived as being more credible than other marketing tools [78], and online comments usually serve as a significant reference for travel decision-making [79]. However, online images may be biased and filtered since there is a discrepancy between the comments of on-site visitors and online comments. Moreover, this study echoes with Zhou [9] that rurality is a primary attraction to rural tourists since it is mostly mentioned in the perceived image.
Third, there is a gap between the overall projected image from the tourism supply side and the perceived image from the tourism demand side. The projected image contains more cognitive components, while the perceived image involves more affective components. Previous scholars have argued that perceived images are significantly different from projected images [26,39], but this research not only identifies the gaps between the projected image and perceived image, it also investigates the discrepancies within different information sources of the projected image and the perceived image.
Finally, the results of this research provide directions for tourism marketing practitioners. Marketing strategies can be developed to improve the image congruency between and within both the supply side and demand side. For the supply side, image could be an asset for one destination; thus, destinations develop promotional materials to create, reinforce, or alter the destination to attract visitors [36,37]. Tasci and Gartner [36] mentioned that if the destination management authorities set up unrealistic image for one destination, it will finally hurt the image of that place because visitors cannot fulfill their expectation. Thus, it is of great importance to project the appropriate image to visitors. The DMOs should have a closer cooperation with tourism enterprises in terms of destination promotion. For instance, the interpretation and background information should be consistent to avoid causing confusion. As for the demand side, rurality is the most appealing thing perceived by tourists. Chigbu [80] defined rurality as a feeling of “homeliness” owned by people who share common culture and tradition of a rural place. This “homeliness” could be understood as a type of “cultural proximity,” which significantly improves the destination image when the tourists are culturally close to the destination [81] (p. 313). Therefore, rural destinations should enhance the authentic culture identity in the rural image building process. Moreover, destination marketers should be aware of the discrepancies between online comments and on-site responses. They need to enhance the contents with positive sentiments and address the negative image timely to ensure the congruency between what is projected by the destination and what is perceived by the tourist.

6. Limitations and Future Work

Overall, the current research has some major limitations. First, there are limitations in regard to site selection. Due to the breadth of rural areas in China, our selection of three sites in the Yangtze River Delta is insufficient to represent rural destinations overall. Second, only Chinese texts were collected online, and comments from other countries were not analyzed. Moreover, there were time and resource constraints. In terms of the data collected and analyzed, the time span was limited; additionally, the data collected from both online UGC and on-site visitors are insufficient.
Further studies can be conducted in several ways. First, the data collection can be expanded. In the current research, three rural destinations in the Yangtze River Delta were selected. Further research in other locations can be conducted to determine whether the situation is the same regarding rural tourism image. In regard to the perceived image of rural tourism destinations, more stakeholders can be involved in interviews in the future, such as residents, who play an important role in rural tourism destination image formation. Ayob [82] mentioned that it is crucial to understand how residents hope their place to be perceived by the visitors.

Author Contributions

Writing—original draft preparation, X.D.; validation, L.M.M., C.-S.C., and H.X.; writing—review and editing, L.T.O.C. All authors have read and agreed to the published version of the manuscript.

Funding

This research received no external funding.

Conflicts of Interest

The authors declare that there is no conflict of interest.

References

  1. Su, B. Rural tourism in China. Tour. Manag. 2011, 32, 1438–1441. [Google Scholar] [CrossRef]
  2. Zhou, L.; Chan, E.; Song, H. Social capital and entrepreneurial mobility in early-stage tourism development: A case from rural China. Tour. Manag. 2017, 63, 338–350. [Google Scholar] [CrossRef]
  3. Cai, L.A. Cooperative branding for rural destinations. Ann. Tour. Res. 2002, 29, 720–742. [Google Scholar] [CrossRef]
  4. Blain, C.; Levy, S.E.; Ritchie, J.R.B. Destination Branding: Insights and Practices from Destination Management Organizations. J. Travel Res. 2005, 43, 328–338. [Google Scholar] [CrossRef]
  5. Hall, C.M. Tourism Destination Branding and its Effects on National Branding Strategies: Brand New Zealand, Clean and Green but is it Smart. Eur. J. Tour. Hosp. Recreat. 2010, 1, 68–89. [Google Scholar]
  6. Pike, A. Economic Geographies of Brands and Branding. Econ. Geogr. 2013, 89, 317–339. [Google Scholar] [CrossRef]
  7. Adeyinka-Ojo, S.F.; Khoo-Lattimore, C.; Nair, V. A Framework for Rural Tourism Destination Management and Marketing Organisations. Procedia Soc. Behav. Sci. 2014, 144, 151–163. [Google Scholar] [CrossRef] [Green Version]
  8. Sun, Y.; Liang, C.; Chang, C.C. Online social construction of Taiwan’s rural image: Comparison between Taiwanese self-representation and Chinese perception. Tour. Manag. 2020, 76, 103968. [Google Scholar] [CrossRef]
  9. Zhou, L. Online rural destination images: Tourism and rurality. J. Destin. Mark. Manag. 2014, 3, 227–240. [Google Scholar] [CrossRef]
  10. Andreu, L.; Bigné, J.E.; Cooper, C. Projected and perceived image of spain as a tourist destination for british travellers. J. Travel Tour. Mark. 2000, 9, 47–67. [Google Scholar] [CrossRef]
  11. Beerli, A.; Martín, J.D. Factors influencing destination image. Ann. Tour. Res. 2004, 31, 657–681. [Google Scholar] [CrossRef]
  12. Koerte, T.; Lehto, X. The Projected and Perceived Image of the United Republic of Tanzania; Purdue e-Pubs: West Lafayette, IN, USA, 2009; pp. 1–11. [Google Scholar]
  13. Britton, R.A. The image of the Third World in tourism marketing. Ann. Tour. Res. 1979, 6, 318–329. [Google Scholar] [CrossRef]
  14. Mathieson, A.; Wall, G. Tourism, Economic, Physical and Social Impacts; Longman: London, UK, 1982. [Google Scholar]
  15. Ahmed, Z.U.; Krohn, F.B. Marketing India as a tourist destination in North America—Challenges and opportunities. Int. J. Hosp. Manag. 1992, 11, 89–98. [Google Scholar] [CrossRef]
  16. Govers, R.; Go, F.M. Projected destination image online: Website content analysis of pictures and text. Inf. Technol. Tour. 2005, 7, 73–89. [Google Scholar] [CrossRef]
  17. Choi, S.; Lehto, X.Y.; Morrison, A.M. Destination image representation on the web: Content analysis of Macau travel related websites. Tour. Manag. 2007, 28, 118–129. [Google Scholar] [CrossRef]
  18. Stern, E.; Krakover, S. The Formation of a Composite Urban Image. Geogr. Anal. 1993, 25, 130–146. [Google Scholar] [CrossRef]
  19. Tapachai, N.; Waryszak, R. An examination of the role of beneficial image in tourist destination selection. J. Travel Res. 2000, 39, 37–44. [Google Scholar] [CrossRef]
  20. Iwashita, C. Media Construction of Britain as a Destination for Japanese Tourists: Social Constructionism and Tourism. Tour. Hosp. Res. 2003, 4, 331–340. [Google Scholar] [CrossRef]
  21. Litvin, S.W.; Ng Sok Ling, S. The destination attribute management model: An empirical application to Bintan, Indonesia. Tour. Manag. 2001, 22, 481–492. [Google Scholar] [CrossRef]
  22. Joppe, M.; Martin, D.W.; Waalen, J. Toronto’s image as a destination: A comparative importance-satisfaction analysis by origin of visitor. J. Travel Res. 2001, 39, 252–260. [Google Scholar] [CrossRef]
  23. Koltringer, C.; Dickinger, A. Analyzing Destination Branding and Image from Online Sources: A Web Content Mining Approach. J. Bus. Res. 2015, 68, 1836–1843. [Google Scholar] [CrossRef]
  24. Kim, S.; Lehto, X.Y. Projected and Perceived Destination Brand Personalities: The Case of South Korea. J. Travel Res. 2013, 52, 117–130. [Google Scholar] [CrossRef]
  25. Mak, A.H.N. Online destination image: Comparing national tourism organisation’s and tourists’ perspectives. Tour. Manag. 2017, 60, 280–297. [Google Scholar] [CrossRef]
  26. Marine-Roig, E.; Ferrer-Rosell, B. Measuring the gap between projected and perceived destination images of Catalonia using compositional analysis. Tour. Manag. 2018, 68, 236–249. [Google Scholar] [CrossRef]
  27. Cloke, P.J.; Marsden, T.; Mooney, P. Handbook of Rural Studies; SAGE Publications Ltd.: London, UK, 2006; p. 511. [Google Scholar]
  28. Woods, M.; McDonagh, J. Rural Europe and the world: Globalization and rural development. Eur. Countrys. 2011, 3, 153–163. [Google Scholar] [CrossRef] [Green Version]
  29. Shucksmith, M. Routledge International Handbook of Rural Studies; Routledge: New York, NY, USA, 2016. [Google Scholar]
  30. Woods, M. Engaging the global countryside: Globalization, hybridity and the reconstitution of rural place. Prog. Hum. Geogr. 2007, 31, 485–507. [Google Scholar] [CrossRef] [Green Version]
  31. Vik, J.; Villa, M. Books, Branding and Boundary Objects: On the Use of Image in Rural Development. Sociol. Rural. 2010, 50, 156–170. [Google Scholar] [CrossRef] [Green Version]
  32. MacKay, K.J.; Fesenmaier, D.R. Pictorial element of destination in image formation. Ann. Tour. Res. 1997, 24, 537–565. [Google Scholar] [CrossRef]
  33. MacKay, K.J.; Fesenmaier, D.R. An Exploration of Cross-Cultural Destination Image Assessment. J. Travel Res. 2000, 38, 417–423. [Google Scholar] [CrossRef]
  34. Zhang, H.; Fu, X.; Cai, L.A.; Lu, L. Destination image and tourist loyalty: A meta-analysis. Tour. Manag. 2014, 40, 213–223. [Google Scholar] [CrossRef]
  35. Yosta Permatasari, Y.; Danardana Murwani, F. Examining the Structural Relationships of Service Quality, Destination Image, Tourist Satisfaction and Loyalty: An Integrated Approach. Int. J. Acad. Res. Bus. Soc. Sci. 2017, 7, 367–378. [Google Scholar] [CrossRef] [Green Version]
  36. Tasci, A.D.A.; Gartner, W.C. Destination Image and Its Functional Relationships. J. Travel Res. 2007, 45, 413–425. [Google Scholar] [CrossRef]
  37. Avraham, E. Destination image repair during crisis: Attracting tourism during the Arab Spring uprisings. Tour. Manag. 2015, 47, 224–232. [Google Scholar] [CrossRef]
  38. Hunter, W.C. The social construction of tourism online destination image: A comparative semiotic analysis of the visual representation of Seoul. Tour. Manag. 2016, 54, 221–229. [Google Scholar] [CrossRef]
  39. Iordanova, E.; Stainton, H. Cognition, emotion and trust: A comparative analysis of Cambodia’s perceived and projected online image. Tour. Stud. 2019, 19, 496–519. [Google Scholar] [CrossRef]
  40. Garay Tamajón, L.; Cànoves Valiente, G. Barcelona seen through the eyes of TripAdvisor: Actors, typologies and components of destination image in social media platforms. Curr. Issues Tour. 2017, 20, 33–37. [Google Scholar] [CrossRef]
  41. Fakeye, P.C.; Crompton, J.L. Image Differences between Prospective, First-Time, and Repeat Visitors to the Lower Rio Grande Valley. J. Travel Res. 1991, 30, 10–16. [Google Scholar] [CrossRef]
  42. Hankinson, G. The brand images of tourism destinations: A study of the saliency of organic images. J. Prod. Brand Manag. 2004, 13, 6–14. [Google Scholar] [CrossRef]
  43. Kislali, H.; Kavaratzis, M.; Saren, M. Rethinking destination image formation. Int. J. Cult. Tour. Hosp. Res. 2016, 10, 70–80. [Google Scholar] [CrossRef] [Green Version]
  44. Wang, D.; Chan, H.R.; Pan, S. The Impacts of Mass Media on Organic Destination Image: A Case Study of Singapore. Asia Pac. J. Tour. Res. 2015, 20, 860–874. [Google Scholar] [CrossRef]
  45. Kim, H.; Chen, J.S. Destination image formation process. J. Vacat. Mark. 2016, 22, 154–166. [Google Scholar] [CrossRef]
  46. Xu, H.; Ye, T. Dynamic destination image formation and change under the effect of various agents: The case of Lijiang, ‘The Capital of Yanyu’. J. Destin. Mark. Manag. 2018, 7, 131–139. [Google Scholar] [CrossRef]
  47. Gartner, W.C. Image formation process. J. Travel Tour. Mark. 1994, 2(2–3), 191–216. [Google Scholar] [CrossRef]
  48. Iordanova, E. Unravelling the complexity of destination image formation: A conceptual framework. Eur. J. Tour. Res. 2015, 11, 35–56. [Google Scholar]
  49. Molina, A.; Esteban, Á. Tourism Brochures: Usefulness and Image. Ann. Tour. Res. 2006, 33, 1036–1056. [Google Scholar] [CrossRef]
  50. Hosany, S.; Ekinci, Y.; Uysal, M. Destination image and destination personality: An application of branding theories to tourism places. J. Bus. Res. 2006, 59, 638–642. [Google Scholar] [CrossRef]
  51. Ramkissoon, H.; Uysal, M.S. The effects of perceived authenticity, information search behaviour, motivation and destination imagery on cultural behavioural intentions of tourists. Curr. Issues Tour. 2011, 14, 537–562. [Google Scholar] [CrossRef]
  52. Ekinci, Y.; Hosany, S. Destination personality: An application of brand personality to tourism destinations. J. Travel Res. 2006, 45, 127–139. [Google Scholar] [CrossRef] [Green Version]
  53. Tavitiyaman, P.; Qu, H. Destination Image and Behavior Intention of Travelers to Thailand: The Moderating Effect of Perceived Risk. J. Travel Tour. Mark. 2013, 30, 169–185. [Google Scholar] [CrossRef]
  54. Hudson, S.; Thal, K. The Impact of Social Media on the Consumer Decision Process: Implications for Tourism Marketing. J. Travel Tour. Mark. 2013, 30, 156–160. [Google Scholar] [CrossRef]
  55. Leung, D.T.; Law, R.; van Hoof, H.B.; Buhalis, D. Social Media in Tourism and Hospitality: A Literature Review. J. Travel Tour. Mark. 2013, 30, 3–22. [Google Scholar] [CrossRef]
  56. Xiang, Z.; Gretzel, U. Role of social media in online travel information search. Tour. Manag. 2010, 31, 179–188. [Google Scholar] [CrossRef]
  57. Zeng, B.; Gerritsen, R. What do we know about social media in tourism? A review. Tour. Manag. Perspect. 2014, 10, 27–36. [Google Scholar] [CrossRef]
  58. Chan, C.S.; Zhang, Y. Matching projected image with perceived image for geotourism development: A qualitative-quantitative integration. Asian Geogr. 2018, 35, 143–160. [Google Scholar] [CrossRef]
  59. Dwivedi, M. Online destination image of India: A consumer based perspective. Int. J. Contemp. Hosp. Manag. 2009, 21, 226–232. [Google Scholar] [CrossRef]
  60. Stepchenkova, S.; Kirilenko, A.P.; Morrison, A.M. Facilitating Content Analysis in Tourism Research. J. Travel Res. 2009, 47, 454–469. [Google Scholar] [CrossRef] [Green Version]
  61. Baloglu, S.; Brinberg, D. Affective Images of Tourism Destinations. J. Travel Res. 1997, 35, 11–15. [Google Scholar] [CrossRef]
  62. Baloglu, S.; McCleary, K.W. A model of destination image formation. Ann. Tour. Res. 1999, 26, 868–897. [Google Scholar] [CrossRef]
  63. Assaker, G. Examining a hierarchical model of Australia’s destination image. J. Vacat. Mark. 2014, 20, 195–210. [Google Scholar] [CrossRef]
  64. Litvin, S.W.; Goldsmith, R.E.; Pan, B. Electronic word-of-mouth in hospitality and tourism management. Tour. Manag. 2000, 29, 458–468. [Google Scholar] [CrossRef]
  65. Scharl, A.; Dickinger, A.; Weichselbraun, A. Analyzing news media coverage to acquire and structure tourism knowledge. Inf. Technol. Tour. 2008, 10, 3–17. [Google Scholar] [CrossRef]
  66. Booth, K.L. Methods for Conducting an On-site Visitor Questionnaire Survey; Science and Research Directorate, Department of Conservation: Wellington, New Zealand, 1991. [Google Scholar]
  67. Booth, D.J. The effects of sampling frequency on estimates of recruitment of the domino damselfish Dascyllus albisella Gill. J. Exp. Mar. Biol. Ecol. 1991, 145, 149–159. [Google Scholar] [CrossRef]
  68. Douglas, A.C.; Mills, J.E. Logging Brand Personality Online: Website Content Analysis of Middle Eastern and North African Destinations. In Information and Communication Technologies in Tourism 2006; Springer: Vienna, Austria, 2006; p. 345. [Google Scholar]
  69. Weber, R.P. Basic Content Analysis; Sage: London, UK, 1990. [Google Scholar]
  70. Sotiriadou, P.; Brouwers, J.; Le, T.A. Choosing a qualitative data analysis tool: A comparison of NVivo and Leximancer. Ann. Leis. Res. 2014, 17, 218–234. [Google Scholar] [CrossRef] [Green Version]
  71. Chen, C.F.; Phou, S. A closer look at destination: Image, personality, relationship and loyalty. Tour. Manag. 2013, 36, 269–278. [Google Scholar] [CrossRef]
  72. Papadimitriou, D.; Apostolopoulou, A.; Kaplanidou, K.K. Destination Personality, Affective Image, and Behavioral Intentions in Domestic Urban Tourism. J. Travel Res. 2015, 54, 302–315. [Google Scholar] [CrossRef]
  73. Li, X.; Wang, Y. Measuring the effectiveness of US official state tourism websites. J. Vacat. Mark. 2011, 17, 287–302. [Google Scholar] [CrossRef]
  74. Stepchenkova, S.; Zhan, F. Visual destination images of Peru: Comparative content analysis of DMO and user-generated photography. Tour. Manag. 2013, 36, 590–601. [Google Scholar] [CrossRef]
  75. Echtner, C.M.; Ritchie, J.B. The meaning and measurement of destination image. J. Tour. Stud. 1991, 2, 2–12. [Google Scholar]
  76. Pantelidis, I.S. Electronic Meal Experience: A Content Analysis of Online Restaurant Comments. Cornell Hosp. Q. 2010, 51, 483–491. [Google Scholar] [CrossRef]
  77. Ren, L.; Zhang, H.Q.; Ye, B.H. Understanding Customer Satisfaction With Budget Hotels Through Online Comments: Evidence From Home Inns in China. J. Qual. Assur. Hosp. Tour. 2015, 16, 45–62. [Google Scholar] [CrossRef]
  78. Akehurst, G. User generated content: The use of blogs for tourism organisations and tourism consumers. Serv. Bus. 2009, 3, 51–61. [Google Scholar] [CrossRef]
  79. Burgess, S.; Sellitto, C.; Cox, C.; Buultjens, J. User-generated content (UGC) in tourism: Benefits and concerns of online consumers. In Proceedings of the 17th European Conference on Information Systems, ECIS 2009, Verona, Italy, 8–10 June 2009. [Google Scholar]
  80. Chigbu, U.E. Rurality as a choice: Towards ruralising rural areas in sub-Saharan African countries. Dev. S. Afr. 2013, 30, 812–825. [Google Scholar] [CrossRef]
  81. Kastenholz, E. ‘Cultural proximity’as a determinant of destination image. J. Vacat. Mark. 2010, 16, 313–322. [Google Scholar] [CrossRef]
  82. Ayob, N. Residents’perception as key input to destination image formation for rural tourism. Int. J. Serv. Manag. Sustain. 2019, 1, 48–57. [Google Scholar]
Figure 1. Framework of the study setting and hypotheses.
Sustainability 12 05121 g001
Figure 2. Cluster analysis of the projected image.
Sustainability 12 05121 g002
Figure 3. Cluster analysis of the perceived image.
Sustainability 12 05121 g003
Figure 4. Cluster analysis of the perceived image and projected image.
Sustainability 12 05121 g004
Table 1. Demographic profile of interviewees (N = 127).
DemographicsFrequency%
Sex
Male5946.5%
Female6853.5%
Age
below 2053.9%
21–305240.9%
31–403729.1%
41–502116.5%
51–6097.1%
above 6032.4%
Place of origin
Within the province9776.4%
Other provinces in China2620.5%
Other countries43.1%
Table 2. List of nodes.
Cognitive Image
Tourism ProductTourism infrastructure
RuralityAccommodation quality
Environment qualityChoices of accommodation
BiodiversityPrice of accommodation
Rural cuisineHygiene of Restaurant
Rural souvenirChoices of restaurant
Rural resident Level of safety for tourism
AttractionTransportation
ActivityGeography background
Package tourInterpretation
Social and cultural elements
Affective image
Pleasant-Unpleasant
Destination is pleasantDestination is unpleasant
Arousing-Sleepy
Destination is arousingDestination is sleepy
Exciting-Gloomy
Destination is ExcitingDestination is gloomy
Relaxing-Distressing
Destination is relaxingDestination is distressing
Table 3. The projected image on DMO websites.
NodesPercentage (%)
Geographical background5.73
Attraction3.12
Social and cultural elements2.55
Activity1.01
Biodiversity 0.99
Rurality0.82
Environment quality0.65
Transportation0.30
Rural cuisine 0.23
Rural souvenir 0.12
Table 4. The projected image on business websites.
NodesPercentage (%)
Attraction12.08
Choice of accommodation9.90
Package tour7.54
Activity5.50
Quality of accommodation4.72
Price of accommodation2.95
Social and cultural elements2.67
Rurality2.48
Geography background2.28
Transportation2.24
Table 5. The perceived image from online comments.
NodesPercentage (%)
Attraction1.78
Transportation1.20
Rurality1.15
Destination is relaxing0.76
Activity0.71
Biodiversity0.69
Destination is pleasant0.64
Destination is arousing0.61
Geography background0.50
Social and cultural elements0.48
Table 6. The perceived image from on-site visitors.
NodesPercentage (%)
Destination is relaxing10.50
Destination is sleepy7.39
Environment quality2.25
Rurality1.76
Rural cuisine1.22
Destination is pleasant1.11
Attraction1.01
Activity0.94
Accommodation quality 0.92
Choices of accommodation0.53
Table 7. The projected image of rural tourism destinations.
NodesPercentage (%)
Transportation6.63
Attraction6.25
Package tour5.15
Choice of accommodation4.86
Geography background3.77
Social and cultural elements3.56
Activity2.70
Quality of accommodation2.32
Rurality2.09
Price of accommodation1.45
Table 8. The perceived image of rural tourism in China.
NodesPercentage (%)
Rurality1.75
Destination is Relaxing1.19
Attraction1.16
Transportation1.14
Environment quality0.85
Biodiversity0.68
Destination is pleasant0.65
Activity0.60
Social and cultural elements0.58
Destination is sleepy0.53

