1. Introduction
A rapidly developing community coupled with increasing economic development, and a rise in the standard of living, have quickened the rate of institutional solid waste generation (MSW) making its management difficult and challenging [
1]. To make solid waste management decisions that are sustainable requires the understanding of the composition of wastes and how they were generated, since the composition of waste differ from source to source [
2]. Decision-makers conduct waste characterisation studies to understand the waste flow—making it possible to design waste management schemes for different regions [
3].
A thorough comprehension of the composition, characteristics, and procedures of waste generation is, therefore, essential for effective solid waste management. Unique consideration ought to be paid to the source of waste generation because the attributes and generation of the waste vary as per their sources [
4], such as residential, industrial, institutional, construction and agricultural sources. One of the serious issues in solid waste management is to decide the amount and compositions of waste generated in academic institutions. The plan, execution, and administration of the solid waste management process require exact data on the amounts and attributes of the solid waste to be managed. Characterisation of waste composition within universities and institutions is the first step in the design of a sustainable and successful waste management system [
5] to sustain the environment [
6]. However, there are not many formal studies to ascertain the quantity and quality of wastes generated in South African institutions. Universities play an important role in teaching and learning and are saddled with the social responsibility to teach the community how to overcome the problems of poor solid waste management, as this will portray a good image to both the students and the entire society.
The significance of universities in propagating sustainable development through various significant declarations, such as the “Talloires Declaration (1990), the Halifax Declaration (1991), the Swansea Declaration (1993), the Kyoto Declaration (1993), the Copernicus Charter (1993), Students for a Sustainable Future (1995)’’, has been reported by Lozano et al. [
7]. Waste characterisation studies in higher institutions have been reported to bring viable changes in solid waste management. In three tertiary institutions of learning in Tanzania, a waste recovery potential of 71% was recorded [
8]. Likewise, the study of Tiew et al. [
9] enabled the UKM institution in Malaysia to consider utilising vermi-composting method to sustainably manage their high generation rate of organic waste.
In the Universität Jaume, Malaysia, Gallardo [
10] conducted a waste generation and characterisation study, and the results obtained were useful in designing strategies to enhance and upgrade their University’s waste management system, increase waste separation at source and minimise the amount of waste generated. Kassaye et al. [
11] in the study at Hamaraya University, Ethiopia, reported that the waste characterisation study conducted has been advantageous in the designing and implementation of an integrated solid waste management system for the institution. Characterisation studies are lacking in many South African Universities, and this suggests the need to know the compositions of waste and devise appropriate means of handling those wastes. For example, among the few studies on waste characterisation in South Africa is the one of North West University, which embarked on a characterisation study to know the profile and quantities of waste generated on their campuses. The major findings of the waste characterisation studies, as well as the lessons learned and recommendations, were utilised for improving the waste management strategy of the institution. Rhodes University, South Africa also conducted a waste characterisation study on the food waste generated on their campus to develop sustainable intervention models. These studies were able to assist the institutions in developing options to reconsider waste management practices.
Despite the enormous advantages of recycling and reuse of discarded wastes, many rural-based institutions in Africa are having solid waste management problems. Hence, this study reports our findings on the waste profile, the rate of generation and the potential of recovery and recycling of solid wastes from a rural-based institution in Thohoyandou, Limpopo province, South Africa.
2. Materials and Methods
2.1. Regional Overview of Study Area (UNIVEN)
The Limpopo province named after the great Limpopo River, which is the second largest river in Africa. It is situated in the northernmost part of South Africa and shares boundaries with Botswana to the West, Mozambique to the East and Zimbabwe to the North [
12]. The province has a distinguished scenic landscape and richly diversified cultural heritage, and is often a destination of several nature-based tourism opportunities and many archaeological sites. It is often referred to as one of the most conserved areas of the Africa continent as it is the home of the famous Kruger National park of South Africa. The province is a hot sub-tropical climate, summers in Limpopo province are very warm, while winters are mild. Winter and summer in Limpopo (are parallel to dry and wet season) is experienced opposite times as in Europe and North America. Rainfall is highly seasonal, with 95% occurring between October and April. The province is bestowed with vast agricultural resources, and therefore, the country’s prime agricultural region, and is often referred to as the fruit basket of South Africa, as it produces 60% of the country’s food produce [
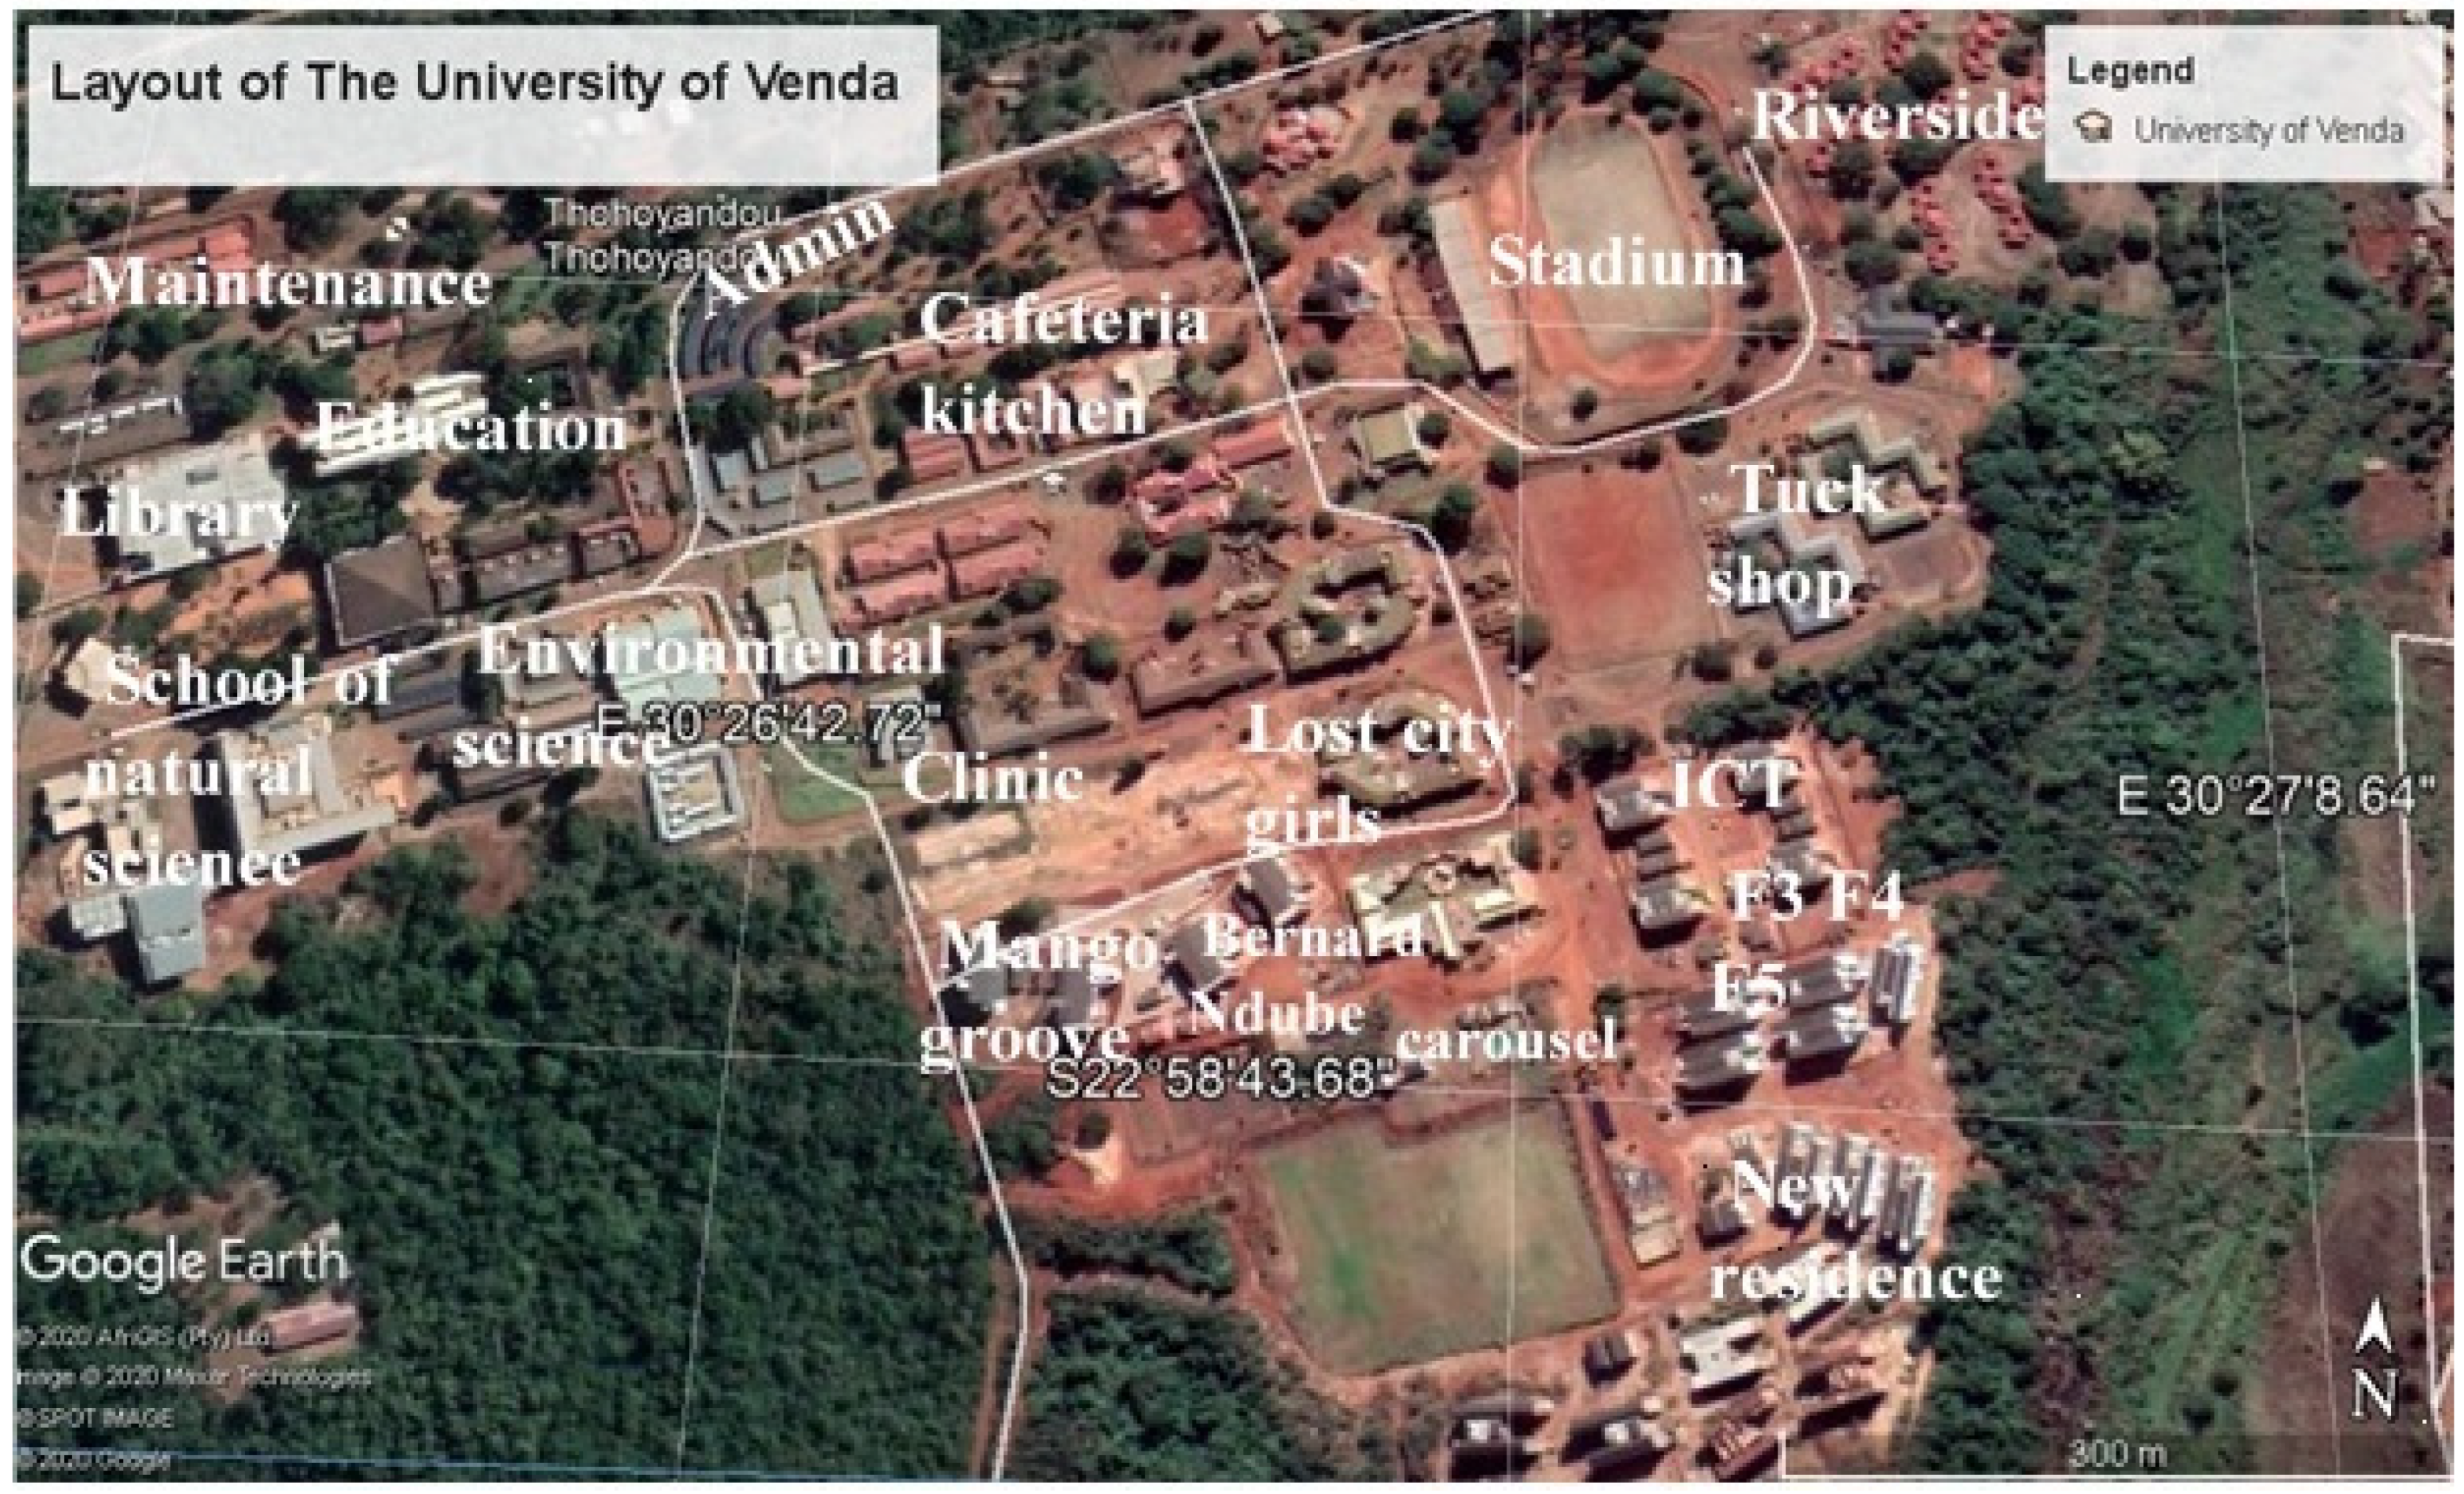
13]. In the northern part of the province lies Thohoyandou, which is also the home of the University of Venda, with geographical coordinates of 30°27’8.6’’ E and 22°58’43.6’’ S (
Figure 1). Thohoyandou is one of the fastest growing towns in Limpopo region with variations in temperature ranging from 12 to 22 °C during winter, and about 20 to 40 °C in summer season [
14]. Precipitation also ranges between 340 to 2000 mm, having an average rainfall of 800 mm. The region is classified as a humid subtropical dry forest biozone [
15].
2.2. Sampling Area and Activity Grouping of Buildings
The University of Venda located in Thohoyandou, Limpopo Province, South Africa comprises of eight academic schools, eleven students’ hostels, one staff, and student administrative buildings. The annual academic calendar is divided into two semesters, the first semester spans from January to May, and the second semester starts from July to December. The daytime population comprise mainly of staff and students, while the night time population is mainly students, this is due to the fact that staffs leave the institution after working hours because there are no on-campus staff residences. Moreover, a good number of students lives outside the University campus.
The university had 16,702 enrolled students and 490 members of staff for the 2019 academic year. Buildings within the university were grouped into structures (a structure refers to a group of buildings designed for a specific utility). The structures were further classified into four zones (activity areas), namely: (i) academic and research, (ii) cafeteria, (iii) residential area, (iv) administrative buildings. The structures in each respective zone were grouped based on the nature of the activity. Characterisation study was carried out at the selected key activity areas, which were: School of Human and Social Sciences, School of Environmental Sciences, School of Education, Students Residences, cafeteria, and new administrative building.
Figure 1 shows the layout structure of the University.
2.3. Sampling for Characterisation
Sampling was conducted using the ASTM D5231-92 [
16] standard test method for unprocessed municipal solid waste. The ASTM specifies that: (1) The number of samples should be determined from a statistical criterion; (2) the sub-sample to be sorted should be approximately four times in weight than the initial sample; (3) sample selection should be at random and performed over a period of 5 to 7 days. The samples were manually hand-sorted into categories of seven—namely, paper, aluminium, glass, plastic, plastic bottles, organic waste, and others—and the average weights of each component determined. The category of plastic bags comprises shopping bags as well as packaging food containers, no moving garbage, furniture or clothes were part of the samples. The “others” category refers to trash that is non-recoverable. Samples were collected in May 2019.
2.4. Estimation of Daily Waste Generation Rate
The daily waste generation rate on campus was determined by direct measurement at source from each activity area. Waste from designated bins was collected every morning from each activity area and assembled or gathered and then transported to a designated point in the University premises for weighing and sorting. The measurement for each activity area was conducted for three weeks. The measurement was carried out with the use of a standard platform weighing scale of 300 kg capacity. Measurement across residences was performed in August 2019.
2.5. Analysis of Waste Composition
All the recorded information was input in a standard spreadsheet for further analysis. The percentage category of waste in each activity area was determined using Equation (1), while the per-capita waste was computed using the relation in Equation (2).
where PR = percentage recyclable, WS = weight of sub-category and WI = weight of the initial sample
where PCW = per capita waste, TW = total waste generated, NP = no. of persons, ND = no. of days.
Waste Characterisation
At the characterisation site, waste samples were hand sorted into seven waste categories and weighed. Waste characterisation into categories was adopted from various waste characterisation methodologies, mainly from ASTM standards. Waste categories included paper and paper products, plastic bags, plastic bottles, aluminium cans, organic (compostable) materials, glass, and others.
2.6. Data Collection and Mode of Analysis
The amount and type of waste generated on campus were recorded daily in forms. The filled forms were screened for errors, and the collected data was loaded into Excel’s spreadsheet. The percentage for each category of waste was calculated using equations 1 and 2. The subsequent analysis included computing and analysing the mean waste composition and standard deviation across activity areas, on campus. The normality of data distribution was tested using the Kolmogorov-Smirnov method. Since the distribution of the data was not normal, then the non-parametric one-way analysis of variance was performed to analyse the data. Statistical analyses were performed utilising Excel and SPSS software.
3. Results and Discussion
3.1. Waste Measurement at Halls of Residences
Table 1 shows the waste generated in the female and male halls of residence, respectively, which are allocated to undergraduate degree students. The daily waste generated per day for each residence is presented in
Appendix A Table A1 and
Table A2. Riverside residence is the only postgraduate hall of residence that accommodates both male and female students (breakdown of waste generated per day is shown in
Appendix A Table A3). From
Table 1, F4 Girl’s residence recorded the highest amount of average waste generated per day (339.8 kg). This could be attributed to the population of those residing in the hall, and it is important to also note that during field observation, it was observed that the F4 residence has a lot of squatters and residents above the ideal capacity, which results in an unusual rate of waste generation than the other residences.
However, the new female residence recorded the least average daily waste generation rate (212.3 kg) compared to the other female residences. This could be attributed to the fact that the residence is relatively new, and only one-third of the rooms were allocated. In comparison with the male residences, the F3 Boys’ residence also recorded the highest average daily waste generation rate (349.3 kg). The reason for this high rate to what was recorded in the new female residence was largely due to squatters, thereby contributing to more waste and utilisation of resources above the ideal for the residence. This is high, in comparison with the study of Coker et al. [
4], where students generate waste in the range of 0.3 to 0.4 kg/capita/day. One of the possible reasons for the high generation rate could be attributed to the fact that each residence accommodates more than its designed capacity
From
Table 1, the population represents the ideal capacity that each hall was designed to accommodate. However, the situation on the ground is far from the ideal resulting in the number of students residing in each hall exceeding the capacity. The number of residences and their capacity is not enough to cater to the entire student population. This results in crowded residences and over-stretching of basic utilities, such as water, electricity, and waste-bins, resulting in environmental implications. Waste generation generally differs with affluence. However, there are significant differences between regions and countries. The average per-capita waste generated in the residences was found to be 0.82 kg/capita/day (
Table 1). The waste generation rate slightly exceeded the threshold of 0.7 kg/capita/of the South African solid waste generation rate per capita per day [
17]. However, it falls closer to the per capita waste generation rate in sub-Sahara Africa, which spans between 0.09 to 3.0 kg/person/day [
18].
From the resumption of the academic year 2020, the university management has embarked on eradicating squatting at the residences, through monitoring and strict regulations in place. This has greatly reduced squatters. There is, however, the need to provide more residences for students by completing the blocks of residences that are under construction, this will further reduce the number of squatters in the available residences and reduce the waste generation rate per residence. Maximisation of waste generation requires proper waste segregation at source through the provision of different recycling bins. This will reduce the rate of contamination and also increase the rate of material recovery.
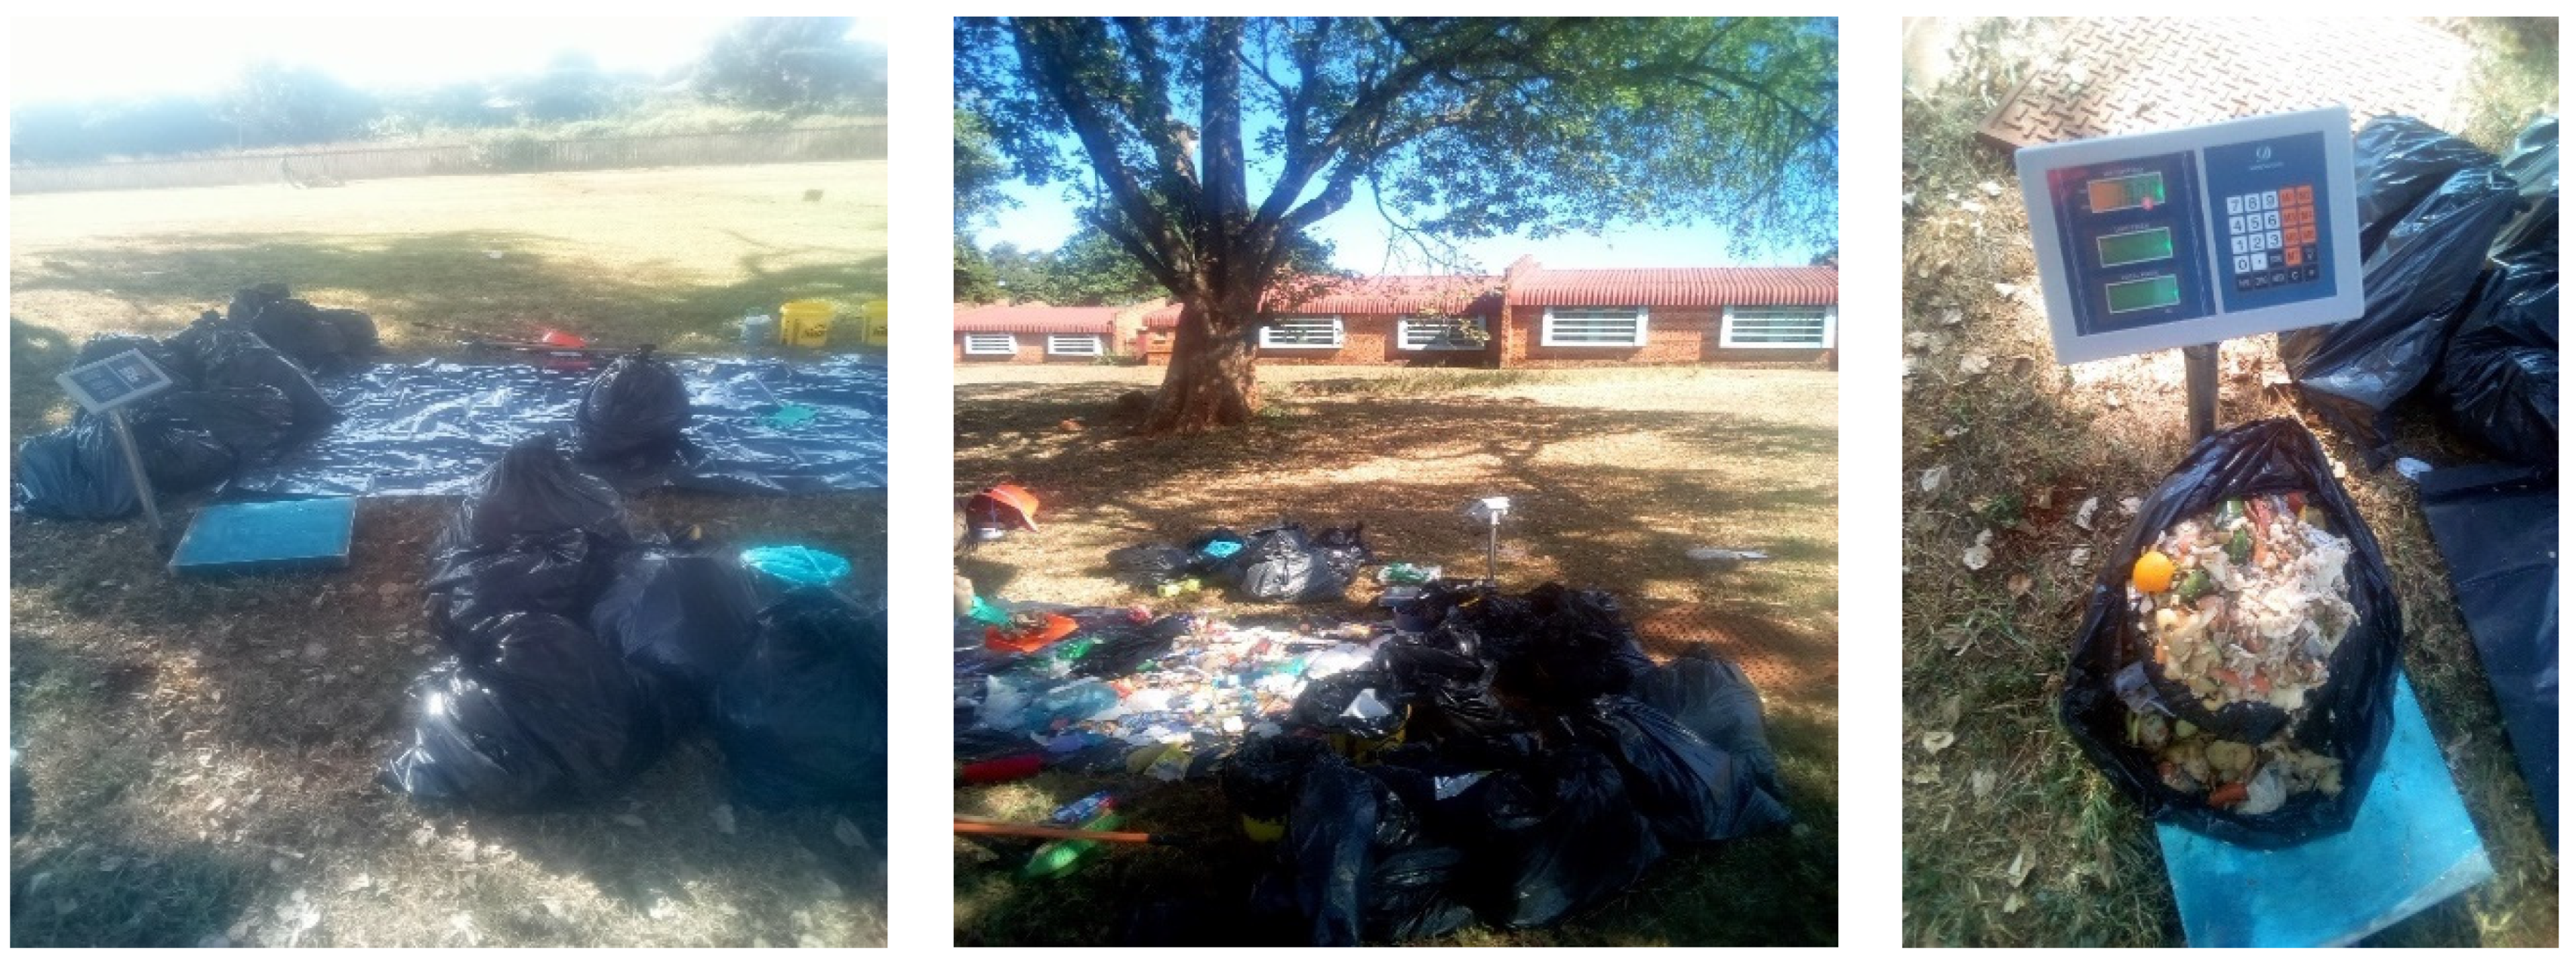
3.2. Waste Audit/Characterisation at Riverside
Waste characterisation study is important to inform effective planning and sustainable waste management techniques. Opportunities for waste diversion from landfills are currently being assessed. For the residences, Riverside was selected for the characterisation study since it accommodates both male and female students. The composition of the waste generation rate at the riverside residence over a period of three weeks is presented in
Table 2, while the general percentage of waste composition is shown in
Appendix A Figure A1.
The material breakdown in
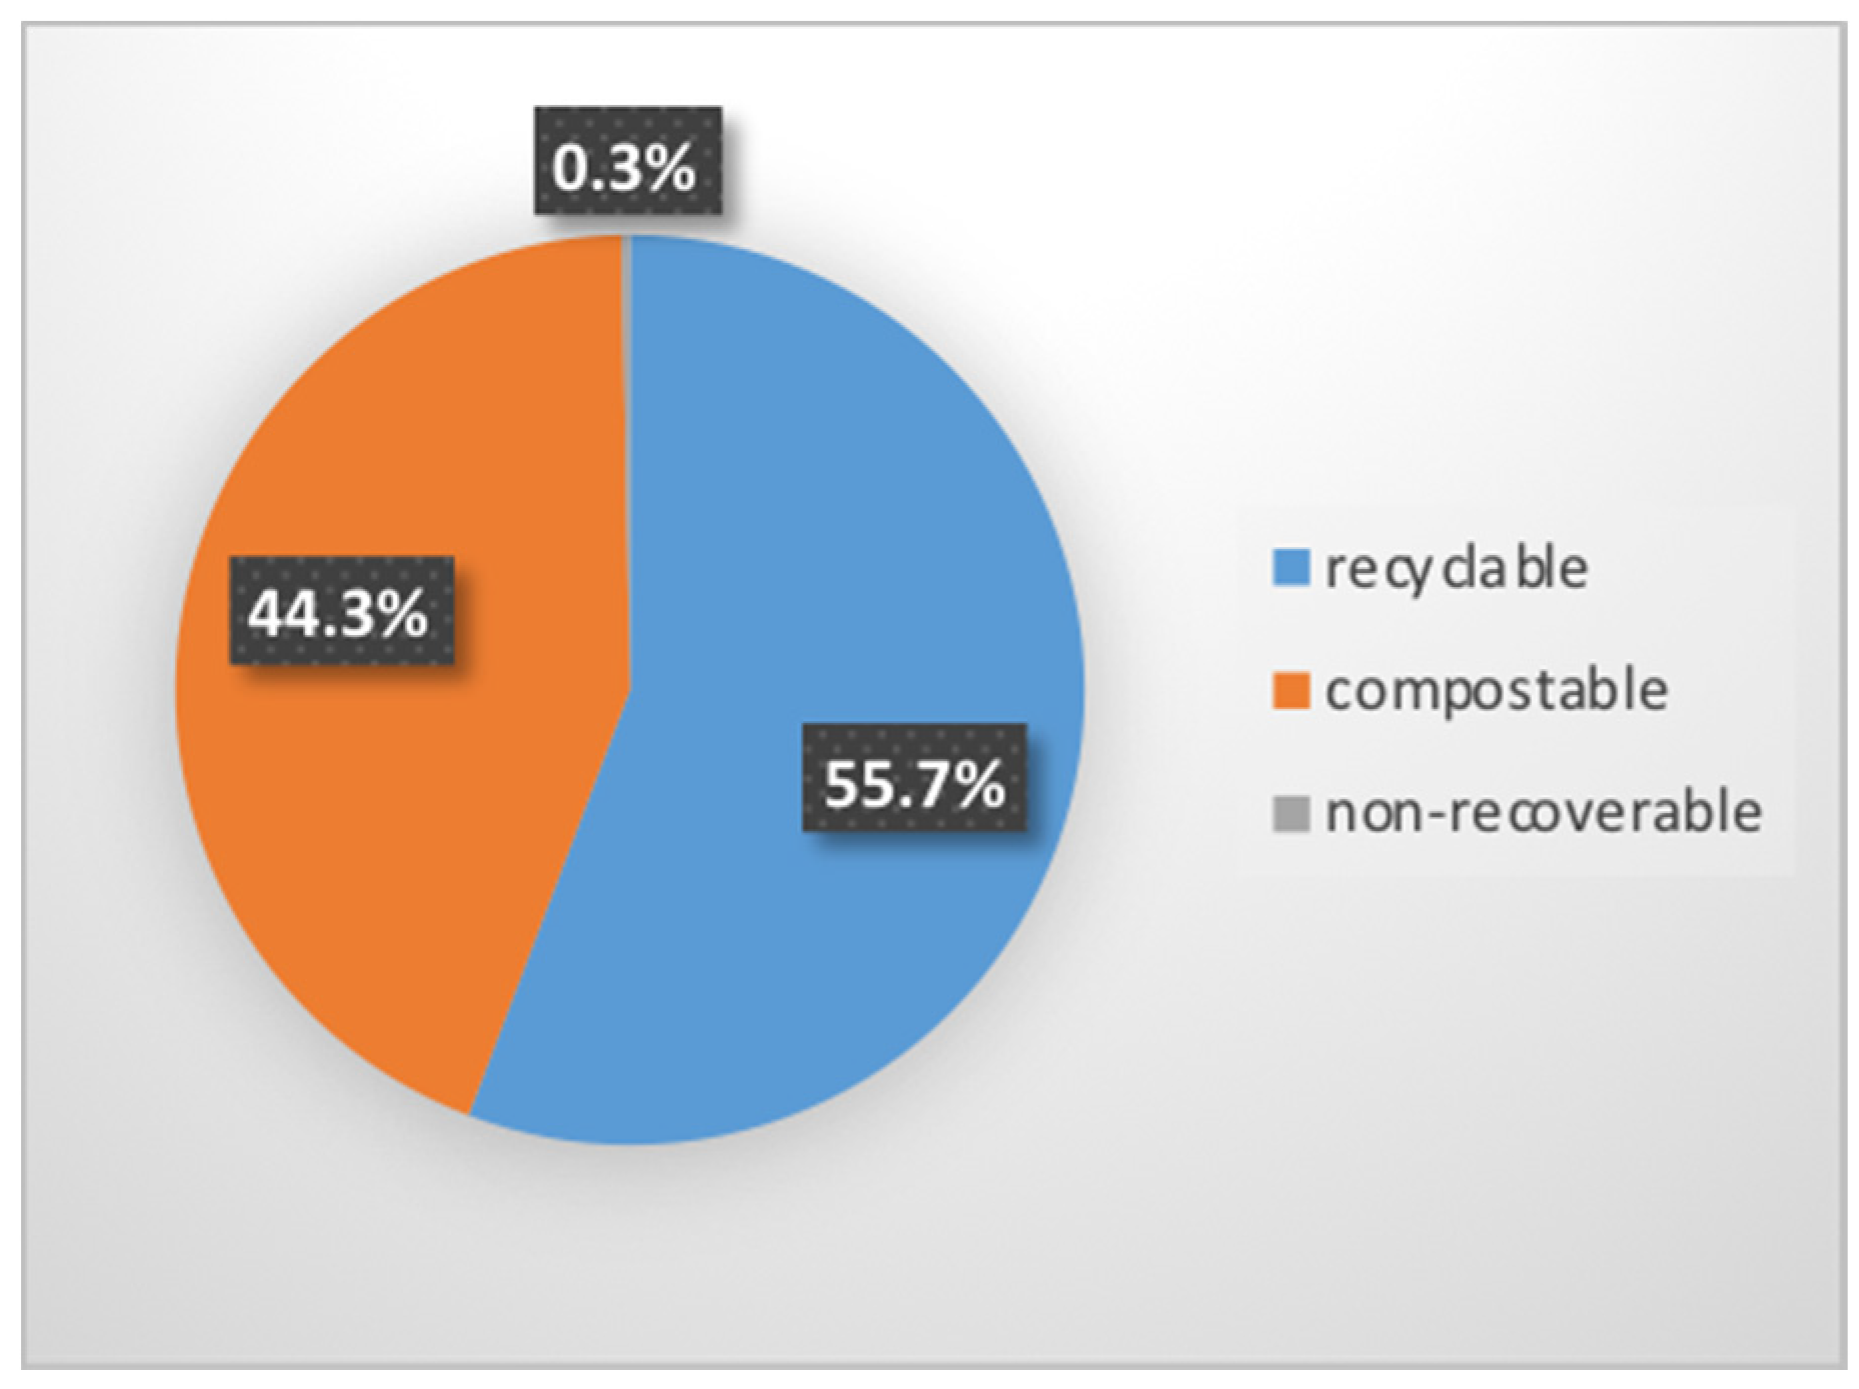
Table 2 reveals that food accounts for the highest waste generated in kilograms (82.5 kg), and the least is other wastes (14.1 kg). It is not surprising that food waste constitutes the largest percentage of waste generated in the residence because students usually cook in their residence. It can be seen from the waste audit outcome that recyclable waste accounts for over 50% of the waste stream and this signifies that there will be a remarkable reduction in waste sent to landfills if the potential to recycle waste is optimised. This finding is comparable with another research carried out by Chee [
19] in Malaya University where the waste audit reported includes organic food waste (33%), mixed papers (14%), plastic bags (10%), and other plastics (10%). Findings of similar study at the University of Washington resonate with the results of this study highlighting that the three major components of waste generated from halls of residences are organics, plastics, and paper. Research conducted at the North-West University (Potchefstroom Campus) in South Africa found that about 60 to 85% of the waste generated at the residences had the potential to be recycled [
20], which also confirms that over 50% of waste from student residences are recyclable.
Figure 2 shows the waste characterisation process at Riverside residence.
An estimation of the per capita waste generation rate in Riverside residence gives an average of 0.7 kg/capita/day. This is further used to derive the annual recyclable and compostable waste in Riverside, which is given as 27.8 (recyclable) and 21.6 tons (compostable), respectively, as shown in
Table 3. The result of the waste audit was used in extrapolating the annual waste generation rate which resulted in an estimate of annual waste generation rate of 44.4 tons per year using Equation (3), and the outcome is given in
Table 3.
Note: {295 days = No. of days in a year (365)—public holidays (14 days)—semester breaks (104 days)}
3.3. Waste Audit at the Cafeteria Dining Section
The characteristics of waste per kg at the cafeteria over three weeks are presented in
Table 4. The results of the waste audit conducted at the students dining section of the school cafeteria reveal that 55.7% of the waste is recyclable, e.g., food packages, plastic bottles, soft drink cans and glass bottles (
Appendix A,
Figure A2). The compostable waste accounts for 44.3%, and includes food remnants, bones of fish and meat. Zotesso et al. [
21] reported that organic waste represents 82.6% of the total waste generated in a university cafeteria in Brazil, which is higher than that of this study (44.3%). Similarly, Sales [
22] reported 93.2% of waste generated from three popular public cafeterias in Rio de Janeiro, which were categorised as organic. The reason for this lower value could be attributed to the fact that the Univen cafeteria is not as large as those universities’ cafeterias, and it is still a developing institution compared to other established institutions. However, this shows that almost all waste produced here is resourceful. Organic waste shows the highest waste generated per kilogram (38.3) and lots of food packaging waste, which constitute recyclables (
Table 4).
3.4. Waste Audit at the Kitchen Section
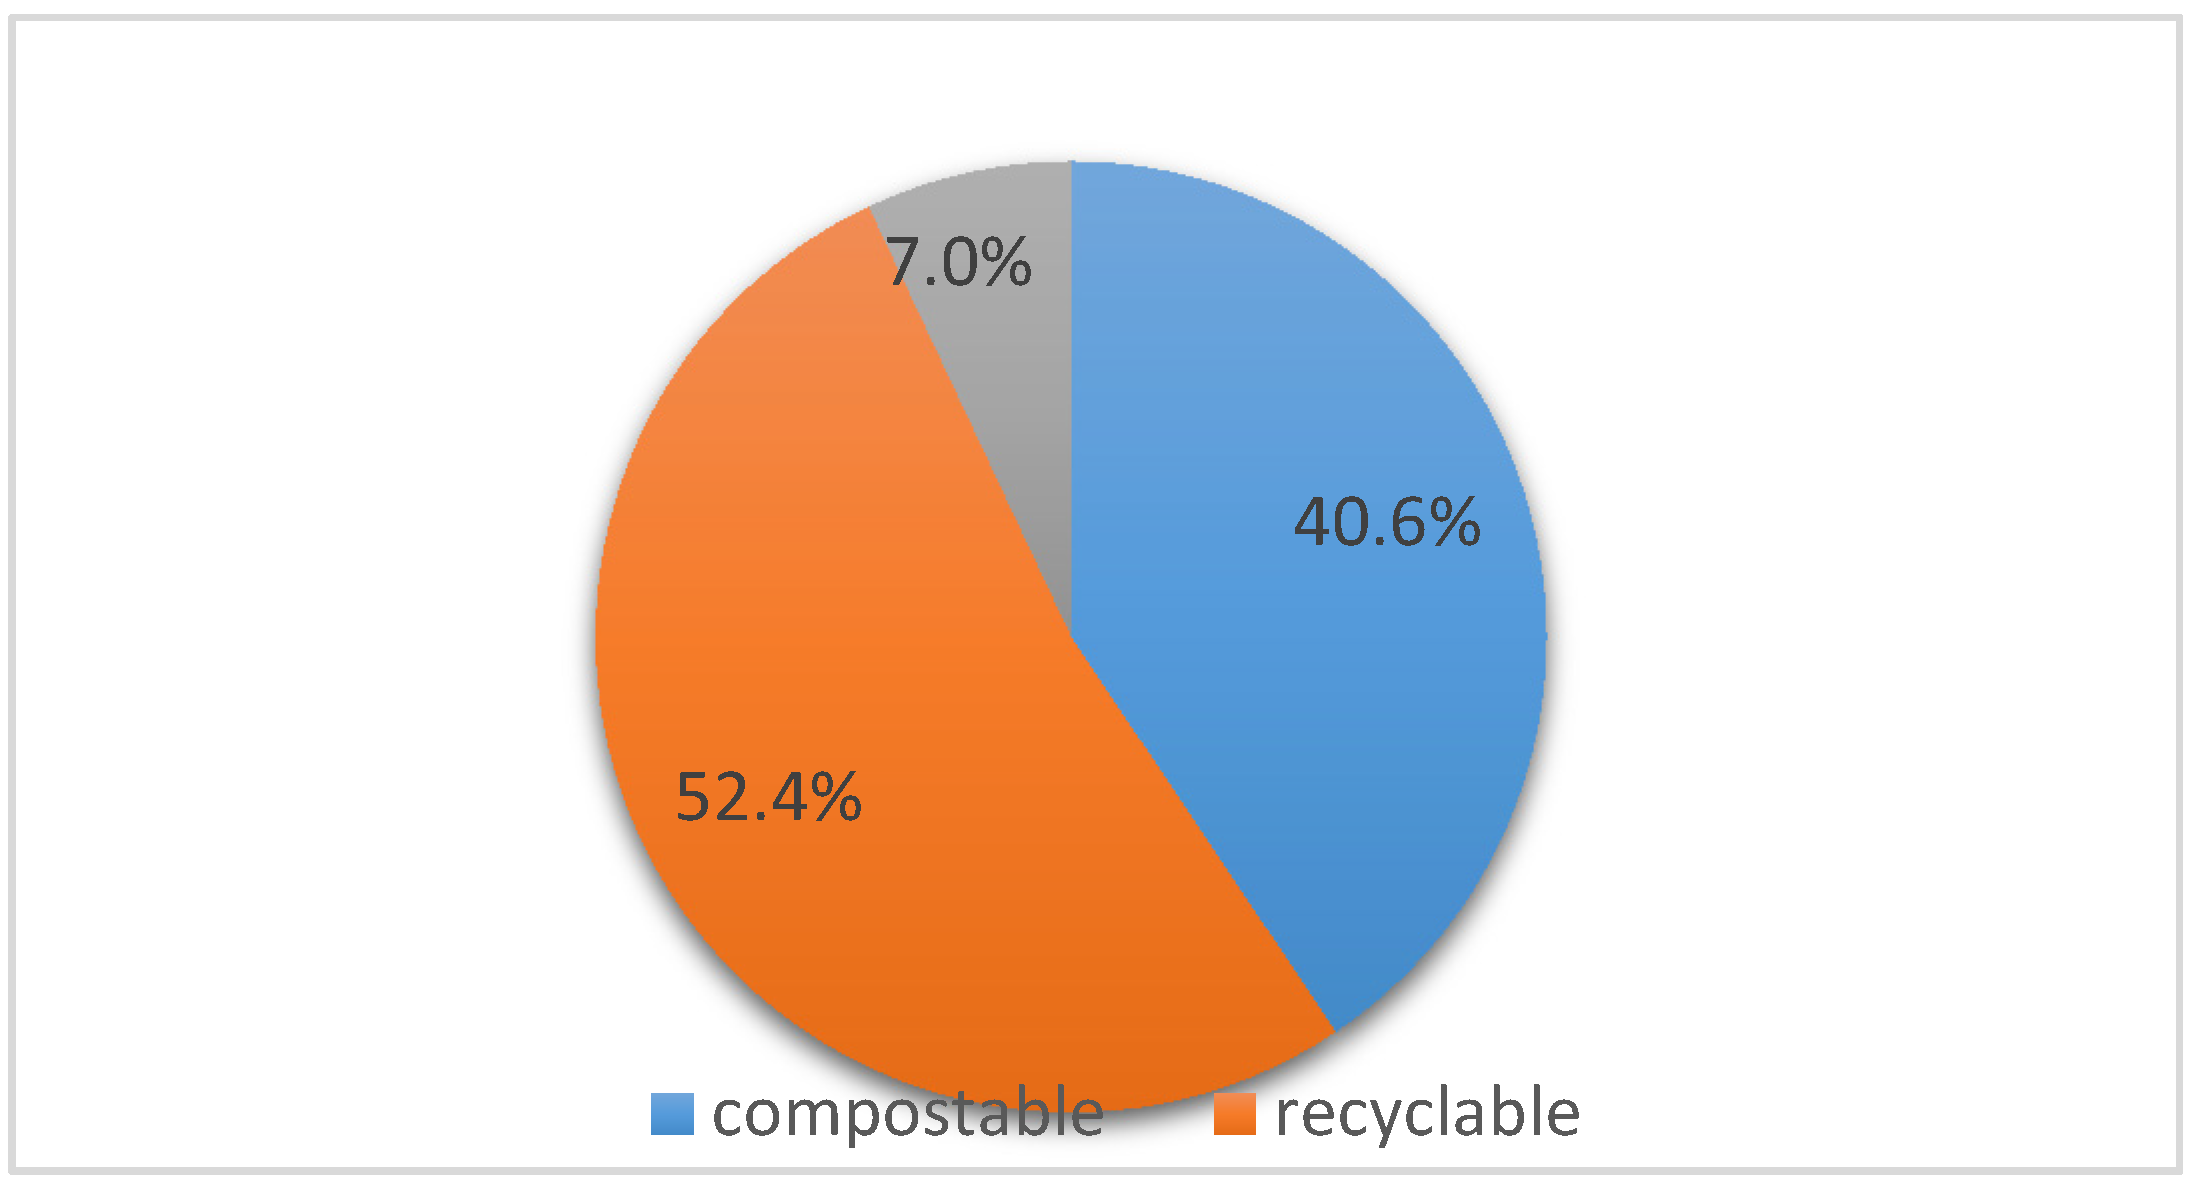
The results in
Table 5 present the waste generated from the kitchen audit which shows that 41% of the kitchen waste is compostable, this ranges from all pre-consumer organic food waste, such as spinach, cabbage, and tomatoes. Recyclable waste accounts for 57%, and is made up of papers, food packages, plastic bottles, glass bottles, and soft drink cans (
Table 5). There is a great potential for recycling and reuse of compostable materials as fertilisers in the cafeteria kitchen waste. Unfortunately, this goes to the landfill, though occasionally, some outsiders come to collect these food waste to use on their farms, based on the information obtained from the kitchen manager.
The majority of institutions across the USA utilise organic waste from their dining room and kitchen areas to produce compost. The Appalachian State University utilises food waste through a composting system that converts about 105 tons of waste per year to compost [
23]. Moreira [
24] in the case study of solid waste management at the University of São Paulo’ reported that per day, 233 kg of waste were generated in the restaurant established in the school, of which 84% represented organic matter. A similar study at the University of Tabriz, Iran could reduce waste on campus by 80% by producing compost and the recycling of recyclables within the university campus [
25]. The study by some students in an Indian campus, Calicut, went further to generate biogas from the organic waste on campus, they reported that a daily generation of 200 kg organic waste produces 50 kg of biogas (1.29 cylinder/day). This is highly resourceful as an alternative clean source of energy [
26]. Moreover, at the University of Johannesburg South Africa, characterisation of waste to energy project, compostable waste generated accounted for 32% of the total waste generated on campus [
27]
3.5. Waste Audit Results of Selected Schools in the University of Venda
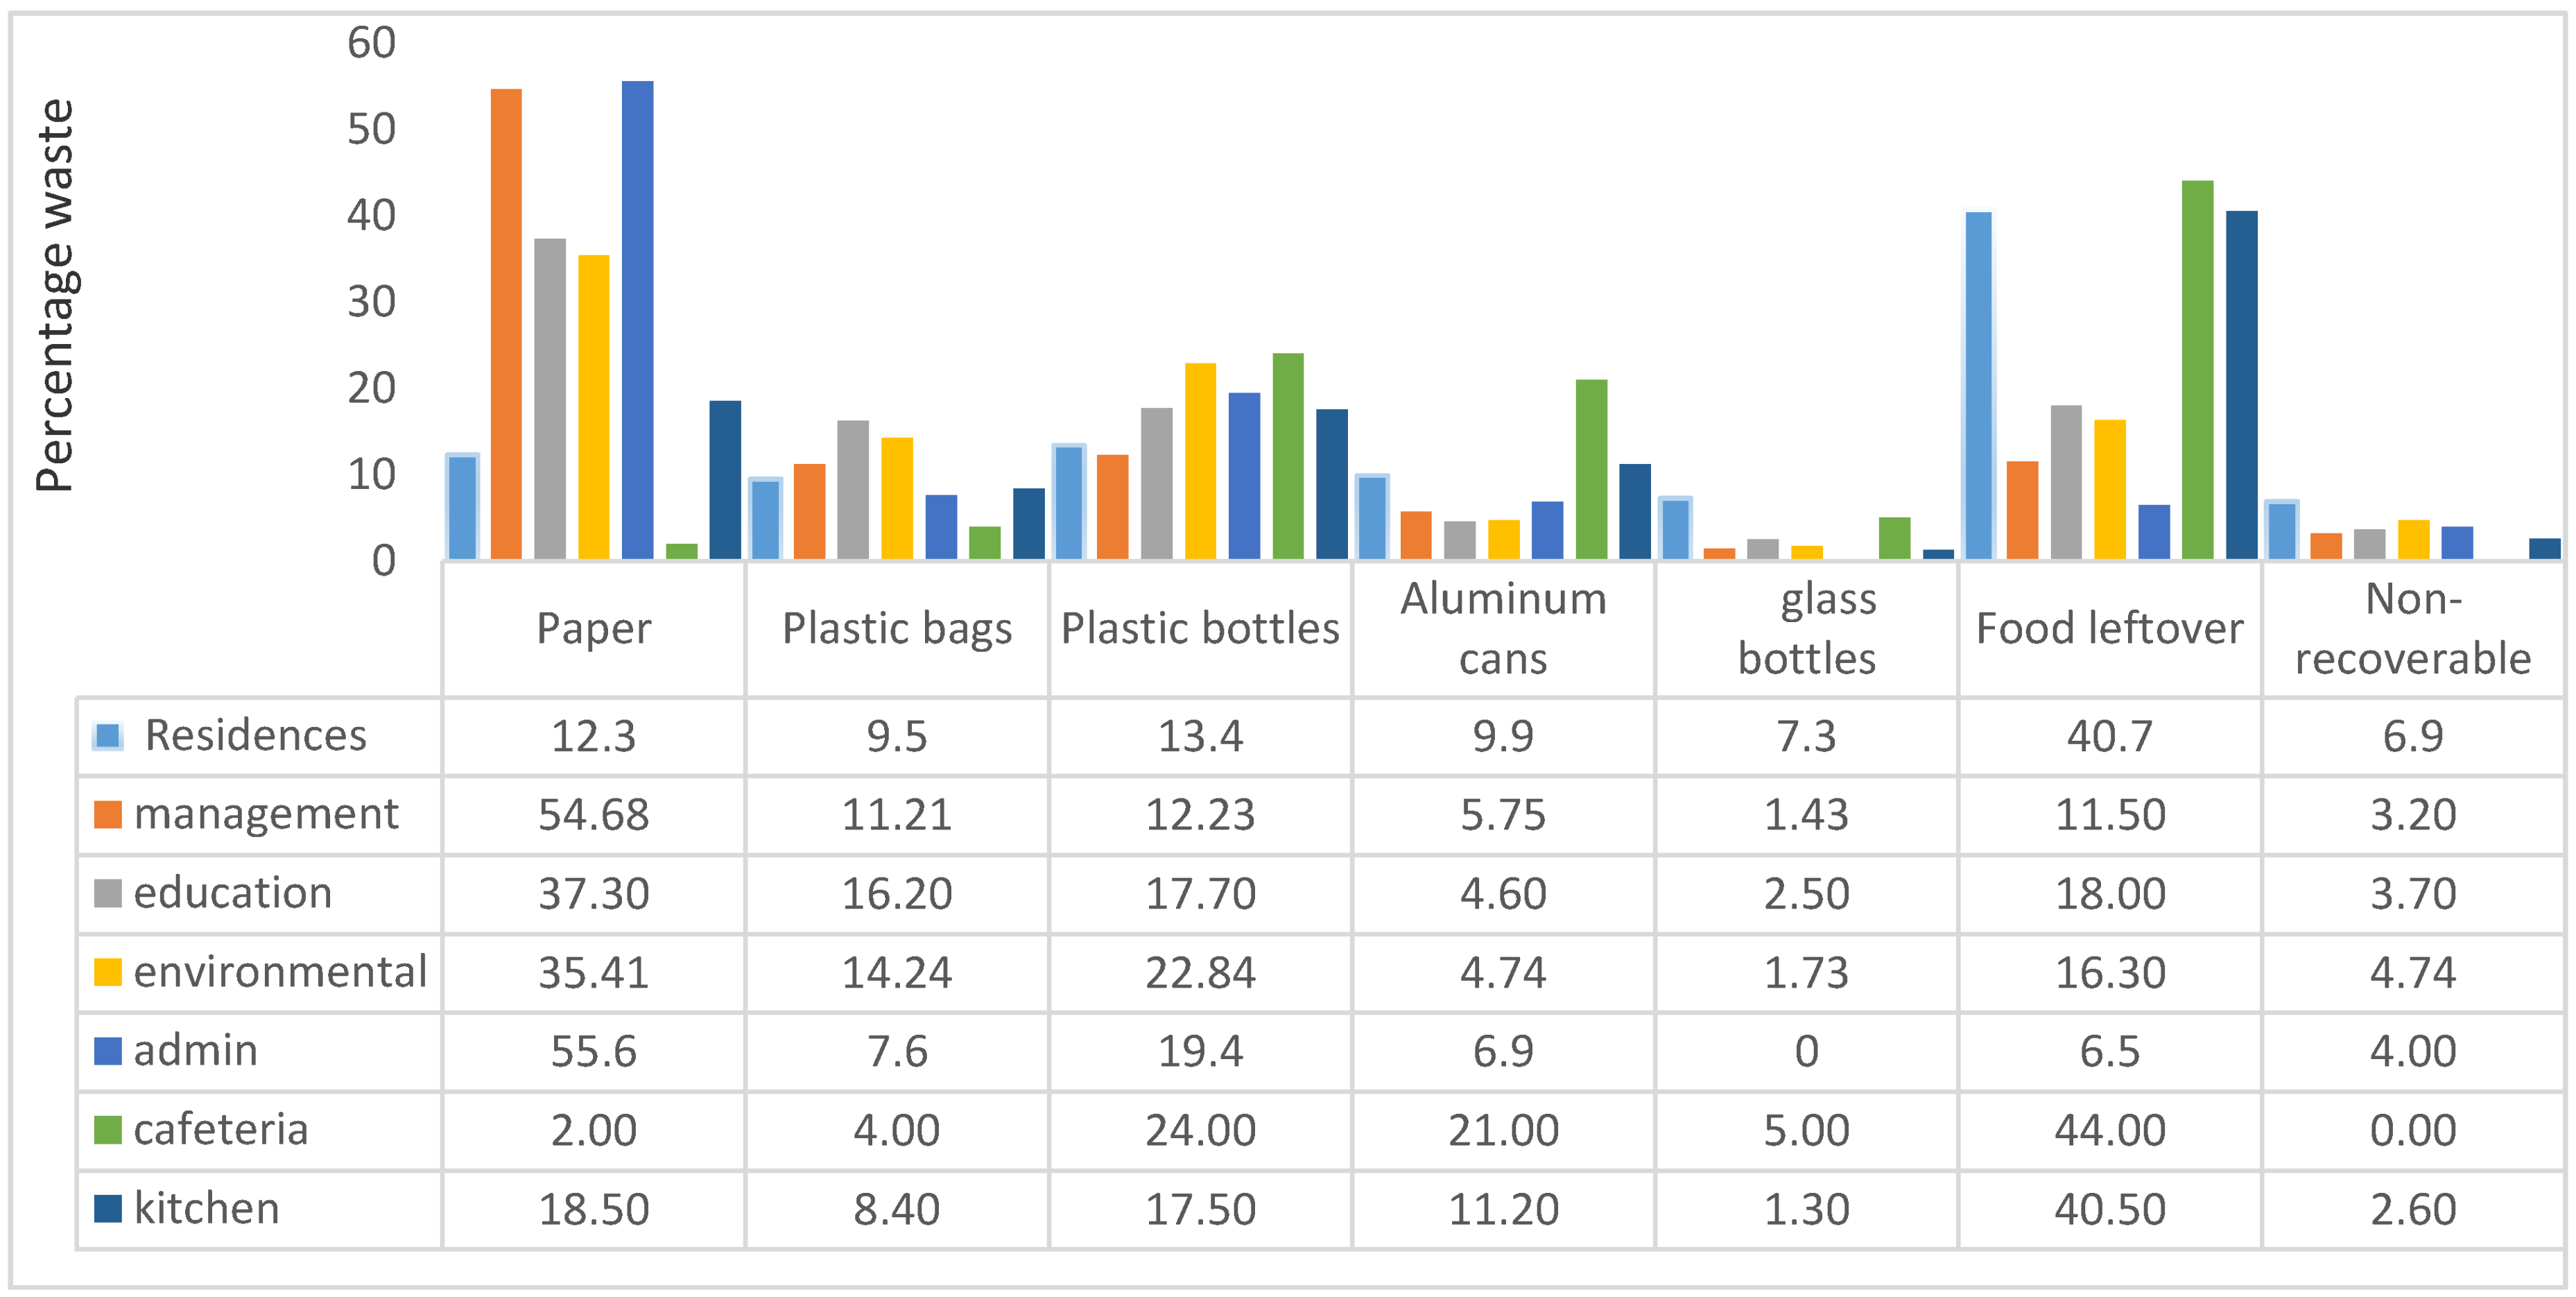
From the outcome of the waste audit process in the academic buildings, the larger proportion is represented by paper—of which a larger percentage of paper waste was potentially recyclable (
Table 6). The School of Management Sciences recorded the highest generation of paper waste at a percentage of 54.6%, which was followed by plastic bottles at 12.2% (
Table 6). This result was in line with the study of Vega et al. [
9] at the Universidad Autonomous Baja California (UABC) Mexicali campus, who found that waste generated in school and administrative buildings constituted mostly paper of which 33% was potentially recyclable. The high record of paper waste in the schools reflects the dominant learning and research activities that require paper in a typical academic area with lots of students and staff using paper in their offices and classrooms. Moreover, paper from cardboard, boxes, and packages contribute to this.
Currently, there is no separation of paper from other types of waste in the university which often leads to the contamination of papers. The School of Environmental Sciences recorded the lowest generation of paper waste (35.3%) among the three Schools in the University studied. The possible reasons for this could be because the staff and students of the School of Environmental Sciences are more conservative towards the use of resources, due to their resource conservation and management knowledge. Moreover, the population of staff and students that contributed to the waste generation varied from school to school, and this is also a determinant factor in the amount of waste generated. The Schools of Management and Education have more students and staff than the School of Environmental Sciences.
Several studies have established a link between population and waste generation rates, reporting that the higher the population, the higher the waste generation rate [
28]. However, the School of Environmental Sciences recorded the highest amount of plastic bottle waste (22.2%). This could be because of a mini food mart that operates within the School of Environmental Sciences, unlike the other Schools, thus attracting students from other schools who contribute to the quantity of waste generated. The percentage of recyclable waste from the audit in each of the schools is over 70%. The research carried out by Mbuligwe [
12] on solid waste management within three campuses in Tanzania, bears similarity to the result in this study; a waste recovery potential of 71.6% to 86.8% was recorded from the schools. This shows there is a high potential for recovery. Gakungu [
29] proved that there was a high potential for waste to be diverted to profitable use to a high degree in school faculties through recycling and composting activities.
The School of Education and Environmental Sciences were found to generate the highest portions of plastic bags and plastic bottles, respectively. These plastic bags are contaminated from source, and a local waste picker stated that the contamination makes sorting difficult and requires extra cleaning process after sorting. The volume of plastic bags in the waste generated at the University Tecknologi Malaysia was also high (plastic 17.2% and plastic bags 31.8%), which prompted an establishment of the Green office initiatives in the University [
30]. These indicate the importance of source separation in solid waste management, which reduces the rate of contamination of recoverable waste components.
The per capita solid waste generation at the selected schools was calculated from the total generation rate and the number of registered students and staff in the 2019 academic year as in
Table 7, which gives a value of 0.01 kg to 0.012 kg/capita/day. The School of Environmental Sciences recorded the least annual waste generation rate (5.7 tons) per year, while the School of Education recorded the highest rate of waste generated (8.1 tons) annually. The reason for this could be because the School of Education has the highest number of staff and students compared to the other schools. The mean of daily waste and extrapolated annual waste generation is presented in
Table 7.
3.6. Waste Audit at the Main Administrative Building
The waste audit results at the main administrative building are presented in
Table 8. Paper waste was found as the highest percentage of the waste stream at a percentage of 55.6%, followed by plastic bottles at 19.2%, while food waste was only 6.5%. This is because there is a lot of paper usage in administration, particularly dealing with staff and student records, communication to students and staff, mails, etc. However, with the increase in digital technology for communication, paper usage is expected to reduce, and hence, minimum paper waste is likely to be realised. A study in the U.S.A examined how Internet use has affected the demand for newsprint and paper in different regions of the world. It was found that Internet adoption reduces the demand for paper in all regions [
31].
3.7. Summary of Waste Audit in all Activity Areas
The University of Venda on the average generates about 3457 kg (3.45 tons) of waste per day (
Table 9), the volume of daily waste generated in Univen was found to be three times higher than the daily waste generation on Autonomous University of Baja California (UABC) with 1 ton/day [
25].
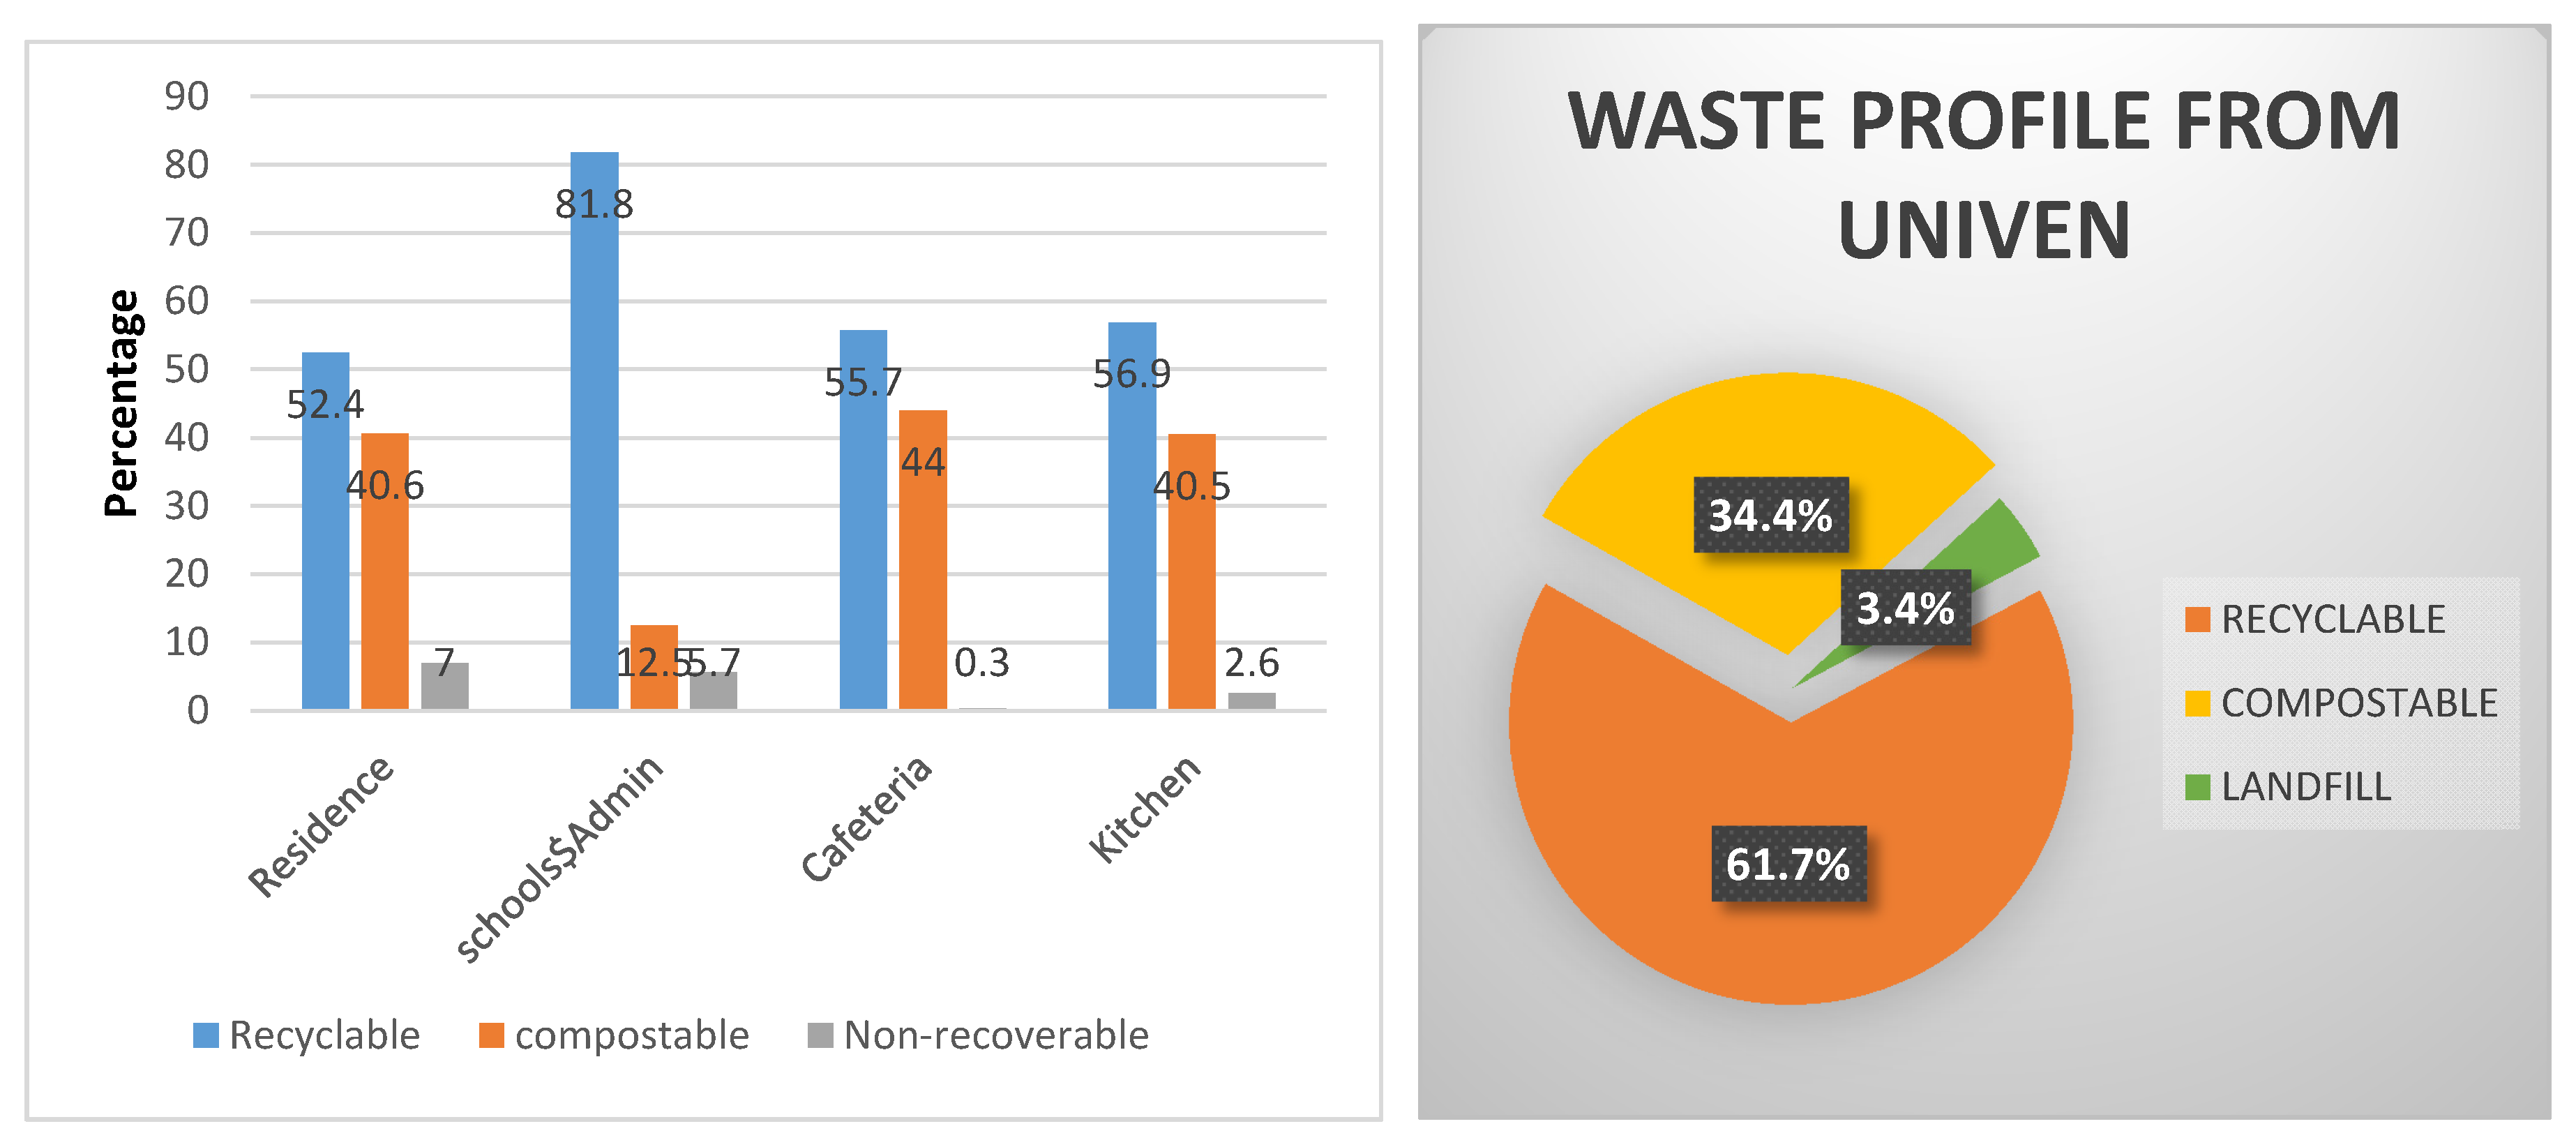
From the overall waste composition as presented in
Figure 3, all the activities areas have a recycling potential of above 50%, and this is a good indication that waste generated across the campus will be significantly reduced if recyclables are targeted for recovery. Therefore, strategies on the reduction of paper waste, such as the use of digital communication technology, should be intensified in these areas for optimum results.
Furthermore, the compostable waste also recorded a high proportion showing that if the institution can target both recycling and compostable waste, the institutional waste could be reduced by 96%. There appears to be a trend in types of waste generated across the activity areas. The residences, kitchen, and cafeteria generate the highest amount of organic waste (pre-consumer and post-consumer food waste); therefore, strategies to harness the organic waste is much more optimal in those areas. Researchers on solid waste in China have suggested that source separation of food waste is a key solution to the problem of solid waste [
32,
33].
By weight, recyclable waste constituted the highest percentage of the waste profile (61.7%), with schools and administrative buildings being the highest generators (81.8) (
Figure 4). Compostable wastes were highest in the residence and kitchen (40.6% and 40.5%), respectively. The non-recoverable waste that would be sent to the landfill represented 3.4%
The generation of waste and its composition is different from one country to another, and also different between regions of the same country, this can be attributed to variation in population size, urbanisation, living standard, and the prevalent economy. Factors, such as climate, level of environmental education, might also influence the characteristics of the waste—for example, warmer climate may influence the consumption of cold drinks which leads to the generation of plastic and aluminium cans.
Several scholars have reported variations in waste compositions due to climatic variability, and have showed that more wastes are generated during the hot season [
34,
35]. It is also believed that waste generated in the university of Venda is more likely to follow the general trend of municipal waste because more waste is generated in the hot season, due to increase in climatic temperature. Products, such as cold soda and beverages, would lead to an increase in waste generated across the university campus except during the holiday period.
This results in more generation of waste from bottled containers and cans. It is worthy of note that if the sampling is carried out during another season of the year, there will be a relative change in waste composition and generation. Therefore, if there be need to appraise the trend of waste composition and generation across the year, a similar sampling in another season could be performed. The result reported in this study was carried out during the month of May, and therefore, the characterisation results presented are valid with respect to the time in which the study was carried out and for institutions with a similar condition.
4. Conclusions
The study presented the results of the waste characterisation exercise on UNIVEN campus on the premise that reliable data on solid waste composition are very crucial for sustainable resource recovery. The average daily generation of solid waste in the study area is 3.4 tons per day. The waste generated indicates a high recovery potential from waste generated in the residences, cafeterias, kitchen, school, and administrative buildings. The highest portion of waste lies within the potentially recyclable categories which as an aggregate, represents 52.4% in the case of residences, 80.2% in the cafeteria, 56.9% in the kitchen, and 89.1% in the schools and administrative buildings.
Furthermore, the compostable organic waste from the activity areas accounted for 26%. Higher institutions of learning in developing economies have a great potential to recover a large percentage of their waste by investing in waste separation at source to avoid contamination of potentially recoverable materials. This will require the provision of three or more colour-coded bins, for recyclable, compostable, and trash at the academic and administrative buildings to facilitate recycling and partnering with waste recyclers for collection of the recycled waste. This will, therefore, serve as a monetary income to the institution and a significant opportunity for South-Africa as a developing economy to unlock the economic and environmental benefits in material recovery. Environmental awareness is also recommended to change the perception and attitude of staff and students towards environmental sustainability in the university.
Food waste from the kitchen and cafeteria is biodegradable, and as such a system for bio-gasification to useful fuel can be considered for harnessing the biodegradable waste compositions. This can be used to power cooking and heating in the cafeteria and residences. Furthermore, food waste can be used as organic fertilisers in the school farm within the university. Moreover, this study recommends a compost site on campus to produce nutrient-rich soil as manure for growing vegetables and gardens. The institution should consider partnering with the immediate community for the collection of food scraps and pre-consumer food waste. The need to formalise electronic mode in passing out memorandum and submission of projects by students is highly recommended. The non-essential waste can be deposited at the landfill site for further processing.


