1. Introduction
With the progress of technology and the modernization of transportation vehicles, High Speed Rail (HSR) services have been actively developed and constructed in various countries, which has greatly shortened travel time, created positive business activities, and promoted the growth of tourism. In addition, the generalized travel costs by engaging in tourism have been reduced (although the travel costs have been increased slightly, the total travel time has been significantly reduced), which will significantly improve the accessibility of tourist areas. Therefore, the development of the tourism industry is positively correlated with the development of the HSR, and this argument has been verified by many related studies (Wang et al. [
1]; Masson and Petiot [
2]; Feliu [
3]; Chen and Haynes [
4]; Delaplace and Perrin [
5]; Delaplace et al. [
6]; Hernández and Jiménez [
7]). Furthermore, related research has also pointed out that the development of the HSR has led to changes in tourism behaviors, such as fewer staying nights for tourists and more tourist groups (Klein and Claisse [
8]).
Khadaroo and Seetanah [
9] proposed that new infrastructure development will also affect tourism demand. The Spanish HSR has been operating for more than two decades, making it the oldest HSR in Europe. Moyano et al. [
10] pointed out that nearly half of the Spanish cities have HSR services, which are efficiently connected to Madrid. Spain even has an ongoing issue, as it carefully considers the impact of the new HSR route plans on the tourism industry (Guirao and Campa [
11]). Campa et al. [
12] pointed out that tourism data from 47 provinces in Spain from 1999 to 2015 showed that HSR services have significantly positive impact on the promotion of tourism. Kurihara and Wu [
13] used a general regression model to explore the cities connected by the Shinkansen-extended network, and discovered that the tourism demands of tourist attractions closer to the HSR stations have increased significantly (the number of tourists has increased).
Delaplace et al. [
14] conducted a questionnaire survey to explore the HSR selection behaviors of tourists visiting theme parks (Disneyland Paris and Futuroscope Parks), and found that convenient transportation enhances tourists’ willingness to go to the parks. Pagliara et al. [
15] explored the correlation between the number of tourists, the number of overnight days, and the volume of air traffic in 77 regions in Italy covered by high-capacity trains or HSR networks from 2006 to 2014, and established the Poisson regression model, which uses generalized estimating equations (GEEs) to calibrate the results. The results showed that HSR is positively correlated with regional tourism volume, and verified a causal relationship between different factors; therefore, when exploring the correlation between the tourism volume and the transportation system in Taiwan, this study considers and verifies the causal relationship between factors.
Chen and Haynes [
4] showed that China’s HSR network was launched in 2004 for the purpose of promoting economic growth through HSR trunks. The HSR trunk network have promoted the development of HSR stations in the regions and have increased the number of local tourism. The increasing number of HSR stations has improved accessibility to tourist attractions in small- and medium-sized cities; but frequent stops are inevitable, which will increase the travel time of travelers (the benefits of saving travel time may be lost). Weaver and Lawton [
16] showed that, because transportation is an integral part of the tourism system, any new technologies innovating the transportation system will also have significant impact on the tourism industry; moreover, not all regions will see improved economic benefits after building a HSR (Wang et al. [
17]). Regarding the development of HSR, other modes are its competitors, such as automobiles or air transportation (Cascetta et al. [
18]; Pagliata et al. [
19]). Therefore, a profound discussion of the correlation between HSR development and tourism in Taiwan is one of the important research topics for Taiwan’s development towards a large-scale tourism region in the future. However, there is a lack of discussion of the correlation between HSR and the tourism industry in Taiwan, which is another important motivation for this study Based on the above literature review, most studies pointed out that HSR service is positively correlated with the number of tourists. Although HSR fares are higher, the advantages of high speed and safety make HSR popular with travelers. However, the number of local attractions and the regional population may still affect the decisions of travelers regarding whether to take the HSR. Therefore, in order to explore the localization effect in Taiwan, the Difference-in-Difference method (DID) is used to analyze the impact of HSR on tourism in Taiwan. The modeling of the implementation process is based on the monthly data of different counties and cities, which may be limited by variables. Different areas and time may be incorporated in the implementation process, in order to achieve the best explanatory ability. The results of this study may provide an important reference for the development strategies of counties and cities in the future.
The rest of this paper is structured as follows.
Section 2 reviews the materials related to this study.
Section 3 reviews the Difference-in-Difference model framework.
Section 4 describes the data collection and the basic exploratory analysis.
Section 5 shows the results of the model estimations and the results of HSR’s effects. The final section presents conclusions and recommendations.
2. HSR and Tourism in Taiwan
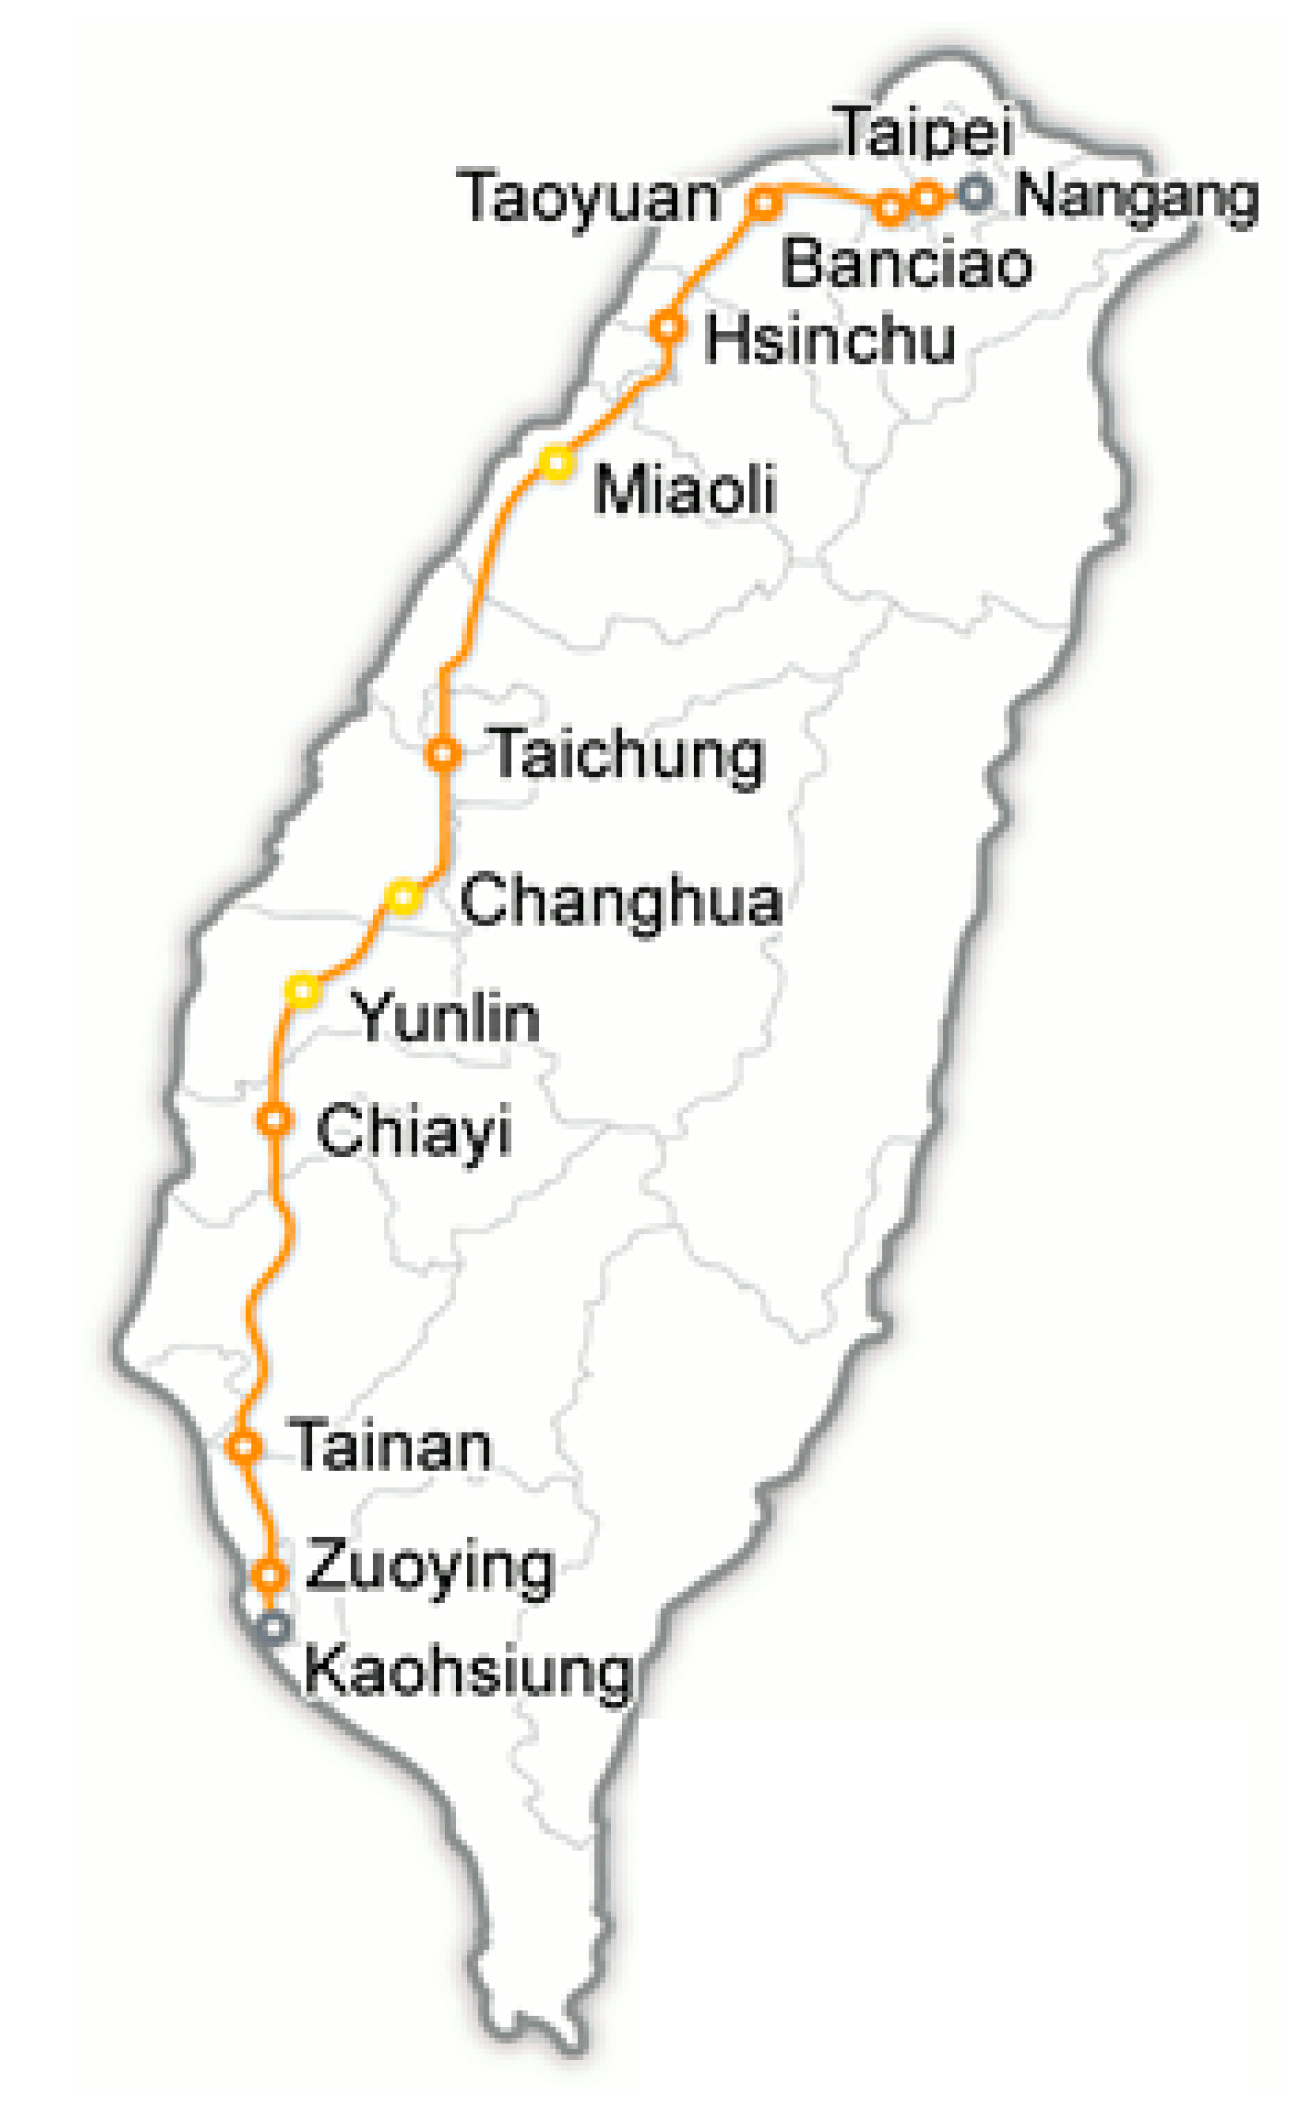
In Taiwan, the Taiwan High Speed Rail Corporation officially launched its HSR line in March 2007 (Taipei Station to Zuoying Station), which marked the first time that Taiwan promoted private investment to engage in major national infrastructure construction, and the total investment exceeded NTD 500 billion. The HSR, which passes through twelve counties and cities in western Taiwan, has a total length of about 350 km, and a maximum operating speed of about 300 km/h, making it one of the important transportation means for long-distance journeys in western Taiwan, as it shortens travel time from north Taiwan to south Taiwan to 90 minutes. The high-volume, safe, fast, punctual, and high-quality service has changed Taiwan’s western corridor into a “one-day living circle”. Twelve stations are planned along the HSR line (as shown in
Figure 1). Eight stations were launched in 2007; Miaoli, Changhua, and Yunlin Station (three stations) were launched in 2015, and Nangang Station was launched in 2016. Some of these stations are connected with other rail transportation, such as Taiwan Railways and the MRT (Mass Rapid Transit), to create convenience for the people and improve the convenience of tourism.
Regarding the growth of the operational performance of Taiwan’s HSR, in August 2010, the cumulative passenger volume exceeded 100 million passengers; on 17 December 2012, the cumulative passenger volume officially exceeded 200 million passengers; later, in January 2015, the cumulative volume exceeded 300 million passengers. On 28 February 2016, the daily passenger volume exceeded 267,000 person-times, which is the highest daily traffic volume since the HSR began operations. As of July 2016, the cumulative passenger volume reached 439 million passengers. Currently, the average daily passenger volume exceeds 160,000 person-times.
At present, the HSR only connects major cities, and provides reliable services and short travel time, while the Taiwan Railways Administration (TRA) owns about 20% of the intercity travel market share. As most TRA stations are located in central business areas, it is still believed that TRA can compete with HSR because they serve some downtown areas remote from HSR stations; however, the competitive advantage of TRA is lost when it comes to longer distances. As a result, the traditional system needs to cooperate with the HSR service schedule, in order to provide passengers with more seamless services. Cvelbar [
21] pointed out that tourism infrastructure and attraction management in developing countries are the main factors to enhance competitiveness, and the competitiveness of attractions depends on the overall economic development, transportation construction status, and business environment. Consequently, this study considers the overall transportation developments as a model variable through the implementation of a multi-year plan, in order to better understand the relevance between tourism and the development of the transportation environment in Taiwan.
On the other hand, the statistical data from Tourism Bureau-Analysis and statistics on the residence of tourists to Taiwan in June 2016 showed that the number of global tourists to Taiwan has shown a steady increase, from 800,147 tourists in the same period in 2015 to 817,800 tourists in 2017, thus, the total number of tourists to Taiwan increased by 2.21%; in the long-term (2002–2017), the overall number of tourists continued to grow. With the deployment of multiple transportation systems, the HSR operations, the implementation of toll collection on national highways, the competition of Taiwanese airlines, and the transformation of Taiwan Railways services, the relationship between different transport systems and tourism volume should be further explored, in order to provide an important reference for future positive development.
In order to explore the correlative factors between a transportation system and tourism volume, the influences of regional characteristics (if the HSR is accessible to the region) and the time factor (whether the HSR is in operation in time t) of the growth of the tourism volume are considered, and therefore, the DID method is suitable to be used to capture their influence.
3. DID Model
3.1. DID Related Studies
Card and Sullivan [
22] applied the DID method to the analysis of economic regions, and explored the impact of vocational training subsidy programs implemented by the government on employment. The employment conditions before and after the implementation of the vocational training subsidy program were collected, and the impact of the vocational training subsidy program was analyzed. Card and Krueger [
23] also applied the DID method to analyze the influence of increasing the minimum wage in the state of New Jersey on the employment of fast-food workers. Yip and Eggleston [
24]) investigated the impact of the change to the payment system of Hainan Island from volume-based compensation to person-based compensation on hospital operation.
Green et al. [
25] used the DID method to compare traffic accidents in regions with traffic jam taxes and other regions without traffic jam taxes in London, and they discussed the different regions, different distances, different severity of accidents, and bicycle and pedestrian groups. As DID can effectively capture the differences in discussed topics, the DID model in this study aims to compare the situations before and after the implementation of the regional toll collection policy. Albalate and Fageda [
26] evaluated the impact of HSR in Spain on tourism and aviation, collected relevant data from 1998 to 2013, and verified the impact by the DID method, and found that HSR has direct impact on the number of tourism trips, where the important explanatory variables included the number of overnight stays, HSR transfer status (sites and routes), regional population, labor force, and weather conditions (rainfall); however, HSR can substitute air travel to a certain degree, such as flight routes with a length of less than 700 km, and general railway or road travel distances of more than 200 km.
To sum up, in the application of the DID method, it should be noted that the data of all the variables should be collected in the same period, in order to clearly reflect the differences in the overall data.
3.2. DID Model Framework
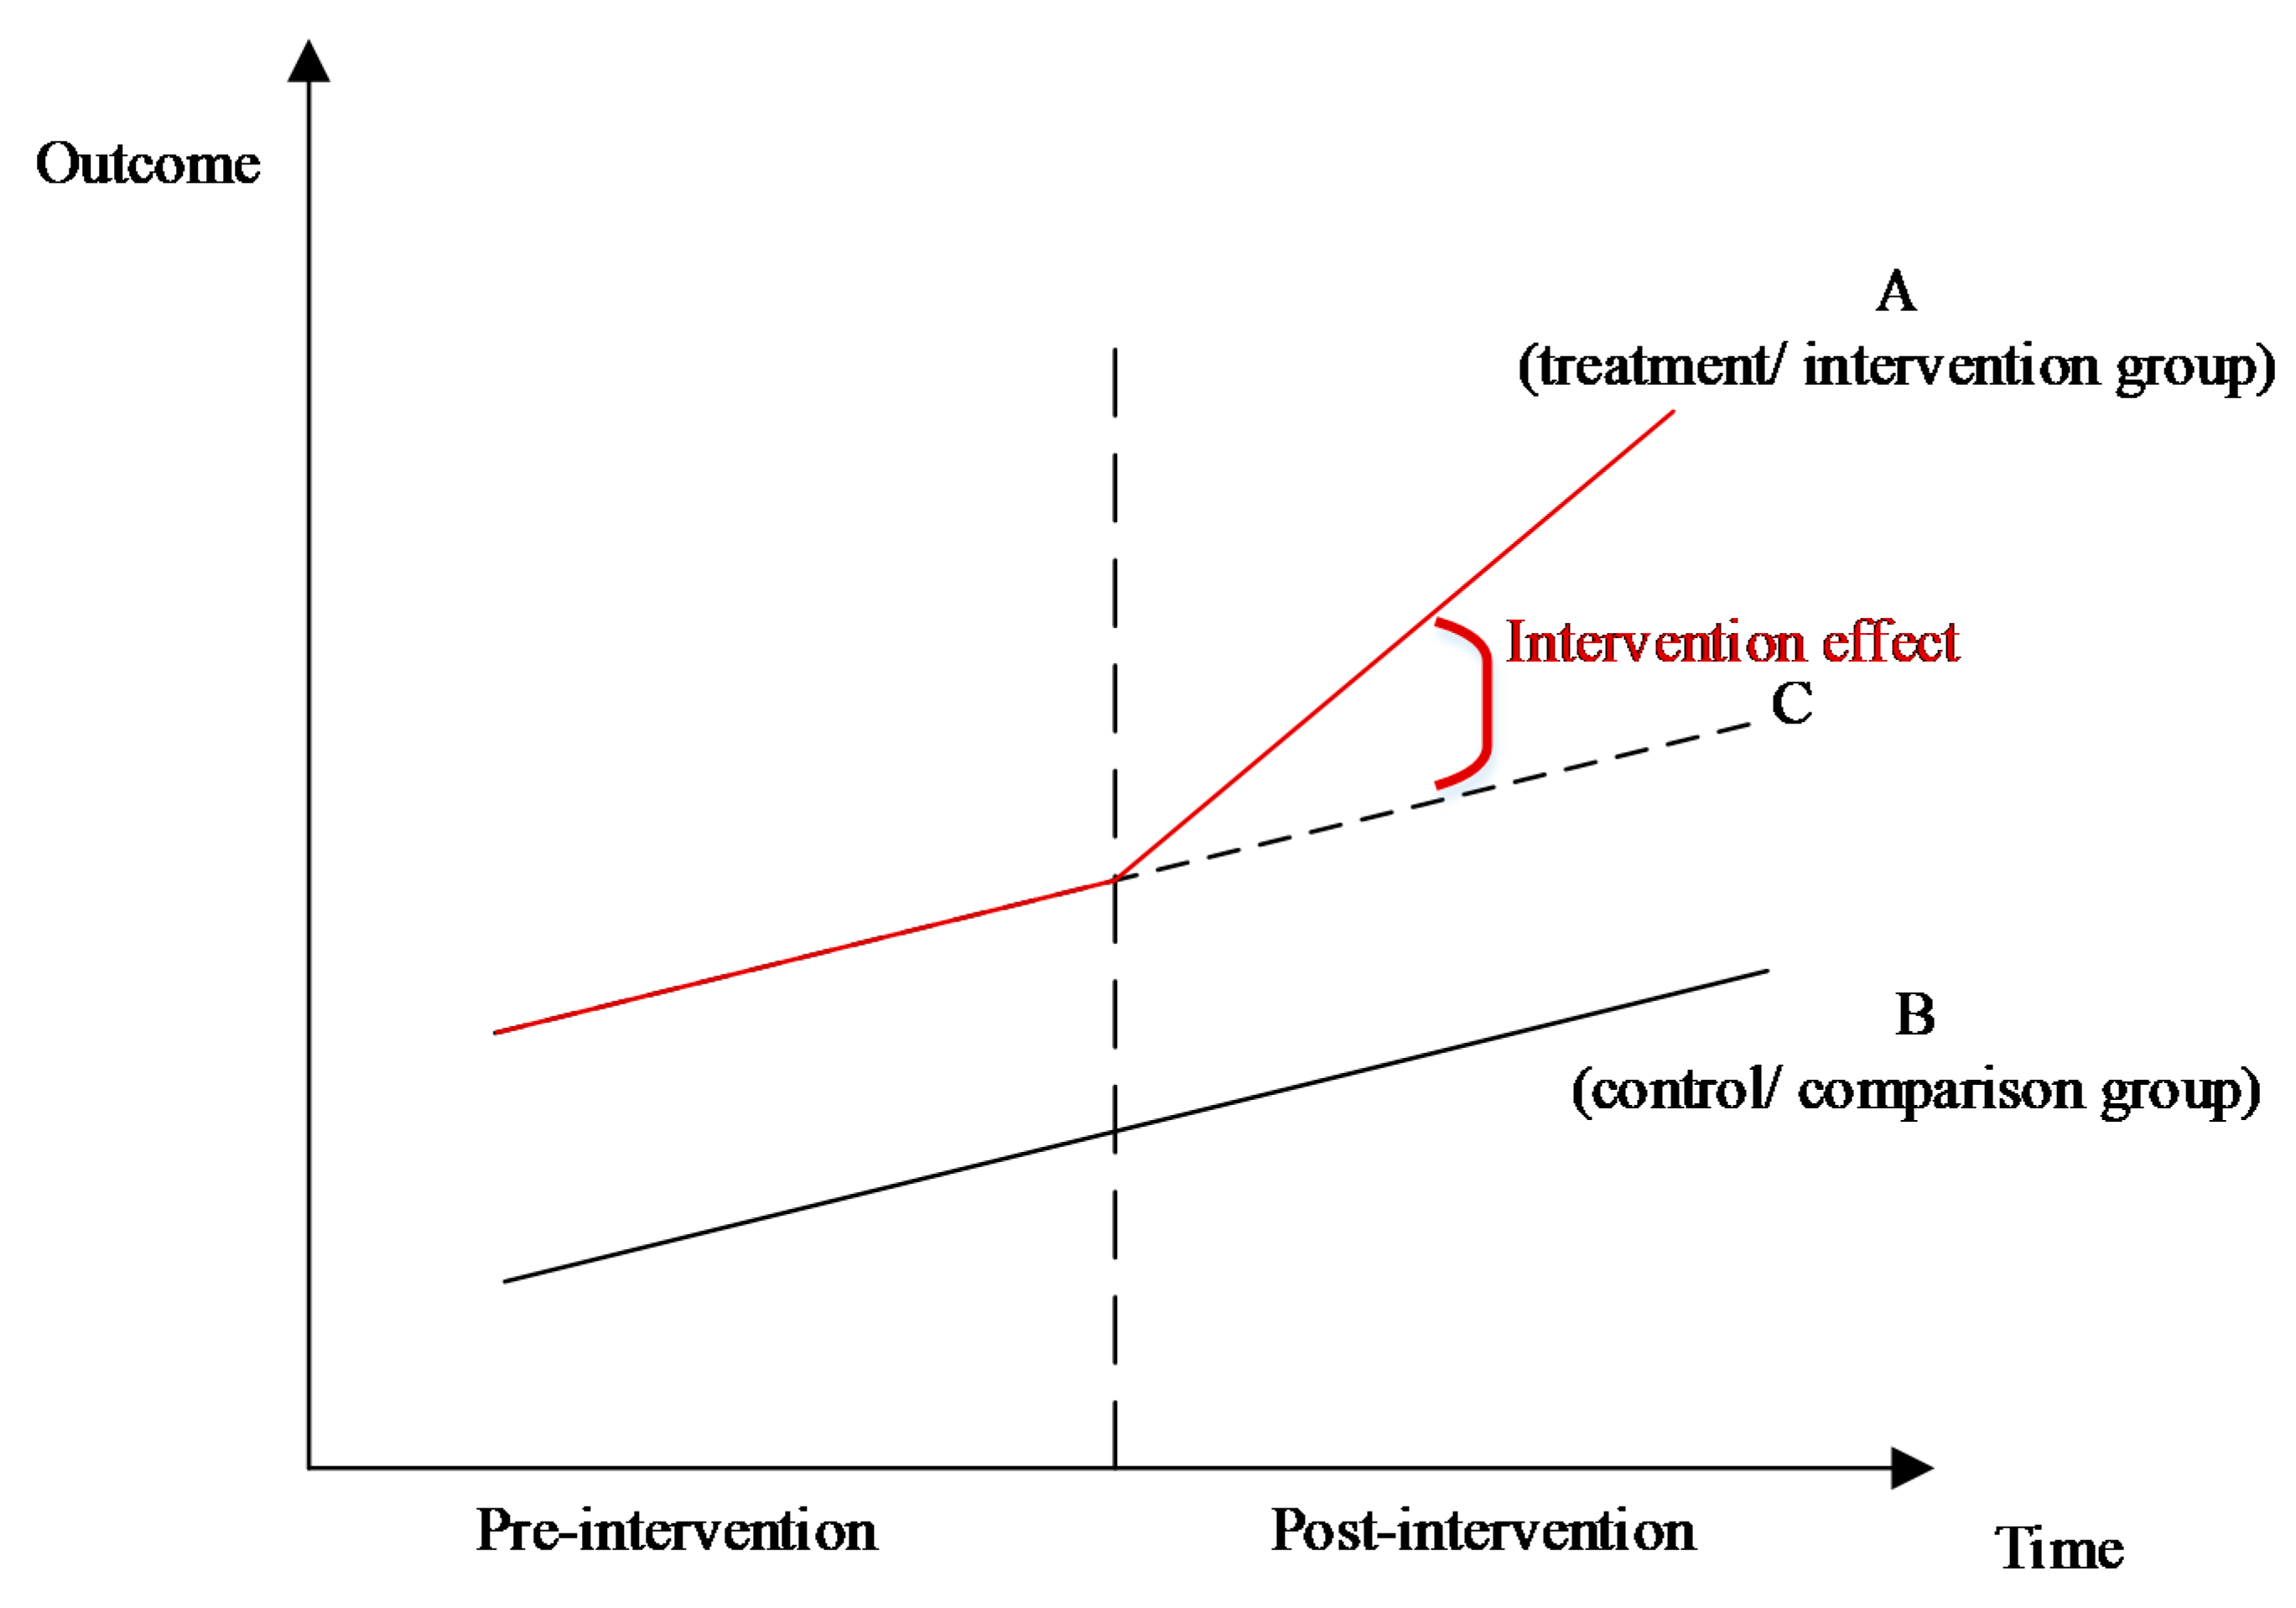
In order to estimate a causal effect (see
Figure 2) with treatment and control groups by using longitudinal data, a quasi-experimental approach (DID model) is considered as a proper method.
The treatment effect is defined as comparing the outcome changes over time between treatment group (intervention group) and control group (comparison group).
We applied DID model to investigate the relationship between the number of tourism trips and HSR passenger changes. It required pre-/post-intervention data (panel data), and relied on a less strict exchangeability assumption (the unobserved differences between treatment and control groups are the same over time, it removes biases in post-intervention period comparisons between the treatment and control groups). Hence, DID is a suitable technique to fit our study objective.
The regression model is the basic estimation procedure, and the regression model is expressed as follows: (STATA 13.0 was used to calibrate DID model in this study).
In Equation (1),
Treati and
Afteri are dummy variables: when
i = 1 indicates the treatment group,
i = 0 indicates the control group;
t = 1 indicates after the experimental treatment,
t = 0 indicates before the experimental treatment. The regression coefficient relationship is summarized in
Table 1:
shows the difference between different groups at the same time point;
shows the difference between same groups at the different time point;
means that when both treatment and after treatment are 1, it represents the real experimental treatment effect; if there is no effect of experimental treatment effect,
is 0.
4. Data Description
4.1. Data Collection
The basic data in this study is collected and organized in
Table 2. The tourism data includes the number of tourists, as collected from 2002 to 2016. In addition to the Tourism Bureau, data was also collected from the county and municipal government agencies and HSR Corporation in Taiwan. In order to understand the impact of HSR development on the number of tourists, the access system of HSR was also considered as a variable, as shown in
Table 3.
4.2. Data Analysis
The socioeconomic variables include the size of the employed population, the unemployment rate, and the size of land area. Specifically, the unit of the size of the employed population is 1000, meaning the average size of the employed population is about 1.34 million, while the specific size of the employed population may vary in different counties, cities, and years. The minimum and maximum sizes of the employed population are about 220,000 and 3.97 million, respectively, which indicates a huge gap in the size of the employed population in different regions. It was inferred in this study that counties and cities with a larger employed population may attract more tourists, and the number of tourism trips attracted by the high-speed rail is also increased; on the other hand, the unit of the unemployment rate is a percentage, which is defined as the percentage of the unemployed population in the total labor force. The regions with a higher unemployment rate may attract fewer tourists due to their insufficient economic development conditions.
In addition, the size of land area is based on the announcements of the county and city governments; if the region has a large land area, it is estimated that it also has rich tourism resources, and HSR operations will likely drive the growth of tourism. Then, the data of tourism and recreation is based on the number of tourists and recreation-seeking individuals in different counties and cities, as announced by the Tourism Bureau, including national scenic areas, national parks, public recreation areas, county scenic areas, forest recreation areas, beaches, private recreation areas, temples, historical buildings, and others (such as night markets, etc.). Analysis of tourism statistics found that the number of tourists visiting temples is the highest, followed by the number of tourists in public recreation areas and national scenic areas, which aligns with the expectations (Tourism Bureau, Republic of China (Taiwan), 2018). Most temples are located in the downtown areas, followed by those located in non-urban areas close to downtown areas, thus, temples are easily accessible by public transportation or mass transportation.
The access system of the HSR includes railways (Taiwan Railways) and the MRT system. The binary variables correspond to whether or not they are open at the time of analysis. Moreover, analysis of the related transportation volumes (as shown in
Table 4) and tourism volumes shows that, at some stations, Taipei, Banqiao, Taichung, Tainan, and Zuoying, the tourism volume may grow after the HSR operations are available; at different time points, after HSR operations are made available, the overall tourism volume differs greatly; and the related tourism volume exhibits a jagged shape, which is possibly due to seasonal characteristics or events held in different regions.
In order to avoid analysis errors resulting from the different operation dates of different stations, further verification was conducted, which shows that the number of tourists before and after the operation of most stations have significant statistical differences (
Table 5). However, these differences are not found in Miaoli, Changhua, or Yunlin, possibly because the three stations have only begun operating recently, and the public transportation system for regional tourism and recreation has not been fully established.
5. Model Estimation
Based on the DID method commonly used in the experimental design process, the experimental analysis framework of this study is built on whether the counties and cities have planned HSR services before and after the HSR operations in Taiwan, and then, the impact of HSR on regional tourism is investigated. The modeling is based on simple regression analysis, with the number of regional tourists (10,000 tourists) as the dependent variable, and other influencing factors as the independent variables.
In the model estimation procedure, we included all HSR data and found that the impact of HSR operations brings negative growth (about 280,000 person-times), which is possibly because the HSR stations in Miaoli, Changhua, and Yunlin stations were launched later in 2015. However, Nangang station is close to Taipei station geographically, and the other access system was well developed, hence, we kept them in our study.The counties and cities that may generate model estimation errors were further screened.
After the relevant samples of Miaoli, Changhua, and Yunlin stations after 2015 were removed, the model estimation results are shown in
Table 6. Counties and cities with HSR stations, HSR operations, and DID are the main significant variables, which means the regions with direct HSR services, and HSR operations and their cross-effects, can increase the number of regional tourists, which highlights that HSR services may stimulate tourism development directly or indirectly. In addition, the co-construction of HSR stations with the MRT can increase the number of tourists mainly because the MRT stations are close to the important attractions in urban areas; regarding the classification of tourism and recreation attractions, national scenic areas, national parks, public recreation areas, county scenic areas, temples, and historical buildings can all drive the growth of tourism; however, forest recreation areas, private recreation areas, and beaches are not significant in the model, which implies that such tourism and recreation attractions may not be reflected in this model due to the inconvenience of transfers at HSR stations.
In addition, more outbound trips from HSR stations will drive the growth of tourist arrivals, which shows that, while the overall HSR traffic volume has increased, the proportion of tourism trips remains unchanged; higher average HSR fares represent longer trips, which implies that tourists who are farther away from important tourism and recreation attractions are more likely to use HSR. It also reflects that the HSR can effectively serve across counties and cities. Finally, the impact of the observation time zone on the number of tourists is significant in the summer (June–September) and winter (January–March) in Taiwan, which is probably because students are on holiday, which is consistent with prior knowledge.
The model results were further applied to estimate the impact of DID, as shown in
Table 7. There is a significant difference in the growth of tourism volume driven by HSR services in counties and cities without considering HSR operations; comparing the difference with or without stations, the difference before HSR operations is small (about 400,000 person-times per month), which means that these counties and cities originally had their tourism resources (counties and cities without HSR stations include Nantou, Yilan, Hualien, Taitung, Pingtung, etc.). The difference in tourism trips by HSR operation reaches 1.03 million; considering DID, tourism trips are increased by about 630,000 through HSR operations.
6. Conclusions and Suggestions
In the past, to investigate the impact of experiments, most medical and public health researches divided the experimental subjects into experimental groups (under the experimental effects) and control groups (not under the experimental effects). The differences before and after the experiments, as well as the change factors and effects, are important results; one of the methods commonly adopted in nature experiments or quasi-experiments is the Difference-in-Difference (DID) method. This study investigated the correlation between the construction and development of HSR services and the number of tourists in Taiwan.
The contribution of the research results is that more than 10 years of relevant databases have been collected from early 2002 to the end of 2016, which covers the socio-economic aspect, tourism, recreation, HSR traffic volume, and access facilities in 21 counties and cities in Taiwan (excluding the outlying islands). The possible correlations and influencing factors were revealed through the aggregation of the time-series data.
The analysis of HSR traffic volume and tourism volume shows that, at some stations, including Taipei, Banqiao, Taichung, Tainan, and Zuoying, the HSR operation may boost the growth of the tourism volume; and the related tourism volume exhibits a jagged shape, which is possibly due to seasonal characteristics or events held in different regions. In order to avoid analysis errors resulting from the different operation dates of different stations, further verification was conducted, and the results show that the number of tourists before and after the operation of most stations have significant statistical differences.
The model results reveal the existence of DID. The significant explanatory variables include the construction of HSR stations with MRT stations, national scenic areas, national parks, public recreation areas, county scenic areas, temples, and historical buildings, which all promote tourist arrivals. More outbound trips at HSR stations will drive the growth of tourist arrivals; higher average HSR fares represent longer trips, which implies that tourists who are farther away from important tourism and recreation attractions are more likely to use HSR; summer (June–September) and winter (January–March) are the periods that have seen significant impact.
This study found that HSR services can bring about the growth of tourism trips; therefore, the following two recommendations are proposed: (1) In terms of HSR operation, while business trips should be accommodated in future operations, the development of tourism trips should be continuously developed, which can be regarded as one of the important measures to achieve overall operation growth. Regarding related promotions, apart from existing HSR vacations, combining regional transportation coupon tickets (such as MRT coupon tickets, Taiwan Good Travel routes, and Taiwan Sightseeing Buses), holding special events (such as festivals and lantern celebrations), or providing interior theme painted trains may be adopted as marketing methods to attract HSR riders and enhance tourism. (2) In terms of data analysis, currently, the statistical data of the Tourism Bureau, the operating data of the HSR company, and regional administrative statistical data were collected. In the subsequent analysis process, the collected data may be further filtered to reflect the direct correlation between HSR and the number of tourists; in addition, if weather conditions (such as temperature, proportion of rainy days to sunny days, etc.) can be included, the related results can more accurately capture the overall picture.


