Review

A Review of Southeast Asian Oil Palm and Its CO2 Fluxes

by
Royston Uning
1,
Mohd Talib Latif
1,*,
Murnira Othman
2,
Liew Juneng
1,
Norfazrin Mohd Hanif
1,
Mohd Shahrul Mohd Nadzir
1,
Khairul Nizam Abdul Maulud
3,4,
Wan Shafrina Wan Mohd Jaafar
3,
Nor Fitrah Syazwani Said
3,
Fatimah Ahamad
5 and
Mohd Sobri Takriff
6
1
Department of Earth Sciences and Environment, Faculty of Science and Technology, Universiti Kebangsaan Malaysia, Bangi 43600, Selangor, Malaysia
2
Institute for Environment and Development (LESTARI), Universiti Kebangsaan Malaysia, Bangi 43600, Selangor, Malaysia
3
Earth Observation Centre, Institute of Climate Change, Universiti Kebangsaan Malaysia, Bangi 43600, Selangor, Malaysia
4
Department of Civil Engineering, Faculty of Engineering and Built Environment, Universiti Kebangsaan Malaysia, Bangi 43600, Selangor, Malaysia
5
Centre for Tropical Climate Change System, Institute of Climate Change, Universiti Kebangsaan Malaysia, Bangi 43600, Selangor, Malaysia
6
Department of Chemical and Process Engineering, Faculty of Engineering and Built Environment, Universiti Kebangsaan Malaysia, Bangi 43600, Selangor, Malaysia
*
Author to whom correspondence should be addressed.
Sustainability 2020, 12(12), 5077; https://doi.org/10.3390/su12125077
Submission received: 17 May 2020 / Revised: 11 June 2020 / Accepted: 15 June 2020 / Published: 22 June 2020
(This article belongs to the Section Sustainable Agriculture)

Abstract

:
Palm oil production is a key industry in tropical regions, driven by the demand for affordable vegetable oil. Palm oil production has been increasing by 9% every year, mostly due to expanding biofuel markets. However, the oil palm industry has been associated with key environmental issues, such as deforestation, peatland exploitation and biomass burning that release carbon dioxide (CO2) into the atmosphere, leading to climate change. This review therefore aims to discuss the characteristics of oil palm plantations and their impacts, especially CO2 emissions in the Southeast Asian region. The tropical climate and soil in Southeast Asian countries, such as Malaysia and Indonesia, are very suitable for growing oil palm trees. However, due to the scarcity of available plantation areas deforestation occurs, especially in peat swamp areas. Total carbon losses from both biomass and peat due to the conversion of tropical virgin peat swamp forest into oil palm plantations are estimated to be around 427.2 ± 90.7 t C ha−1 and 17.1 ± 3.6 t C ha−1 year−1, respectively. Even though measured CO2 fluxes have shown that overall, oil palm plantation CO2 emissions are about one to two times higher than other major crops, the ability of oil palms to absorb CO2 (a net of 64 tons of CO2 per hectare each year) and produce around 18 tons of oxygen per hectare per year is one of the main advantages of this crop. Since the oil palm industry plays a crucial role in the socio-economic development of Southeast Asian countries, sustainable and environmentally friendly practices would provide economic benefits while minimizing environmental impacts. A comprehensive review of all existing oil plantation procedures is needed to ensure that this high yielding crop has highly competitive environmental benefits.

1. Introduction

laeis guineensis, or oil palm, is a tree in the palm family (Arecaceae) that is cultivated as the most important source of oilseed today [1,2,3]. Oil palm trees are found only in the tropical forest ecosystem and grow in the range of 10° north and south of the equator. This tree species can grow in areas where the other tree species cannot grow well [4]. With average yields in major producing countries ranging between three and four mesocarps (palm) oil ha−1 year−1, the oil palm is regarded as the most productive oil crop on the market [2]. Global palm oil production is increasing by around 9% per year and the oil is used in various kinds of products. Two of the biggest markets for palm oil are China and India [5,6,7].
Oil palm plantations have been associated with deforestation in many tropical regions [8,9,10] and affect the biodiversity of tropical forests [11]. Oil palm plantations support much fewer species than other tree crops [12,13]. In terms of global palm oil production, Indonesia and Malaysia are the largest producers, with the capacity to produce ≈43 million t year−1, accounting for 87% of all palm oil. From 1990, Indonesia and Malaysia had a total oil palm harvested area of 6.5 million ha. However, between the years 1990 and 2010, more than 10% of the total deforestation in Indonesia and Malaysia was due to oil palm, even when assuming that only half of the oil palm expansion caused forest loss [14].
Other than deforestation, oil palm plantations have also been associated with carbon emissions and climate change [15,16]. Oil palm plantations have been associated with a 2.5 Gigaton Carbon (Gt C) loss in carbon stock in tropical peatlands since 1990 [17], and in many cases oil palm plantations have been linked to the loss of carbon stored within peatland areas [18,19,20,21]. Total carbon losses from biomass and peat of 427.2 ± 90.7 t C ha−1 and 17.1 ± 3.6 t C ha−1 year−1, respectively, due to the conversion of natural tropical peat swamp forest to oil palm plantations, were recorded over the past 25 years. The amount of total carbon loss from peat is around 63% of the total carbon loss, demonstrating that it is essential that mitigation measures are developed to preserve tropical peat swamps from land conversion, which will, in turn, reduce the greenhouse gas load [22].
Since palm oil is important as a cheap source of vegetable oil, this study aims to discuss the characteristics of oil palm plantations and the surrounding environment. The associations of oil palm plantations with carbon dioxide (CO2) fluxes are also presented, particularly those from the Southeast Asian region. A systematic review method based on relevant literature regarding oil palm plantations from various sources was used in this study. Peer-reviewed literature was identified and scrutinized for information, and data relating to oil palm plantations in tropical regions were summarized.

2. Oil Palm Characteristics and Its Environment

2.1. The Oil Palm Crop

The oil palm tree is a single-stemmed plant [7]. The woody stem carries a single terminal growing point, from which leaves appear at regular intervals in a double spiral [23]. According to Johnson [24], general oil palm leaves are branched into leaflets joined to a central leaf axis (the rachis) and often feature a feather. Palms bearing such foliage are often recognized simply as feather palms. An oil palm leaf can reach up to 5 m in length. Each leaf supports a single inflorescence, which can be either male or female [25]. Oil palms bear both functionally male and female flowers on the same tree in an alternating cycle to minimize the chances of self-pollination [26].
An oil palm tree begins to bear fruit 3–4 years after planting. The fruits are in bunches, encompassing the oily pericarp, shell and kernel, which contains 45–55% of edible oil [7,27,28]. The weight of each fruit bunch is approximately 15–30 kg and can reach up to 50 kg [29,30]. The harvested product is a fruit bunch comprising between 1500 and 2000 fruitlets [25]. The products of the fresh fruit bunch include crude palm oil, which is extracted from the orange-yellow mesocarp, while palm kernel oil is usually extracted from the white kernel [25,29].

2.2. Climate

Geographically, the oil palm flourishes best in lowland regions in the tropical rainforest [30,31]. The oil palm is planted in a wide range of latitudes on each continent, roughly 10° north and south of the equator. This distribution is due to how the global oceanic and atmospheric currents affect the climate, as well as the presence and relative position of large landmasses that can greatly alter the temperature and rainfall [32].
In general, the equatorial belt offers suitable cultivation environments for oil palm, because it provides a suitable amount of sunshine, high temperatures, and wet and humid conditions with a high rainfall rate [33,34]. Specifically, there are five important climatic conditions for oil palm cultivation as proposed by Goh [35] (Table 1). Ultimately, to achieve the best yield from oil palms, the oil palms need minimum climatic requirements, such as adequate sunshine and solar radiation of 16–17 MJ m−2 day−1, annual rainfall of 2000–2500 mm, low vapor pressure deficit and temperatures of a mean maximum in the range of 29–33 °C and a mean minimum in the range 22–24 °C.
The oil palm industry plays a crucial role in the socio-economic development of Malaysia [36]. The oil palm yield critically depends on climatic factors [37,38]. Hence, local microclimate changes due to altering land-use, topography, soil properties, etc. and regional changes forced by large-scale global changes are expected to impose significant impacts on the palm oil industry in the coming decades. Therefore, assessing these impacts requires information at both the regional and local scales.
From a large-scale perspective, the El Niño-Southern Oscillation phenomenon (ENSO) is known to influence palm oil production months after its peak. Both warm and cold events negatively impact oil palm production. In the short term (a few months) the warm event, or El Niño, is associated with prolonged dry spells that may lead to bunch failure and floral abortion in oil palm trees [39]. In the longer term of 1–2 years, the production of oil palm is commonly disrupted due to sex differentiation. On the other hand, La Niña, which brings about more rainfall in the country, often disrupts harvesting and logistics management. In addition, La Niña also induces poor pollination and fruit-sets [40].
There is a lack of comprehensive studies on how climate change impacts oil palm production and yield and the underlying socioeconomics. Most studies have focused on a broader scale perspective and discussed the climate suitability instead of focusing on the yield, which is likely determined by the complex interplay between broad climatic factors and local-scale biotic and abiotic interactions. For instance, Paterson et al. [41], using the results from Global Climate Models (GMCs) and a niche model via a stepwise approach, argued that climate change is expected to reduce the area with suitable climates for oil palm plantations over the maritime continent. Studies linking oil palm to ENSO and its implications for short-term forecasts are numerous [42,43]. However, there is a lack of studies discussing the implications of ENSO variability in the future warmer climate and how this is linked to local environmental changes that may affect oil palm cultivation in the future. The hypothesis is that the warmer climate is expected to enlarge the variance of natural climate variability and bring about stronger El Niño and La Niña events [44]. This alteration is expected to impact the regional circulation over Southeast Asian regions, and this impact will be cascaded down to the local scale. The assessment of climate change impacts at a specific plantation thus requires relevant information at both large and plantation scales.

2.3. Soil Classification and Characteristics

The tropical soils used for the cultivation of oil palms have been classified based on the United States Department of Agriculture (USDA) Soil Taxonomy system [45]. There are four types of common soils found: ultisols, oxisols, histosols and mollisols. The types of soil differ between regions in the equatorial tropics. For example, ultisols, oxisols and histosols are generally available in Southeast Asia. In Africa, the soil types oxisols, ultisols and mollisols are commonly found, while in America, oxisols and ultisols are the common soils [25].
Soil characteristics are crucial for oil palm cultivation because they are contributing factors to oil palm production levels [25]. There are two systems available that assess the suitability of soils for growing oil palm. The first system is by Olivin [46,47], who suggested a systematic method for assessing soils for oil palm. The system grades the soils based on soil texture, the quantity of gravel and stones, drainage, and chemical composition, i.e., pH, organic matter and exchangeable cations. In general, Olivin [46,47] defined a good soil as one with little gravel, a texture of soil that allows reasonable drainage, and soil that manages to retain plenty of exchangeable cations and contains a good amount of organic matter.
The second system is that of Paramananthan [48], which provides a detailed set of suitability criteria for the cultivation of oil palm. The system is intended for Southeast Asia, but would probably be relevant in all similar climates [49]. Several important characteristics have been determined by the system, and one is that land with a slope of more than 20° is considered unsuitable, because planting on steep slopes is prone to erosion and can cause problems, e.g., difficulty in harvesting and degradation of the average quality of the soil for the planted oil palm trees [50,51]. In addition, the system selects land that is neither insufficiently or excessively drained, nor prone to flooding. In terms of soil physical criteria, the soil structure needs to be stable and able to provide excellent stable drainage. Additionally, Paramananthan [52] identified and discussed the number of soil types that are generally unsuitable for palms and in which oil palm cannot thrive. They are soils in dry regions, highly weathered soils, soils on steep terrain, lateritic soils, acid sulphate soils, saline soils, sandy soils and organic soils.

3. The Oil Palm and Climate Change Factors

3.1. Deforestation

Forests play important roles in the global ecosystem, where they absorb CO2 by photosynthesis, which is then released by autotrophic respiration [53]. Forest areas are also known to be carbon pools that trap carbon content in the soil and sub-surface for thousands of years. Any changes or modification to forest areas, as well as forest fires, contribute to carbon emissions. As reported by van Der Werf et al. [54], it has been estimated that between 1997 and 2009 there were carbon emissions of 2.0 Pg C year−1 with important contributions from Africa (52%), South America (5%), Equatorial Asia (10%), the boreal region (9%) and Australia (7%). Figure 1 shows the benchmark map of carbon stored in the earth’s tropical forests for over 2.5 million ha of forest area and 75 countries, as reported by NASA [55].
Deforestation is usually defined as the loss of forest cover through the conversion of the land to another land-use [56,57]. Factors that contribute to carbon emissions from deforestation include the high profits that come with international trade, which in turn mean losses of unsustainable production are most noticeable at local levels [58,59,60]. Large amounts of forest areas have been cleared for food crops and also plantations [61]. Global policy changes and the increased demand for biofuels in the transport and energy sectors are also contributing factors [58]. Moreover, deforestation in Southeast Asia is also linked with the logging of tropical timber for economic development [62]. Estimations on deforestation rates were 17–127% for oil palm, 44–129% for timber and 3.1–11.1% for logging in Indonesia [63]. It is been estimated that an area of 3.5 × 10⁶ ha was burned in east Kalimantan between 1982–1983, which then happened again in 1994 [64]. A study by Yong [65] found that there was a 0.54% deforestation rate in Malaysia with an annual average tree cover loss of 2%. Major drivers of deforestation in Malaysia are commercial loggers, commercial oil palm and other tree planters, infrastructure developers and governmental agencies that are reducing areas of forest land [65].
Deforestation can also have economic and health impacts, and impacts on the environment, flora and fauna of an area. As reported by Wolf [62], deforestation can significantly affect soil erosion, flooding and climate change; it can cause agricultural losses, and wildlife and indigenous peoples are also impacted. A study by Chua, Chua and Wang [64] also revealed that the 1997–1998 deforestation and forest fires in Southeast Asia led to the Nipah virus outbreak, and the deforestation was then exacerbated by drought driven by the ENSO event. Another environmental impact was suggested to be the daily temperature in terms of reduced daytime temperatures and increases in boundary layer clouds. This also had the consequence of rising albedo, transpiration and latent heat loss [66]. Deforestation was suggested to influence the regional climate, elevate local temperatures, cause a decline in precipitation and limit soil moisture, thus increasing climate variability and causing drought [67]. The role of a state or country in preserving forests can support environmental sustainability. The Sabah state government, through the Sabah Structure Plan 2033, has committed to preserving the permanent forest reserve based on the priority conservation area. The state of Sabah also retains forest areas as the largest land-use areas in 2033 with 66.71% of the total area of Sabah (Town and Regional Planning Department of Sabah, Kota Kinabalu, Sabah, 2016). The Sabah Structure Plan 2033 is a legal document that focuses on the prioritization of the conservation of forests [68].

3.2. Peatland Areas

Peatland plays a significant role as a carbon pool and is an important component of the carbon soil–atmospheric exchange process [69]. In Southeast Asia only, forested peatland stores at least 42,000 million metric tons (Mt) of soil carbon [70]. According to Yoshino et al. [71], the total area of peat swamps in Southeast Asia was estimated to be 25 million ha, with 43.1% in Papua, Indonesia, 22.5% in Sumatera, 22% in Kalimantan, and other areas in Peninsular Malaysia, Thailand and Malaysian Borneo. When peatland areas are developed for agriculture, the peat soil in these swamp forests tends to decay and release huge stores of carbon into the atmosphere [69,72].
The natural ecosystem of peatland is usually wet, where un-drained peat consists of 10% plant matter and 90% water, making these areas waterlogged where ponding of rainwater on peat surfaces occurs [70,73]. However, due to economic pressures, peatland areas are being deforested, drained and often burned for agricultural purposes, such as oil palm and pulpwood plantations [70]. Drained peatlands, such as in Sumatra and Kalimantan, are susceptible to fires where drought has intensified the flammability of the peat, and fires are widely used to clear the land, degrade re-growing vegetation and maintain the land for growing crops [72]. Fires in peatland areas are not easy to extinguish and often burn for a long period. Moreover, anthropogenic activity with the use of fires by people to clear and convert the land to agricultural areas, particularly for oil palm plantations, contributes to uncontrolled burning, which in turn damages large areas of peatland [74]. It is estimated that the peat swamp forest in Sumatra has declined by about 4% over the last two decades due to timber activities, plantations and fires [67,75].
There are five flux components of peatland, including net CO2 uptake by vegetation, CO2 emissions from disturbed peatland, CO2 emissions and other emissions from fires, exports of dissolved and particulate organic carbon and emissions of methane [70]. A study by Othman and Latif [76] found that 1 hour of peat combustion releases 13.850–20.610 µg m−3 of CO, and concluded that peat soil fires produce various amounts of air pollutants and significantly affect atmospheric chemical reactions.

3.3. Biomass Burning

Biomass burning, particularly of agricultural waste, is a major source of aerosol [77]. Certain areas in the world face severe haze episodes due to biomass burning of wheat straw, peatland soil, agricultural waste and forest areas. Biomass burning has also been performed with the aid of fire for land clearing. As reported by Yokelson et al. [78] and Langmann et al. [79], biomass composition plays a significant role in the combustion process, where during the first phase of burning the biomass fuel undergoes thermal degradation and water and volatiles are released. The second phase is pyrolysis, which includes cracking of the carbon chain fuel molecules. Then, several complex mixtures are released and formed during the distillation and pyrolysis process that forms flaming combustion. Shouldering combustion then occurs when the oxygen supply is limited and exothermic reactions take place, which are gas–solid reactions between oxygen and carbon, which then produce high levels of CO2. Moreover, intense biomass burning episodes, for example in the year 2015, can also be enhanced by dry weather related to the occurrence of strong El Niño conditions [80].
Biomass burning is related to smoke haze and this recurring environmental problem in Southeast Asia affects regional air quality [81,82]. Biomass burning is also a top contributor to particulate pollution in Southeast Asia. Almost every year, fires from biomass burning in Sumatra and Borneo during the dry season, particularly between September to October, contributed to PM10 concentrations above 150 µg m−3 at multiple locations in the southern region of Southeast Asia [81]. Another impact of the burning of garden and agricultural residue, especially in suburban areas, is an additional source of anhydro sugars and other organic compounds to aerosol [83].
Emissions from biomass burning have been estimated, particularly targeting carbon emissions. Among the key parameters in estimating fire emissions and biomass burning are the burned area, the fuel load, the combustion factor and the emission factor [84,85]. Estimated Greenhouse Gases (GHGs) and carbon emissions from fires, particularly including non-forest, Acacia species, forest and peat soil fires in Central Sumatra in the year 2013 were calculated by Gaveau et al. [67], where 172 ± 59 Tg CO2-eq of GHGs were released during the period of 18–24 June. These fire emissions were 26% of the average annual carbon emissions from tropical Asia between 2003 and 2008. A study by Shi et al. [86] on carbon emissions from biomass burning in Southeast Asia for the period 2001–2010 used different types of satellite data. The study found that more than 60,000 km2 year−1 was burned in areas predominantly concentrated in Myanmar, northern Thailand, eastern Cambodia and northern Laos, while the Biosphere Model Integrating Eco-physiological and Mechanistic Approaches using Satellite (BEAMS/MCD45A-Peat) data analysis determined that 210.7 Tg C was released from 2001 to 2010 with the largest contributor being Indonesia. Emission inventories of non-agricultural open fires from 2000 to 2009 in Asia was performed by Song et al. [85], who determined that annual emissions for CO2 and CO were 83 and 6.1 Tg year−1, respectively. They also suggested that burning emissions originated from forest areas because of the large biomass density.

4. Oil Palm and Gas Emissions

GHGs from oil palm areas are expected to influence climate change and air quality. Previous studies have shown that common biogenic GHGs can be both emitted naturally and absorbed by oil palm trees. In terms of GHG absorption, CO2 is always the focus in relation to land-use changes relating to oil palm areas. According to Henson [87], a hectare of oil palm trees can absorb a net amount of 64 tons of CO2 each year and produces around 18 tons of oxygen, which is higher than a forest’s net absorption (42.4 t ha−1 year−1).
Recently, a study by Nadzir et al. [88] revealed that the emissions of isoprene (C5H8), CO2, and surface ozone (O3) from oil palm plantation areas in the state of Pahang, Peninsular Malaysia, were significantly high due to meteorological factors such as temperature. The study observed high mixing ratios of isoprene during the day and low mixing ratios at night, which is consistent with many previous studies [89,90,91,92]. The maximum daytime peak values observed were ~25 ppb, while the lowest values were measured during the night with mixing ratios of ~0.5 ppb for isoprene. Surface O3 was observed to have the same pattern where high mixing ratios were measured during the daytime (~60 ppb). CO2, on the other hand, showed a diurnal pattern with high mixing ratios during the night compared to the daytime.
In addition to climate change issues, air quality problems can also be linked to oil palm land-use changes. Biogenic GHGs, also known as BVOCs (Biogenic Volatile Organic Compounds), such as isoprene (C5H8), can be released from oil palm trees. BVOCs contribute to about 90% of all VOCs in the atmosphere [93]. Isoprene and other BVOCs are linked to the production of surface O3 in the presence of nitrogen oxide (NOx) [94], which contributes to climate change and poor air quality. Surface O3 is a widespread air quality problem if present in high concentrations with present-day levels of NOx as well as biogenic and anthropogenic VOC emissions [95,96]. NOx can be emitted from industrial and city areas near oil palm plantations depending on the prevailing wind. According to Nadzir et al. [97], the three major NOx sources responsible for increased NOx over oil palm plantation areas are all linked to agro-industrial activities, such as vehicle exhaust, palm oil plant combustion, and substantial soil nitrogen fertilization for plantations.

4.1. Emissions of CO2

Oil palm plantations and related activities have been associated with climate change, where CO2 is the main key driver. The main pathways where oil palm-related CO2 is released into the atmosphere are through deforestation, peatland exploitation and biomass burning, as well as the oil palm plantations themselves [98]. This section, however, will only focus on CO2 emissions from oil palm plantations on peat soil and related aspects as there is growing concern regarding the magnitude of CO2 losses from one of the earth’s natural carbon storage areas [99,100]. Better constraints on oil palm CO2 have been addressed through common field CO2 emission measurements on plantation soil (peat), while there is limited information on emissions from the drain, trunk, and leaf of the oil palm tree. Indonesia and Malaysia have been the main target areas of CO2 emissions measurements, as they aim to dedicate millions of metric tons of palm oil to meet global demand in producing biofuels [101].
Oil palm plantations on peat soil in Indonesia have been estimated to have CO2 emissions ranging between 12 and 95 t C ha−1 year−1 (Table 2). While most of the measurements were located in Sumatra, Indonesia, the highest CO2 emission was recorded in Jambi and Riau (95 t C ha−1 year−1) [102]. The lowest CO2 emissions, however, were also recorded in Jambi (10 t C ha−1 year−1) [103], which could imply high spatial variability of emissions from peat soil. In Malaysia, CO2 emissions were estimated between 7 and 79 t C ha−1 year−1 (Table 2). The highest Malaysian peat soil CO2 emissions were recorded in Selangor at 79 and 65 t C ha−1 year−1 in the years 2000 and 2006, respectively [104]. The lowest CO2 emission was recorded in Sarawak (7 t C ha−1 year−1), which also has the largest area of oil palm plantation on peat soil in Malaysia [105]. Comparisons between Indonesia and Malaysia’s CO2 emissions show that both countries, as main palm oil producers globally, have a comparable magnitude of emissions, which could be due to similar peat soils as well as oil palm tree characteristics.
Extensive measurements on oil palm CO2 emissions, such as from the root, trunk, drain and also above the canopy are essential to better understand the role of oil palm on global scale carbon emissions (Table 3). Oil palm root CO2 emissions were estimated at 19 t C ha−1 year−1 in Aceh Barat, Indonesia [111], while a separate study in Sarawak, Malaysia showed the average trunk, drain and soil CO2 emission was 24 t C ha−1 year−1 [112]. Comparisons between the two studies on CO2 emissions suggest the oil palm tree root could release a huge portion of the high CO2 emissions. On the contrary, a large area of oil palm plantation in Sabah, Malaysia recorded an average CO2 uptake of 82 t C ha−1 year−1 above the oil palm canopy, higher than an intact forest (32 t C ha−1 year−1) [113]. The high rates of carbon uptake of oil palm mean it is theoretically possible to achieve carbon neutrality for biofuels, in the long term replacing fossil fuels [114,115]. Based on the above argument, the overall emission and absorption of oil palm plantations with factors that influence these exchanges in tropical regions are presented in Figure 2.

4.2. Comparison Studies on Oil Palm CO2 with Other Crops

In this section, the focus on CO2 flux has not been expanded upon in detail for other crops besides oil palm. The challenge in comparing emissions between different crops lies in the fact that not only do the soil types, rainfall and temperatures vary, but agricultural practices such as tillage, liming of soil and addition of nitrogen fertilizer can also influence CO2 emissions [116,117,118,119,120,121]. In some cases, plantations such as rubber plantations have been shown to have a lower CO2 flux compared to a natural forest [122]. Any useful comparison of emissions between different crops will require careful consideration of both the natural properties of the soil and agricultural practices in specific regions.
Table 4 shows some of the CO2 emissions from different crops as well as intact forest. The CO2 fluxes in these studies show that, overall, oil palm plantation CO2 emissions are about one to two magnitudes higher compared to other crops, such as barley, corn and rubber. Corn appears to have the lowest emissions at 0.4 t C ha−1 year−1. Based on these values alone, it would seem that CO2 flux is highest in oil palm plantations. However, as mentioned in the earlier paragraph, various factors can affect the flux in the soil, as even oil palm flux has a range between 7 and 95 t C ha−1 year−1, as shown in emissions studies in Malaysia and Indonesia (Table 2). The intact forest CO2 flux recorded by Zhao et al. [122] is higher than that of oil palm recorded in a study by Matysek et al. [104]. Additionally, crop yields per hectare should be an important consideration, as total flux may be offset for crops with high yields, such oil palm, which has a potential yield that generally exceeds 8 t oil ha−1 year−1 [25].

5. Conclusions

Overwhelming global demand for affordable vegetable oil has driven the fast expansion of oil palm plantations, especially in the Southeast Asian region. This expansion has led to many disastrous environmental issues, such as the destruction of natural carbon storage. The utilization of peatland and deforestation for oil palm plantations has been identified as the main challenge to controlling natural carbon emissions to the atmosphere. Previous estimation studies show that oil palm carbon and CO2 emissions are a magnitude higher compared to other crops (e.g., barley, corn, rubber). Natural climate variability, such as El Niño and La Niña events, is expected to influence oil palm plantations at both large and small scales, and the change in this variability under warmer climates is expected to influence the palm oil yield. The ability of oil palms to absorb CO2 (a net of 64 tons of CO2 per hectare each year) and produce around 18 tons of oxygen is an advantage of this type of plantation.
To further reduce oil palm-related natural carbon emissions, a number of key processes can be implemented. For instance, curbing biomass burning, reducing the exploitation of peatland or swamp areas for plantation and replacing fossil fuels with biofuels to power plantation and production activities can achieve sustainable oil palm. The sustainability of plantation expansions can be achieved through a comprehensive review of all existing plantations to ensure that they align with existing sustainability criteria.

Author Contributions

Conceptualization, R.U. and M.T.L.; formal analysis, R.U.; investigation, R.U. and M.T.L.; writing—original draft preparation, R.U., M.T.L., M.O., L.J., N.M.H., M.S.M.N., K.N.A.M., W.S.W.M.J., N.F.S.S., F.A. and M.S.T.; writing—review and editing, R.U., M.T.L., M.O., L.J., N.M.H., M.S.M.N., K.N.A.M., W.S.W.M.J., N.F.S.S., F.A. and M.S.T.; supervision, M.T.L. and M.S.T.; project administration, M.T.L. and M.S.T.; funding acquisition, M.T.L. and M.S.T. All authors have read and agreed to the published version of the manuscript.

Funding

This research was funded by the Malaysian Ministry of Higher Education, grant number KK-2019-014.

Acknowledgments

We would like to thank the Malaysian Ministry of Higher Education for funding this study through the KK-2019-014 research grant. We would also like to thank Dr. Rose Norman for proofreading this manuscript.

Conflicts of Interest

The authors declare no conflict of interest.

References

  1. Singh, R.; Ong-Abdullah, M.; Low, E.T.L.; Manaf, M.A.A.; Rosli, R.; Nookiah, R.; Ooi, L.C.L.; Ooi, S.E.; Chan, K.L.; Halim, M.A.; et al. Oil palm genome sequence reveals divergence of interfertile species in Old and New worlds. Nature 2013, 500, 335–339. [Google Scholar] [CrossRef] [PubMed] [Green Version]
  2. Wahid, M.B.; Abdullah, S.N.A.; Henson, I.E. Oil palm—Achievements and potential. Plant Prod. Sci. 2005, 8, 288–297. [Google Scholar] [CrossRef]
  3. Ibragimov, A.; Sidique, S.F.; Tey, Y.S. Productivity for sustainable growth in Malaysian oil palm production: A system dynamics modeling approach. J. Clean. Prod. 2019, 213, 1051–1062. [Google Scholar] [CrossRef]
  4. Pasiecznik, N. Elaeis guineensis (African oil palm); CAB International: Wallingford, UK, 2013. [Google Scholar]
  5. Wilcove, D.S.; Koh, L.P. Addressing the threats to biodiversity from oil-palm agriculture. Biodivers. Conserv. 2010, 19, 999–1007. [Google Scholar] [CrossRef]
  6. Fitzherbert, E.B.; Struebig, M.J.; Morel, A.; Danielsen, F.; Brühl, C.A.; Donald, P.F.; Phalan, B. How will oil palm expansion affect biodiversity? Trends Ecol. Evol. 2008, 23, 538–545. [Google Scholar] [CrossRef]
  7. Edem, D. Palm oil: Biochemical, physiological, nutritional, hematological and toxicological aspects: A review. Plant Foods Hum. Nutr. 2002, 57, 319–341. [Google Scholar] [CrossRef]
  8. Toulec, T.; Lhota, S.; Soumarová, H.; Putera, A.K.S.; Kustiawan, W. Shrimp farms, fire or palm oil? Changing causes of proboscis monkey habitat loss. Glob. Ecol. Conserv. 2020, 21, e00863. [Google Scholar] [CrossRef]
  9. Margono, B.A.; Potapov, P.V.; Turubanova, S.; Stolle, F.; Hansen, M.C. Primary forest cover loss in Indonesia over 2000–2012. Nat. Clim. Chang. 2014, 4, 730–735. [Google Scholar] [CrossRef]
  10. Gaveau, D.L.A.; Sloan, S.; Molidena, E.; Yaen, H.; Sheil, D.; Abram, N.K.; Ancrenaz, M.; Nasi, R.; Quinones, M.; Wielaard, N.; et al. Four Decades of Forest Persistence, Clearance and Logging on Borneo. PLoS ONE 2014, 9, e101654. [Google Scholar] [CrossRef] [Green Version]
  11. Padfield, R.; Hansen, S.; Davies, Z.G.; Ehrensperger, A.; Slade, E.M.; Evers, S.; Papargyropoulou, E.; Bessou, C.; Abdullah, N.; Page, S.; et al. Co-producing a Research Agenda for Sustainable Palm Oil. Front. For. Glob. Chang. 2019, 2, 13. [Google Scholar] [CrossRef] [Green Version]
  12. Luskin, M.S.; Potts, M.D. Microclimate and habitat heterogeneity through the oil palm lifecycle. Basic Appl. Ecol. 2011, 12, 540–551. [Google Scholar] [CrossRef]
  13. Fayle, T.M.; Turner, E.C.; Snaddon, J.L.; Chey, V.K.; Chung, A.Y.C.; Eggleton, P.; Foster, W.A. Oil palm expansion into rain forest greatly reduces ant biodiversity in canopy, epiphytes and leaf-litter. Basic Appl. Ecol. 2010, 11, 337–345. [Google Scholar] [CrossRef]
  14. Koh, L.P.; Miettinen, J.; Liew, S.C.; Ghazoul, J. Remotely sensed evidence of tropical peatland conversion to oil palm. Proc. Natl. Acad. Sci. USA 2011, 108, 5127–5132. [Google Scholar] [CrossRef] [PubMed] [Green Version]
  15. Carlson, K.M.; Curran, L.M.; Ratnasari, D.; Pittman, A.M.; Soares-Filho, B.S.; Asner, G.P.; Trigg, S.N.; Gaveau, D.A.; Lawrence, D.; Rodrigues, H.O. Committed carbon emissions, deforestation, and community land conversion from oil palm plantation expansion in West Kalimantan, Indonesia. Proc. Natl. Acad. Sci. USA 2012, 109, 7559–7564. [Google Scholar] [CrossRef] [PubMed] [Green Version]
  16. Lee, J.S.H.; Abood, S.; Ghazoul, J.; Barus, B.; Obidzinski, K.; Koh, L.P. Environmental impacts of large-scale oil palm enterprises exceed that of smallholdings in Indonesia. Conserv. Lett. 2014, 7, 25–33. [Google Scholar] [CrossRef]
  17. Miettinen, J.; Hooijer, A.; Vernimmen, R.; Liew, S.C.; Page, S.E. From carbon sink to carbon source: Extensive peat oxidation in insular Southeast Asia since 1990. Environ. Res. Lett. 2017, 12, 024014. [Google Scholar] [CrossRef]
  18. Jaenicke, J.; Rieley, J.O.; Mott, C.; Kimman, P.; Siegert, F. Determination of the amount of carbon stored in Indonesian peatlands. Geoderma 2008, 147, 151–158. [Google Scholar] [CrossRef]
  19. Yule, C.M. Loss of biodiversity and ecosystem functioning in Indo-Malayan peat swamp forests. Biodivers. Conserv. 2010, 19, 393–409. [Google Scholar] [CrossRef]
  20. Murdiyarso, D.; Lilleskov, E.; Kolka, R. Tropical peatlands under siege: The need for evidence-based policies and strategies. Mitig. Adapt. Strateg. Glob. Chang. 2019, 24, 493–505. [Google Scholar] [CrossRef] [Green Version]
  21. Austin, K.G.; Kasibhatla, P.S.; Urban, D.L.; Stolle, F.; Vincent, J. Reconciling oil palm expansion and climate change mitigation in Kalimantan, Indonesia. PLoS ONE 2015, 10, e0127963. [Google Scholar] [CrossRef]
  22. Hergoualc’H, K.; Verchot, L.V. Stocks and fluxes of carbon associated with land use change in Southeast Asian tropical peatlands: A review. Glob. Biogeochem. Cycles 2011, 25, 789–807. [Google Scholar] [CrossRef] [Green Version]
  23. Rees, A. The apical organization and phyllotaxis of the oil palm. Ann. Bot. 1964, 28, 57–69. [Google Scholar] [CrossRef]
  24. Johnson, D. Tropical palms. non-wood forest products 10/Rev. 1. In Rome: Food and Agriculture; Organization of the United Nations (FAO): Rome, Italy, 2011. [Google Scholar]
  25. Woittiez, L.S.; van Wijk, M.T.; Slingerland, M.; van Noordwijk, M.; Giller, K.E. Yield gaps in oil palm: A quantitative review of contributing factors. Eur. J. Agron. 2017, 83, 57–77. [Google Scholar] [CrossRef]
  26. Adam, H.; Collin, M.; Richaud, F.; Beulé, T.; Cros, D.; Omoré, A.; Nodichao, L.; Nouy, B.; Tregear, J.W. Environmental regulation of sex determination in oil palm: Current knowledge and insights from other species. Ann. Bot. 2011, 108, 1529–1537. [Google Scholar] [CrossRef] [PubMed] [Green Version]
  27. Sumathi, S.; Chai, S.; Mohamed, A. Utilization of oil palm as a source of renewable energy in Malaysia. Renew. Sustain. Energy Rev. 2008, 12, 2404–2421. [Google Scholar] [CrossRef]
  28. Langeveld, H.; Dixon, J.; van Keulen, H. Oil palm biodiesel in the Far East. In Biofuel Cropping Systems; Routledge: London, UK, 2014; pp. 178–193. [Google Scholar]
  29. Zwart, R. Opportunities and challenges in the development of a viable Malaysian palm oil biomass industry. J. Oil Palm Environ. Health (JOPEH) 2013, 4, 41–46. [Google Scholar]
  30. Henson, I.E. A Brief History of the Oil Palm. In Palm Oil; Lai, O.-M., Tan, C.-P., Akoh, C.C., Eds.; AOCS Press: Champaign, IL, USA, 2012; pp. 1–29. [Google Scholar]
  31. Duke, J. Elaeis guineensis Jacq; Purdue University: West Lafayette, IN, USA, 1983. [Google Scholar]
  32. Ollagnier, M.; Ochs, R.; Martin, G. The manuring of the oil palm in the world. Manuring Oil Palm World. 1970, 36, 3–63. [Google Scholar]
  33. Chuah, T.; Wan Azlina, A.; Robiah, Y.; Omar, R. Biomass as the renewable energy sources in Malaysia: An overview. Int. J. Green Energy 2006, 3, 323–346. [Google Scholar] [CrossRef]
  34. Yusoff, S. Renewable energy from palm oil–innovation on effective utilization of waste. J. Clean. Prod. 2006, 14, 87–93. [Google Scholar] [CrossRef]
  35. Goh, K. Climatic requirements of the oil palm for high yields. In Managing Oil Palm for High Yields: Agronomic Principles; Goh, K.J., Ed.; Malaysian Society of Soil Science/Param Agric: Surveys, Malaysia, 2000; pp. 1–17. [Google Scholar]
  36. Liew, W.L.; Kassim, M.A.; Muda, K.; Loh, S.K.; Affam, A.C. Conventional methods and emerging wastewater polishing technologies for palm oil mill effluent treatment: A review. J. Environ. Manag. 2015, 149, 222–235. [Google Scholar] [CrossRef] [Green Version]
  37. Ong, H.T. System approach to the climatology of oil palm. I. Identification of rainfall and dry spell aspects. Oleagineux 1982, 37, 93–101. [Google Scholar]
  38. Corley, R.H.V. Oil palm yield components and yield cycles. Malays. Int. Agric. Oil Palm Conf. Paper 2012, 9, 116–129. [Google Scholar]
  39. Oettli, P.; Behera, S.K.; Yamagata, T. Climate Based Predictability of Oil Palm Tree Yield in Malaysia. Sci. Rep. 2018, 8, 2271. [Google Scholar] [CrossRef] [PubMed] [Green Version]
  40. Kamil, N.N.; Omar, S.F. The Impact of El Nino and La Nina on Malaysian Oil Palm Industry. Oil Palm Bulettin 2017, 74, 1–6. [Google Scholar]
  41. Paterson, R.R.M.; Kumar, L.; Taylor, S.; Lima, N. Future climate effects on suitability for growth of oil palms in Malaysia and Indonesia. Sci. Rep. 2015, 5, 14457. [Google Scholar] [CrossRef] [Green Version]
  42. Shanmuganathan, S.; Narayanan, A.; Mohamed, M.; Ibrahim, R.; Khalid, H. A Hybrid Approach to Modelling the Climate Change Effects on Malaysia’s Oil Palm Yield at the Regional Scale. In Recent Advances on Soft Computing and Data Mining. Advances in Intelligent Systems and Computing; Springer: Cham, Switzerland, 2014. [Google Scholar]
  43. Keong, Y.K.; Keng, W.M. Statistical Modeling of Weather-based Yield Forecasting for Young Mature Oil Palm. APCBEE Procedia 2012, 4, 58–65. [Google Scholar] [CrossRef] [Green Version]
  44. Stevenson, S.L. Significant changes to ENSO strength and impacts in the twenty-first century: Results from CMIP5. Geophys. Res. Lett. 2012, 39, L17703. [Google Scholar] [CrossRef] [Green Version]
  45. Soil Survey Staff. Soil Taxonomy: A Basic System of Soil Classification for Making and Interpreting Soil Surveys; US Government Printing Office: Washington, DC, USA, 1975. [Google Scholar]
  46. Olivin, J. Étude pour la localisation d’un bloc industriel de palmiers à huile. Oléagineux 1968, 23, 499–504. [Google Scholar]
  47. Olivin, J. Study for the siting of a commercial oil palm plantation. Oleagineux (France) 1986, 41, 175–182. [Google Scholar]
  48. Paramananthan, S. Soil requirements of oil palm for high yields. In Managing Oil Palm for High Yields: Agronomic Principles; Malaysian Society of Soil Science and Param Agricultural: Kuala Lumpur, Malaysia, 2000; pp. 18–38. [Google Scholar]
  49. Corley, R.H.V.; Tinker, P.B.H. The Oil Palm; Wiley: Hoboken, NJ, USA, 2008. [Google Scholar]
  50. Gobin, A.; Campling, P.; Deckers, J.A.; Poesen, J.; Feyen, J. Soil erosion assessment at the Udi-Nsukka Cuesta (southeastern Nigeria). Land Degrad. Dev. 1999, 10, 141–160. [Google Scholar] [CrossRef]
  51. Hamdan, J.; Burnham, C.; Ruhana, B. Degradation effect of slope terracing on soil quality for Elaeis guineensis Jacq.(oil palm) cultivation. Land Degrad. Dev. 2000, 11, 181–193. [Google Scholar] [CrossRef]
  52. Paramananthan, S. Managing marginal soils for sustainable growth of oil palms in the tropics. J. Oil Palm Environ. Health (JOPEH) 2013, 4, 1–16. [Google Scholar] [CrossRef]
  53. Schrier-Uijl, A.P.; Silvius, M.; Parish, F.; Lim, K.H.; Rosediana, S.; Anshari, G. Environmental and Social Impacts of Oil Palm Cultivation on Tropical Peat—A Scientific Review; RSPO (Roundtable on Sustainable Palm Oil): Kuala Lumpur, Malaysia, 2013. [Google Scholar]
  54. van Der Werf, G.R.; Randerson, J.T.; Giglio, L.; Collatz, G.J.; Mu, M.; Kasibhatla, P.S.; Morton, D.C.; Defries, R.S.; Jin, Y.; van Leeuwen, T.T. Global fire emissions and the contribution of deforestation, savanna, forest, agricultural, and peat fires (1997–2009). Atmos. Chem. Phys. 2010, 10, 11707–11735. [Google Scholar] [CrossRef] [Green Version]
  55. NASA. Carbon Stored in Earth’s Tropical Forest. Available online: https://www.nasa.gov/topics/earth/features/earth20110531-i.html (accessed on 25 December 2019).
  56. Jaafar, W.S.W.M.; Maulud, K.N.A.; Kamarulzaman, A.M.M.; Raihan, A.; Sah, S.M.; Ahmad, A.; Saad, S.N.M.; Azmi, A.T.M.; Syukri, N.K.A.J.; Khan, W.R. The Influence of Deforestation on Land Surface Temperature—A Case Study of Perak and Kedah, Malaysia. Forests 2020, 11, 670. [Google Scholar] [CrossRef]
  57. Kamlun, K.U.; Goh, M.H.; Teo, S.; Tsuyuki, S.; Phua, M.-H. Monitoring of deforestation and fragmentation in Sarawak, Malaysia between 1990 and 2009 using landsat and SPOT images. J. For. Sci. 2012, 28, 152–157. [Google Scholar] [CrossRef] [Green Version]
  58. Hooijer, A.; Silvius, M.; Wosten, H.; Page, S. PEAT-CO2, Assessment of CO2 Emissions from Drained Peatlands in SE Asia; Delft Hydraulics Report: Delft, The Netherlands, 2006. [Google Scholar]
  59. van Beukering, P.; Schaafsma, M.; Davis, O.; Oskolokaite, I. The Economic alue of Petland Resources within the Central Kalimantan Peatland Project in Indonesia: Perceptions of Local Communities; Institute for Environmental Studies: Amsterdam, The Netehrlands, 2008. [Google Scholar]
  60. Wetland International. Assessment on Peatlands, Biodiversity and Climate Change; Wetland International: Kuala Lumpur, Malaysia, 2007. [Google Scholar]
  61. Tyson, A.; Varkkey, H.; Choiruzzad, S.A.B. Deconstructing the Palm Oil Industry Narrative in Indonesia: Evidence from Riau Province. Contemp. Southeast Asia 2018, 40, 422–448. [Google Scholar] [CrossRef]
  62. Wolf, H.A. Deforestation in Cambodia and Malaysia: The case for an international legal solution. Pac. Rim Law Policy J. 1996, 5, 431–432. [Google Scholar]
  63. Busch, J.; Ferretti-Gallon, K.; Engelmann, J.; Wright, M.; Austin, K.G.; Stolle, F.; Turubanova, S.; Potapov, P.V.; Margono, B.; Hansen, M.C.; et al. Reductions in emissions from deforestation from Indonesia’s moratorium on new oil palm, timber, and logging concessions. Proc. Natl. Acad. Sci. USA 2015, 112, 1328–1333. [Google Scholar] [CrossRef] [Green Version]
  64. Chua, K.B.; Chua, B.H.; Wang, C.W. Anthropogenic deforestration, El Nino and the emergence of Nipah virus in Malaysia. Malays. J. Pathol. 2002, 24, 15–21. [Google Scholar]
  65. Yong, C. Deforestration Drivers and Human Rights in Malaysia: A National Overview and Two Sub-Regional Case Studies; Forest Peoples Programme: Moreton-in-Marsh, UK, 2014. [Google Scholar]
  66. IPCC. Climate Change and Water; Intergovernmental Panel on Climate Change: Geneva, Switzerland, 2009. [Google Scholar]
  67. Gaveau, D.L.A.; Salim, M.A.; Hergoualc’h, K.; Locatelli, B.; Sloan, S.; Wooster, M.; Marlier, M.E.; Molidena, E.; Yaen, H.; DeFries, R.; et al. Major atmospheric emissions from peat fires in Southeast Asia during non-drought years: Evidence from the 2013 Sumatran fires. Sci. Rep. 2014, 4, 1–7. [Google Scholar] [CrossRef] [Green Version]
  68. Sloan, S.; Campbell, M.J.; Alamgir, M.; Lechner, A.M.; Engert, J.; Laurance, W.F. Trans-national conservation and infrastructure development in the Heart of Borneo. PLoS ONE 2019, 14, e0221947. [Google Scholar] [CrossRef]
  69. Page, S.E.; Rieley, J.O.; Banks, C.J. Global and regional importance of the tropical peatland carbon pool. Glob. Chang. Biol. 2011, 17, 798–818. [Google Scholar] [CrossRef] [Green Version]
  70. Hooijer, A.; Page, S.; Canadell, J.G.; Silvius, M.; Kwadijk, J.; Wösten, H.; Jauhiainen, J. Current and future CO2 emissions from drained peatlands in Southeast Asia. Biogeosciences 2010, 7, 1505–1514. [Google Scholar] [CrossRef] [Green Version]
  71. Yoshino, K.; Ishida, T.; Nagano, T.; Setiawan, Y. Landcover pattern analysis of tropical peat swamp lands in Southeast Asia. Int. Arch. Photogramm. Remote Sens. Spat. Inf. Sci. 2010, 38, 941–946. [Google Scholar]
  72. Huijnen, V.; Wooster, M.J.; Kaiser, J.W.; Gaveau, D.L.A.; Flemming, J.; Parrington, M.; Inness, A.; Murdiyarso, D.; Main, B.; Van Weele, M. Fire carbon emissions over maritime southeast Asia in 2015 largest since 1997. Sci. Rep. 2016, 6, 1–8. [Google Scholar] [CrossRef] [Green Version]
  73. Kløve, B.; Sveistrup, T.E.; Hauge, A. Leaching of nutrients and emission of greenhouse gases from peatland cultivation at Bodin, Northern Norway. Geoderma 2010, 154, 219–232. [Google Scholar] [CrossRef]
  74. Kusumaningtyas, S.D.A.; Aldrian, E. Impact of the June 2013 Riau province Sumatera smoke haze event on regional air pollution. Environ. Res. Lett. 2016, 11, 075007. [Google Scholar] [CrossRef]
  75. Miettinen, J.; Shi, C.; Liew, S.C. Two decades of destruction in Southeast Asia’s peat swamp forests. Front. Ecol. Environ. 2011, 10, 124–128. [Google Scholar] [CrossRef]
  76. Othman, M.; Latif, M.T. Dust and gas emissions from small-scale peat combustion. Aerosol Air Qual. Res. 2013, 13, 1045–1105. [Google Scholar] [CrossRef]
  77. Ram, K.; Sarin, M.M.; Sudheer, A.K.; Rengarajan, R. Carbonaceous and secondary inorganic aerosols during wintertime fog and haze over urban sites in the Indo-Gangetic plain. Aerosol Air Qual. Res. 2012, 12, 359–370. [Google Scholar] [CrossRef]
  78. Yokelson, R.J.; Griffith, D.W.T.; Ward, D.E. Open-path fourier transform infrared studies of large-scale laboratory biomass fires. J. Geophys. Res. 1996, 101, 21067–21080. [Google Scholar] [CrossRef] [Green Version]
  79. Langmann, B.; Duncan, B.; Textor, C.; Trentmann, J.; Vanderwerf, G. Vegetation fire emissions and their impact on air pollution and climate. Atmos. Environ. 2009, 43, 107–116. [Google Scholar] [CrossRef]
  80. Mead, M.I.; Castruccio, S.; Nadzir, M.S.M.; Dominick, D.; Thota, A.; Crippa, P. Impact of the 2015 wildfires on Malaysian air quality and exposure: A comparative study of observed and modeled data. Environ. Res. Lett. 2018, 13, 1–9. [Google Scholar] [CrossRef]
  81. Hyer, E.J.; Chew, B.N. Aerosol transport model evaluation of an extreme smoke episode in Southeast Asia. Atmos. Environ. 2010, 44, 1422–1427. [Google Scholar] [CrossRef]
  82. Varkkey, H.; Poh Onn, L. The Haze Problem in Southeast Asia: Palm Oil and Patronage. J. Southeast Asian Econ. 2017, 34, 573–575. [Google Scholar] [CrossRef]
  83. Pegas, P.N.; Nunes, T.; Alves, C.A.; Silva, J.R.; Vieira, S.L.A.; Caseiro, A.; Pio, C.A. Indoor and outdoor characterisation of organic and inorganic compounds in city centre and suburban elementary schools of Aveiro, Portugal. Atmos. Environ. 2012, 55, 80–89. [Google Scholar] [CrossRef]
  84. Seiler, W.; Crutzen, J.P. Estimates of the gross and net fluxes of carbon between the biospere and the atmosphere from biomass burning. Clim. Change 1980, 2, 207–247. [Google Scholar] [CrossRef]
  85. Song, Y.; Chang, D.; Liu, B.; Miao, W.; Zhu, L.; Zhang, Y. A new emission inventory for nonagricultural open fires in Asia from 2000 to 2009. Environ. Res. Lett. 2010, 5, 1–6. [Google Scholar] [CrossRef]
  86. Shi, Y.; Sasai, T.; Yamaguchi, Y. Spatio-temporal evaluation of carbon emissions from biomass burning in Southeast Asia during the period 2001–2010. Ecol. Model. 2014, 272, 98–115. [Google Scholar] [CrossRef]
  87. Henson, I.E. Notes on oil palm productivity. IV. Carbon dioxide gradients and fluxes and evapotranspiration, above and below the canopy. J. Oil Palm Res. 1999, 11, 33–40. [Google Scholar]
  88. Nadzir, M.S.M.; Ooi, C.G.; Harris, N.R.P.; Ashworth, K.; Bolas, C.; Bran, S.H.; Macatangay, R.; Jaafar, W.S.W.M.; Yusup, Y.; Latif, M.T.; et al. Driving factors for isoprene-surface ozone chemistry over an oil palm plantation in Malaysia. Environ. Int. 2020, submitted. [Google Scholar]
  89. Holzinger, R.; Sanhueza, E.; von Kuhlmann, R.; Kleiss, B.; Donoso, L.; Crutzen, P.J. Diurnal cycles and seasonal variation of isoprene and its oxidation products in the tropical savanna atmosphere. Glob. Biogeochem. Cycles 2002, 16, 1074. [Google Scholar] [CrossRef]
  90. Biesenthal, T.A.; Bottenheim, J.W.; Shepson, P.B.; Brickell, P.C. The chemistry of biogenic hydrocarbons at a rural site in eastern Canada. J. Geophys. Res. Atmos. 1998, 103, 25487–25498. [Google Scholar] [CrossRef]
  91. Goldan, P.D.; Kuster, W.C.; Fehsenfeld, F.C.; Montzka, S.A. Hydrocarbon measurements in the southeastern United States: The Rural Oxidants in the Southern Environment (ROSE) Program 1990. J. Geophys. Res. Atmos. 1995, 100, 25945–25963. [Google Scholar] [CrossRef]
  92. Montzka, S.A.; Trainer, M.; Goldan, P.D.; Kuster, W.C.; Fehsenfeld, F.C. Isoprene and its oxidation products, methyl vinyl ketone and methacrolein, in the rural troposphere. J. Geophys. Res. Atmos. 1993, 98, 1101–1111. [Google Scholar] [CrossRef] [Green Version]
  93. Guenther, A.; Karl, T.; Harley, P.; Wiedinmyer, C.; Palmer, P.I.; Geron, C. Estimates of global terrestrial isoprene emissions using MEGAN (Model of Emissions of Gases and Aerosols from Nature). Atmos. Chem. Phys. 2006, 6, 3181–3210. [Google Scholar] [CrossRef] [Green Version]
  94. Wennberg, P.O.; Bates, K.H.; Crounse, J.D.; Dodson, L.G.; McVay, R.C.; Mertens, L.A.; Nguyen, T.B.; Praske, E.; Schwantes, R.H.; Smarte, M.D.; et al. Gas-Phase Reactions of Isoprene and Its Major Oxidation Products. Chem. Rev. 2018, 118, 3337–3390. [Google Scholar] [CrossRef] [Green Version]
  95. Ahamad, F.; Latif, M.T.; Tang, R.; Juneng, L.; Dominick, D.; Juahir, H. Variation of surface ozone exceedance around Klang Valley, Malaysia. Atmos. Res. 2014, 139, 116–127. [Google Scholar] [CrossRef]
  96. Latif, M.T.; Huey, L.S.; Juneng, L. Variations of surface ozone concentration across the Klang Valley, Malaysia. Atmos. Environ. 2012, 61, 434–445. [Google Scholar] [CrossRef]
  97. Nadzir, M.S.M.; Ashfold, M.J.; Khan, M.F.; Robinson, A.D.; Bolas, C.; Latif, M.T.; Wallis, B.M.; Mead, M.I.; Hamid, H.H.A.; Harris, N.R.P.; et al. Spatial-temporal variations in surface ozone over Ushuaia and the Antarctic region: Observations from in situ measurements, satellite data, and global models. Environ. Sci. Pollut. Res. Int. 2018, 25, 2194–2210. [Google Scholar] [CrossRef] [Green Version]
  98. Khatun, R.; Reza, M.I.H.; Moniruzzaman, M.; Yaakob, Z. Sustainable oil palm industry: The possibilities. Renew. Sustain. Energy Rev. 2017, 76, 608–619. [Google Scholar] [CrossRef]
  99. Wijedasa, L.S.; Jauhiainen, J.; Könönen, M.; Lampela, M.; Vasander, H.; Leblanc, M.-C.; Evers, S.; Smith, T.E.L.; Yule, C.M.; Varkkey, H.; et al. Denial of long-term issues with agriculture on tropical peatlands will have devastating consequences. Glob. Chang. Biol. 2017, 23, 977–982. [Google Scholar] [CrossRef] [Green Version]
  100. Evers, S.; Yule, C.M.; Padfield, R.; O’Reilly, P.; Varkkey, H. Keep wetlands wet: The myth of sustainable development of tropical peatlands – implications for policies and management. Glob. Chang. Biol. 2017, 23, 534–549. [Google Scholar] [CrossRef]
  101. Carter, C.; Finley, W.; Fry, J.; Jackson, D.; Willis, L. Palm oil markets and future supply. Eur. J. Lipid Sci. Technol. 2007, 109, 307–314. [Google Scholar] [CrossRef]
  102. Hooijer, A.; Page, S.; Jauhiainen, J.; Lee, W.A.; Lu, X.X.; Idris, A.; Anshari, G. Subsidence and carbon loss in drained tropical peatlands. Biogeosciences 2012, 9, 1053–1071. [Google Scholar] [CrossRef] [Green Version]
  103. Dariah, A.; Marwanto, S.; Agus, F. Root- and peat-based CO2 emissions from oil palm plantations. Mitig. Adapt. Strateg. Glob. Chang. 2014, 19, 831–843. [Google Scholar] [CrossRef]
  104. Matysek, M.; Evers, S.; Samuel, M.K.; Sjogersten, S. High heterotrophic CO2 emissions from a Malaysian oil palm plantations during dry-season. Wetl. Ecol. Manag. 2017, 26, 415–424. [Google Scholar] [CrossRef] [Green Version]
  105. Melling, L.; Chaddy, A.; Goh, K.J.; Hatano, R. Soil CO2 Fluxes from Different Ages of Oil Palm in Tropical Peatland of Sarawak, Malaysia as Influenced by Environmental and Soil Properties. Acta Hortic. 2013, 982, 25–35. [Google Scholar] [CrossRef]
  106. Marwanto, S.; Agus, F. Is CO2 flux from oil palm plantations on peatland controlled by soil moisture and/or soil and air temperatures? Mitig. Adapt. Strateg. Glob. Chang. 2013, 19, 809–819. [Google Scholar] [CrossRef]
  107. Husnain, H.; Wigena, I.G.P.; Dariah, A.; Marwanto, S.; Setyanto, P.; Agus, F. CO2 emissions from tropical drained peat in Sumatra, Indonesia. Mitig. Adapt. Strateg. Glob. Chang. 2014, 19, 845–862. [Google Scholar] [CrossRef]
  108. Marwanto, S.; Sabiham, S.; Funakawa, S. Importance of CO2 production in subsoil layers of drained tropical peatland under mature oil palm plantation. Soil Tillage Res. 2019, 186, 206–213. [Google Scholar] [CrossRef]
  109. Melling, L.; Hatano, R.; Goh, K.J. Soil CO2 flux from three ecosystems in tropical peatland of Sarawak, Malaysia. Tellus B Chem. Phys. Meteorol. 2005, 57, 1–11. [Google Scholar] [CrossRef]
  110. Melling, L.; Goh, K.J.; Beauvais, C.; Hatano, R. Carbon Flow and Budget in Young Mature Oil Palm Agroecosystem on Deep Tropical Peat. Planter 2008, 84, 21. [Google Scholar]
  111. Agus, F.; Wahyunti, A.D.; Setyanto, P.; Subiksa, I.G.M.; Runtunuwu, E.; Susanti, E.; Supriatna, W. Carbon Budget and Management Strategies for Conserving Carbon in Peatland: Case Study in Kubu Raya and Pontianak Districts, West Kalimantan, Indonesia. In Proceeding of International Workshop on Evaluation and Sustainable Management of Soil Carbon Sequestration in Asian Countries; Indonesian Soil Research Institute: Bogor, Indonesia, 2010. [Google Scholar]
  112. Manning, F.C.; Kho, L.K.; Hill, T.C.; Cornulier, T.; Teh, Y.A. Carbon Emissions From Oil Palm Plantations on Peat Soil. Front. For. Glob. Chang. 2019, 2, 37. [Google Scholar] [CrossRef] [Green Version]
  113. Fowler, D.; Nemitz, E.; Misztal, P.; Di Marco, C.; Skiba, U.; Ryder, J.; Helfter, C.; Cape, J.N.; Owen, S.; Dorsey, J.; et al. Effects of land use on surface-atmosphere exchanges of trace gases and energy in Borneo: Comparing fluxes over oil palm plantations and a rainforest. Philos. Trans. R. Soc. Lond. B. Biol. Sci. 2011, 366, 3196–3209. [Google Scholar] [CrossRef]
  114. Meijaard, E.; Sherman, J.; Ancrenaz, M.; Wich, S.A.; Santika, T.; Voigt, M. Orangutan populations are certainly not increasing in the wild. Curr. Biol. 2018, 28, R1241–R1242. [Google Scholar] [CrossRef] [Green Version]
  115. Sharvini, S.R.; Noor, Z.Z.; Chong, C.S.; Stringer, L.C.; Glew, D. Energy generation from palm oil mill effluent: A life cycle assessment of two biogas technologies. Energy 2020, 191, 116513. [Google Scholar] [CrossRef]
  116. Xiao, D.; Ye, Y.; Xiao, S.; Zhang, W.; He, X.; Wang, K. Effects of tillage on CO2 fluxes in a typical karst calcareous soil. Geoderma 2019, 337, 191–201. [Google Scholar] [CrossRef]
  117. Pareja-Sánchez, E.; Cantero-Martínez, C.; Álvaro-Fuentes, J.; Plaza-Bonilla, D. Tillage and nitrogen fertilization in irrigated maize: Key practices to reduce soil CO2 and CH4 emissions. Soil Tillage Res. 2019, 191, 29–36. [Google Scholar] [CrossRef]
  118. Wilson, H.M.; Al-Kaisi, M.M. Crop rotation and nitrogen fertilization effect on soil CO2 emissions in central Iowa. Appl. Soil Ecol. 2008, 39, 264–270. [Google Scholar] [CrossRef]
  119. West, T.O.; Marland, G. Net carbon flux from agriculture: Carbon emissions, carbon sequestration, crop yield, and land-use change. Biogeochemistry 2003, 63, 73–83. [Google Scholar] [CrossRef]
  120. Bernoux, M.; Volkoff, B.; Carvalho, M.d.C.S.; Cerri, C.C. CO2 emissions from liming of agricultural soils in Brazil. Glob. Biogeochem. Cycles 2003, 17, 1049. [Google Scholar] [CrossRef]
  121. Ball, B.C.; Scott, A.; Parker, J.P. Field N2O, CO2 and CH4 fluxes in relation to tillage, compaction and soil quality in Scotland. Soil Tillage Res. 1999, 53, 29–39. [Google Scholar] [CrossRef]
  122. Zhao, Y.-L.; Goldberg, S.D.; Xu, J.-C.; Harrison, R.D. Spatial and seasonal variation in soil respiration along a slope in a rubber plantation and a natural forest in Xishuangbanna, Southwest China. J. Mt. Sci. 2018, 15, 695–707. [Google Scholar] [CrossRef]
  123. Sánchez, M.L.; Ozores, M.I.; López, M.J.; Colle, R.; De Torre, B.; García, M.A.; Pérez, I. Soil CO2 fluxes beneath barley on the central Spanish plateau. Agric. For. Meteorol. 2003, 118, 85–95. [Google Scholar] [CrossRef]
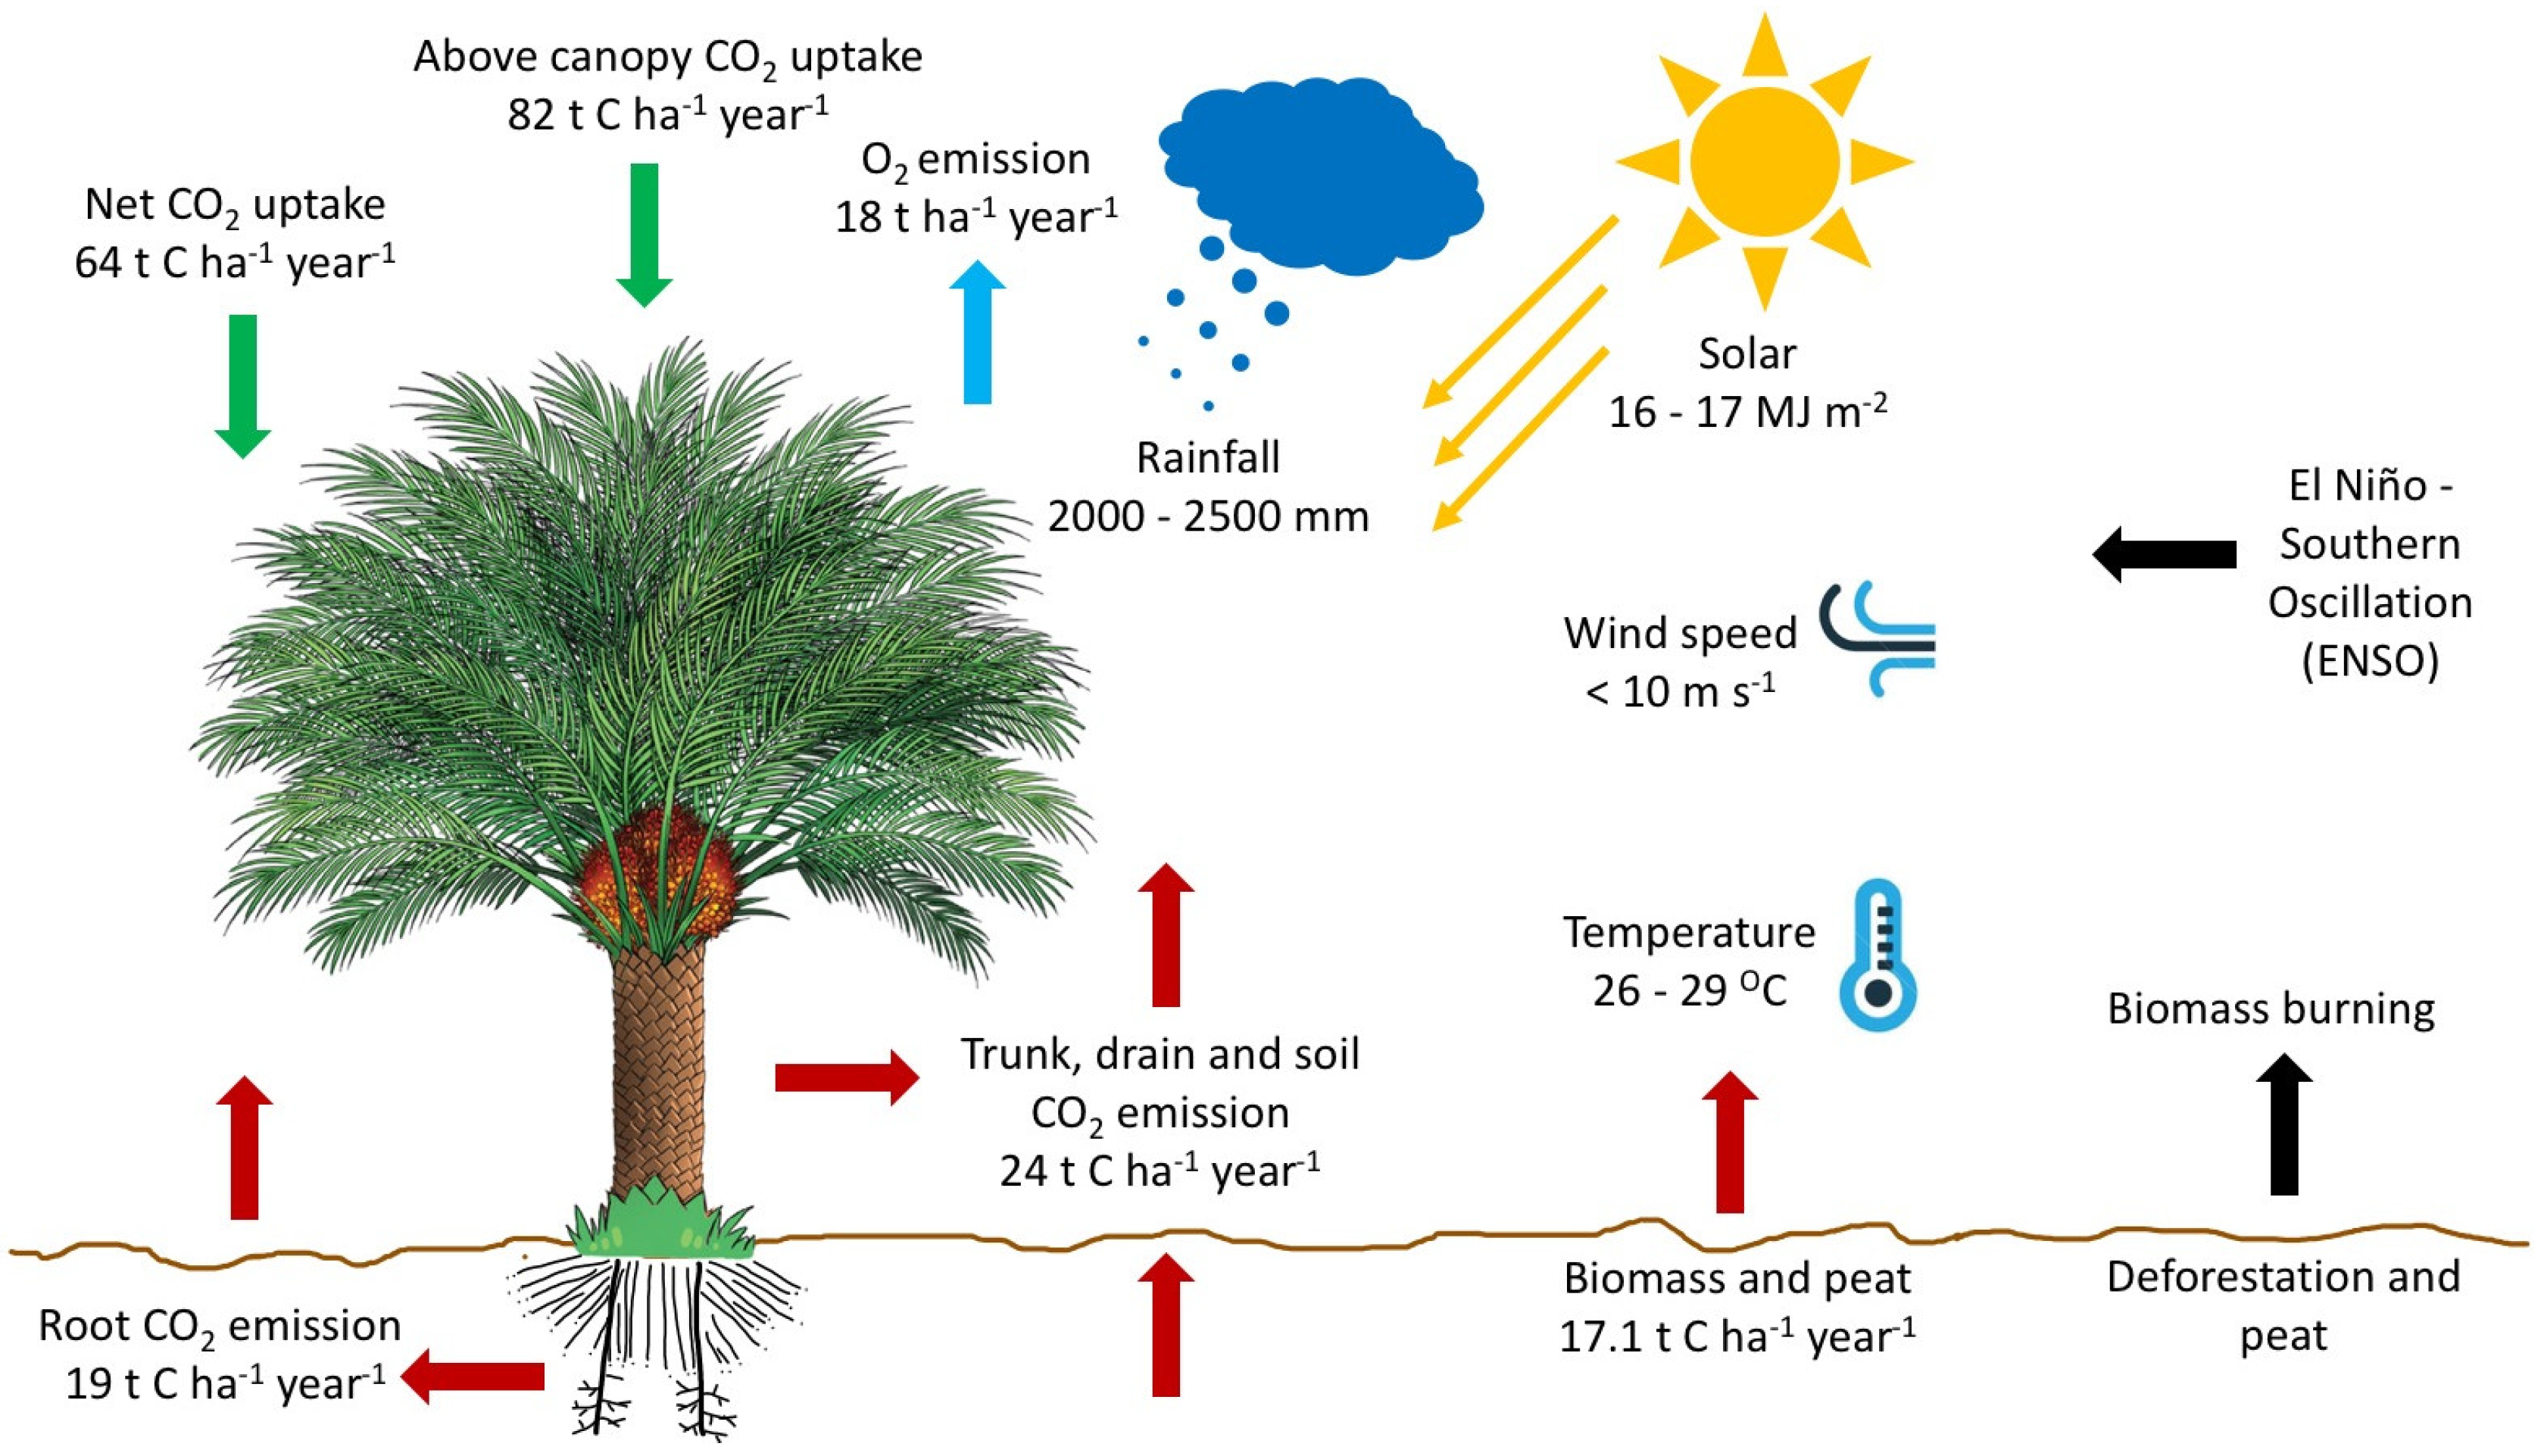
Figure 1. Map of (a) total biomass carbon; (b) total biomass carbon uncertainty. Source: NASA [55].
Sustainability 12 05077 g001
Figure 2. Emission and absorption of oil palm plantations with factors that influence these exchanges in tropical regions.
Sustainability 12 05077 g002
Table 1. Proposed classification of climatic properties in relation to the suitability for oil palm.
Climatic ElementHighly SuitableSuitableModerately SuitableCurrently UnsuitablePermanently Unsuitable
Annual rainfall (mm year−1)2000–25002500–3000
1700–2000
3000–4000
1400–1700
4000–5000
1100–1400
>5000
<1100
Duration of dry season (month)012–45–6>6
Mean annual temperature26–2929–32
23–26
32–34
20–23
34–36
17–20
>36
<20
Daily solar radiation (MJ m−2)16–1717–19
14–16
19–21
11–14
21–23
8–11
>23
<8
Wind (m s−1)<1010–1515–2525–40>40
Source: Goh [36].
Table 2. Peat soil CO2 emissions from previously reported studies.
CountryAreaYearEmissions
(t C ha−1 year−1)
Reference
IndonesiaJambi and Riau2007–201095Hooijer et al. [102]
Jambi2010–201113Marwanto and Agus [106]
Jambi2011–201210Dariah et al. [103]
Riau2011–201218Husnain et al. [107]
Riau2016–201712Marwanto et al. [108]
MalaysiaSelangor200079Matysek et al. [104]
Sarawak2002–200317Melling et al. [109]
Sarawak2002–200341Melling et al. [110]
Sarawak20037Matysek et al. [104]
Matysek et al. [104]
Selangor200665
Table 3. Oil palm plantations related CO2 emissions.
CountryAreaYearEmissions (t C ha−1 year−1)Reference
IndonesiaAceh Barat200819 (Root)Agus et al. [111]
MalaysiaSabah200882 (Above canopy-uptake)Fowler et al. [113]
Sarawak2015–201724 (Trunk, drain, soil)Manning et al. [112]
Table 4. CO2 emissions from different crops.
PlantTypeTime Measured (Location)Emissions (t C ha−1 year−1)Reference
BarleySoilNovember 1998 to October 2000, over non-irrigated barley (Central Spain)0.63Sánchez et al. [123]
CornSoil Based on agricultural inputs detailed by Frye and Blevins (1997) and Ismail et al. (1994), Blevins et al. (1983). (Kentucky, USA)0.4West and Marland [119]
RubberSoilJanuary and March 2016 (China)5.7Zhao et al. [122]
Intact Forest9.5

