Natural Capital Accounting for Land in Rwanda
by
 ,
,
Grace Nishimwe
1, 
Didier Milindi Rugema
2,
Claudine Uwera
3,
Cor Graveland
4,
Jesper Stage
5,*,
Swaib Munyawera
6 and
Gabriel Ngabirame
6 1
Rwanda Land Management and Use Authority, P.O. Box 433 Kigali, Rwanda
2
Institute of Land Administration, Bahir Dar University, P.O. Box 79 Bahir Dar, Ethiopia
3
Ministry of Finance and Economic Planning, P.O. Box 158 Kigali, Rwanda
4
Environmental Accounts Team, Department of National Accounts, Statistics Netherlands, P.O. Box 24500, 2490 HA The Hague, The Netherlands
5
Department of Business Administration, Technology and Social Sciences, Luleå University of Technology, 971 87 Luleå, Sweden
6
Rwanda Natural Capital Accounting, National Institute of Statistics of Rwanda, P.O. Box 6139 Kigali, Rwanda
*
Author to whom correspondence should be addressed.
Sustainability 2020, 12(12), 5070; https://doi.org/10.3390/su12125070
Submission received: 12 April 2020
/
Revised: 13 June 2020
/
Accepted: 15 June 2020
/
Published: 22 June 2020
(This article belongs to the Special Issue Sustainability Accounting and Accountability)
Abstract
:Land, as a valuable natural resource, is an important pillar of Rwanda’s sustainable development. The majority of Rwanda’s 80% rural population rely on agriculture for their livelihood, and land is crucial for agriculture. However, since a high population density has made land a scarce commodity, growth in the agricultural sector and plans for rapid urbanisation are being constrained, and cross-sectoral trade-offs are becoming increasingly important, with a risk that long-term sustainability may be threatened if these trade-offs are not considered. To help track land value trends and assess trade-offs, and to help assess the sustainability of trends in land use and land cover, Rwanda has begun developing natural capital accounts for land in keeping with the United Nations’ System of Environmental-Economic Accounting. This paper reports on Rwanda’s progress with these accounts. The accounting approach adopted in our study measures changes in land use and land cover and quantifies stocks for the period under study (2014–2015). Rwanda is one of the first developing countries to develop natural capital accounts for land, but the wide range of possible uses in policy analysis suggests that such accounts could be useful for other countries as well.
1. Introduction
This paper reports on Rwanda’s ongoing work on compiling natural capital accounts for land use and land cover that are consistent with the United Nations’ System of Environmental-Economic Accounting (SEEA) [1] and that help to identify links between economic, environmental, and social costs and benefits in land use and the relationships between land use and overall sustainability. Rwanda is the most densely populated country in Africa, and land is a key constraint to economic activity. When Rwanda began compiling natural capital accounts for its key natural resources in 2014 as part of its commitments under the Gaborone Declaration for Sustainability in Africa [2], land was rapidly identified as a priority sector for natural capital accounting (NCA) [3]. Work on compiling the land accounts began in earnest in 2015.
SEEA provides guidelines for countries setting up NCA. The SEEA is a guide to integrating economic, environmental, and social data into a single, coherent framework for holistic decision-making. The Rwandan effort is part of the World Bank-led global partnership, Wealth Accounting and the Valuation of Ecosystem Services (WAVES), which aims to promote sustainable development through the application of SEEA. SEEA and WAVES aim to go beyond the traditional use of gross domestic product (GDP) and traditional national accounts by also incorporating natural resource wealth and assets into national accounts [4]. WAVES was established in 2010 to promote sustainable development around the world through the implementation of SEEA-consistent NCA (natural capital accounts (NCAs) and natural resource accounts (a term frequently used in the 1990s and early 2000s) are subsets of the SEEA, which in turn are a subset of the broader term satellite accounts, but the terms are often used interchangeably in practice). Natural capital accounts (NCAs) focus on the value and role of natural resources in a country’s development strategies, policies, and investment decisions. Numerous developing countries have already committed to setting up SEEA-compatible accounts, while academic research on compiling SEEA-consistent accounts and conducting analyses based on such accounts has increased (for recent examples, see [5,6,7,8,9,10,11,12,13,14]; for a recent review, see [15]).
A political interest in setting up environmental and other types of satellite accounts had already begun in the late 1990s and early 2000s. This included satellite accounting work in a number of African countries (for an overview of this early satellite accounting work, see, e.g., [16]; for reviews that note the intermittent character of this work, see [17,18]; for specific examples of SEEA compilation and related academic work, see [19,20,21,22,23,24,25,26,27,28,29,30,31,32,33]). However, most of these efforts have petered out over the years. In many countries, accounts were only compiled for a few years before such work was abandoned. These early satellite accounting efforts were usually based in environmental ministries or environmental research institutes, with limited political support from other parts of their countries’ governments. Furthermore, the compilation of such accounts was frequently based on massive data collection exercises that were supported by donor funding but difficult to sustain in the longer term. Thus, due not only to poor NCA but also to poor national accounts overall, assessing how much of recent years’ income growth in sub-Saharan Africa has been driven by the depletion of natural assets—rather than by sustainable growth in production capacity—is difficult [34,35]. It has also meant that much of the work done on environmental accounting in developing countries (see, e.g., [4]) has had to rely on externally available indicators rather than on countries’ own national accounting agencies. It is important, therefore, that the current round of SEEA activities provides clear inputs to policy [36] and is solidly based on countries’ own systems for regular statistics gathering. In this way, these accounts can be sustained by policy support—and can continue to help in assessing the sustainability of domestic economic trends—once initial donor support ends.
Rwanda was not part of these initial satellite accounting efforts in Africa at the turn of the last millennium; regular national accounting work was still being reconstructed following the Rwandan genocide against the Tutsi in 1994, and the few qualified economists in the country at the time had no experience in environmental economics. Nonetheless, minerals, water, and land—the priority sectors identified as candidates for Rwandan NCA work within WAVES [3]—have since attracted some sector-specific academic environmental economics research attention. Minerals have been explored in several sectoral studies [37,38,39]. Research on water [40,41,42,43,44,45] has looked at urban water pricing and availability, the use of water sources outside the piped water system in urban areas, the valuation of different uses of water in rural areas, and the implicit valuation of water availability in housing markets. While economic researchers have not focused on land accounting per se, they have dealt with various aspects of it, e.g., in relation to agriculture (see, e.g., [46,47,48,49]). As discussed in the next section, the academic interest in land issues is linked to the enormous economic importance of land in Rwanda.
In respect of the terminology adopted in this study, we employed the definitions of land use accounts (discussed in Section 3) and land cover accounts (discussed in Section 4) provided by the SEEA Central Framework [1], as follows:
5.246 Land use reflects both (i) the activities undertaken and (ii) the institutional arrangements put in place for a given area for the purposes of economic production, or the maintenance and restoration of environmental functions.
5.256 Land cover refers to the observed physical and biological cover of the Earth’s surface and includes natural vegetation and abiotic (non-living) surfaces.
Section 2 discusses the importance of land for the Rwandan economy and explains how SEEA-compatible land accounts can help integrate sustainability concerns into land use planning. Section 3, as mentioned above, reports on and discusses the land use accounts. Section 4, as also mentioned above, discusses the land cover accounts. Section 5 discusses the monetary asset accounts for land. Section 6 discusses various ways in which the land accounts can help contribute to strategic and operational decision making that considers the various economic, environmental, and social links between different land uses, and the sustainability of overall trends in land use and land cover changes, in a holistic fashion. Section 7 provides a concluding discussion.
2. Land in Rwanda
Land, as a valuable natural resource, is an important pillar of Rwanda’s sustainable development because it is the basis for agriculture. Agriculture, the main land use, accounts for 31% of GDP and 75% of employment. As Rwanda develops, the industrial and service sectors of the economy have been growing. Despite this, the majority of Rwanda’s 80% rural population continue to rely on agriculture for their livelihood.
Rwanda has a land surface area of 26,338 km2 with a population of about 12 million. With over 450 inhabitants per square kilometre, therefore, the country is the most densely populated in sub-Saharan Africa. The high rate of population growth and inheritance practices, where land is commonly subdivided between multiple heirs, have led to land fragmentation [47]. The resulting reductions in plot size limit a farmer’s chances of increasing the productivity of his/her land, although increased productivity is needed to achieve food security and boost rural incomes. Furthermore, as the economy becomes more industrialised and service-oriented, the demand for land for development continues to increase and become more diverse. In addition, Rwanda’s rapid urbanisation and its plans to develop secondary cities require additional land, as do its policies to limit urban and peri-urban sprawl and establish green zones that improve quality of life. Thus, as a tool to support its implementation of a national policy to plan land use in a rational manner, the Rwandan Government decided to develop land accounts, guided by SEEA standards.
NCA for land can add value in planning for sustainable development by providing indicators and trend analyses which help to track performance toward sustainability, land allocation, service delivery, and productivity targets. Land accounts are relevant to policy because land availability and productivity are potential constraints to agricultural growth, which is key to Rwanda’s development agenda. Additionally, land accounts will help Rwanda not only to account for trends in the economic value of land used for different purposes but also to assess potential trade-offs more systematically. Although sectoral level planning exists, better information (and coordination) could help to reduce the risk of individual sectoral targets leading to cross-sectoral tensions and could help to resolve situations when there are competing demands for the same land. Data on trends in land value on the one hand and changes in land use and land cover on the other, and their potential implications for water use, food production, and other ecosystem services could also inform policy and planning (see, e.g., [50,51,52,53,54]).
Most specifically, however, land accounts can help to clarify and the compare economic value generated by land in competing uses and can show how changes in land use can affect land value. Land accounts also help in analysing issues related to the impact of changes in land use on the productivity of key crops, the production of fuel wood, or (when linked to other accounts) pressure on water resources or other environmental resources. Thus, for instance, [55] describes how Czech land accounts were extended to form the basis for ecosystem asset accounting, and similar accounting work is now ongoing in many European countries (see [56]; for applications, see, e.g., [57], who use European ecosystem accounts, based on land accounts, to study nitrogen retention); [58,59] shows how studying landscape changes linked to agricultural change is crucial for understanding changes in water quality. In future, Rwandan land cover accounts could be expanded to permit similar analyses. Moreover, land accounts not only help in the comparison of market value for land in different regions or uses but they also contribute to explaining how sectors compare in terms of land use per value of output or intensity of use, they enable longer-term projections of productivity and resource use, and they identify potential bottlenecks in making land available to reach national development objectives. It is worth noting that this type of cross-sectoral analysis and comparison of land use is difficult to do without land accounts that link easily to other national accounts data and other economic statistics. While the sectoral analyses of Rwandan land use cited earlier provided an important explanation of the trends in agricultural land use, they did not permit the kind of cross-sectoral comparisons discussed here, and the same is generally true for studies of agricultural land use in other developing countries.
3. Physical Asset Accounts: Land Use Accounts
Thus far, land accounting has been a relatively unusual priority for NCA in developing countries. Therefore, the Rwandan experience has the potential to inform future work on land accounting elsewhere. That said, land accounting may be somewhat easier in Rwanda than in many other developing countries because of its already-established comprehensive database.
Rwandan policymakers have long been aware of the importance of good statistics as an input to policymaking on key issues. Thus, while land accounting may be a new activity, Rwanda’s tenure policies are more systematic and predictable [48,49], and its statistics on land use are some way ahead of those in many other developing countries. In 2012, it established the Land Administration Information System (LAIS), a comprehensive database on land ownership and use. LAIS deals with the systematic registration of land and maintains up-to-date data and records on land parcels, land rights, and the owners of those rights, since land transactions cause such information to change regularly. By late 2013, the database had covered almost all the land in Rwanda—around 11 million plots. Although some land remains unclassified, LAIS still provides a far better starting point for land accounting in Rwanda than in many other developing countries. LAIS’s geo-referenced data on land use in terms, for example, of ownership and economic activity provides a rich basis for the analysis and comparison of trends. By setting up land use accounts, information can be provided on the dynamics of land use in competing uses and, ultimately, on how changes in land use may affect land value.
Using data extracted from LAIS, we set up SEEA-style physical asset accounts for land use for the period 2014–2015 and analysed changes in land use in Rwanda for this period. LAIS data for the period 2012–2015 were examined in the development of these land use accounts. However, the data for 2012 and 2013 have numerous discrepancies and inconsistencies due to imprecision in the early records of LAIS’s founding; between 2012 and 2013, although land was gradually being registered, most parcels had not yet been categorised into a specific land use. Nonetheless, by 2014, the data had been regularised and almost all land initially labelled as Unclassified in terms of its use had been duly categorised and allocated to more specific use categories in the database.
LAIS has 13 land use categories, including the one for unclassified areas (which will be gradually allocated to one of the 12 main land uses). This paper focuses on six categories that make up 97.8% of land use. The six in question are Agriculture, Forestry, Industrial, Livestock, Residential, and Unclassified. The remaining seven land uses, grouped together under Other use, are Administrative, Commercial, Economic, Fishing, Research/Scientific, Social and Culture, and Tourism. The categories discussed in this paper and their relation to the primary LAIS categories are summarised in Table 1, which also reveals the share each category makes up of the overall land available in Rwanda.
Although the LAIS categories were not designed to be consistent with the SEEA classification for land use accounts, they are largely compatible with the main SEEA categories (for discussion of the SEEA categories and subcategories for land use accounts, see [1]). Thus, for instance, the LAIS land use categories Agriculture and Livestock are classified together under Agriculture in SEEA’s land use categories, and Forestry is a separate category in both LAIS and SEEA, while the LAIS Residential category is part of the SEEA land use category entitled Use of built up and related areas. Thus, at the aggregate level, the compatibility between LAIS and SEEA is high, and all land that has been classified in LAIS can be assigned an aggregate SEEA category. However, as work on land accounts develops over time, compatibility at more detailed levels of classification will also need to be ensured in future LAIS work, and the more detailed LAIS classifications are now being revised to ensure future compatibility with more detailed SEEA classifications.
Table 2 and Table 3 illustrate the land use change matrices for 2014 and 2015, respectively. The tabulated analyses are an important milestone in the development of Rwanda’s land accounts, not only because they allow one to examine, in detail, the changes from one land use to another during the two years but also because they include the full set of land uses available in LAIS. All LAIS land use categories appear on the horizontal and vertical axes in both tables. Both tables also show the opening stock by land use category on the left. Beginning at the left-hand column, reading across the row from left to right, the tables show, for each land use category, shifts from that land use to some other land use. The final column records the net change. As an example, for Agriculture, the category begins 2014 with 1.2 million ha, loses 1251 ha to and gains 4 ha from Forestry, and loses land to and gains land from numerous other categories, for a total loss of 7377 ha, a total gain of 9501 ha, and a slight net increase of 2124 ha during the year.
The way in which the matrix is set up ensures that all land use changes come from some category and go to some category, so that the last entry in the Net change column shows a “0” for the whole country. As additional years are considered in the land use accounts, these tables will be an important analytical tool for examining the directions and dimensions of land use change in Rwanda.
Figure 1 shows the total land area in hectares recorded in LAIS for each category of land use at the end of 2015 for each Province as well as for Kigali City, the country’s capital.
Agricultural land use dominates in all Provinces—and even in Kigali City. The Eastern Province is not only the largest of the Provinces, it also has the largest amount of land used for agriculture and livestock. The Southern and Western Provinces have more land allocated to forestry than the other two Provinces or Kigali City, while the Eastern Province has the largest amount of land allocated to livestock in comparison with the other three Provinces and Kigali City.
Figure 2 expresses the land use data per category as a percentage share. Not only does this offer a different perspective on the relative importance of different land uses in different parts of the country, it also sheds additional light on the situation in Kigali City, which constitutes a small land area compared with that in the Provinces. As expected, Kigali City has a greater share of residential area than the Provinces; however, it also has surprisingly large areas allocated to Agriculture and Forestry. The relatively small portions of land allocated to Industrial only reflects that these activities are more labour- or capital-intensive, rather than land-intensive, and do not need large areas of land. The light grey bar representing the land categorised as Unclassified signals that the use of 10–15% of the land registered in LAIS is still in the process of being clarified. Once these unclassified parcels have been assigned an appropriate category in LAIS, the understanding of land use across Rwanda will be more complete and this analysis can be updated.
The Unclassified category is an important one when considering changes in land use as reported in these accounts. Most recorded changes are not physical shifts per se from one land use to another; rather, they reflect an administrative re-categorisation of a land parcel previously subsumed under the Unclassified label into a defined category after an examination of the case. Figure 3 shows, by Province and in the city of Kigali, where the land use shifts are coming from (negative numbers) and where they are moving to (positive numbers). The greatest degree of change is evident in the length of the grey bar for the Unclassified category. This shows that most changes in the land use designations in LAIS result from parcels being moved from an unclassified state into a known land use category. Thus, from the beginning of 2014 to the end of 2015, about 30,000 ha were moved out of the LAIS Unclassified category to a known land use designation. Of this amount, 25,500 ha (85%) were in the Southern Province. The reclassified land use parcels were mainly in Agriculture (65%), Residential (21%), and Forestry (11%). Thus, most of the net changes in land uses recorded in LAIS can be explained by the considerable effort undertaken in 2014 and 2015 to designate unclassified areas a known land use, particularly in the Southern Province. Other Provinces may have been relatively more complete in prior years.
4. Physical Asset Accounts: Land Cover Accounts
A second set of land accounts, land cover accounts, can offer an analysis of land cover such as vegetation, water, or artificial surfaces. Land cover data provide another angle from which to understand a country’s land dynamics. Remote sensing allows one to measure changes from one type of land cover to another, which can be used, for example, to monitor deforestation/afforestation.
With reference to Rwanda in this regard, the Government worked with the Kenya-based Regional Centre for Mapping of Resources for Development (RCMRD) to create land cover maps for 1990, 2000, and 2010. These data are in the public domain and provide a useful resource for determining long-term trends and performing other types of analysis. For example, the data sets on land cover have been used by the Wildlife Conservation Society, the Science for Nature and People Partnership, and the United States’ Geological Survey to develop experimental SEEA ecosystem accounts for Rwanda [60]. Rwanda has relied on these data sets to develop land cover accounts for the period 1990–2010 to monitor and analyse changes in land cover (and land use) and to support policies addressing existing issues, and one of the few other African examples of land cover accounts, the South African work [61], used similar data.
The Rwanda Land Management and Use Authority is currently in the process of improving its remote sensing analysis and mapping capacities. Thus, with WAVES support, the Rwandan Government has not only commissioned the RCMRD to update the country’s land cover maps and their underlying data sets to 2015 but has also launched an internal capacity-building effort so that these mapping products, realised at various geographic scales, can be updated and improved regularly. This mapping capacity will be linked up with LAIS’s comprehensive database.
Meanwhile, however, the only land cover maps available for our study were those that relate to the pre-LAIS periods (1990, 2000, and 2010) mentioned earlier. This section and its analysis of issues and trends is, therefore, based on those maps.
The land cover categories employed in remote sensing analysis differ from the administrative land use categories defined in LAIS. Land cover analysis is based on categories that can be identified (visually or through algorithms) using remote sensing. These categories are based on the biophysical properties of the land. By contrast, land use data in LAIS are classified according to location, ownership, value, size, and other variables that are important in land administration; however, certain variables (such as ownership or value) may not be directly observable. Thus, there is not complete congruence between the descriptions and categories for land use and land cover. These differences are illustrated in Figure 4, which shows the two different classifications of land, albeit for different years (2010 versus 2015).
Table 4 and Figure 5 show the areas in hectares for various types of land cover in Rwanda, such as Moderate forest, Open grassland, and Wetland. As with the land use accounts, the data sources used for land cover accounts were not designed with SEEA categories in mind, but the consistency with SEEA classification is nonetheless good at this level of detail. The land cover categories used in the remote sensing data can all be assigned to their respective SEEA categories with relative ease.
Table 4 and Figure 5 illustrate not only the physical changes in land cover over a relatively long timescale of 20 years but also developments in the country’s specific social history. Generally, a decline in woodland and an increase in cropland are apparent. However, this decline is most noticeable in the period from 1990 to 2000, which includes the genocide events in 1994 and the land use changes associated with the displacement of people and, later, the repatriation of refugees.
Table 5 and Figure 6 and Figure 7 reveal further detail and nuance of the national picture by illustrating the types of land cover that prevailed in the four Provinces and Kigali City for the 20-year period in question. While Table 5 and Figure 6 show the total amount in hectares for each land cover category for the four Provinces in the different years, Figure 7 shows the total shares of land in each Province for each land cover category.
Across all Provinces, the figures show an increasing share of land cover in cropland and grasslands, with a decline in moderate and sparse forests. This is very noticeable in the Northern and Eastern Provinces between 1990 and 2000, again reflecting the genocide against the Tutsi and the resettlement of people in those areas in the 1990s. The trends are relatively dramatic and uniform across the Southern, Western, and Eastern Provinces. In the Northern Province, there is a dramatic increase in annual cropland from 1990 to 2000 at the expense of forested land, somewhat reversed by 2010.
5. Monetary Asset Accounts: The Value of Land
To calculate Rwanda’s land transactions and value, we again consulted the rich LAIS database. For 2014, LAIS recorded 15,500 land transactions (actual sales and purchases, not including. e.g., the inheritance of land) involving a total land surface area of 4020 ha. These are summarised in Table 6. The average size of parcels involved in these transactions was about a quarter of a hectare, with a wide range of sizes across Provinces. Kigali City and the Western and Northern Provinces saw transactions involving quite small plots on average, i.e., about one tenth of a hectare, while transactions in the Eastern Province showed that the average plot was over four fifths of a hectare.
It should be noted that the SEEA Central Framework recommends separating the value of buildings and improvements (a form of produced capital) from the value of the land itself (a form of natural capital); for a discussion and examples of some of the underlying valuation issues in natural capital accounting, see, e.g., [62,63,64,65]). However, the transactions reported in LAIS involve developed parcels that involve both land and buildings, as well as undeveloped parcels that only involve land. It stands to reason that developed parcels should have higher prices than their undeveloped counterparts.
The total value of transactions was 141.8 billion Rwandan Francs (RwF), with well over 60% of that value relating to parcels in Kigali City. Sixty per cent of the total area transacted was in the Eastern Province, while the highest number of parcel transactions, namely 45%, was for land in Kigali City.
The average value per hectare in respect of transactions overall was RWF 35 million per hectare. However, these values were five times higher for Kigali City than for the four Provinces. The Eastern Province had the lowest average transaction value per hectare, namely RWF 14 million per hectare.
5.1. High Variability of Transaction Value
An initial examination of the LAIS 2014 data on parcel transaction value revealed differences in orders of magnitude across parcels and Provinces. Table 7 provides descriptive statistics after standardisation on the value per hectare and shows the high variability in transaction value per hectare.
For all of Rwanda, the maximum value per hectare (RWF 34,476 million) is almost 250 times greater than the average (RWF 142 million), while the minimum (RWF 0.02 million) is less than one-tenth of a percentage point of the average. Some of this variation can be explained by the fact that LAIS does not distinguish between developed land (including buildings) and undeveloped land. However, in a market where most transactions yield values in the range of RWF 20–100 million (USD 25,000–125,000) per hectare, it is beyond surprising to see parcels being exchanged for only RWF 100,000 (USD 125) per hectare or even as little as RWF 20,000 (USD 25) per hectare. Of equal concern is that parcels in relatively rural areas are exchanged for more than RWF 30 billion per hectare. These extremely high and low values raise not only the suspicion of data entry errors but also the urgent need for cross-checking.
Figure 8 shows a histogram of the frequency (number) of transactions that occurred within the value range given on the horizontal axis. Most transactions occurred in the range of RWF 3–150 million/ha. Although the range is quite wide, it is probably realistic given the range of rural, town-based, and city-based transactions and the fact that developed and undeveloped (farming) parcels are grouped together here. However, there is also a small number of extreme values at the low and high ends. These extreme values skew the means and variances of the data set and raise the concern that they are due to data entry errors (e.g., dropped or added zeros) rather than realistic estimates of land value.
Further analysis found that, indeed, a relatively small number of very erratic values may indicate errors in the underlying data, perhaps introduced during data entry from paper records. Because the data set has more than 15,000 records, it was assumed that most were not flawed and that some process could be developed to screen out extreme outliers. This would mean that the remaining records would still serve as a useful sample of land transaction value in Rwanda. One response would be to use a sampling approach and calculate averages with a substantial subset of the data. However, this would be relatively technical and less useful for regular replication in the future in terms of preparing natural capital accounts in a systematic manner.
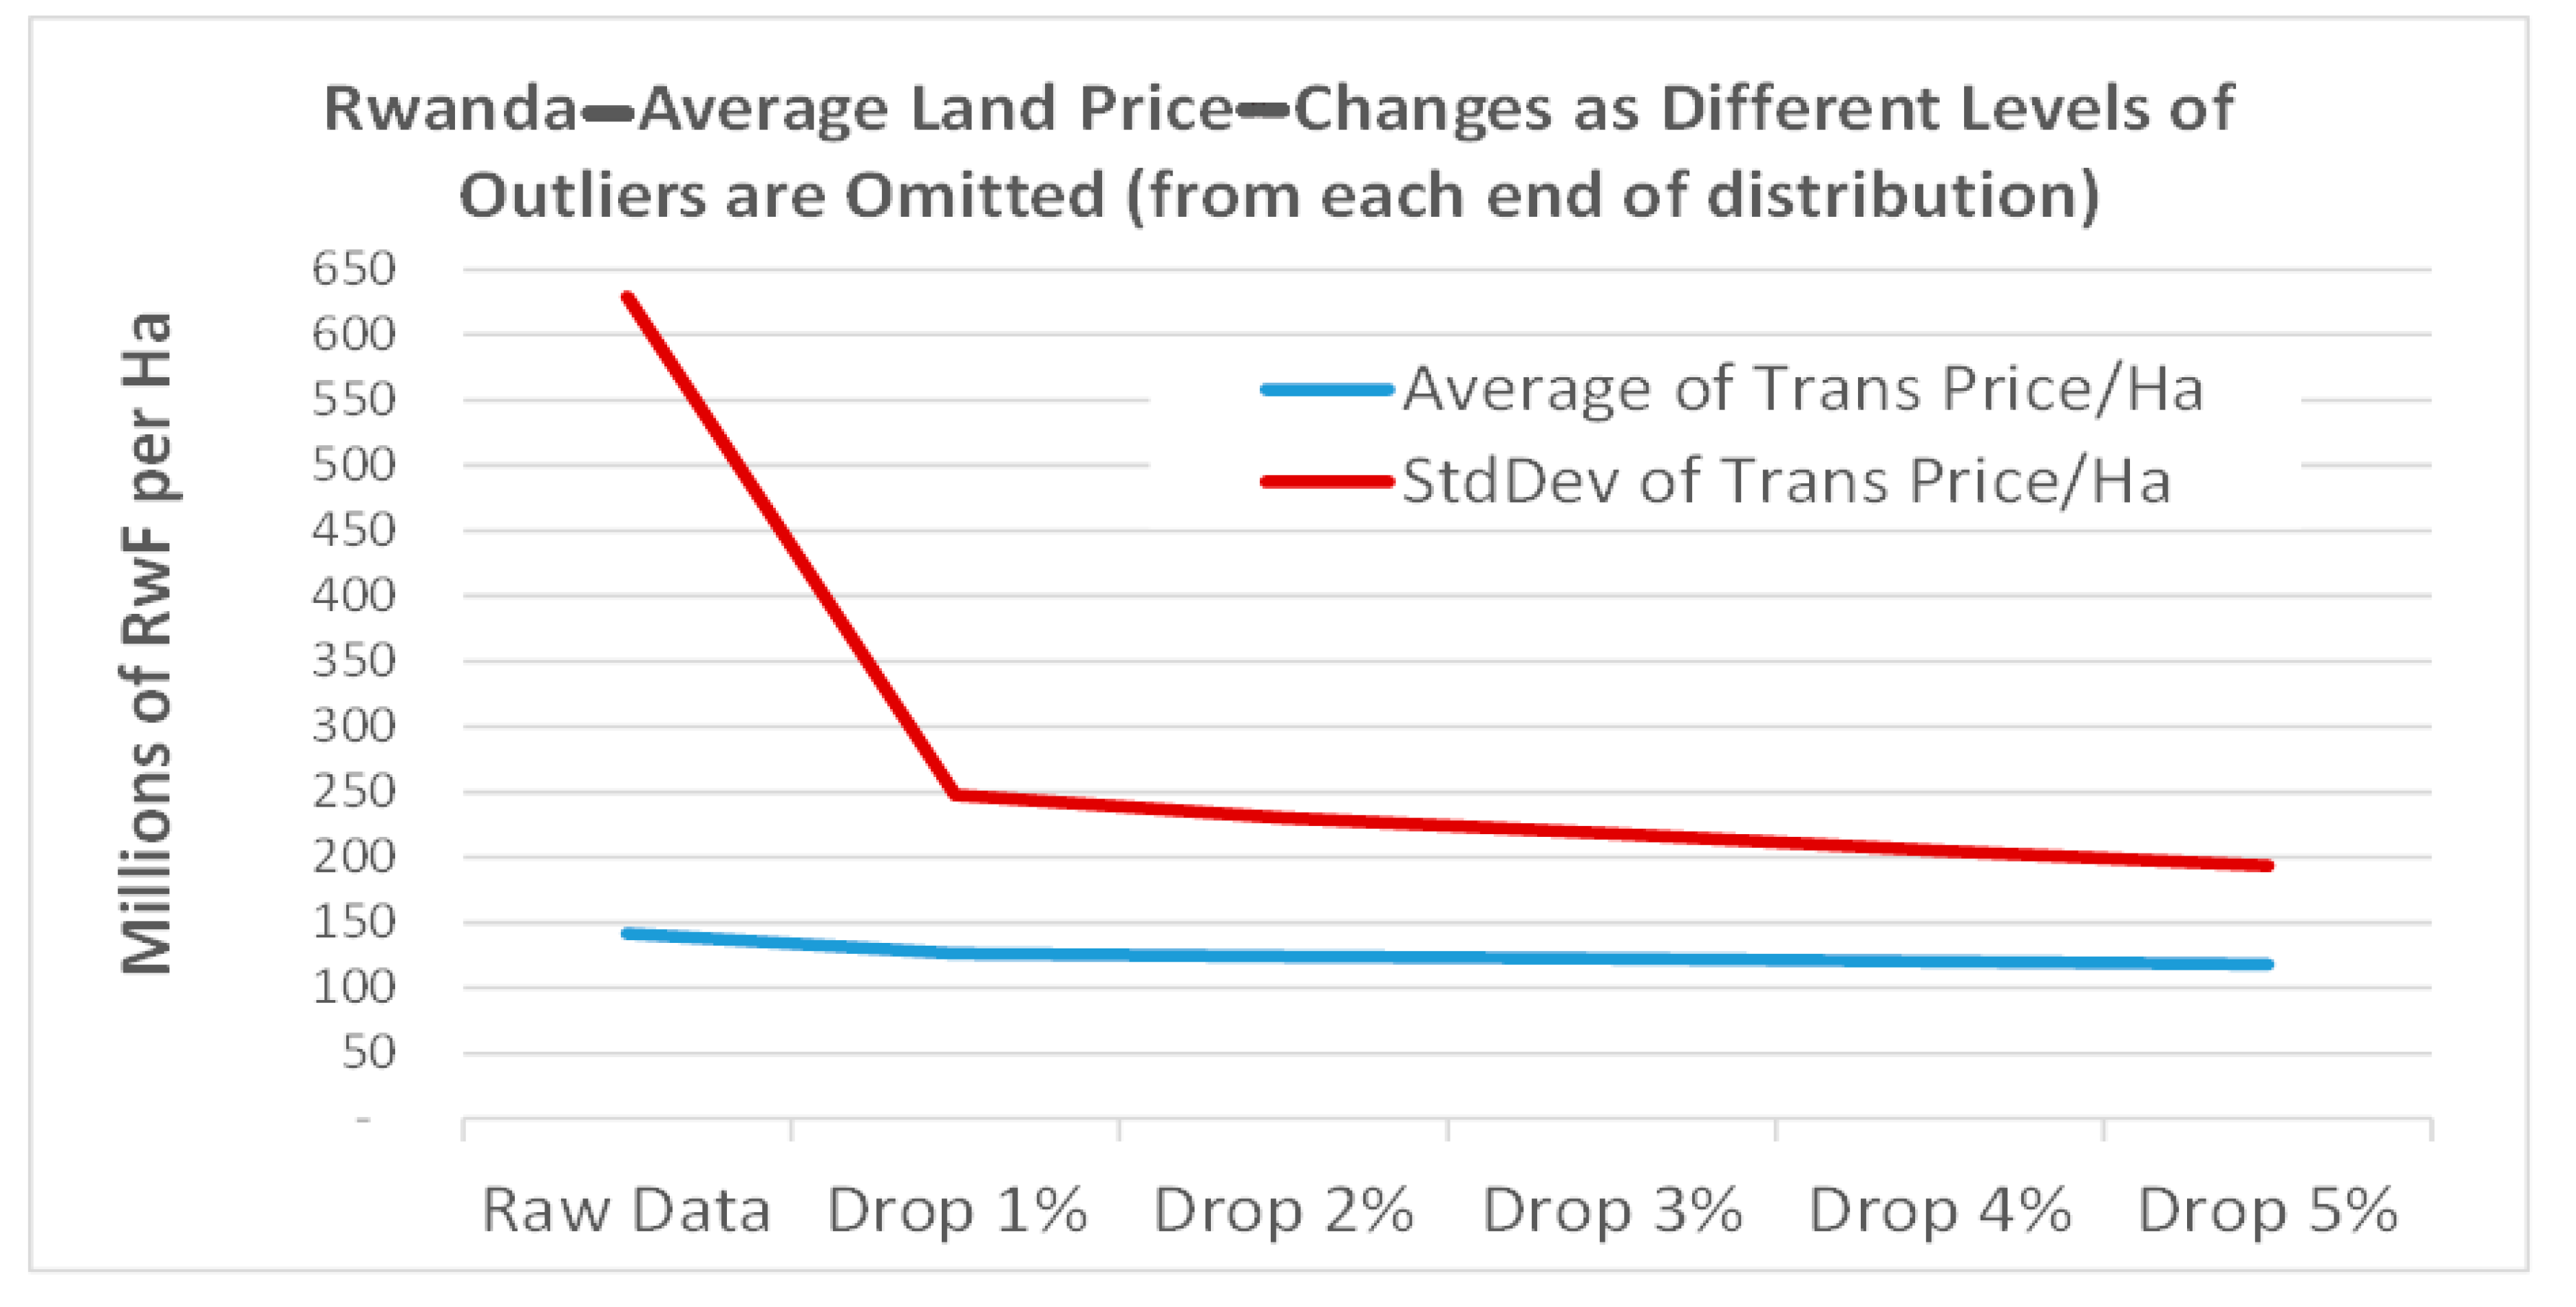
As an alternative, the effect of omitting a small percentage of the data points from both the high and low ends of the distribution was tested. The resulting effect on the average and standard deviation of the Value per hectare variable is shown in Figure 9. Omitting 1% of the extreme low and high values (2% of the data set overall, or about 300 data points) results in a very substantial (60%) reduction in the variability of the data, with a much lower effect (about 10%) on the average. Furthermore, this procedure of omitting a small portion of the extreme values had no major or systematic effect on the values at Province or District level (see Section 5.2 below).
Based on the analysis discussed in the preceding paragraph, the remaining analyses for this paper proceed with 1% of the records dropped from each end of the value per hectare distribution.
5.2. Land Parcel Transaction Value by Province and District
Experience in other countries (see, e.g., [66,67]) have indicated that land accounts can become even more useful for analytical purposes when disaggregated to the regional and local levels, and as already shown, this is easy to do with the format that the Rwandan data are in. Table 8 summarises the number, area, and value of parcel transactions for 2014 at the national and provincial levels, while Table 9 provides the same information at the urban and rural District levels.
Not surprisingly, there are higher value land transactions in more urban districts than in rural districts. There is still quite a range of values between locations, but this may make sense if one compares the more rural and remote locations with urban centres. The largest changes occur in areas with the fewest transactions (because a small change in what is counted has more impact on the overall average).
Nonetheless, there are some interesting exceptions to these general patterns. A case in point involves Bugesera and Nyagatare in the Eastern Province. If one looks at the trend of “High value = Urban” versus “Low value = Rural” given in Table 8 and Table 9, it would suggest that Nyagatare—which contains one of a handful of secondary cities—should have the highest transaction value in the Province; instead, Bugesera holds this position. This may be explained due to Bugesera’s relative proximity to Kigali, such that parcel transaction value are higher to the north of Bugesera. Relationships such as these deserve further detailed study and should be compared with figures from 2015 onwards when such data become available.
5.3. Land Parcel Transaction Value by Land Use
This section provides similar analyses and comparisons disaggregated by land use (see Section 3 for an introduction to LAIS land uses).
Table 10 summarises the LAIS 2014 data on the number, area, and value of parcel transactions according to land use. The data show that most transactions involved land uses for agricultural, livestock, and residential purposes. Transactions involving agriculture and livestock land uses were of a substantially lower value per hectare than commercial, residential, and industrial transactions. The results in Table 10 indicate logical patterns in the areas and value across sectors, some of which indicate high-value, concentrated economic activities, and others, less so.
6. Use of Land Accounts for Other Analyses
A key use of national accounts, including the SEEA satellite accounts, is as a source of data for policy analysis and academic analysis [68]. The land accounts can be used to derive green indicators to monitor the Rwandan Government’s Economic Development and Poverty Reduction Strategy (EDPRS) as well as indicators for the United Nations’ Sustainable Development Goals (SDGs) aimed at monitoring the sustainable development of countries in a consistent and comparable manner. In particular, land accounts can inform SDG 15, stated as the following [69]:
Protect, restore, and promote the sustainable use of terrestrial ecosystems, sustainably manage forests, combat desertification, and halt and reverse land degradation and halt biodiversity loss.
Thus, for instance, [70] uses European land cover accounts to identify land cover types susceptible to change and soil resources that are at risk, and proceed to estimate the potential effects on carbon storage of these potential future changes in land cover and soil quality; [57] similarly uses European satellite accounts to study nitrogen retention. In years to come, Rwandan land cover accounts could provide data for similar analyses.
Rwanda also has several policies aimed at combating land fragmentation by means of maintaining or increasing average plot size, particularly in the agriculture sector. Although analysing the effects of these policies is not the main purpose of the work on NCA, the database lends itself to the analysis of a wide range of land-related questions, including land fragmentation. Thus, although the two-year period covered by the current research did not allow us to analyse long-term trends, we were able to study trends over the studied two-year period by plot location and type of land use. One such trend was that of land fragmentation. Our findings in this respect show that although land fragmentation increased during 2014 and 2015, it only did so by a relatively small margin. Thus, the average size of plots in the Agriculture category declined by some 1.8% from the beginning of 2014 to the end of 2015. The average size of plots under Livestock declined by almost 10%, while the average size of plots classified as Residential declined by only 1.0%. Some of these declines in average plot sizes may be due to small, previously unclassified plots becoming classified, rather than by the continued fragmentation of already-classified plots. However, this assumption deserves further and more detailed analysis.
Table 11 shows that average parcel sizes are small across all parts of Rwanda, but plots in the Eastern Province are about twice as large as the national average, while plots in the Northern Province are the smallest, at only about 60% of the national average.
Results from the land accounts are expected to inform the Government regarding current physical and economic trends and, in doing so, enable policy analysts to deepen their investigation of the trade-offs between different land uses and thus inform rational land allocation.
7. Concluding Discussion
Very few developing countries have chosen to develop land accounts, and it is therefore worthwhile to discuss what potential benefits Rwanda can hope to achieve in the future by compiling land accounts per se in addition to the land statistics and agricultural statistics that it would be compiling in any case. Two points deserve to be highlighted; one is that the link to other economic data make land accounts more useful in the longer term than LAIS data compiled in isolation, and the other is that the link to other economic data make cross-sectoral comparisons possible in a way that agricultural statistics compiled in isolation do not. While much of this work is only starting out in Rwanda, we can already see some of the potential benefits from these links to other economic statistics materialising.
Land accounts can be used to inform land-use planning, including the distribution of land use not only at the Province and District level but also at lower levels of administrative organisation. Land accounts and the LAIS database also provide information on parcel size, ownership, and transaction value, and they enable one to track changes in these land-related aspects. Agencies and local government bodies involved in land-use planning will benefit from examining these data at a detailed level, including linking with geographic information systems and mapping that can show change over time at a precise level. Land accounts can also be used to examine how land use classifications conform to the recommendations in Rwanda’s Land Use Development Master Plan, disaggregated to the District level. Specific areas of rapid change or land uses that are not aligned with the Master Plan can be investigated in depth, also in the field. Combining land use, land cover accounts, and land use plans in a geospatial analysis will become a very powerful and useful tool for checking how consistent such plans are with activities on the ground, so to speak, and for checking the direction of change. The accounts can be used for targeting areas for more detailed study, as well, or for monitoring the Land Use Master Plan’s implementation, by focusing on areas where land use or land cover are undergoing rapid change.
Moreover, land accounts can inform the valuation of land, after full quality and consistency checks have been carried out. On its part, LAIS provides a systematic overview of land parcel transaction value. This can be compared with the mortgage value evidenced in the banking system and revenue authority databases. In addition, land parcel transaction value can be compared with—or used as—reference prices for considering, e.g., value for mortgages and compensation if land is taken in the interest of national development. Furthermore, the Government continues to pursue its efforts to separate the value of land from the value of buildings and other structures on it.
Another benefit of land accounts is their potential to inform officials of changes in development and settlement patterns. With more detailed analysis and mapping information, the LAIS database can be used to report on the development of rural settlements and changes in residential land uses, by District or any other level of geographic detail. This can support the “integrated approach to land-use and human settlements” called for in the Second EDPRS. This would require more detailed work, but the data and systems are available to support this process.
In respect of analysing changes in parcel size by land use and geographic area, the LAIS database is once again of immense value. The current system already has quality data for two years, but there is no room for the discussion of long-term trends yet. This analysis shows that national averages of parcel size are not a good indicator of what is happening at the regional Province and District level, where there are both increases and decreases in parcel size across regions and uses. For some areas, these changes reach 3–5% over the two-year period examined, which indicates a rapid change in parcel size but in both directions—there are increases in some areas and decreases in others. The areas showing rapid change may deserve more in-depth analysis and further case studies to determine if such movements reflect plot transaction activity per se or whether they are artefacts of the administrative system or of dubious data quality.
Land accounts in developed countries are often linked to experimental ecosystem accounts so as to permit the assessment of how changes in land use and land cover are likely to affect the future provision of ecosystem services. The ongoing ecosystem accounting work in Rwanda is already making use of the country’s land accounts in a similar fashion.
In conclusion, therefore, even though many of the data needed to develop Rwanda’s land accounts are already being collected by the Government, compiling land accounts per se—as in this study—clearly led to new insights. Continuing the NCA process will permit the Rwandan Government to track a wider range of developments over time and could contribute directly to policy involving the prudent management of a key resource. While the hurdles for developing land accounts may be greater in many other developing countries, which have worse land data to begin with, many of the benefits from land accounts would be similar there. Thus, unlike the natural resource accounting efforts in African countries in the 1990s and early 2000s, which have since petered out, this new round of NCA initiatives will hopefully engender sufficient support among policymakers to enable the accounts to be maintained in posterity.
Funding
This research received support from the Wealth Accounting and Valuation of Ecosystem Servies (WAVES) Global Partnership on Natural Capital Accounting, hosted at the World Bank, Washington, DC 20250, United States of America, and from the Jan Wallander and Tom Hedelius foundation through its grant P17-59. The APC was funded by the Jan Wallander and Tom Hedelius foundation through its grant P17-59.
Acknowledgments
This work was partially supported by the Wealth Accounting and Valuation of Ecosystem Services (WAVES) Global Partnership on Natural Capital Accounting, hosted at the World Bank, Washington, DC 20250, United States of America. Financial support from the Jan Wallander and Tom Hedelius foundation is also gratefully acknowledged. Participants at the 2017 World Bank Conference on Land and Poverty in March, 2017 provided valuable comments on an earlier version of this paper. The usual disclaimers apply.
Conflicts of Interest
The authors declare no conflict of interest.
References
- SEEA/System of Environmental Economic Accounting. System of Environmental Economic Accounting 2012: Central Framework; United Nations: New York, NY, USA, 2014. [Google Scholar]
- Gaborone Declaration for Sustainability in Africa. 2012. Available online: http://www.gaboronedeclaration.com/ (accessed on 18 June 2020).
- Stage, J.; Uwera, C. Prospects for establishing environmental satellite accounts in a developing country: The case of Rwanda. J. Clean. Prod. 2018, 200, 219–230. [Google Scholar] [CrossRef]
- World Bank. The Changing Wealth of Nations: Measuring Sustainable Development in the New Millennium; World Bank: Washington, DC, USA, 2011. [Google Scholar]
- Piaggio, M.; Alcántara, V.; Padilla, E. The materiality of the immaterial: Service sectors and CO2 emissions in Uruguay. Ecol. Econ. 2015, 110, 1–10. [Google Scholar] [CrossRef]
- Wood, R.; Stadler, K.; Bulavskaya, T.; Lutter, S.; Giljum, S.; De Koning, A.; Kuenen, J.; Schütz, H.; Acosta-Fernández, J.; Usubiaga, A.; et al. Global sustainability accounting—Developing EXIOBASE for multi-regional footprint analysis. Sustainability 2015, 7, 138–163. [Google Scholar] [CrossRef] [Green Version]
- Piaggio, M. Nitrogen oxide emissions and productive structure in Spain: An input–output perspective. J. Clean. Prod. 2016, 141, 420–428. [Google Scholar]
- Freire-González, J.; Vivanco, D.F. The influence of energy efficiency on other natural resources use: An input–output perspective. J. Clean. Prod. 2017, 162, 336–345. [Google Scholar] [CrossRef]
- Kunanuntakij, K.; Varabuntoonvit, V.; Vorayos, N.; Panjapornpon, C.; Mungcharoen, T. Thailand Green GDP assessment based on environmentally extended input–output model. J. Clean. Prod. 2017, 167, 970–977. [Google Scholar] [CrossRef]
- Li, Z.; Sun, L.; Geng, Y.; Dong, H.; Ren, J.; Liu, Z.; Tian, X.; Yabar, H.; Higano, Y. Examining industrial structure changes and corresponding carbon emission reduction effect by combining input–output analysis and social network analysis: A comparison study of China and Japan. J. Clean. Prod. 2017, 162, 61–70. [Google Scholar] [CrossRef] [Green Version]
- Liang, S.; Wang, Y.; Zhang, T.; Yang, Z. Structural analysis of material flows in China based on physical and monetary input–output models. J. Clean. Prod. 2017, 158, 209–217. [Google Scholar] [CrossRef]
- Piaggio, M.; Padilla, E.; Román, C. The long-term relationship between CO2 emissions and economic activity in a small open economy: Uruguay 1882–2010. Energy Econ. 2017, 65, 271–282. [Google Scholar] [CrossRef]
- Turpie, J.K.; Forsythe, K.J.; Knowles, A.; Blignaut, J.; Letley, G. Mapping and valuation of South Africa’s ecosystem services: A local perspective. Ecosyst. Serv. 2017, 27, 179–192. [Google Scholar] [CrossRef]
- Lindmark, M.; Nguyen Thu, H.; Stage, J. Weak support for weak sustainability. Ecol. Econ. 2018, 145, 339–345. [Google Scholar] [CrossRef]
- Yu, H.J.; Wang, Y.T.; Li, X.; Wang, C.D.; Sun, M.X.; Du, A.S. Measuring ecological capital: State of the art, trends, and challenges. J. Clean. Prod. 2019, 219, 833–845. [Google Scholar] [CrossRef]
- Poonyth, D.; Barnes, J.I.; Suich, H.; Monamati, M. Satellite and resource accounting as tools for tourism planning in southern Africa. Dev. S. Afr. 2002, 19, 123–141. [Google Scholar] [CrossRef]
- Zhong, S.; Geng, Y.; Liu, W.; Gao, C.; Chen, W. A bibliometric review on natural resource accounting during 1995–2014. J. Clean. Prod. 2016, 139, 122–132. [Google Scholar] [CrossRef]
- Pirmana, V.; Alishjahbana, A.S.; Hoekstra, R.; Tukker, A. Implementation barriers for a System of Environmental-Economic Accounting and its implications for monitoring Sustainable Development Goals. Sustainability 2019, 11, 6417. [Google Scholar] [CrossRef] [Green Version]
- Lange, G.-M.; Motinga, D.J. The contribution of resource rents from minerals and fisheries to sustainable economic development in Namibia. In Research Discussion Paper 19; Directorate of Environmental Affairs: Windhoek, Namibia, 1997. [Google Scholar]
- Lange, G.-M. An approach to sustainable water management in southern Africa using natural resource accounts: The experience in Namibia. Ecol. Econ. 1998, 26, 299–311. [Google Scholar] [CrossRef]
- Hassan, R.M. Improved measure of the contribution of cultivated forests to national income and wealth in South Africa. Environ. Dev. Econ. 2000, 5, 157–176. [Google Scholar] [CrossRef]
- Crafford, J.G.; King, N.A.; Malubane, T.G.; Anderson, H.A. Water Resource Accounts for South Africa 1991–1998; ENV-P-C 2001-028; Council for Scientific and Industrial Research: Pretoria, South Africa, 2001. [Google Scholar]
- Stage, J. Decomposition of Namibian energy intensity. S. Afr. J. Econ. 2001, 69, 698–707. [Google Scholar] [CrossRef]
- Stage, J.; Fleermuys, F. Energy use in the Namibian economy from 1995 to 1998. Dev. S. Afr. 2001, 18, 423–441. [Google Scholar] [CrossRef]
- Stage, J. Structural shifts in Namibian energy use: An input–output approach. S. Afr. J. Econ. 2002, 70, 1103–1125. [Google Scholar] [CrossRef]
- Suich, H. Development of preliminary tourism satellite accounts for Namibia. Dev. S. Afr. 2002, 19, 105–121. [Google Scholar] [CrossRef]
- Lange, G.-M.; Hassan, R.; Hamilton, K. Environmental Accounting in Action: Case Studies from Southern Africa; Edward Elgar: Cheltenham, UK, 2003. [Google Scholar]
- Lange, G.-M.; Wright, M. Sustainable development in mineral economies: The example of Botswana. Environ. Dev. Econ. 2004, 9, 485–505. [Google Scholar] [CrossRef] [Green Version]
- Luyanga, S.; Miller, R.; Stage, J. Index number analysis of Namibian water intensity. Ecol. Econ. 2006, 57, 374–381. [Google Scholar] [CrossRef]
- Reid, H.; Sahlén, L.; Stage, J.; MacGregor, J. Climate change impacts on Namibia’s natural resources and economy. Clim. Policy 2008, 8, 452–466. [Google Scholar]
- Barnes, J.I.; MacGregor, J.J.; Nhuleipo, O.; Muteyauli, P. The value of Namibia’s forest resources: Preliminary economic asset and flow accounts. Dev. S. Afr. 2010, 27, 159–176. [Google Scholar] [CrossRef]
- Sahlén, L.; Stage, J. Environmental fiscal reform in Namibia—A potential approach to reduce poverty? J. Environ. Dev. 2012, 21, 219–243. [Google Scholar] [CrossRef] [Green Version]
- Hassan, R.M.; Mungatana, E. (Eds.) Implementing Environmental Accounts: Case Studies from Eastern and Southern Africa; Springer: Heidelberg, Germany, 2013. [Google Scholar]
- Devarajan, S. Africa’s statistical tragedy. Rev. Income Wealth 2013, 59, S9–S15. [Google Scholar] [CrossRef]
- Jerven, M. Poor Numbers: How We Are Misled by African Development Statistics and What to Do About It; Cornell University Press: Ithaca, NY, USA, 2013. [Google Scholar]
- Ruijs, A.; Vardon, M.; Bass, S.; Ahlroth, S. Natural capital accounting for better policy. Ambio 2019, 48, 714–725. [Google Scholar] [CrossRef]
- CIFOR/Center for International Forestry Research. The Formalization of Artisanal Mining in the Democratic Republic of the Congo and Rwanda: Report; CIFOR: Bogor, Indonesia, 2012. [Google Scholar]
- Kanyangira, J. Managing artisanal and small-scale mining: A lesson learnt by Rwanda Government. In Proceedings of the Unpublished paper presented at the Intergovernmental Forum on Mining, Minerals, Metals and Sustainable Development Annual General Meeting, Geneva, Switzerland, 29–31 October 2013. [Google Scholar]
- Smith, N.M.; Ali, S.; Bofinger, C.; Collins, N. Human health and safety in artisanal and small-scale mining: An integrated approach to risk mitigation. J. Clean. Prod. 2016, 129, 43–52. [Google Scholar] [CrossRef]
- Stage, J.; Uwera, C. Water management and pricing in the urban areas of Rwanda: The case of Kigali city. Water Util. Manag. Int. 2012, 7, 13–17. [Google Scholar]
- Niyonzima, T.; Stage, J.; Uwera, C. The value of access to water: Livestock farming in the Nyagatare District, Rwanda. SpringerPlus 2013, 2, 644. [Google Scholar] [CrossRef] [Green Version]
- Uwera, C. Water demand and financing in Rwanda: An empirical analysis. Ph.D. Thesis, Studies in Environmental Management and Economics 2. Department of Economics, University of Gothenburg, Gothenburg, Sweden, 2013. [Google Scholar]
- Choumert, J.; Stage, J.; Uwera, C. Access to water as a determinant of rental values: A hedonic analysis in Rwanda. J. Hous. Econ. 2014, 26, 48–54. [Google Scholar] [CrossRef]
- Uwera, C.; Stage, J. Water demand by unconnected households in urban districts of Rwanda. Water Econ. Policy 2015, 1, 1. [Google Scholar] [CrossRef]
- Uwera, C.; Stage, J. Individual status quo modelling for a rural water service in Rwanda: Application of a choice experiment. Environ. Dev. Econ. 2016, 21, 490–511. [Google Scholar] [CrossRef]
- Blarel, B.; Hazell, P.; Place, F.; Quiggin, J. The economics of farm fragmentation: Evidence from Ghana and Rwanda. World Bank Econ. Rev. 1992, 6, 233–254. [Google Scholar] [CrossRef]
- Bizoza, A.R.; Havugimana, J.M. Land use consolidation in Rwanda: A case study of Nyanza District, Southern Province. Int. J. Sustain. Land Use Urban Plan. 2013, 1, 64–75. [Google Scholar] [CrossRef]
- Ali, D.A.; Deininger, K.; Goldstein, M. Environmental and gender impacts of land tenure regularization in Africa: Pilot evidence from Rwanda. J. Dev. Econ. 2014, 110, 262–275. [Google Scholar] [CrossRef] [Green Version]
- Ali, D.A.; Deininger, K.; Duponchel, M. Using Administrative Data to Assess the Impact and Sustainability of Rwanda’s Land Tenure Regularization; Policy Research Working Paper 7705; World Bank: Washington, DC, USA, 2016. [Google Scholar]
- Goldstein, J.H.; Caldarone, G.; Duarte, T.K.; Ennaanay, D.; Hannahs, N.; Mendoza, G.; Polasky, S.; Wolny, S.; Daily, G.C. Integrating ecosystem-service tradeoffs into land-use decisions. Proc. Natl. Acad. Sci. USA 2012, 109, 7565–7570. [Google Scholar] [CrossRef] [Green Version]
- Saad, R.; Koellner, T.; Margni, M. Land use impacts on freshwater regulation, erosion regulation, and water purification: A spatial approach for a global scale level. Int. J. Life Cycle Assess. 2013, 18, 1253–1264. [Google Scholar] [CrossRef]
- Castro, A.J.; Verburg, P.H.; Martin-López, B.; Garcia-Llorente, M.; Cabello, J.; Vaughn, C.C.; López, E. Ecosystem service trade-offs from supply to social demand: A landscape-scale spatial analysis. Landsc. Urban Plan. 2014, 132, 102–110. [Google Scholar] [CrossRef]
- Watanabe, M.D.; Ortega, E. Dynamic emergy accounting of water and carbon ecosystem services: A model to simulate the impacts of land-use change. Ecol. Model. 2014, 271, 113–131. [Google Scholar] [CrossRef]
- Banerjee, O.; Bagstad, K.J.; Cicowiez, M.; Dudek, S.; Horridge, M.; Alavalapati, J.R.R.; Masozera, M.; Rukundo, E.; Rutebuka, E. Economic, land use, and ecosystem services impacts of Rwanda’s Green Growth Strategy: An application of the IEEM+ESM platform. Sci. Total Environ. 2020, 729, 138779. [Google Scholar] [CrossRef]
- Vačkářůká, D.; Grammatikopoulou, I. Toward development of ecosystem asset accounts at the national level. Ecosyst. Health Sustain. 2019, 5, 36–46. [Google Scholar]
- Weber, J.L. Implementation of land and ecosystem accounts at the European Environment Agency. Ecol. Econ. 2007, 61, 695–707. [Google Scholar] [CrossRef]
- La Notte, A.; Maes, J.; Dalmazzone, S.; Crossman, N.D.; Grizzetti, B.; Bidoglio, G. Physical and monetary ecosystem service accounts for Europe: A case study for in-stream nitrogen retention. Ecosyst. Serv. 2017, 23, 18–29. [Google Scholar] [CrossRef]
- Clay, D.; Lewis, L.A. Land use, soil loss, and sustainable agriculture in Rwanda. Hum. Ecol. 1990, 18, 147–161. [Google Scholar] [CrossRef] [Green Version]
- Chaplin-Kramer, R.; Hamel, P.; Sharp, R.; Kowal, V.; Wolny, S.; Sim, S.; Mueller, C. Landscape configuration is the primary driver of impacts on water quality associated with agricultural expansion. Environ. Res. Lett. 2016, 11, 074012. [Google Scholar] [CrossRef]
- Bagstad, K.J.; Ingram, J.C.; Lange, G.-M.; Masozera, M.; Ancona, Z.H.; Bana, M.; Kagabo, D.; Musana, B.; Nabahungu, N.L.; Rukundo, E.; et al. Towards ecosystem accounts for Rwanda: Tracking 25 years of change in flows and potential supply of ecosystem services. People Nat. 2020, 2, 163–188. [Google Scholar] [CrossRef]
- Driver, A.; Nel, J.L.; Smith, J.; Daniels, F.; Poole, C.J.; Jewitt, D.; Escott, B.J. Land and ecosystem accounting in KwaZulu-Natal, South Africa. In Discussion Document for Advancing SEEA Experimental Ecosystem Accounting Project, October 2015; South African National Biodiversity Institute: Pretoria, South Africa, 2015. [Google Scholar]
- Robinson, D.A.; Panagos, P.; Borrelli, P.; Jones, A.; Montanarella, L.; Tye, A.; Obst, C.G. Soil natural capital in Europe; a framework for state and change assessment. Sci. Rep. 2017, 7, 6706. [Google Scholar] [CrossRef] [Green Version]
- Mellino, S.; Buonocore, E.; Ulgiati, S. The worth of land use: A GIS-emergy evaluation of natural and human capital. Sci. Total Environ. 2015, 506, 137–148. [Google Scholar] [CrossRef]
- Chaikumbing, M.; Doucouliagos, H.; Scarborough, H. The economic value of wetlands in developing countries: A meta-regression analysis. Ecol. Econ. 2016, 124, 164–174. [Google Scholar] [CrossRef]
- Turner, K.; Badura, T.; Ferrini, S. Natural capital accounting perspectives: A pragmatic way forward. Ecosyst. Health Sustain. 2019, 5, 237–241. [Google Scholar] [CrossRef]
- Dumnov, A.; Kharitonova, A. Formation of SEEA Land and Soil Accounts at Regional Level. Published in Russian in Ekonomika Sel’skogo Khoziaistva Rossii 5. An English Translation. Available online: https://ssrn.com/abstract=2781847 (accessed on 18 June 2020).
- Grafius, D.R.; Corstanje, R.; Warren, P.H.; Evans, K.L.; Hancock, S.; Harris, J.A. The impact of land use/land cover scale on modelling urban ecosystem services. Landsc. Ecol. 2016, 31, 1509–1522. [Google Scholar] [CrossRef] [Green Version]
- Alfsen, K.H.; Greaker, M. From natural resources and environmental accounting to construction of indicators for sustainable development. Ecol. Econ. 2007, 61, 600–610. [Google Scholar] [CrossRef] [Green Version]
- UN/United Nations. The Sustainable Development Goals Report; United Nations: New York, NY, USA, 2018; Available online: https://unstats.un.org/sdgs/report/2018 (accessed on 18 June 2020).
- Robinson, D.A.; Fraser, I.; Dominati, E.J.; Daviðsdóttir, B.; Jónsson, J.O.G.; Jones, L.; Jones, S.B.; Tuller, M.; Lebron, I.; Bristow, K.L.; et al. On the value of soil resources in the context of natural capital and ecosystem service delivery. Soil Soc. Am. J. 2014, 78, 685–700. [Google Scholar] [CrossRef] [Green Version]
Figure 1.
Comparison of provincial land use, 2015 (ha).

Figure 2.
Share of national and provincial land use, 2015 (%).

Figure 3.
Net change in land use, 2014–2015 (ha).
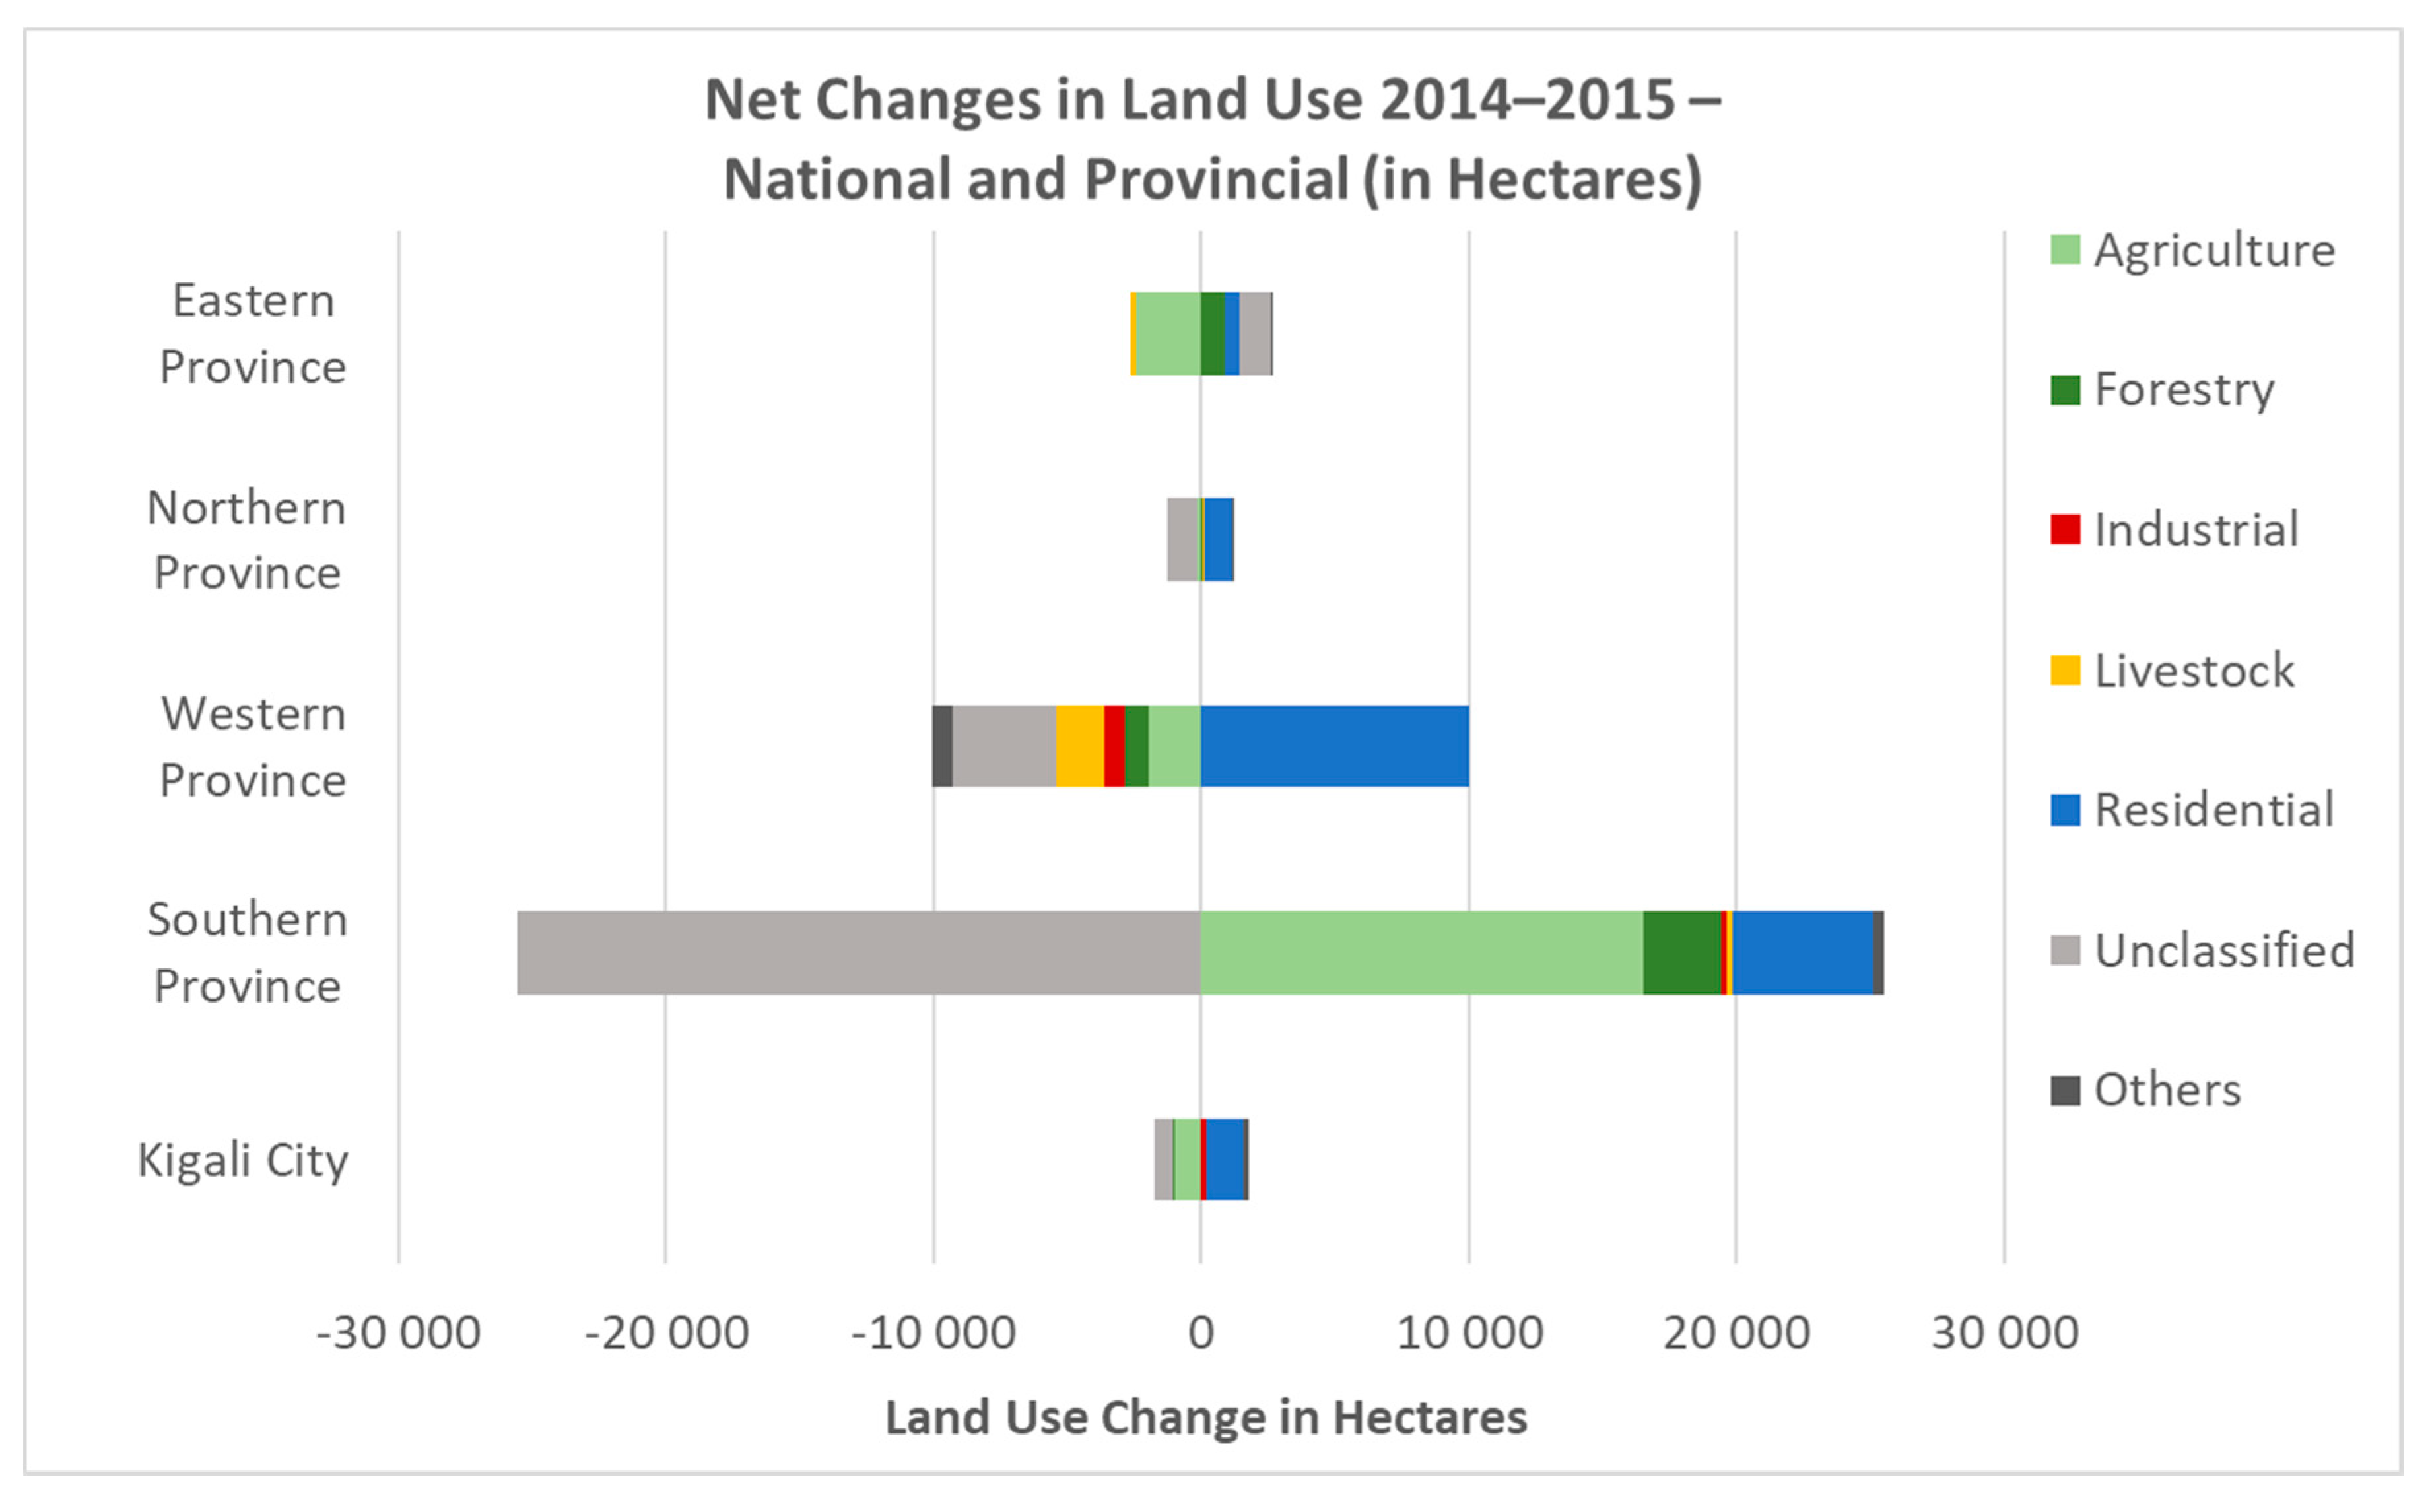
Figure 4.
Land cover, 2010, compared with administrative land use classifications, 2015.

Figure 5.
Comparison of national land cover, 1990–2010 (ha).

Figure 6.
Provincial land cover, 1990–2010 (ha).
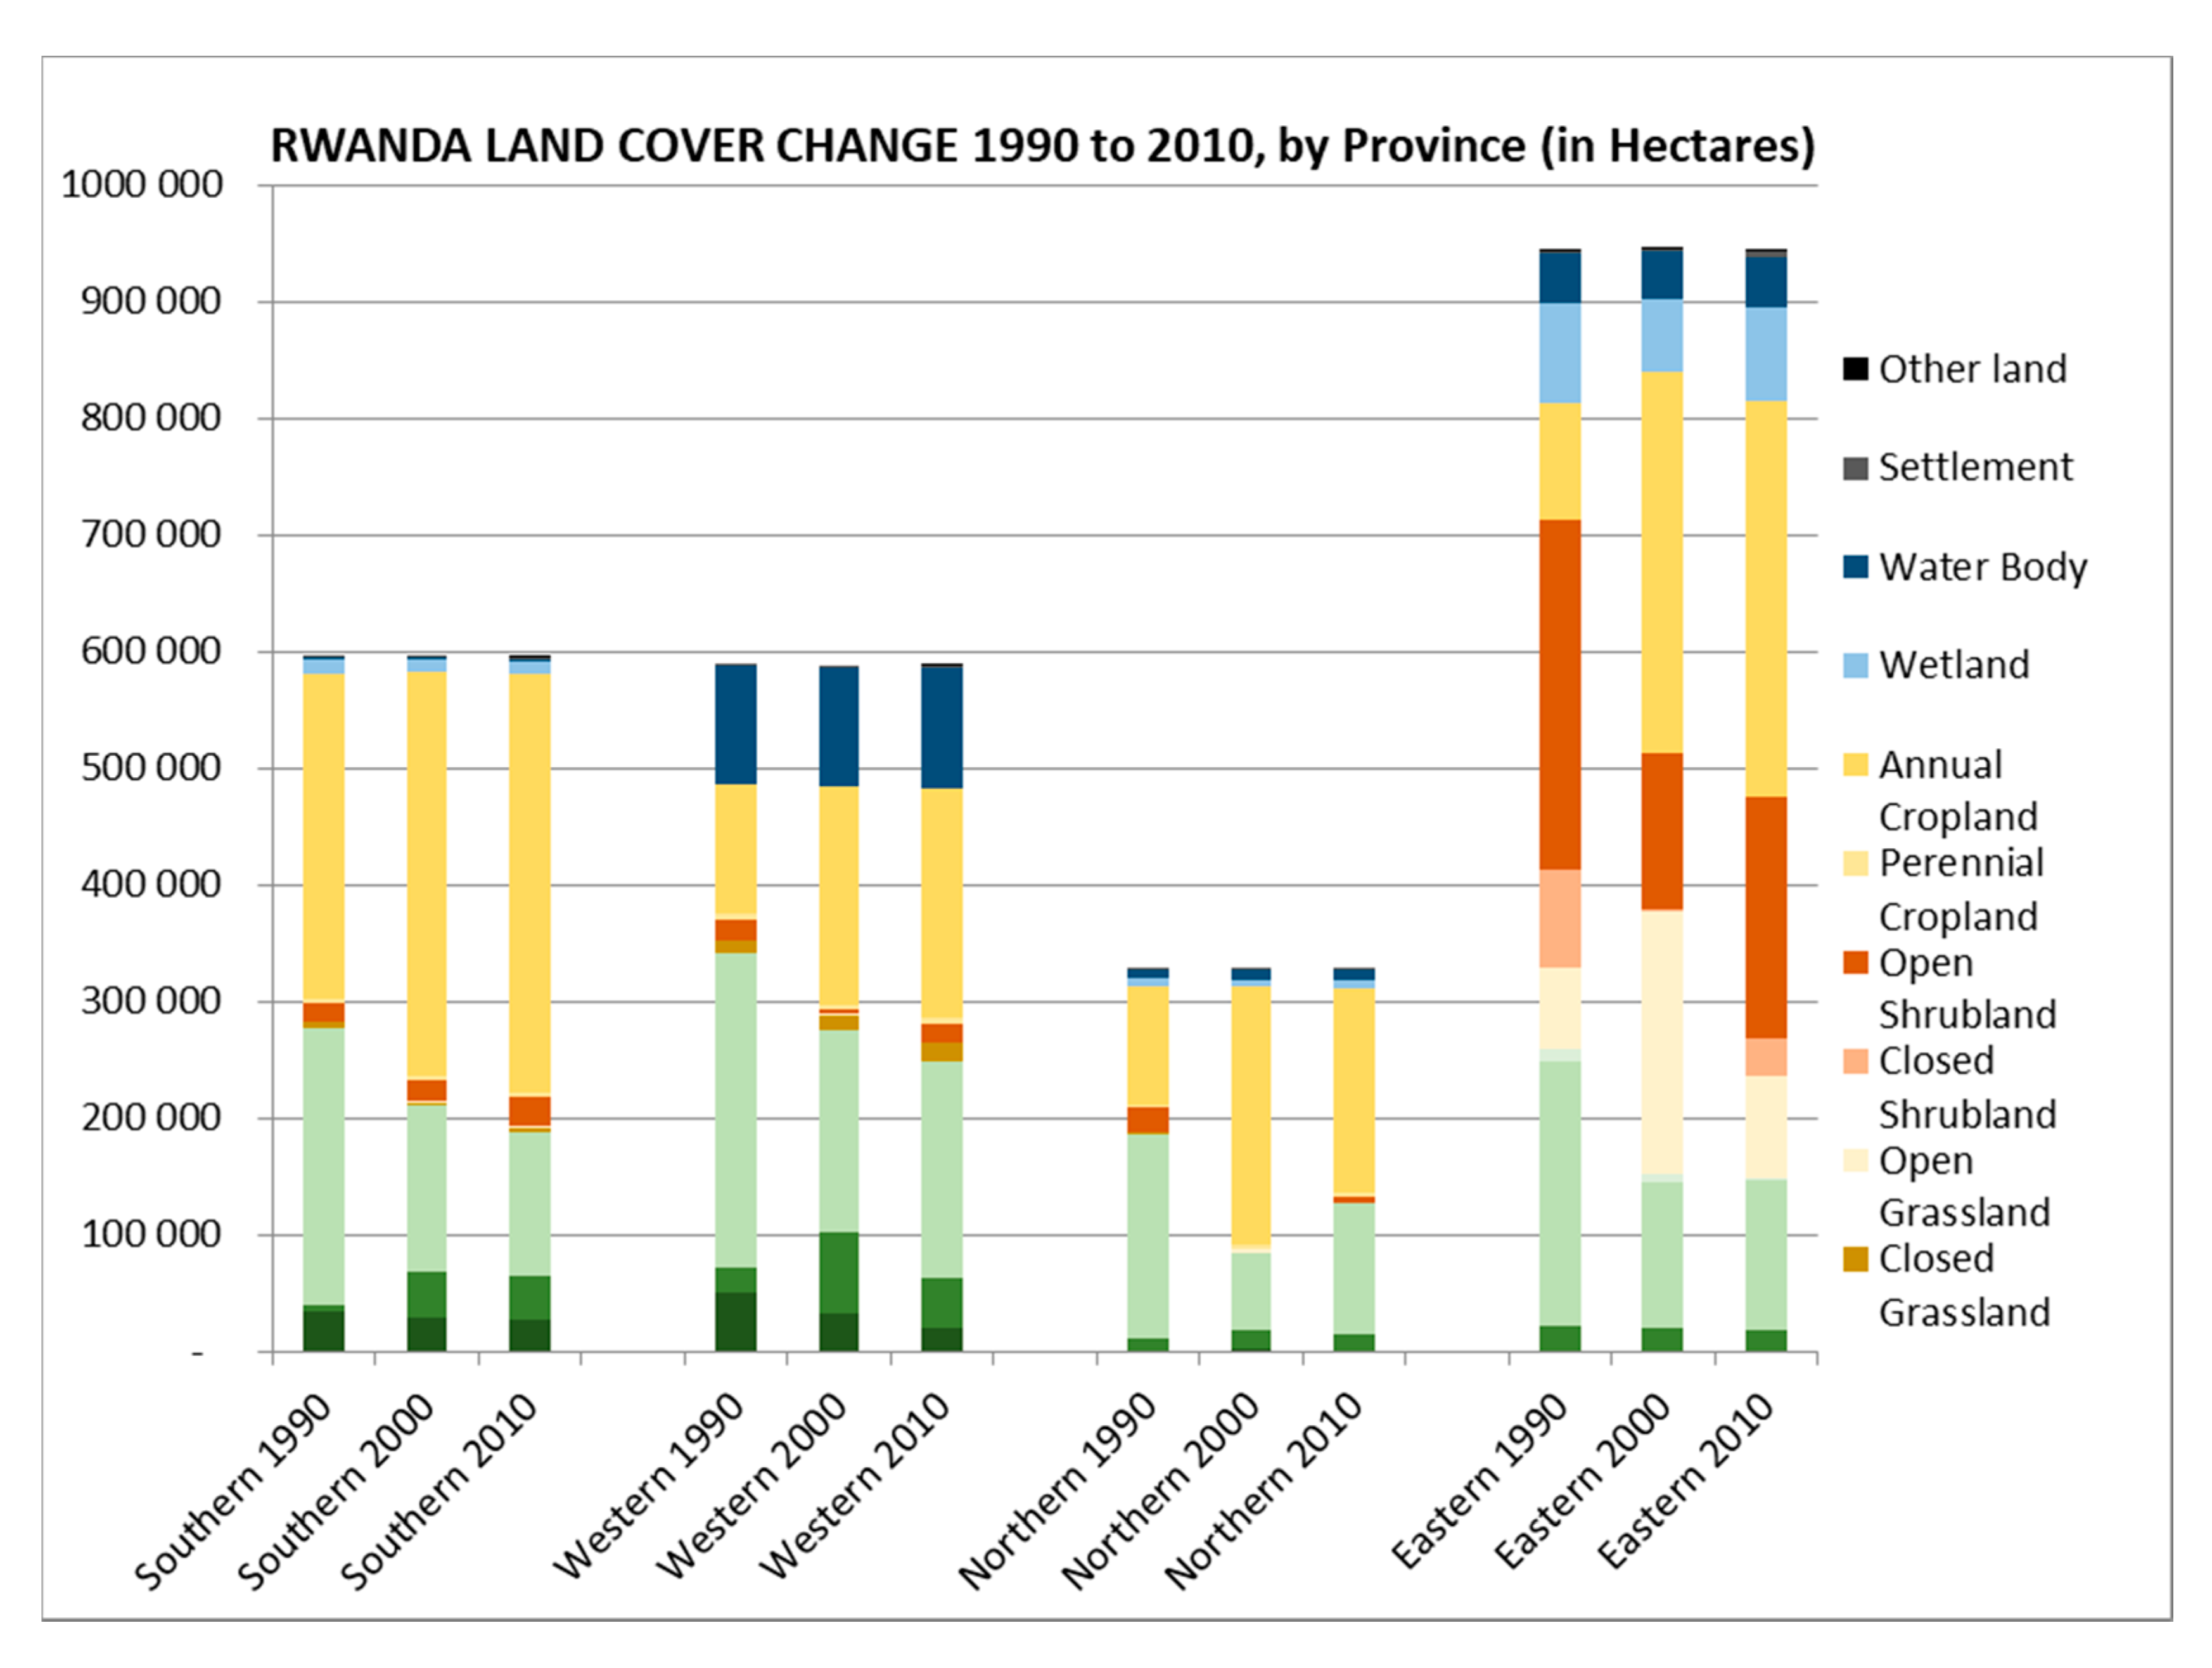
Figure 7.
Shares of provincial land cover, 1990–2010 (%).

Figure 8.
Frequency distribution of parcel transaction value per hectare, 2014 (RWF/ha).
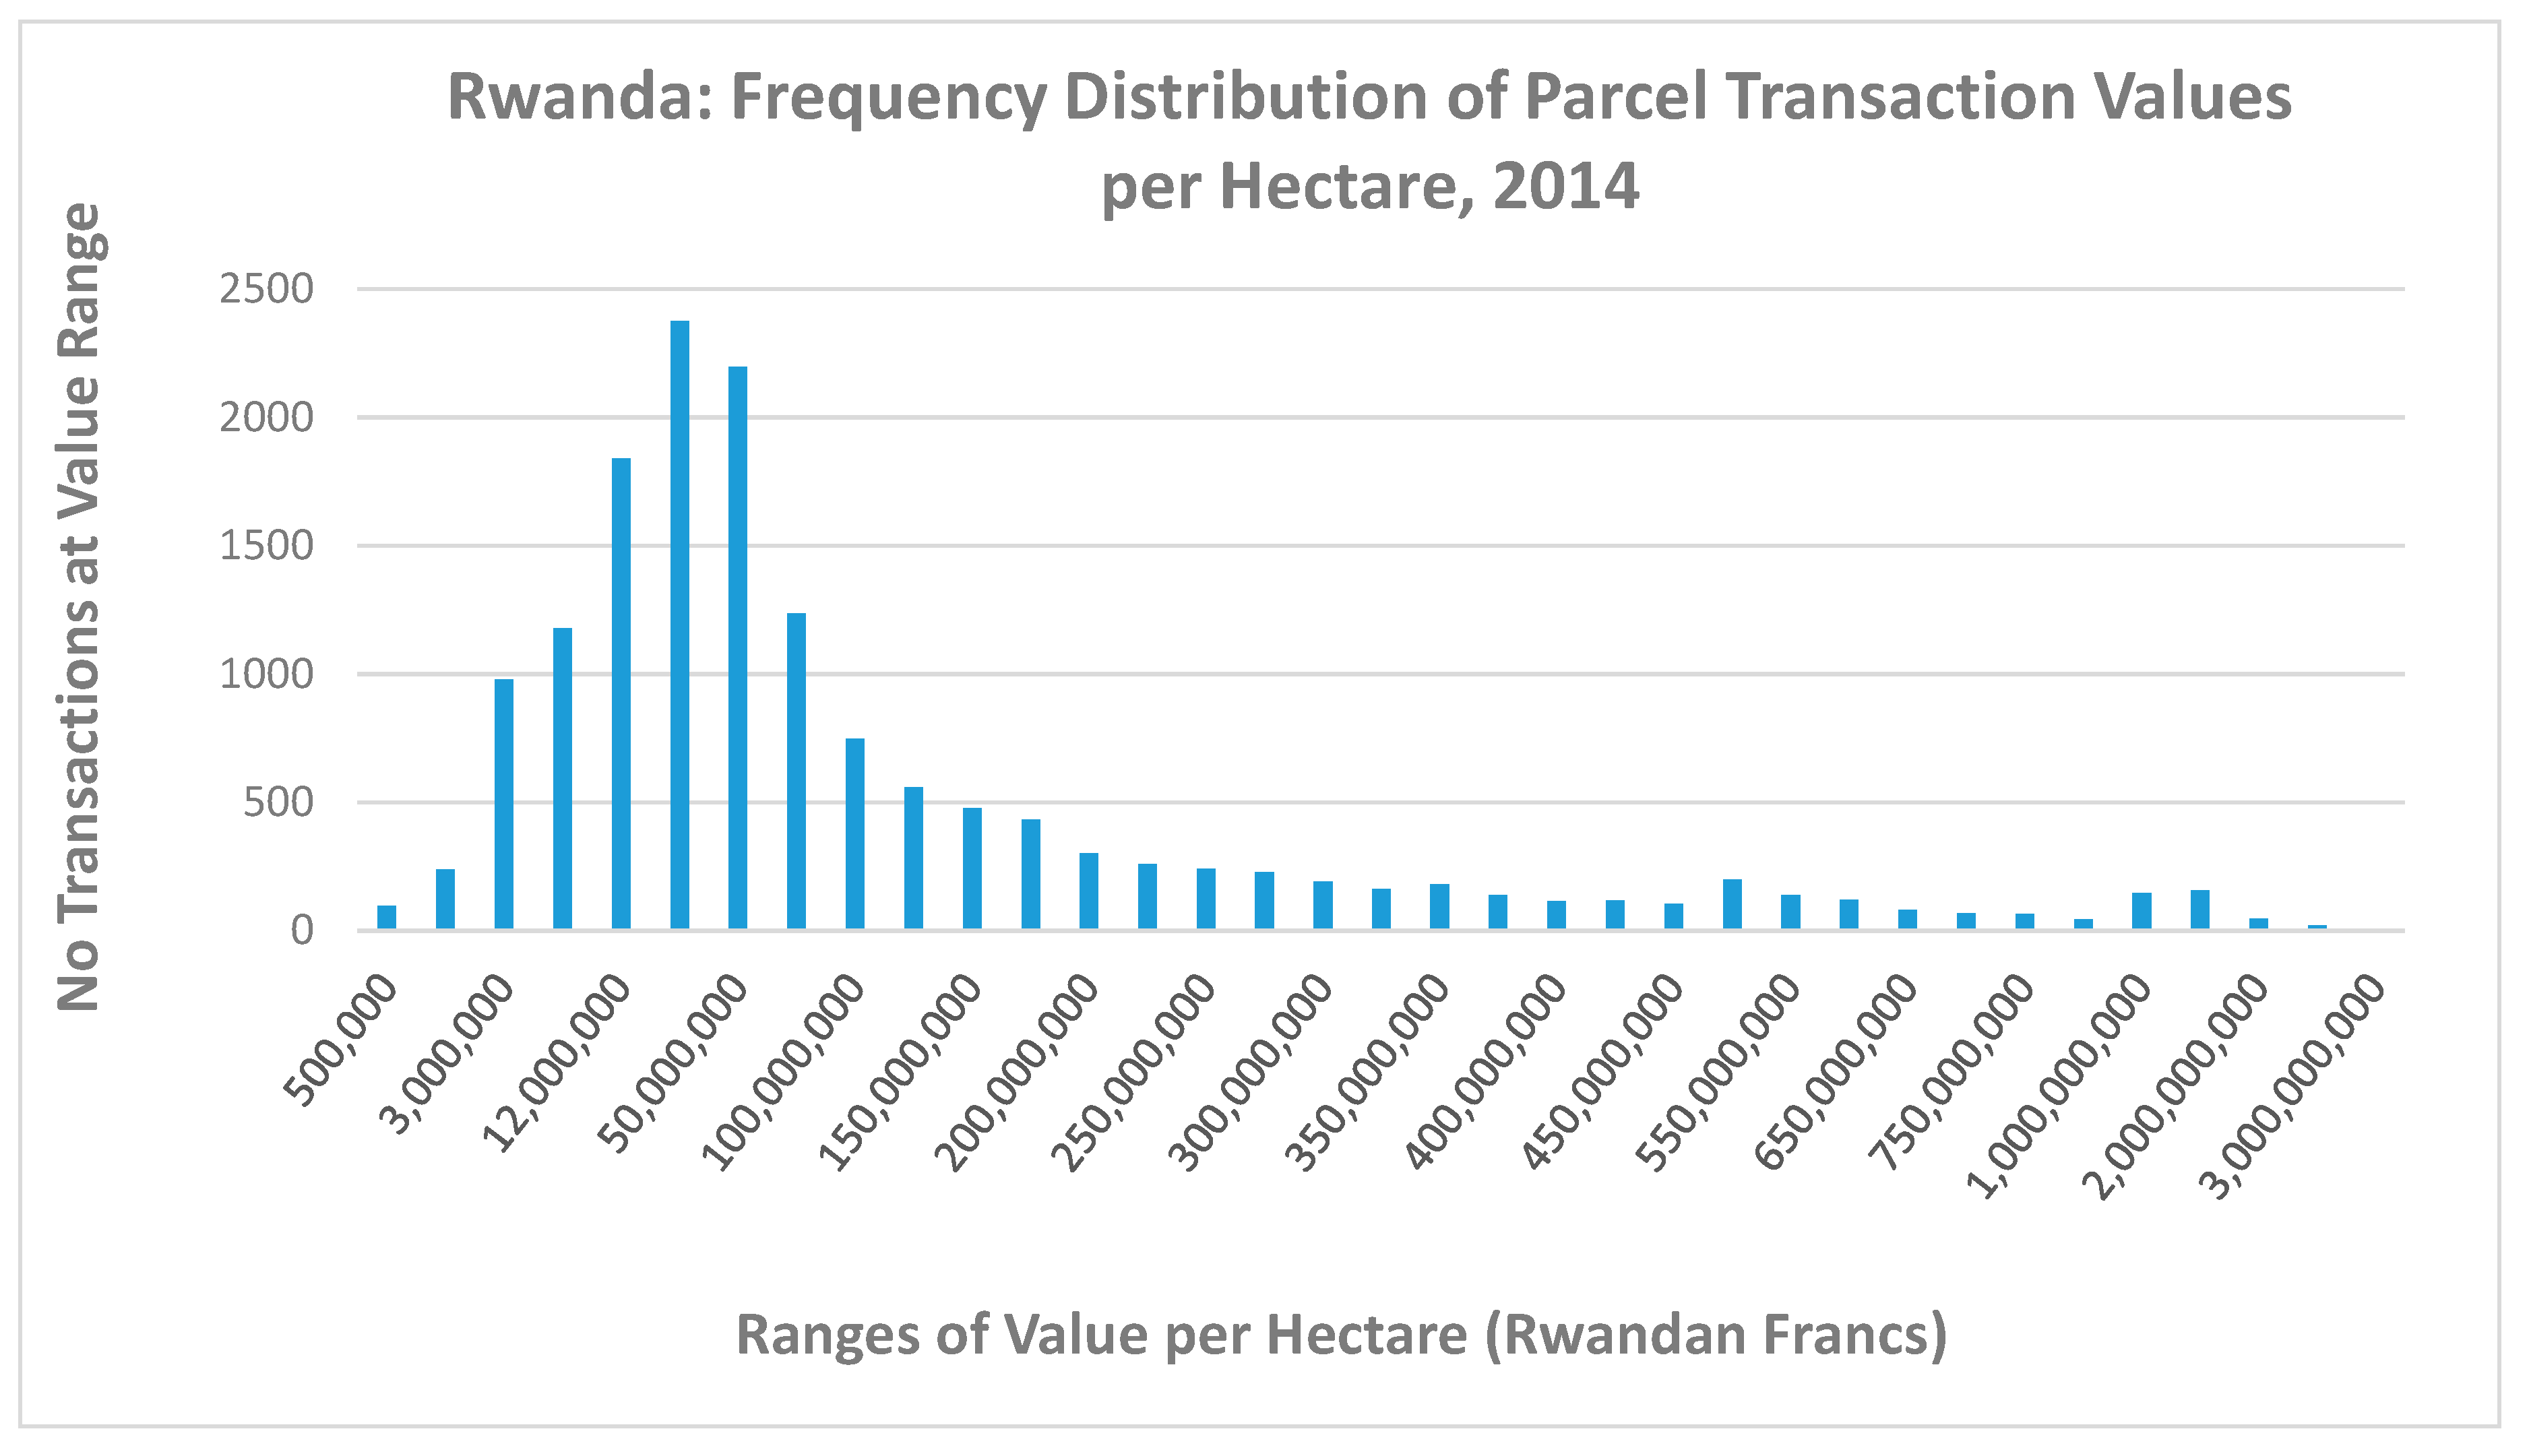
Figure 9.
Changes in the average land price when outliers are omitted.

Table 1.
Share of land use, 2015 (%).
| Land Administration Information System (LAIS) Land Use Categories | Share of Total Land Use (%) |
|---|---|
| Agriculture | 60.6 |
| Forestry | 9.3 |
| Industrial | 0.2 |
| Livestock | 5.7 |
| Residential | 8.5 |
| Unclassified | 13.5 |
| Other use * | 2.2 |
* Combines the use categories Administrative, Commercial, Economic, Fishing, Research/Scientific, Social and Culture, and Tourism.
Table 2.
Matrix of net change in land use, 2014—national level (ha).
| Land Use | Opening Stock, 2014 | Administrative | Agriculture | Commercial | Economic | Fishing | Forestry | Industrial | Livestock | Research/Scientific | Residential | Social and Culture | Tourism | Unclassified | Closing Stock, 2014 | Total Loss | Total Gain | Net Change |
|---|---|---|---|---|---|---|---|---|---|---|---|---|---|---|---|---|---|---|
| Administrative | 6713.88 | 0.02 | 14.93 | 0.77 | 1.51 | 6908.08 | 17.24 | 211.44 | 194.20 | |||||||||
| Agriculture | 1,242,362.94 | 29.37 | 1.85 | 1250.62 | 25.05 | 133.84 | 13.11 | 1362.22 | 31.73 | 1.80 | 1,251,180.76 | 2849.58 | 11,667.40 | 8817.82 | ||||
| Commercial | 8311.50 | 31.71 | 0.02 | 3.94 | 5.47 | 19.49 | 8.87 | 8340.42 | 69.51 | 98.43 | 28.92 | |||||||
| Economic | 10,754.16 | 0.06 | 151.97 | 1.57 | 0.90 | 3.54 | 10.77 | 0.48 | 10,615.16 | 169.29 | 30.29 | −139.00 | ||||||
| Fishing | 121.24 | 2.07 | 119.16 | 2.07 | 0.00 | −2.07 | ||||||||||||
| Forestry | 190,611.82 | 3.99 | 2.63 | 1.79 | 5.48 | 26.70 | 52.41 | 7.77 | 193,405.64 | 100.77 | 2894.59 | 2793.82 | ||||||
| Industrial | 3490.43 | 520.56 | 5.14 | 3370.23 | 525.70 | 405.50 | −120.20 | |||||||||||
| Livestock | 120,444.78 | 30.23 | 9.95 | 0.21 | 5.44 | 30.24 | 2050.25 | 118,582.65 | 2126.33 | 264.20 | −1862.13 | |||||||
| Research/Scientific | 10,689.80 | 11.22 | 89.21 | 0.26 | 1.48 | 2.36 | 2.46 | 207.42 | 10,412.55 | 314.41 | 37.16 | −277.24 | ||||||
| Residential | 157,741.69 | 3.71 | 179.69 | 12.49 | 0.38 | 7.46 | 3.95 | 103.66 | 3.45 | 45.09 | 8.31 | 159,816.74 | 368.20 | 2443.25 | 2075.05 | |||
| Social and Culture | 8190.75 | 0.08 | 1.94 | 1.74 | 1.77 | 20.61 | 12.03 | 8360.58 | 38.17 | 208.00 | 169.83 | |||||||
| Tourism | 852.46 | 0.64 | 0.13 | 0.56 | 1.80 | 926.60 | 3.13 | 77.26 | 74.14 | |||||||||
| Unclassified | 309,262.12 | 196.38 | 10,657.45 | 40.39 | 26.24 | 1614.05 | 359.21 | 954.50 | 98.00 | 66.67 | 297,508.99 | 14,012.88 | 2259.75 | −11,753.13 | ||||
| Total Land Use (Demarcated) | 2,069,547.58 | 211.44 | 11,667.40 | 98.43 | 30.29 | - | 2894.59 | 405.50 | 264.20 | 37.16 | 2443.25 | 208.00 | 77.26 | 2259.75 | 2,069,547.58 | 20,597.27 | 20,597.27 | 0.00 |
Table 3.
Matrix of net change in land use, 2015—National level (ha).
| Land Use | Opening Stock, 2015 | Administrative | Agriculture | Commercial | Economic | Fishing | Forestry | Industrial | Livestock | Research/Scientific | Residential | Social and Culture | Tourism | Unclassified | Closing Stock, 2015 | Total Loss | Total Gain | Net Change |
|---|---|---|---|---|---|---|---|---|---|---|---|---|---|---|---|---|---|---|
| Administrative | 6908.08 | 0.40 | 1.84 | 8.00 | 0.22 | 68.30 | 315.44 | 6519.67 | 394.20 | 5.79 | −388.41 | |||||||
| Agriculture | 1,251,180.76 | 3.80 | 24.33 | 2.03 | 40.90 | 56.49 | 328.44 | 19.34 | 6799.00 | 101.04 | 1.66 | 1,253,304.87 | 7377.03 | 9501.14 | 2124.11 | |||
| Commercial | 8340.42 | 0.60 | 19.87 | 0.26 | 2.74 | 72.98 | 8364.33 | 96.45 | 120.36 | 23.91 | ||||||||
| Economic | 10,615.16 | 78.95 | 1.92 | 2.03 | 44.27 | 0.93 | 10,547.51 | 128.10 | 60.45 | −67.65 | ||||||||
| Fishing | 119.16 | 126.91 | 0.00 | 7.75 | 7.75 | |||||||||||||
| Forestry | 193,405.64 | 16.05 | 2.50 | 0.51 | 26.70 | 4.64 | 838.73 | 7.59 | 2.43 | 193,428.68 | 899.15 | 922.19 | 23.04 | |||||
| Industrial | 3370.23 | 318.98 | 0.45 | 19.64 | 2.08 | 3217.83 | 341.15 | 188.75 | −152.40 | |||||||||
| Livestock | 118,582.65 | 45.30 | 2.74 | 0.13 | 0.44 | 1262.90 | 118,578.73 | 1311.51 | 1307.59 | −3.92 | ||||||||
| Research/Scientific | 10,412.55 | 0.31 | 89.81 | 18.80 | 10,351.01 | 108.92 | 47.38 | −61.54 | ||||||||||
| Residential | 159,816.74 | 0.52 | 220.51 | 18.96 | 23.28 | 4.70 | 46.05 | 13.71 | 132.43 | 1.26 | 176,012.64 | 461.42 | 16,657.32 | 16,195.90 | ||||
| Social and Culture | 8360.58 | 0.11 | 3.43 | 1.92 | 0.15 | 54.72 | 0.37 | 8805.61 | 60.70 | 505.73 | 445.03 | |||||||
| Tourism | 926.60 | 0.76 | 3.32 | 2.65 | 1.45 | 1004.80 | 8.18 | 86.38 | 78.20 | |||||||||
| Unclassified | 297,509.01 | 8797.65 | 65.70 | 58.42 | 7.75 | 852.12 | 123.56 | 906.40 | 9.69 | 7464.62 | 241.19 | 12.36 | 279,284.99 | 18,539.46 | 315.44 | −18,224.02 | ||
| Total Land Use (Demarcated) | 2,069,547.58 | 5.79 | 9501.14 | 120.36 | 60.45 | 7.75 | 922.19 | 188.75 | 1307.59 | 47.38 | 16,657.32 | 505.73 | 86.38 | 315.44 | 2,069,547.58 | 29,726.27 | 29,726.27 | 0.00 |
Table 4.
Comparison of national land cover, 1990–2010 (ha).
| Dense Forest | Moderate Forest | Sparse Forest | Wood-land | Closed Grassland | Open Grassland | Closed Shrubland | Open Shrubland | Perennial Cropland | Annual Cropland | Wetland | Water Body | Settle-ment | Other-land | Grand Total | |
|---|---|---|---|---|---|---|---|---|---|---|---|---|---|---|---|
| National 1990 | 84,063 | 62,730 | 940,491 | 9888 | 16,850 | 70,935 | 83,196 | 361,905 | 10,679 | 612,391 | 109,334 | 153,317 | 11,606 | 3549 | 2,530,934 |
| National 2000 | 63,005 | 148,701 | 534,047 | 7941 | 15,808 | 232,678 | 1894 | 153,996 | 11,019 | 1,112,865 | 80,600 | 153,375 | 13,812 | 1191 | 2,530,934 |
| National 2010 | 48,237 | 114,472 | 574,757 | 470 | 20,883 | 87,781 | 34,306 | 255,054 | 10,978 | 1,103,399 | 102,234 | 154,960 | 20,898 | 2508 | 2,530,938 |
Table 5.
Provincial land cover, 1990–2010 (ha).
| Province Name | Dense Forest | Moderate Forest | Sparse Forest | Wood-land | Closed Grass-land | Open Grass-land | Closed Shrub-land | Open Shrub-land | Perennial Cropland | Annual Cropland | Wetland | Water Body | Settle-ment | Other Land |
|---|---|---|---|---|---|---|---|---|---|---|---|---|---|---|
| City of Kigali 1990 | 1012 | 31,835 | 1 | 30 | 5 | 7511 | 19,207 | 4481 | 776 | 8126 | ||||
| City of Kigali 2000 | 10 | 2650 | 28,886 | 106 | 998 | 24 | 29,063 | 2385 | 569 | 8295 | ||||
| City of Kigali 2010 | 1930 | 23,893 | 6 | 1 | 16 | 267 | 2335 | 31,819 | 3460 | 551 | 8709 | |||
| Southern 1990 | 33,617 | 6275 | 236,614 | 6798 | 18 | 15,391 | 2798 | 279,918 | 12,651 | 1212 | 984 | |||
| Southern 2000 | 28,346 | 40,206 | 142,308 | 65 | 2630 | 1932 | 17,514 | 3049 | 347,010 | 10,292 | 1465 | 1460 | ||
| Southern 2010 | 27,688 | 37,281 | 123,724 | 3577 | 652 | 488 | 25,281 | 3039 | 359,386 | 11,264 | 730 | 2815 | 353 | |
| Western 1990 | 50,446 | 22,138 | 269,812 | 9689 | 2 | 105 | 18,025 | 4716 | 110,643 | 166 | 101,701 | 590 | ||
| Western 2000 | 32,910 | 68,536 | 173,284 | 13,178 | 1693 | 3048 | 4754 | 186,857 | 114 | 102,598 | 1062 | |||
| Western 2010 | 20,409 | 42,013 | 185,900 | 16,144 | 298 | 128 | 15,812 | 4723 | 196,809 | 36 | 103,629 | 1996 | 137 | |
| Northern 1990 | 11,390 | 175,297 | 355 | 2 | 40 | 21,427 | 3166 | 101,457 | 6237 | 7973 | 184 | |||
| Northern 2000 | 1645 | 16,776 | 65,257 | 14 | 3633 | 104 | 3216 | 221,573 | 6168 | 8380 | 762 | |||
| Northern 2010 | 134 | 15,008 | 111,996 | 311 | 290 | 4866 | 3216 | 176,179 | 6196 | 8374 | 959 | |||
| Eastern 1990 | 21,913 | 226,933 | 9888 | 7 | 70,901 | 83,027 | 299,549 | 101,166 | 85,798 | 41,654 | 1722 | 3549 | ||
| Eastern 2000 | 92 | 20,534 | 124,312 | 7757 | 224,422 | 1894 | 133,306 | 328,362 | 61,641 | 40,363 | 2234 | 1191 | ||
| Eastern 2010 | 7 | 18,240 | 129,245 | 464 | 1161 | 86,503 | 33,133 | 206,760 | 339,206 | 81,278 | 41,677 | 6418 | 2018 |
Table 6.
Summary of Land Administration Information System (LAIS) data on parcel transactions, 2014.
Table 6.
Summary of Land Administration Information System (LAIS) data on parcel transactions, 2014.
| LOCATION | No of Parcels Transacted | % of Total | Total Area of Transactions (Ha) | % of Total | Total Area of Transactions (M Rwf) | % of Total | Province Average Transaction Size (Ha) | Province Average Value/Ha (M Rwf) |
|---|---|---|---|---|---|---|---|---|
| KIGALI CITY | 6964 | 45% | 677 | 17% | 87,962 | 62% | 0.10 | 130 |
| SOUTHERN | 2200 | 14% | 446 | 11% | 6508 | 5% | 0.20 | 15 |
| WESTERN | 1549 | 10% | 259 | 6% | 8047 | 6% | 0.17 | 31 |
| NORTHERN | 1857 | 12% | 216 | 5% | 4361 | 3% | 0.12 | 20 |
| EASTERN | 2950 | 19% | 2421 | 60% | 34,948 | 25% | 0.82 | 14 |
| RWANDA | 15,520 | 4020 | 141,825 | 0.26 | 35 |
Table 7.
LAIS statistical measures for parcel transactions, 2014.
| LOCATION | Parcel Ave Value/Ha (M RwF) | Min Parcel Value/Ha (M RwF) | Max Parcel Value/Ha (M RwF) | Std Deviation of Parcel Value/Ha |
|---|---|---|---|---|
| KIGALI CITY | 214 | 0.10 | 33,916 | 643 |
| SOUTHERN | 47 | 0.12 | 3449 | 130 |
| WESTERN | 99 | 0.13 | 34,476 | 897 |
| NORTHERN | 48 | 0.14 | 2070 | 117 |
| EASTERN | 123 | 0.02 | 33,625 | 799 |
| RWANDA | 142 | 0.02 | 34,476 | 629 |
Table 8.
Summary of number, area, and value of parcel transactions by Province after removal of outliers, 2014.
Table 8.
Summary of number, area, and value of parcel transactions by Province after removal of outliers, 2014.
| Location | Number of Parcel Transactions | Total Area of Transactions (ha) | Average Value of Parcel Transactions (Million RWF/ha) |
|---|---|---|---|
| Rwanda (total) | 15,184 | 3890 | 32.9 |
| Kigali City | 6839 | 639 | 125.0 |
| Southern Province | 2157 | 430 | 13.6 |
| Western Province | 1505 | 253 | 26.6 |
| Northern Province | 1845 | 214 | 19.6 |
| Eastern Province | 2838 | 2353 | 13.3 |
Notes: 1% of outliers were omitted from each end of the distribution as a way of dealing with possible data entry errors that may account for the high variance in the LAIS data. The omission of outliers explains the small differences between these data and the descriptive summary data in Section 5.1.
Table 9.
Summary of number, area, and value of parcel transactions by District after removal of outliers, 2014.
Table 9.
Summary of number, area, and value of parcel transactions by District after removal of outliers, 2014.
| Location | Number of Parcel Transactions | Total Area of Transactions (ha) | Average Value of Parcel Transactions (Million RWF/ha) |
|---|---|---|---|
| KIGALI CITY | |||
| 1.1 Gasabo (urban) | 2887 | 286 | 144.1 |
| 1.2 Kicukiro (urban) | 3146 | 300 | 98.8 |
| 1.3 Nyarugenge (urban) | 806 | 53 | 170.6 |
| SOUTHERN PROVINCE | |||
| 2.1 Gisagara (rural) | 64 | 34 | 2.3 |
| 2.2 Huye (urban) | 281 | 29 | 41.0 |
| 2.3 Kamonyi (rural) | 683 | 82 | 26.7 |
| 2.4 Muhanga (urban) | 268 | 25 | 46.4 |
| 2.5 Nyamagabe (rural) | 396 | 130 | 3.2 |
| 2.6 Nyanza (rural) | 180 | 29 | 11.0 |
| 2.7 Nyaruguru (rural) | 91 | 65 | 1.9 |
| 2.8 Ruhango (rural) | 194 | 36 | 9.8 |
| WESTERN PROVINCE | |||
| 3.1 Karongi (rural) | 108 | 30 | 11.7 |
| 3.2 Ngororero (rural) | 60 | 8 | 11.0 |
| 3.3 Nyabihu (rural) | 181 | 26 | 8.4 |
| 3.4 Nyamasheke (rural) | 128 | 59 | 8.1 |
| 3.5 Rubavu (urban) | 642 | 57 | 72.4 |
| 3.6 Rusizi (urban) | 250 | 29 | 46.2 |
| 3.7 Rutsiro (rural) | 136 | 45 | 2.9 |
| NORTHERN PROVINCE | |||
| 4.1 Burera (rural) | 284 | 31 | 14.2 |
| 4.2 Gakenke (rural) | 48 | 10 | 5.3 |
| 4.3 Gicumbi (rural) | 197 | 45 | 9.0 |
| 4.4 Musanze (urban) | 1,203 | 110 | 27.9 |
| 4.5 Rulindo (rural) | 113 | 19 | 12.7 |
| EASTERN PROVINCE | |||
| 5.1 Bugesera (rural) | 840 | 332 | 78.4 |
| 5.2 Gatsibo (rural) | 108 | 96 | 2.4 |
| 5.3 Kayonza (rural) | 352 | 587 | 1.3 |
| 5.4 Kirehe (rural) | 119 | 64 | 3.1 |
| 5.5 Ngoma (rural) | 144 | 37 | 7.8 |
| 5.6 Nyagatare (urban) | 432 | 1,025 | 1.3 |
| 5.7 Rwamagana (rural) | 843 | 213 | 11.2 |
Notes: 1% of outliers were omitted from each end of the distribution as a way of dealing with possible data entry errors that may account for the high variance in the LAIS data.
Table 10.
Summary of extent and value of parcel transactions by LAIS land use, 2014.
| LAIS Land Use | Total Area Transacted (ha) | Average Value of Parcels (Million RWF/ha) | Total Value Transacted (Million RWF) | Number of Transactions |
|---|---|---|---|---|
| Agriculture | 1439 | 18.3 | 26,302 | 5812 |
| Commercial | 52 | 137.4 | 7151 | 207 |
| Economic | 5 | 11.3 | 56 | 33 |
| Fishing | 0 | 9.7 | 0 | 1 |
| Forestry | 263 | 3.6 | 958 | 691 |
| Industrial | 7 | 57.3 | 392 | 37 |
| Livestock | 1347 | 0.9 | 1172 | 178 |
| Residential | 769 | 119.0 | 91,516 | 8202 |
| Social and Culture | 8 | 36.3 | 280 | 20 |
| Tourism | 0 | 5.1 | 2 | 3 |
| TOTAL | 3890 | 32.9 | 127,831 | 15,184 |
Table 11.
National and provincial average parcel size (ha), 2014–2015.
| Location | 2014 | 2015 | ||||
|---|---|---|---|---|---|---|
| Number of Parcels | Area (ha) | Average Parcel Size (ha) | Number of Parcels | Area (ha) | Average Parcel Size (ha) | |
| Rwanda (total) | 11,121,853 | 2,045,643 | 0.184 | 11,420,044 | 2,066,577 | 0.181 |
| Kigali City | 382,666 | 68,659 | 0.179 | 390,368 | 69,707 | 0.179 |
| Southern Province | 2,957,960 | 506,693 | 0.171 | 3,217,749 | 536,529 | 0.167 |
| Western Province | 3,163,374 | 400,037 | 0.126 | 3,157,138 | 400,783 | 0.127 |
| Northern Province | 2,633,155 | 302,205 | 0.115 | 2,668,170 | 302,260 | 0.113 |
| Eastern Province | 1,984,698 | 768,048 | 0.387 | 1,986,619 | 757,298 | 0.381 |
© 2020 by the authors. Licensee MDPI, Basel, Switzerland. This article is an open access article distributed under the terms and conditions of the Creative Commons Attribution (CC BY) license (http://creativecommons.org/licenses/by/4.0/).
Share and Cite
MDPI and ACS Style
Nishimwe, G.; Rugema, D.M.; Uwera, C.; Graveland, C.; Stage, J.; Munyawera, S.; Ngabirame, G. Natural Capital Accounting for Land in Rwanda. Sustainability 2020, 12, 5070. https://doi.org/10.3390/su12125070
AMA Style
Nishimwe G, Rugema DM, Uwera C, Graveland C, Stage J, Munyawera S, Ngabirame G. Natural Capital Accounting for Land in Rwanda. Sustainability. 2020; 12(12):5070. https://doi.org/10.3390/su12125070
Chicago/Turabian StyleNishimwe, Grace, Didier Milindi Rugema, Claudine Uwera, Cor Graveland, Jesper Stage, Swaib Munyawera, and Gabriel Ngabirame. 2020. "Natural Capital Accounting for Land in Rwanda" Sustainability 12, no. 12: 5070. https://doi.org/10.3390/su12125070
Note that from the first issue of 2016, this journal uses article numbers instead of page numbers. See further details here.